Abstract
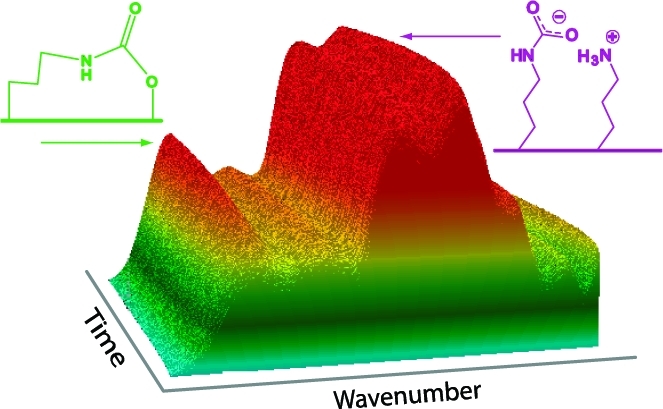
We studied equilibrium adsorption and uptake kinetics and identified molecular species that formed during sorption of carbon dioxide on amine-modified silica. Bicontinuous silicas (AMS-6 and MCM-48) were postsynthetically modified with (3-aminopropyl)triethoxysilane or (3-aminopropyl)methyldiethoxysilane, and amine-modified AMS-6 adsorbed more CO2 than did amine-modified MCM-48. By in situ FTIR spectroscopy, we showed that the amine groups reacted with CO2 and formed ammonium carbamate ion pairs as well as carbamic acids under both dry and moist conditions. The carbamic acid was stabilized by hydrogen bonds, and ammonium carbamate ion pairs formed preferably on sorbents with high densities of amine groups. Under dry conditions, silylpropylcarbamate formed, slowly, by condensing carbamic acid and silanol groups. The ratio of ammonium carbamate ion pairs to silylpropylcarbamate was higher for samples with high amine contents than samples with low amine contents. Bicarbonates or carbonates did not form under dry or moist conditions. The uptake of CO2 was enhanced in the presence of water, which was rationalized by the observed release of additional amine groups under these conditions and related formation of ammonium carbamate ion pairs. Distinct evidence for a fourth and irreversibly formed moiety was observed under sorption of CO2 under dry conditions. Significant amounts of physisorbed, linear CO2 were detected at relatively high partial pressures of CO2, such that they could adsorb only after the reactive amine groups were consumed.
Introduction
Recent studies indicate that certain sorbents could reduce the cost of carbon capture very significantly;1,2 Choi et al.(3) and Hedin et al.(4) recently reviewed various aspects of such adsorbents. Sorbents modified with amines have high CO2-over-N2 selectivity and high capacity for adsorption of CO2 at low partial pressures, due to preferential reactions with CO2.3,5−9 A unique feature of sorbents modified with amines is that their capacity and selectivity for CO2 are often enhanced by water vapor.7,10−13
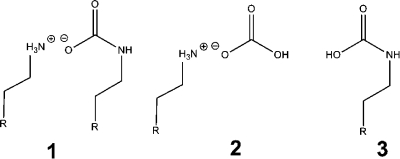
The main aspects of CO2–amine chemistry in the liquid phase are known.14−16 On reaction of CO2 with amines, ammonium carbamates (1), ammonium bicarbonates (2), and carbamic acids (3) form (Scheme 1).17−22 Carbamic acids are often stabilized as dimers or oligomers.(23) Masuda et al.(21) observed that carbamic acids formed when CO2 reacted with naphthylalkylamines in protophilic solvents; however, in protophobic solvents ammonium carbamate ion pairs formed, and in propanol/water HCO3– formed.
Scheme 1. Alkylammonium Alkylcarbamate (1), Alkylammonium Bicarbonate (2), and Alkylcarbamic Acid (3).
For amines supported, or tethered, on solids, the detailed CO2–amine chemistry is under investigation.3,24−27 Pinto et al.(27) concluded that both carbamic acid and ammonium carbamate ion pairs formed on amines tethered on silica by using solid-state 13C NMR spectroscopic data and their related temperature dependencies; however, Fourier transform infrared (FTIR) spectroscopy has so far been the main tool to study this chemistry. Table S1 (Supporting Information) compiles such FTIR-related findings on this chemistry.12,24−26,28−38 Nevertheless, the heterogeneous nature of these amine-modified sorbents and their complex FTIR spectra have resulted in conflicting structural assignments.3,24−26 For example, IR spectra of chemisorbed CO2 on SBA-15 modified with (3-aminopropyl)triethoxysilane (APTES) have been understood very differently.12,26,29 Hiyoshi et al.(12) assigned bands in the IR spectra to propylammonium propylcarbamate (for simplicity we use “ammonium carbamate” hereafter) ion pairs, which formed with CO2 under both dry and moist conditions, and showed that these ion pairs became dominant when the density of amine groups was high enough.(12) For related samples, Chuang and co-workers29,30 assigned bands in similar IR spectra to carbonates and bicarbonates on adsorption of CO2 under both moist and dry conditions, a conclusion that they might have inferred from the presence of bicarbonates from reactions known to occur in aqueous amine solutions.11,29−33,35,36 The presence of bicarbonates was consistent with the enhanced uptake of moist CO2 on amine-modified silica observed by several groups.7,10,13,39,40 Still, the hypothesized doubling of the uptake of CO2 under moist conditions has never been reached (CO2:NH2 = 1 for bicarbonates and CO2:NH2 = 0.5 for ammonium carbamate ion pairs). Danon et al.(26) showed very recently in a systematic study that ammonium carbamate ion pairs and silylpropylcarbamates (so-called surface-bound carbamates) formed on sorption of CO2 on SBA-15 modified with APTES and that their relative fractions depended on both the surface coverage of amine groups and the availability of silanol groups. They could firmly exclude any formation of bicarbonates or carbonates.
In our view, IR spectra of CO2 chemisorbed on silica modified by n-propylamine (mesocaged silica,(25) SBA-15,12,26,29 MCM-48 (ref (36) and this study), AMS-6(41) (this study), and amorphous silica24,35) depend more on the details in the n-propylamine coverage and less on the identity of the underlying silica substrate. In addition to the bands for ammonium carbamate ion pairs, an additional carbonyl band has been detected on CO2 sorption on silica modified by amine groups after being prepared under high-vacuum conditions.24−26 We,(25) and Knöfel et al.,(24) assigned this carbonyl frequency to propylcarbamic acids (for simplicity we use the term “carbamic acid” hereafter) on CO2 adsorption on amine-modified silica and titania.(24) Carbamic acids are not stable thermodynamically in the liquid phase where they dimerize or hydrogen bond.(23) Previously, we discussed if such stabilization occurs for carbamic acids when formed on amines tethered to silica.(25) Danon et al.(26) recently showed that silylpropylcarbamates formed when amine groups were far apart and silanol groups were available and questioned the formation of carbamic acid. For that study, they employed amine-modified silica with different amine densities and different availabilities of OH groups.
By considering changes to the IR spectra recorded on sorption of CO2 on silica with tethered amine groups, we will show aspects of the CO2-sorption chemistry not described so far. We will show that ammonium carbamate ion pairs form on adsorption of CO2 on silica with tethered amine groups under both dry and moist conditions and that bicarbonates or carbonates do not form. By time-resolved spectra we will show that significant amounts of hydrogen-bonded carbamic acid form rapidly on adsorption of CO2, while silylpropylcarbamate (surface-bound carbamate) forms slowly and could be desorbed under moist conditions.
Experimental Section
Substrates and Amine Modification
We used substrates with interconnected structures and a cubic Ia3d symmetry.41−44 MCM-48 was synthesized with cetyltrimethylammonium bromide (0.88 g; Aldrich), water (9.981 g; Millipore), NaOH (1.15 g; Aldrich), and tetraethoxysilane (TEOS; Aldrich, 1.04 g). We used well-established procedures for synthesis, and the substrates were characterized by powder X-ray diffraction and N2 adsorption. For the synthesis of AMS-6,(41)N-lauroyl-l-alanine (C12Ala; Nanologica AB, Sweden) was used as the surfactant, APTES (Aldrich) as a co-structure-directing agent (CSDA), and TEOS as the silica source. In a typical synthesis, a homogeneous solution of C12Ala (0.10 g) in distilled water (20 g) was kept at 80 °C for 24 h under static conditions. The surfactant solution was stirred for 10 min before APTES (0.10 g) addition, and TEOS (0.51 g) was added 3 min after APTES addition. The solution was stirred for another 15 min at 80 °C in a closed bottle. The synthesis gel was subsequently stored at room temperature under stirring for 24 h. The final synthesis mixture was kept sealed and without stirring at 100 °C for 3 days. The final pH of the synthesis mixture was 8.7. The solid product was filtered and dried at room temperature at atmospheric pressure. The molar composition of the reaction mixtures was C12Ala:APTES:TEOS:H2O = 1:1.25: 6.7:309.1. The surfactant extraction method was as follows: 1 g of as-made AMS-6 was refluxed for 6 h in 80 g of ethanol and 20 g of HCl (37%), filtered, washed, and dried in air. The as-synthesized sample was extracted twice to remove all the surfactant. Both samples of AMS-6 and MCM-48 were calcined under static conditions in an oven isothermally at 550 °C under a stream of air for 6 h.
N-Propylamine groups were tethered and condensed to the internal surfaces of the silica. Reactions were carried out under dry nitrogen or argon in toluene obtained from a VAC solvent purifier system. Reagents were used as obtained from commercial suppliers without further purification. (3-Aminopropyl)methyldiethoxysilane (APMDES) was prepared by a method described by Sabourault et al.;(45) APTES was used as obtained from the supplier. An example for functionalization of AMS-6 with APMDES is given below (for MCM-48 and modifications with APTES see the Supporting Information).
AMS-6 was first dried in an oven for 20 h at 150 °C, 300 mg of it was suspended in toluene (18 mL), and the suspension was stirred for 30 min at 50 °C under argon in a closed tube. The tube was opened, and the internal surface of the silica substrate was hydrated by adding water (68 μL, 3.78 mmol) drop by drop. The tube was sealed, and the mixture was heated to 120 °C for 1.5 h. APMDES (1.54 g, 8.03 mmol) was added, and the tube was closed and heated for 72 h at 120 °C. After being cooled to room temperature, the tube was opened, the solid was filtered and washed with toluene (3 × 10 mL), and free residual APMDES was removed by Soxhlet extraction in EtOH. The solid was dried under reduced pressure overnight. Anal. C, 10.32; H, 2.38, N, 2.28.
Elemental Analysis
Elemental analyses of the adsorbents for C, H, and N were performed at the elemental analysis section at Santiago de Compostela University (Spain) using Fisons Instruments 1108.
Brunauer–Emmett–Teller (BET) and Pore Analysis
Nitrogen adsorption–desorption isotherms were recorded at −196 °C using a Micrometrics ASAP2020 volumetric adsorption analyzer. Samples were treated under dynamic vacuum conditions (<10–5 Torr) at a temperature of 130 °C for 5 h. Specific surface areas were calculated, according to the BET method, from the data recorded at P/P0 = 0.05–0.15. The total pore volume was calculated at a relative pressure of P/P0 of 0.988.
Adsorption Measurements
Adsorption and desorption isotherms of pure CO2 were measured using a Micromeritics ASAP2020 device. Volumetric uptake of gas under equilibrium conditions was measured at two different temperatures (0 and 21 °C) from ∼0.1 Torr to atmospheric pressure. A low temperature was set by mixing water and ice in a slurry in the 5 dm3 Dewar. For room temperature experiments, pre-temperature-equilibrated water was used (temperature 21 ± 0.1 °C). A 100–200 mg portion of sample was used. Samples were treated under dynamic vacuum conditions at 130 °C for at least 3 h.
FTIR Spectroscopy
A Varian 670-IR spectrometer equipped with a homemade transmission cell and vacuum system(25) and a mercury cadmium telluride (MCT) detector was used. A 40 mg portion of the adsorbents was pressed to self-supporting pellets with a 20 ton pressing tool (1 ton/cm2, 1 min, die with a diameter of 16 mm). To investigate possible loss of porosity during pressing, pressed pellets of AMS-6 were investigated by nitrogen sorption. The data are presented in the Supporting Information. Pellets were treated under dynamic vacuum conditions (<10–6 Torr) at a temperature of 140 °C for 6 h in the cell, and IR background spectra were measured after such treatments (unless stated otherwise) with 256 scans accumulated at a spectral resolution of 4 cm–1. Probe gases (pure CO2 (>99.9%) or 20 vol % CO2 in N2, Linde Gas Co. (AGA), dry or saturated with 2.1% water vapor) were introduced into the cell and equilibrated at room temperature (cell temperature ∼25 °C when recording spectra). For certain experiments CO2 was humidified to its saturation level by bubbling gas through liquid water at 23 °C. The water content of this mixture was 2.1%, which meant that the excess of water in the system increased with increasing pressure. Equilibrium IR spectra were recorded in situ when the integrals in the spectra remained constant. Along the adsorption isotherm, spectra were recorded up to pressures of 760 Torr, and spectra along the desorption branch were recorded by successively decreasing the pressure. Contributions from gaseous CO2 to the IR spectra were compensated for by subtracting corresponding gaseous CO2 spectra recorded in the cell (without the sample) at different pressures. Time-resolved in situ IR spectra were recorded using the same IR setup and sample preparation method. A 0.3 dm3 portion of dry or humid CO2 was rapidly let into the cell. (The system had a buffer volume of 0.5 dm3, and the total pressure was 200 Torr.) Single-scan in situ IR spectra were recorded at a frequency of time resolution of 4 Hz with a spectral resolution of 4 cm–1, corresponding to ∼14 400 spectra/h. To ensure equilibrium, additional spectra were collected every 5 min for several hours. The formation of species formed was monitored by recording the absorbance values of the corresponding bands.
Results and Discussion
The specific surface area was reduced more for MCM-48 than for AMS-6 on modification with n-propylamine, even though the degree of modification was lower. The highest degree of APTES functionalization was achieved for AMS-6. The degree of functionalization was higher for APTES than for APMDES, which is consistent with the findings of Rosenholm et al.(46) Specific surface areas (BET) and pore volumes, as determined from the adsorption at P/P0 = 0.98, were determined and are presented in Table 1. (Pore volume distributions, in the regime 2–7.5 nm domain, are presented in Figure S1 in the Supporting Information.) MCM-48 was synthesized at higher pH conditions than AMS-6, and in the absence of a costructuring agent, which could affect the degree of cross-linking in amorphous silica.
Table 1. BET Specific Surface Areas, Pore Volumes, and Amine (N) Contents of the Materials.
| BET specific surface area (m2/g) | pore volume (cm3/g) | NH2 group contenta (mmol/g) | NH2 group contentb per nm2 | |
|---|---|---|---|---|
| MCM-48 | 1236–1320c | 0.921–1.067c | ||
| MCM-48/APTES | 310 | 0.306 | 2.822 | 1.37 |
| MCM-48/APMDES | 712 | 0.474 | 1.609 | 0.73 |
| AMS-6 | 921 | 1.046 | ||
| AMS-6/APTES | 288 | 0.218 | 3.467 | 2.26 |
| AMS-6/APMDES | 599 | 0.603 | 1.628 | 1.06 |
Determined by elemental analysis.
Assuming a homogeneous coverage.
Two batches.
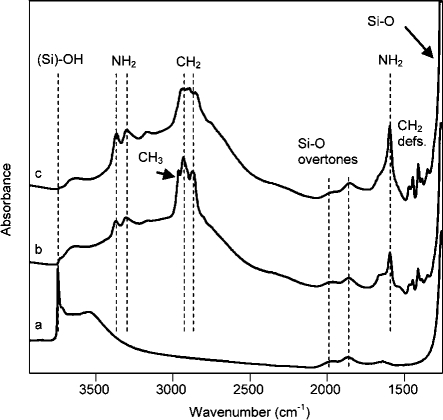
In situ IR spectra were recorded under high-vacuum conditions for MCM-48, MCM-48/APMDES, and MCM-48/APTES and are presented in Figure 1. In Figure 1a, the strongest band in the spectra, at 3745 cm–1, corresponded to OH stretching of free silanol groups of MCM-48, and the broad band at ∼3600 cm–1 mainly reflected internal or hydrogen-bonded silanol groups. No free silanol groups were detectable in the spectra for MCM-48/APTES in Figure 1c, but a small band remained in the spectrum of MCM-48/APMDES in Figure 1b. The broad band at ∼3650 cm–1, in Figure 1b,c, arose from hydrogen-bonded silanol groups, and hence, silanol groups from non fully condensed APTES and APMDES appeared to be hydrogen-bonded to the tethered amine groups. This latter band was more intense for MCM-48/APMDES than for MCM-48/APTES and corresponded to more hydrogen-bonded OH groups. Bands from small amounts of adsorbed water were observed at ∼3500 and 1645 cm–1 in Figure 1a for unmodified MCM-48. Hydrogen bonding affected NH2 stretchings and shifted their frequencies to lower wavenumbers as compared to those of free amine groups,12,47,48 reflected in bands at 3373 and 3309 cm–1 (stretchings), 3170 cm–1 (first overtone of the bending), and 1593 cm–1 (bending) for MCM-48/APMDES. These stretching frequencies were slightly lower in the spectra of MCM-48/APTES than of MCM-48/APMDES because of the higher surface coverage of amine groups in the former. Ammonium groups (propyl–NH3+···–O–Si) were observed by the bands at 1640 and 1545 cm–1 and were more intense for low surface coverage of amines. Methylene fragments were observed by bands at 2930 and 2869 cm–1 (stretchings), saturated for MCM-48/APTES and at 1470, 1445, and 1389 cm–1 (scissoring; deformation). Methyl groups were detected by bands at 2966 cm–1 (stretching) for MCM-48/APMDES. Si–CH2 moieties were detected by the band at 1412 cm–1. Broad bands for the overtones of the Si–O modes were observed at 2000 and 1860 cm–1. Note that the silica materials absorb all IR radiation below ∼1250 cm–1 because of the strong absorbance of Si–O vibrations. Corresponding IR spectra of AMS-6, AMS-6/APMDES, and AMS-6/APTES were practically identical to those in Figure 1 (see Figure S2 in the Supporting Information).
Figure 1.
In situ FTIR spectra of (a) MCM-48, (b) MCM-48/APMDES, and (c) MCM-48/APTES. Spectra were measured in vacuum (<10–6 Torr) after pretreatment (140 °C, <10–6 Torr, 6 h) of the self-supporting pellets. An empty cell was used to record the single-beam background spectrum.
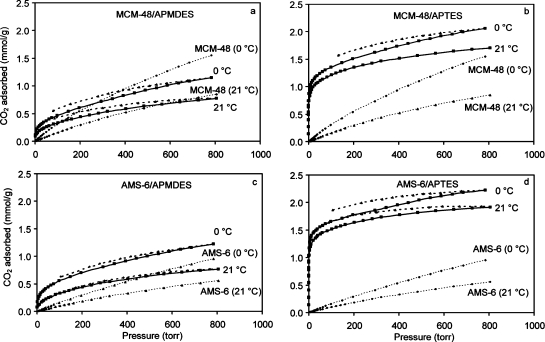
The uptake of CO2 on MCM-48/APTES and AMS-6/APTES was >2 mmol/g at 0 °C and 760 Torr, see Figure 2, which is among the highest values reported for silica modified with APTES.3,4 In particular, silica modified with APTES, but also to some extent those modified with APMDES, showed high uptake of CO2 at low pressures (see Figure 2). The high uptake values and weak temperature dependencies suggested chemisorption of CO2 at low pressures. Despite the fact that the amine coverage of AMS-6/APTES was approximately double that of AMS-6/APMDES (Table 1), AMS-6/APTES adsorbed ∼6 times the amount of CO2 (∼0.2 vs ∼1.2 mmol/g) in the low-pressure domain of the isotherms, Figure 2c,d. This nonlinear response for the uptake of CO2 with respect to the density of amine groups is consistent with the formation of ammonium carbamate ion pairs, which requires proximity among amine groups to form.12,49,50 At high CO2 pressures, the isotherms were basically linear and suggestive of physisorption on both modified and nonmodified silica. Nominal amine efficiencies (adsorbed CO2 (mmol) vs number of amine groups (mmol)) for AMS-6/APTES and MCM-48/APTES at 21 °C and 760 Torr were around 55% and 60%, respectively. If we propose that approximately 50% of NH2 groups transform to NH groups in the case of ammonium carbamate ion pair formation,(25) the difference in the amine efficiencies may be explained by the physisorbed CO2.
Figure 2.
CO2 isotherms recorded at 0 and 21 °C: (a) MCM-48/APMDES (solid lines) and MCM-48 (dotted lines); (b) MCM-48/APTES (solid lines) and MCM-48 (dotted lines); (c) AMS-6/APMDES (solid lines) and AMS-6 (dotted lines); (d) AMS-6/APTES (solid lines) and AMS-6 (dotted lines). Desorption isotherms are shown for the amine-modified samples (dashed lines).
Mechanisms of Reactions and Interactions of CO2 with Propylamines and Silica
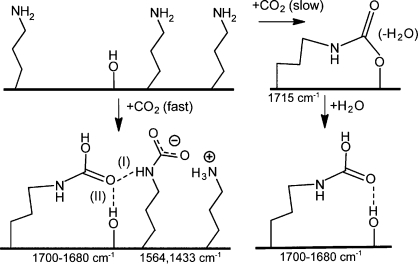
As the details of the reactions of CO2 with propylamines are very rich, we present a proposed mechanism with a short summary. Evidence for this proposed mechanism is shown in the following sections. Ammonium carbamate ion pairs and hydrogen-bonded carbamic acids formed rapidly on contact with dry CO2. More ion pairs formed on samples with high amine densities (silica/APTES) than on those with low (silica/APMDES) amine densities. When contacted with CO2 for a significant time under very dry conditions, an additional moiety formed. We assigned it as silylpropylcarbamate, which is consistent with the findings and assignments by Danon et al.(26) This ester did not form when water was present during the uptake of CO2. (See Scheme 2 for a representation of the species formed.) These assignments agree well with those of Danon et al.(26) However, they did not investigate the effect of moisture on silylpropylcarbamates and the detailed dependencies for the carbonyl band in the spectral region of 1700–1680 cm–1. (Note that both APMDES and APTES have n-propylammonium groups; we can assume that the methyl group directly bonded on APMDES is less important than the amine density when it comes to chemisorption of CO2.)
Scheme 2. Proposed Mechanisms for Chemisorption of CO2 on Silica Modified with n-Propylamine.
Silylpropylcarbamate forms slowly on single amine groups where a neighboring amine group is not available. If water is present, silylpropylcarbamate does not form. IR frequencies for C=O and COO– groups are given below the species. (I) and (II) are two possibilities for hydrogen bonds.
The relevant infrared bands51−53 for chemisorption of CO2 are tabulated in Table 2. Knöfel et al.(24) assigned similar frequencies (with different intensities of the bands) to ammonium carbamate ion pairs and carbamic acid. For hydrogen-bonded carbamic acid an intense C=O stretching at ∼1700–1680 cm–1 (depending on the CO2 coverage and density of the species on the surface) was detected. The 1715–1710 cm–1 band was discussed in some extent by Bacsik et al.(25) elsewhere and is here assigned to silylpropylcarbamate.
Table 2. Major IR Bands for Amine-Modified Silica Contacted with CO2.
| frequency (cm–1) | assignation | group | ref |
|---|---|---|---|
| 3440 | NH str | ammonium carbamate ion pairs, carbamic acid (hydrogen-bonded) | (12, 24−26) |
| 3375 | NH2 asym str | primary amine (negative band) | (12, 31, 52) |
| 3300 | NH2 sym str | primary amine (negative band) | (12, 31, 52) |
| 3300–1800 | NH str, hydrogen-bonded | NH3+ | (52) |
| 2920 | CH asym str | CH2 in propyl groups (negative band) | (51−53) |
| 2850 | CH sym str | CH2 in propyl groups (negative band) | (51−53) |
| 2338 (and 2365) | CO2 asym str | physisorbed linear CO2 | (25, 26) |
| 2160 | NH3+ combination (asym def and twisting) | NH3+ | (51) |
| 1715–1710 | C=O str (amide I) | silylpropylcarbamate (hydrogen-bonded) | (26) |
| 1700–1680 | C=O str (amide I) | carbamic acid (hydrogen-bonded) | (24) |
| 1633 | NH3+ asym def | NH3+ | (12, 24−26, 36, 37, 51) |
| 1580a | NH3+ asym def | NH3+ | (51) |
| 1564 | COO– asym str | carbamate (ionic form) | (12, 24−26, 36, 37, 51) |
| 1520 | NH def + C–N str (amide II) | silylpropylcarbamate carbamic acid (hydrogen-bonded; not resolved) | (26, 52) |
| 1484 | NH3+ sym def | NH3+ | (24−26) |
| 1480 | NH def | carbamate (ionic form) | (51) |
| 1433 | COO– sym str | carbamate (ionic form) | (26, 51−53) |
| 1381 | COO– sym str (?) | carbamate (ionic form) (?) | (26, 51−53) |
High-frequency shoulder on the band at 1564 cm–1.
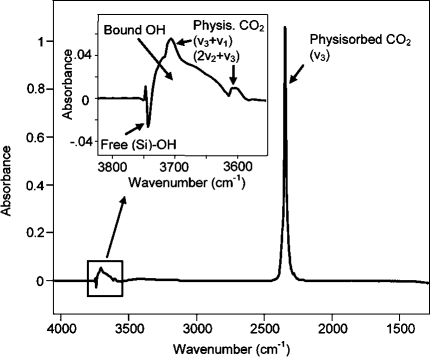
Physisorbed CO2 on pure silicas was detected by various bands, shown for AMS-6 in Figure 3. The intense band for asymmetric stretching of linear CO2 (ν3) at 2344 cm–1 was accompanied by that of 13CO2 (ν3) at 2280 cm–1. A very weak band at 1382 cm–1 was detected for the normally IR inactive symmetric stretching mode (ν1) of linear CO2. Combination bands (ν3 + ν1, ν3 + 2ν2) were observed at 3705 and 3602 cm–1. At high partial pressures of CO2 a band at 2365 cm–1 was observed, and recently, Roque-Malherbe et al.(54) observed such a band at 2363 cm–1, which they assigned to a weakly bonded adduct between silanol groups and CO2: −OH···O=C=O. We observed changes to the spectrum in the regime for OH stretchings, which can potentially strengthen such a thesis. The intensity of the band for isolated OH groups (3745 cm–1) decreased on adsorption of CO2, and a broader band for hydrogen-bonded groups formed at ∼3684 cm–1. Seki and Ikariya(55) suggested that new bands for OH groups formed on adsorption of CO2 on silica, but it seems likely that they misinterpreted bands of gaseous CO2 (see Figure S3 in the Supporting Information). McCool and Tripp(56) attributed the decreased intensity of the bands for free OH groups to a spectral artifact. When silica was contacted with humid CO2, only bands for physisorbed water and CO2 were detected; bands for carbonates or bicarbonates were not observed as there were no bands detectable in the region of 1700–1300 cm–1. (Figure S4 in the Supporting Information presents an FTIR spectrum for pure silica AMS-6 contacted with moist CO2 gas.)
Figure 3.
In situ FTIR spectrum for AMS-6 contacted with dry CO2 gas at 100 Torr after being treated at <10–6 Torr and 140 °C. Contributions from gaseous CO2 and the substrate were compensated for.
Much more CO2 physisorbed on pure silica than on amine-modified silica, but the frequencies were lower for physisorbed CO2 (ν3) on modified silica, with frequencies of 2344, 2340, and 2338 cm–1 for MCM-48, MCM-48/APMDES, and MCM-48/APTES at 100 Torr of CO2. The shift in frequency could suggest stronger adsorption for physisorption of CO2 on modified MCM-48 than on pure MCM-48, possibly relating to a higher degree of hydrogen bonding. By measuring the relative intensities of ν3 bands—using the Si–O overtone bands as internal references and the CO2 uptake of the pure silica—the amounts of physisorbed CO2 on MCM-48/APMDES and MCM-48/APTES were estimated to be ∼2% and ∼0.2% of that on MCM-48 at 100 Torr of CO2.
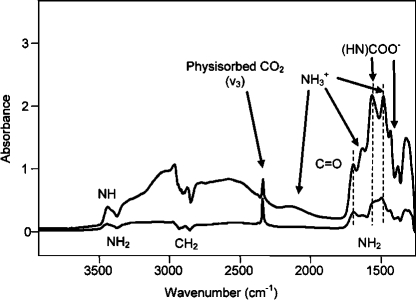
Full-scale FTIR spectra are first presented for a general understanding and quantitative comparison of the chemisorbed species on MCM-48/APMDES and MCM-48/APTES, after which we concentrate on the details in the 1800–1260 cm–1 region. Spectra for MCM-48/APMDES and MCM-48/APTES contacted with 100 Torr of CO2 are shown in Figure 4. The areas for the chemisorbed bands were much larger for MCM-48/APTES than for MCM-48/APMDES and corresponded very well with the significant differences in the uptake level of CO2 in the low-pressure regime, compared with the isotherms in Figure 2. Apart from the band at 1715 cm–1, the spectra in Figure 4 are very similar to those reported by others,12,29,36 and practically agree with spectra measured by Danon et al.(26) on silica with high coverage of amines. Here, bands were assigned to ammonium carbamate ion pairs with the corresponding frequencies presented in Table 2. Besides these ion pairs, frequencies were assigned to hydrogen-bonded carbamic acid and silylpropylcarbamate (1715–1680 cm–1). It was not possible to identify these latter species in single spectra due to overlapping bands, but time-resolved measurements and the absence/presence of water vapor helped us to resolve the spectra (see the details in the forthcoming discussion). Negative bands appeared in Figure 4 with signatures of CH2 and NH2. The negative signals for primary amines corresponded to the formation of ammonium carbamates and carbamic acid. At this point we are unable to explain the negative bands for CH2 fragments, although some suggestions have been given by Chang et al.(29) Similar spectra for AMS-6/APMDES and AMS-6/APTES are presented in the Supporting Information (Figure S5).
Figure 4.
In situ FTIR spectra for MCM-48/APMDES and MCM-48/APTES contacted with 100 Torr of dry CO2.
Time-Dependent Study of CO2 Sorption on Amine-Modified Silica
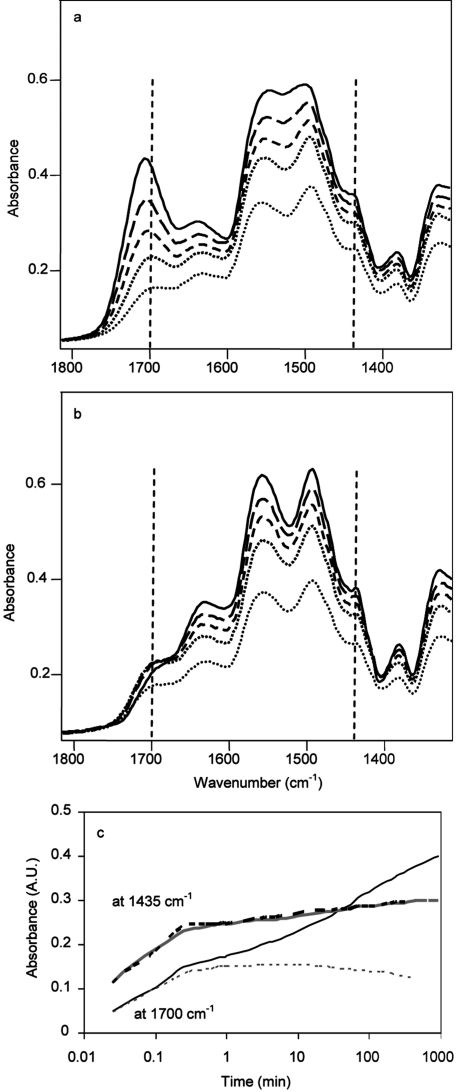
To clarify the mechanism of CO2 adsorption on propylamine-modified silica, time-dependent measurements were performed on AMS-6/APMDES. Figure 5 shows the recorded IR spectra and buildup curves for ammonium carbamate ion pairs, hydrogen-bonded carbamic acid, and silylpropylcarbamate on a sudden increase of the pressure of dry and humid CO2 in N2 for AMS-6/APMDES. Ammonium carbamate ion pairs formed rapidly, and within 1 min, 83% of the final amount had formed, and within 10 min, 90% had formed, both with dry and humid CO2. Then adsorption slowed considerably, and the equilibrium level for these ion pairs was reached only after ∼7 h. In the time-resolved measurements, the amounts of ion pairs formed were close to identical for adsorption of dry and humid CO2, although this could be explained by the small amounts of water in these particular experiments. The spectra for adsorption of dry and humid CO2 were indeed initially very similar and showed a very rapid formation of hydrogen-bonded carbamic acid (at 1700 cm–1) within the first 25 s (Figure 5a,b). After this initial stage, for dry CO2, the carbonyl band continued to increase slowly, while it “shifted” to higher frequencies. This shift could not be explained by H-bonding of the carbonyl groups, which would have decreased its frequency. A possible explanation for the shift is a formation of a new band on the high-frequency side of the band at 1700 cm–1. We considered several facts to assign this new band: (i) The band formed slowly. (ii) Esters always have a higher frequency for the carbonyl group than the corresponding acids. (Stapleton et al.(57) observed a related shift for esterified acetic acid on fumed silica. The C=O frequency for that ester, silylacetate, was in the region of 1760–1740 cm–1, while it was 1724–1717 cm–1 for hydrogen-bonded acetic acid.) (iii) This compound was very stable; it could not be removed by evacuation or even by heat treatment. (iv) This species was observed only under dry conditions (i.e., it did not form if water was present). When treated with water, it transformed into hydrogen-bonded carbamic acid (cf. hydrolysis of the ethoxy groups).(58) Considering these facts, we assigned the band at 1715 cm–1 to a silylpropylcarbamate (see Scheme 2) (or surface-bound carbamate using the terminology of Danon et al.(26)). These observed frequencies (1715–1680 cm–1) are rather low for both an acid and an ester, but can be explained by the effects of neighboring N atoms and the hydrogen bonds, which decrease the frequency further. No intermediate species were detected in the spectra during the full adsorption process (the time resolution was 245 ms). It strongly appeared as ammonium carbamates did not transform to hydrogen-bonded carbamic acid or silylpropylcarbamate. The bands corresponding to ammonium carbamates did not decrease during the slow buildup of carbamic acid. For dry CO2, the rate of formation of ammonium carbamate ion pairs slowed after 0.5 min, but silylpropylcarbamate continued to form until the experiment was aborted; see Figure 5c.
Figure 5.
Infrared spectra of the formed species on AMS-6/APMDES contacted with (a) dry (20 vol % CO2 in N2) and (b) moist CO2 at 0.1, 1, 10, 60, and 445 min (from the bottom to top) and (c) buildup curves recording the band heights at 1435 cm–1 (ammonium carbamate ion pairs) and at 1700 cm–1 (hydrogen-bonded carbamic acid and silylpropylcarbamate) (dashed lines, humid; solid lines, dry CO2).
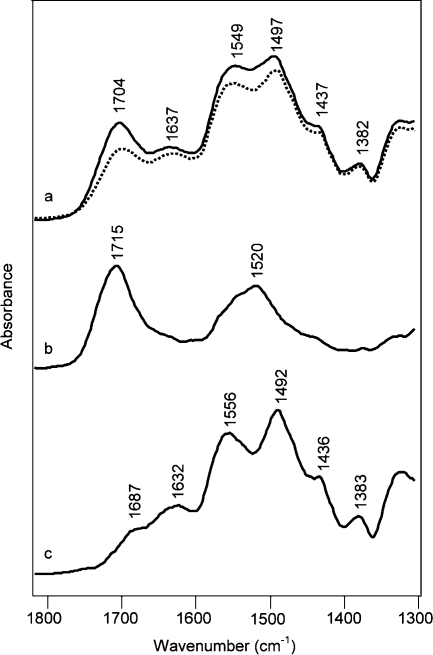
Kinetically resolved difference spectra for dry CO2 adsorbed on AMS-6/APMDES are presented in Figure 6. IR spectra recorded after 2 and 60 min are presented in Figure 6a. Their difference spectrum in Figure 6b related, mainly, to slowly forming silylpropylcarbamates. The difference spectrum in Figure 6c is the difference between the solid-line spectrum of Figure 6a and the difference spectrum in Figure 6b. In Figure 5c, a carbonyl band remained at 1687 cm–1, which indicated that there were two species with carbonyl bands in this region. The one with a band at 1687 cm–1 formed relatively rapidly, could be removed by evacuation easily, and formed with moist CO2 as well (as will be shown in the next paragraphs). We assigned this band to hydrogen-bonded carbamic acid. (In the liquid state, functional group frequencies for naphthyl alkylcarbamic acid at room temperature(21) are 1700, 1545, and 1250 cm–1; for methylcarbamic acid at low temperature(20) they are 1680, 1533, and 1263 cm–1. Tseng et al.(59) assigned a carbonyl band at 1677 cm–1 to similar structures on ethanolamine-modified TiO2 reacted with CO2.) The presence of the hydrogen bonding was confirmed by the negative OH bands at around 3675 cm–1 (the corresponding positive, lower frequency and broader H-bonded OH band cannot be observed clearly because of the overlap with NH stretchings), which can be observed due to the formation of both carbamic acid and silylpropylcarbamate (see Figure S6, Supporting Information). For the latter compound an intense NH stretching band was observed at 3445 cm–1. Danon et al.(26) also observed a similar shift (from 1715 to 1701 cm–1) of the silylpropylcarbamate when ammonium carbamate was present on materials with high amine density. They explained this shift with the underlying broad band for NH3+ at 1625 cm–1. In our opinion, that band appeared to be too far from the carbonyl frequencies to affect it significantly. (Full-scale spectra are given in the Supporting Information, Figure S6.)
Figure 6.
IR spectra measured during the adsorption of dry CO2 on AMS-6/APMDES material: (a) after 2 min (dotted line) and after 60 min (solid line), (b) 2 min spectrum subtracted from the 60 min spectrum representing mainly slowly forming silylpropylcarbamate, (c) subtraction of spectrum b from the 60 min spectrum representing rapidly forming ammonium carbamate ion pairs and hydrogen-bonded carbamic acid. Assignations are presented in Table 2.
Equilibrium Study of CO2 Sorption on Amine-Modified Silica
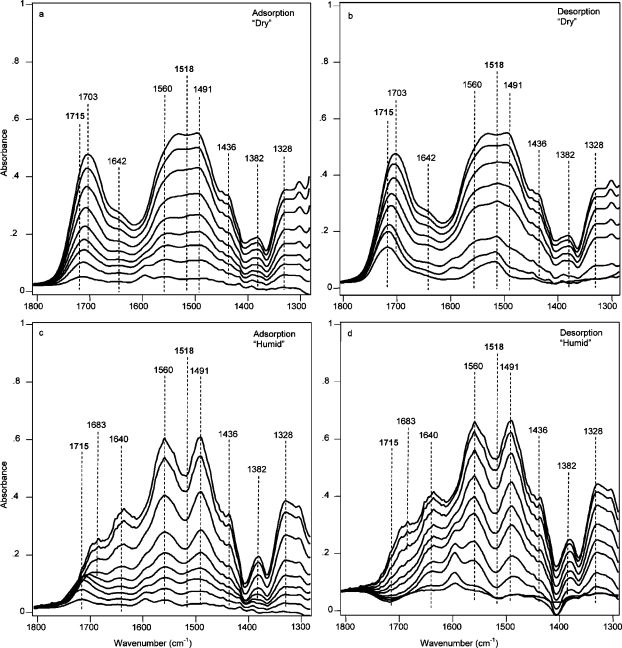
Chemisorbed species formed over the full range of partial pressure of CO2 for AMS-6/APMDES and are visible in the equilibrium FTIR spectra measured in situ during adsorption and desorption. Spectra in Figure 7a show bands for hydrogen-bonded carbamic acid, silylpropylcarbamates, and ammonium carbamate ion pairs (see Table 2 for assignments). Bands at 1715 and 1518 cm–1 (the latter frequency could not be seen in Figure 7a, but had been assigned from the time-resolved measurements) belong to silylpropylcarbamate. The band at 1518 cm–1 (amide II) was rather intense due to overlap with the ammonium carbamate ion pair bands. Under dry conditions only the carbonyl band of the silylpropylcarbamate “shifted” from 1715 to 1703 cm–1 on increasing the pressure; see Figure 7a. We rationalized this apparent shift by the facts that the relative fractions of hydrogen-bonded carbamic acid to silylpropylcarbamate changed and that these bands are overlapping. Figure 7b shows that ammonium carbamate ion pairs could be removed by evacuation. As the pressure was reduced, the band for silylpropylcarbamate shifted back to 1715 cm–1. The spectra clearly showed that hydrogen-bonded carbamic acid was removed by evacuation, but the silylpropylcarbamate was not. In fact, the silylpropylcarbamate was stable to heat treatment under conditions of dynamic vacuum. Spectra in Figure 7c show a continuous formation of chemisorbed moieties on AMS-6/APMDES when raising the pressure of humid CO2. The amount of carbamic acid was significantly reduced for adsorption under moist as compared with dry conditions. This difference was probably due to a water-mediated formation of ammonium carbamates from carbamic acids being hydrogen-bonded with −NH2 groups. Another major difference was that no signatures for silylpropylcarbamates were observed in spectra recorded under moist conditions. The band at 1715 cm–1 was absent at all but the very low pressures. Its presence at very low pressure could possibly have been related to mass transport limitation. The carbamate bands at 1560 and 1491 cm–1 were well resolved for humid CO2, because of the absence of the band of silylpropylcarbamate at 1518 cm–1. At high pressures, spikelets from water vapor were detected on the spectra (1700–1400 cm–1), indicating the excess of water vapor. The increased intensity of the band at 1640 cm–1 related to an increased amount of physisorbed water, as compared to lower pressures. In the low-pressure domain of the desorption branch, a negative band remained at 1715 cm–1; see the spectra in Figure 7d. This band related to hydrolysis of silylpropylcarbamates that were present in AMS-6/APMDES from the very beginning of the experiment. The band at 1595 cm–1 present during desorption, see Figure 7d, showed that under moist conditions additional primary amine groups were liberated. The amines were formed from hydrolysis of silylpropylcarbamates, and possibly hydrogen-bonded ones. Liberated amine groups could explain the often observed higher uptake of moist CO2 as compared with dry CO2;7,10,13,39,40 additional available amine groups would allow more ammonium carbamate ion pairs to form. This amine band remained intense after further treating the sorbent with heat and dynamic vacuum (see the bottom trace in the collection of spectra in Figure 7d). Signatures of bicarbonates or carbonates were not seen in the spectra. Full-scale spectra for AMS-6/APMDES and spectra for MCM-48/APMDES are presented in the Supporting Information, Figures S7 and S8.
Figure 7.
Region of the IR spectra of AMS-6/APMDES material contacted with 20 vol % CO2 in N2 (a) at total pressures of 2, 10, 25, 50, 100, 200, 400, 600, and 760 Torr (from bottom to top) in the adsorption branch and (b) at total pressures of 760, 600, 400, 200, 100, 10, and 1 Torr after 30 min of evacuation (from top to bottom) in the desorption branch and AMS-6/APMDES material contacted with 20 vol % CO2 in N2 together with water vapor (c) at total pressures of 2, 10, 26, 50, 100, 200, 400, 600, and 760 Torr (from bottom to top) in the adsorption branch and (d) at total pressures of 760, 600, 400, 200, 100, 50, 10, and 2 Torr after 30 min of evacuation and after heat treatment (from top to bottom) in the desorption branch.
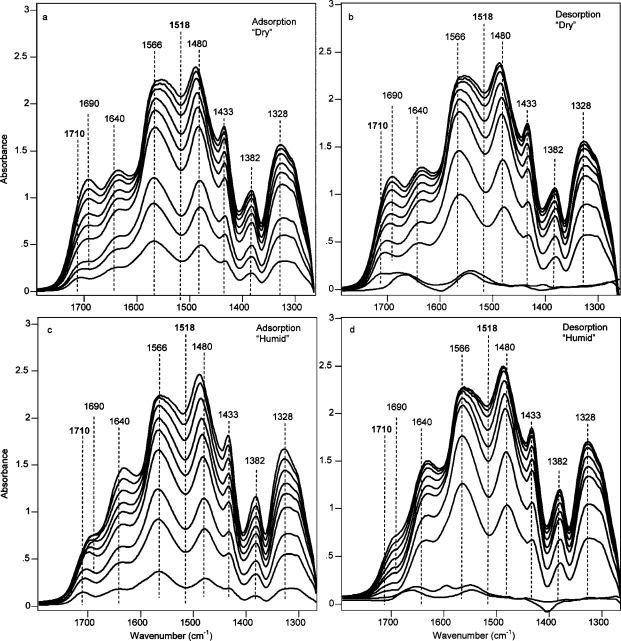
Mainly ammonium carbamate ion pairs formed on adsorption of dry or moist CO2 on MCM-48/APTES. Ammonium carbamate ion pairs and hydrogen-bonded carbamic acid desorbed easily under dry conditions, and the adsorption/desorption processes were fully reversible for the ion pairs (Figure 8b). Silylpropylcarbamates also formed on MCM-48/APTES, and after 20 min of evacuation silylpropylcarbamate remained (see the remaining bands in the trace next to the bottom in Figure 8b). In contrast to the data shown in Figure 7b, the silylpropylcarbamate could be removed by heat treatment (a difference that we cannot explain at this point). After heat treatment, two bands belonging to a new and irreversibly formed species was observed at 1660 and 1550 cm–1. Its formation was associated with a consumption of amine groups, which was reflected in the negative band at 1595 cm–1 in Figure 8b, present in the spectra after heat treatment. Spectra recorded for CO2 adsorption under moist conditions on MCM-48/APTES are presented in Figure 8c. The carbamate bands had slightly higher intensities for moist than for dry conditions. The characteristic band for silylpropylcarbamate was absent, and the band for hydrogen-bonded carbamic acid was smaller. The desorption spectra recorded with humid CO2 were similar to those measured by others.12,28,29,36 Both hydrogen-bonded carbamic acid and ammonium carbamate ion pairs were easily removed, and bands corresponding to free amines appeared at 3370, 3300, and 1597 cm–1 (full-scale spectra in the Supporting Information, Figure S10). After heat treatment, the bands at 1660 and 1550 cm–1 remained, but with lower intensities than for the “dry” experiments. (Full-scale spectra recorded along the adsorption and desorption branches for CO2 adsorption on AMS-6/APTES showed similar trends and are presented in the Supporting Information, Figure S9.)
Figure 8.
Region of the IR spectra of MCM-48/APTES contacted with 20 vol % CO2 in N2 (a) at pressures of 2, 5, 10, 50, 100, 200, 400, 600, and 760 Torr (from bottom to top) in the adsorption branch and (b) at pressures of 760, 600, 400, 200, 100, 50, 10, and 2 Torr after 20 min of evacuation and after heat treatment (from top to bottom) in the desorption branch and MCM-48/APTES contacted with water-saturated 20 vol % CO2 in N2 (c) at pressures of 1, 5, 12, 50, 100, 200, 400, 600, and 760 Torr (from bottom to top) in the adsorption branch and (d) at pressures of 760, 600, 400, 200, 100, 50, 10, and 2 Torr after 20 min of evacuation and after heat treatment (from top to bottom) in the desorption branch.
Regeneration of the Adsorbents
Three repeated CO2 uptake experiments on MCM-48/APMDES showed that the capacity to adsorb dry CO2 was not reduced (1.150, 1.147, and 1.157 mmol/g). For each cycle, the adsorbent was regenerated by applying heat and dynamic vacuum. Sayari and co-workers60,61 and Tanthana and Chuang(33) showed that several cycles were needed to show capacity loss for CO2 sorption on related sorbents. In a previous paper, we discussed(25) that a small amount of irreversibly formed products may build up during adsorption of CO2. This buildup could lead to a significantly reduced capacity during repeated cycles. Sayari et al.(60) recently showed that irreversibly formed species remained on silica modified with n-propylamines after repeated sorption of CO2. They proposed that urea formed at high temperatures and that water could hinder urea formation. We observed such compounds in Figures 7 and 8 without repeated cycling; however, this was not very surprising as we allowed much longer equilibration times than Sayari et al.(60) This compound was reflected in FTIR bands at 1660 and 1550 cm–1 and a “half-band” at around the cutoff (1260 cm–1) already after one cycle and a band at around 3400 cm–1. The assignments of these bands are C=O stretching (amide I), NH deformation and CN stretching (amide II), CN stretching (amide III), and NH stretching, respectively. This species appear to have been an amide, possibly a urea. This compound could not be removed during regeneration with dynamic vacuum and heat treatment at 140 °C. Furthermore, the appearance of negative bands corresponding to primary amines indicated that amine groups were consumed. In addition, negative bands corresponding to OH groups were observed, perhaps due to further condensation of silanol groups (forming water and siloxane linkages). (The full-scale IR spectra after the first and several cycles are given in the Supporting Information, Figure S11.)
4. Conclusions
On silica modified with n-propylamines, three major chemisorbed moieties formed on adsorption of dry CO2: propylammonium propylcarbamate ion pairs, hydrogen-bonded propylcarbamic acids, and silylpropylcarbamates. Silylpropylcarbamate formed by slow condensation of carbamic acid with silanol groups under very dry conditions, but did not form if water vapor was present. As expected, a large amount of ammonium carbamate ion pairs formed when the density of amine groups was high. Kinetic adsorption experiments showed that ammonium carbamate ion pairs and carbamic acid formed rapidly, which is important for eventual applications in CO2 capture.(62) The ammonium carbamate ion pairs and hydrogen-bonded propylcarbamic acid were weakly chemisorbed and could be removed by applying dynamic vacuum. No bicarbonates or carbonates formed under moist conditions, and the notion that the uptake of CO2 can be doubled with water on this kind of amine-modified silica is very questionable. Instead, we detected additional free amine groups in the presence of water vapor, and more ammonium carbamate ion pairs formed, which can rationalize the often observed small increase of the uptake of humid CO2 as compared with dry CO2. A small amount of irreversibly chemisorbed species, plausibly ureas, formed as well.
Acknowledgments
The Berzelii center EXSELENT and the Swedish Energy Agency are acknowledged for financial support. A.E.G.-B. thanks the Swedish Research Council (Vetenskapsrådet) for funding. We are grateful to Dr. Rambabu Atluri (Nanologica AB, Sweden) for kindly providing samples of mesoporous materials and discussions.
Supporting Information Available
Functionalization of the silicas, table for FTIR detection of formed species on CO2 adsorption, pore volume distributions, and in situ FTIR spectra of the formed species on CO2 adsorption on amine-modified AMS-6 and MCM-48. This material is available free of charge via the Internet at http://pubs.acs.org.
Supplementary Material
References
- Ho M. T.; Allinson G. W.; Wiley D. E. Ind. Eng. Chem. Res. 2008, 47, 4883–4890. [Google Scholar]
- Lively R. P.; Chance R. R.; Koros W. J. Ind. Eng. Chem. Res. 2010, 49, 7550–7562. [Google Scholar]
- Choi S.; Drese J. H.; Jones C. W. ChemSusChem 2009, 2, 796–854. [DOI] [PubMed] [Google Scholar]
- Hedin N.; Chen L. J.; Laaksonen A. Nanoscale 2010, 2, 1819–1841. [DOI] [PubMed] [Google Scholar]
- Xu X. C.; Song C. S.; Andresen J. M.; Miller B. G.; Scaroni A. W. Energy Fuels 2002, 16, 1463–1469. [Google Scholar]
- Harlick P. J. E.; Sayari A. Ind. Eng. Chem. Res. 2006, 45, 3248–3255. [Google Scholar]
- Belmabkhout Y.; Sayari A. Adsorption 2009, 15, 318–328. [Google Scholar]
- Kim S.; Ida J.; Guliants V. V.; Lin J. Y. S. J. Phys. Chem. B 2005, 109, 6287–6293. [DOI] [PubMed] [Google Scholar]
- Zelenak V.; Halamova D.; Gaberova L.; Bloch E.; Llewellyn P. Microporous Mesoporous Mater. 2008, 116, 358–364. [Google Scholar]
- Franchi R. S.; Harlick P. J. E.; Sayari A. Ind. Eng. Chem. Res. 2005, 44, 8007–8013. [Google Scholar]
- Serna-Guerrero R.; Dana E.; Sayari A. Ind. Eng. Chem. Res. 2008, 47, 9406–9412. [Google Scholar]
- Hiyoshi N.; Yogo K.; Yashima T. Microporous Mesoporous Mater. 2005, 84, 357–365. [Google Scholar]
- Xu X. C.; Song C. S.; Miller B. G.; Scaroni A. W. Ind. Eng. Chem. Res. 2005, 44, 8113–8119. [Google Scholar]
- Hoerr C. W.; Harwood H. J.; Ramarao G. V. J. Org. Chem. 1944, 9, 201–210. [Google Scholar]
- Alauzun J.; Besson E.; Mehdi A.; Reye C.; Corriu R. J. P. Chem. Mater. 2008, 20, 503–513. [Google Scholar]
- Aresta M.Carbon Dioxide as Chemical Feedstock; Wiley-VCH: New York, 2010. [Google Scholar]
- Dibenedetto A.; Aresta M.; Fragale C.; Narracci M. Green Chem. 2002, 4, 439–443. [Google Scholar]
- Aresta M.; Quaranta E.; Dibenedetto A.; Tommasi I.; Marciniec B. Appl. Organomet. Chem. 2000, 14, 871–873. [Google Scholar]
- Aresta M.; Ballivet-Tkatchenko D.; Belli Dell’Amico D. B.; Bonnet M. C.; Boschi D.; Calderazzo F.; Faure R. E.; Labella L.; Marchetti F. Chem. Commun. 2000, 1099–1100. [Google Scholar]
- Bossa J.; Borget F.; Duvernay F.; Theulé P.; Chiavassa T. J. Phys. Chem. A 2008, 112, 5113–5120. [DOI] [PubMed] [Google Scholar]
- Masuda K.; Ito Y.; Horiguchi M.; Fujita H. Tetrahedron 2005, 61, 213–229. [Google Scholar]
- Battjes K. P.; Barolo A. M.; Dreyfuss P. J. Adhes. Sci. Technol. 1991, 5, 785–799. [Google Scholar]
- Dibenedetto A.; Pastore C.; Fragale C.; Aresta M. ChemSusChem 2008, 1, 742–745. [DOI] [PubMed] [Google Scholar]
- Knöfel C.; Martin C.; Hornebecq V.; Llewellyn P. L. J. Phys. Chem. C 2009, 113, 21726–21734. [Google Scholar]
- Bacsik Z.; Atluri R.; Garcia-Bennett A. E.; Hedin N. Langmuir 2010, 26, 10013–10024. [DOI] [PubMed] [Google Scholar]
- Danon A.; Stair P. C.; Weitz E. J. Phys. Chem. C 2011, 115, 11540–11549. [Google Scholar]
- Pinto M. L.; Mafra L.; Guil J. M.; Pires J.; Rocha J. Chem. Mater. 2011, 23, 1387–1395. [Google Scholar]
- Tsuda T.; Fujiwara T.; Taketani Y.; Saegusa T. Chem. Lett. 1992, 2161–2164. [Google Scholar]
- Chang A. C. C.; Chuang S. S. C.; Gray M.; Soong Y. Energy Fuels 2003, 17, 468–473. [Google Scholar]
- Khatri R. A.; Chuang S. S. C.; Soong Y.; Gray M. Energy Fuels 2006, 20, 1514–1520. [Google Scholar]
- Khatri R. A.; Chuang S. S. C.; Soong Y.; Gray M. Ind. Eng. Chem. Res. 2005, 44, 3702–3708. [Google Scholar]
- Fisher J. C. II; Tanthana J.; Chuang S. S. C. Environ. Prog. Sustainable Energy 2009, 28, 589–598. [Google Scholar]
- Tanthana J.; Chuang S. S. C. ChemSusChem 2010, 3, 957–964. [DOI] [PubMed] [Google Scholar]
- Hao S. Y.; Xiao Q. A.; Yang H.; Zhong Y. J.; Pepe F.; Zhu W. D. Microporous Mesoporous Mater. 2010, 132, 552–558. [Google Scholar]
- Leal O.; Bolivar C.; Ovalles C.; Garcia J. J.; Espidel Y. Inorg. Chim. Acta 1995, 240, 183–189. [Google Scholar]
- Huang H. Y.; Yang R. T.; Chinn D.; Munson C. L. Ind. Eng. Chem. Res. 2003, 42, 2427–2433. [Google Scholar]
- Wang X. X.; Schwartz V.; Clark J. C.; Ma X. L.; Overbury S. H.; Xu X. C.; Song C. S. J. Phys. Chem. C 2009, 113, 7260–7268. [Google Scholar]
- Zheng F.; Tran D. N.; Busche B. J.; Fryxell G. E.; Addleman R. S.; Zemanian T. S.; Aardahl C. L. Ind. Eng. Chem. Res. 2005, 44, 3099–3105. [Google Scholar]
- Xu X. C.; Song C. S.; Miller B. G.; Scaroni A. W. Fuel Process. Technol. 2005, 86, 1457–1472. [Google Scholar]
- Aziz B.; Zhao G.; Hedin N. Langmuir 2011, 27, 3822–3834. [DOI] [PubMed] [Google Scholar]
- Atluri R.; Hedin N.; Garcia-Bennett A. E. Chem. Mater. 2008, 20, 3857–3866. [Google Scholar]
- Beck J. S.; Vartuli J. C.; Roth W. J.; Leonowicz M. E.; Kresge C. T.; Schmitt K. D.; Chu C. T. W.; Olson D. H.; Sheppard E. W.; Mccullen S. B.; Higgins J. B.; Schlenker J. L. J. Am. Chem. Soc. 1992, 114, 10834–10843. [Google Scholar]
- Liu X. Y.; Tian B. Z.; Yu C. Z.; Gao F.; Xie S. H.; Tu B.; Che R. C.; Peng L. M.; Zhao D. Y. Angew. Chem., Int. Ed. 2002, 41, 3876–3878. [DOI] [PubMed] [Google Scholar]
- Hodgkins R.; Garcia-Bennett A. E.; Wright P. A. Microporous Mesoporous Mater. 2005, 79, 241–252. [Google Scholar]
- Sabourault N.; Mignani G. R.; Wagner A.; Mioskowski C. Org. Lett. 2002, 4, 2117–2119. [DOI] [PubMed] [Google Scholar]
- Rosenholm J. M.; Lindén M. Chem. Mater. 2007, 19, 5023–5034. [Google Scholar]
- Okabayashi H.; Shimizu I.; Nishio E.; Connor C. J. O. Colloid Polym. Sci. 1997, 275, 744–753. [Google Scholar]
- White L. D.; Tripp C. P. J. Colloid Interface Sci. 2000, 232, 400–407. [DOI] [PubMed] [Google Scholar]
- Knowles G. P.; Delaney S. W.; Chaffee A. L. Amine-Functionalised Mesoporous Silicas as CO2 Adsorbents. In Nanoporous Materials IV; Sayari A., Jaroniec M., Eds.; Studies in Surface Science and Catalysis Series; Elsevier: Amsterdam, 2005; Vol. 156, p 887. [Google Scholar]
- Knowles G. P.; Graham J. V.; Delaney S. W.; Chaffee A. L. Fuel Process. Technol. 2005, 86, 1435–1448. [Google Scholar]
- Roeges N. P. G.A Guide to the Complete Interpretation of Infrared Spectra of Organic Structures; Wiley: New York, 1994; pp 83–87. [Google Scholar]
- Socrates G.Infrared Characteristic Group Frequencies; Wiley: New York, 1994. [Google Scholar]
- Colthup N. B.; Daly L. H.; Wiberley S. E.. Introduction to Infrared and Raman Spectroscopy, 3rd ed.; Academic Press: New York, 1990. [Google Scholar]
- Roque-Malherbe R.; Polanco-Estrella R.; Marquez-Linares F. J. Phys. Chem. C 2010, 114, 17773–17787. [Google Scholar]
- Seki T.; Ikariya T. Phys. Chem. Chem. Phys. 2009, 11, 10073–10079. [DOI] [PubMed] [Google Scholar]
- McCool B.; Tripp C. P. J. Phys. Chem. B 2005, 109, 8914–8919. [DOI] [PubMed] [Google Scholar]
- Stapleton J. J.; Suchy D. L.; Banerjee J.; Mueller K. T.; Pantano C. G. ACS Appl. Mater. Interfaces 2010, 2, 3303–3309. [DOI] [PubMed] [Google Scholar]
- Vrancken K. C.; Van Der Voort P.; Gillis-D’Hamers I.; Vansant E. F.; Grobet P. J. Chem. Soc., Faraday Trans. 1992, 88, 3197–3200. [Google Scholar]
- Tseng C. L.; Chen Y. K.; Wang S. H.; Peng Z. W.; Lin J. L. J. Phys. Chem. C 2010, 114, 11835–11843. [Google Scholar]
- Sayari A.; Belmabkhout Y. J. Am. Chem. Soc. 2010, 132, 6312–6314. [DOI] [PubMed] [Google Scholar]
- Serna-Guerrero R.; Belmabkhout Y.; Sayari A. Chem. Eng. J. 2010, 161, 173–181. [Google Scholar]
- Li B.; Jiang B.; Fauth D. J.; Gray M. L.; Pennline H. W.; Richards G. A. Chem. Commun. 2011, 47, 1719–1721. [DOI] [PubMed] [Google Scholar]
Associated Data
This section collects any data citations, data availability statements, or supplementary materials included in this article.


