

Abstract
The efficient and accurate quantification of protein-ligand interactions using computational methods is still a challenging task. Two factors strongly contribute to the failure of docking methods to predict free energies of binding accurately: the insufficient incorporation of protein flexibility coupled to ligand binding and the neglected dynamics of the protein-ligand complex in current scoring schemes. We have developed a new methodology, named the ‘ligand-model’ concept, to sample protein conformations that are relevant for binding structurally diverse sets of ligands. In the ligand-model concept, molecular-dynamics (MD) simulations are performed with a virtual ligand, represented by a collection of functional groups that binds to the protein and dynamically changes its shape and properties during the simulation. The ligand model essentially represents a large ensemble of different chemical species binding to the same target protein. Representative protein structures were obtained from the MD simulation, and docking was performed into this ensemble of protein conformation. Similar binding poses were clustered, and the averaged score was utilized to re-rank the poses. We demonstrate that the ligand-model approach yields significant improvements in predicting native-like binding poses and quantifying binding affinities compared to static docking and ensemble docking simulations into protein structures generated from an apo MD simulation.
Keywords: Ligand-model concept, protein-ligand interactions, protein flexibility, induced-fit, docking, holo, apo
Molecular recognition between receptors and ligands through non-covalent association plays a fundamental role in virtually all processes in biological systems. Although many computational concepts exist to simulate receptor-ligand recognition, an efficient and accurate quantification of such interactions is still a challenging task. Force-field based methods such as molecular dynamics (MD) or Monte-Carlo (MC) simulations locally sample energetically accessible substates of the protein-ligand complex's free-energy landscape. In combination with MD or MC simulations, algorithms such as free energy perturbation1 or thermodynamic integration2 can reliably calculate relative free-energies of binding of compounds binding to the same drug target. Unfortunately, the associated procedures are computationally demanding and are typically limited to the comparison of structurally similar compounds. In an effort to reduce the computational cost and allow for the comparison of diverse ligands, endpoint methods such as linear interaction energy (LIE) or the molecular mechanics/Poisson-Boltzmann surface area (MM/PBSA) method were developed.3, 4 Despite their success in quantifying protein-ligand interactions, MD simulations must be performed for each individual compound making end point methods unfeasible for virtual high-throughput screening. In addition to being computationally expensive, the application of these techniques requires a priori knowledge of the ligand binding mode.
To predict the binding mode of compounds, docking methods are widely utilized. Docking methods are less computationally demanding than simulation-based free energy methods and are used to virtually screen the vast chemical space of ligands that could bind to a common target. With an appropriately parameterized scoring function, it is possible to identify probable binding modes of any existing or hypothetical molecule. Unfortunately, accurately estimating binding affinity from the quantification of the resulting protein-ligand interactions proves to be a difficult task; the wealth of devised scoring functions can, at best, yield semi-quantitative values5. The inability of docking methods to accurately predict free energies of binding can be largely attributed to three factors: the simplified representation of the physics of protein-ligand association in the scoring function, the insufficient incorporation of protein flexibility coupled to ligand binding, and the missing dynamic structural information of the protein-ligand complex.
The necessity to account for protein flexibility6 in docking schemes is widely accepted,7-17 and recent advances in docking algorithms begin to partially incorporate protein flexibility. Methods such as soft-receptor modeling,18 the development of protein ensemble grids,19 the use of rotamer libraries,20 the incorporation of MD and MC methods21,22 in docking pose refinement, and the combination of docking with protein structure prediction are used to model protein flexibility.11, 23
McCammon and co-workers pioneered the Relaxed Complex Scheme (RCS) that aims to combine the efficiency of docking with the sampling capabilities of MD simulations to account for protein flexibility24-26. In this method, multiple low-energy conformations of the protein's binding site are sampled using MD simulations, a representative ensemble of protein structures is generated using clustering, and the ensemble of protein structures are subsequently used as alternative docking templates. The resulting ensemble of docking poses is clustered based on the pairwise RMSD values between the different poses. Averaging the score values from all docking solutions of a cluster yields an average predicted free energy for each binding mode. Incorporating slightly different protein and ligand configurations into the calculation of the binding affinity of a binding mode (here represented by members of a cluster) aims to model the thermodynamic equilibrium state of the protein-ligand complex more accurately, and results in more accurate predictions of binding free energies.27
The underlying concept of RCS is the population-shift mechanism of ligand binding (Figure 1a): The protein exists in an ensemble of different structures with the observed ligand-free protein structure (apo form) being energetically the most favorable state if no ligand is bound. In the presence of the ligand, the ligand-bound protein conformation (holo form) is selected from the ensemble of pre-existing conformations and is energetically stabilized by the ligand. The alternative theory describing the observed conformational changes of the protein upon ligand binding is the mechanism titled induced-fit (Figure 1b): The ligand binds to a low energy conformation of the unbound protein and ligand binding induces a conformational change resulting in the holo form of the protein that would be observed in the X-ray structure of the protein-ligand complex. While many researchers favor the population-shift mechanism, recent studies suggest that the mechanism of protein-dynamics coupled to ligand binding is complex and involves both the population-shift and induced-fit mechanisms.28-31
Figure 1.

(a) In the population-shift model of protein flexibility coupled to ligand binding, different protein conformations are sampled by the ligand-free form of the protein (protein: blue shapes). A ligand (orange circle) binds to the ligand-bound form and stabilizes the particular protein conformation. (b) In the induced-fit mechanism the ligand binds to the apo form of the protein, and this interaction triggers a conformational change of the protein to accommodate the ligand. (c) Protein conformations sampled for different ligand-bound forms of the protein might be biased for their bound ligand (different ligands: rectangle and triangle). Other ligands (here: circle) might not be able to bind to the protein conformations biased by the other ligands.
Even if the population-shift mechanism is the dominant mechanism, in many cases the holo conformations of the protein are rarely visited throughout the dynamics of the ligand-free protein and sampling these rare conformations is a significant challenge for MD simulations. If the X-ray structure of a holo protein structure is available, protein conformations could also be sampled using MD simulations on the protein with co-crystallized ligand. But, MD simulations of the ligand-bound form of the protein can bias the trajectory towards the specific ligand used in the MD simulation,27 and other ligands may not be able to bind to this biased ensemble of conformations (Figure 1c). Similar effects were recognized32 in cross-docking studies to static apo and holo forms of various protein-ligand systems: In several cases the holo structure was strongly adapted to compounds similar in structure to the ligand bound in the X-ray structure. In these cases, structurally diverse compounds were successfully docked to the apo structure and were not identified as possible leads when docking to the holo structure. The observation of a biased selection of possible lead compounds in virtual screening as a result of using specific holo structures has been corroborated by other cross-docking analyses.33, 34
Based on the previous discussion, new concepts that sample protein conformations that are relevant for binding structurally diverse ligands are highly desirable. The conformations should be unbiased towards a particular class of ligands in order to gain higher enrichment levels and better quantification of protein-ligand interactions for a diverse set of ligands. In this paper we introduce the novel concept of a hypothetical ‘ligand model’, a virtual ligand represented by a collection of functional groups, that binds to the protein and dynamically changes its shape and properties during MD simulations. The “ligand model” essentially represents a large ensemble of different chemical species binding to the same target protein. As a consequence, this approach allows sampling of protein conformations relevant to binding diverse ligands and also probes protein flexibility coupled to ligand binding.
In this paper, we first introduce the protein-ligand systems used in our study, followed by discussions of the docking studies on the apo and holo forms of each protein system using the static X-ray structure and the dynamic ensemble generated by MD simulations. We then present the results of identical docking studies on the ensemble of protein conformations generated with the new ligand-model approach. Using the ligand model we demonstrate superior docking results compared to apo-ensemble docking.
Materials and Methods
Protein systems
Two protein systems, thrombin and acetylcholinesterase, were chosen as test systems for binding pose prediction as several X-ray structures with structurally diverse ligands are available in the PDB databank for both systems. 25 structures of thrombin (PDB-codes: 1a4w, 1d3d, 1d3p, 1d3q, 1d3t, 1d4p, 1dwd, 1ghw, 1kts, 1oyt, 1tom, 1vzq, 1ype, 1ypj, 1ypg, 2c8w, 2c8y, 2c8z, 2c90, 2c93, 2c8x, 2cf8, 2cf9, 2cn0, 3biu) and six structures of acetylcholinesterase (1eve, 1gpk, 1hbj, 1qti, 1vot, 3i6m) were selected. For binding affinity predictions, 14 compounds with consistently measured binding affinity towards thrombin were chosen (ligands from 1ypg, 1ype, 1ypj, 1oyt, 2cf8, 2cn0, 1vzq; compounds rac-8, rac-13a and rac-16 from35, rac-5, rac-8 and rac-9 from36, (+)-7 from37). For binding specificity prediction, high affinity ligands for each of three different dihydrofolate reductase (DHFR) species (human = hDHFR, Pneumocystis carinii = pcDHFR, Candida albicans = caDHFR) were selected (see Supporting Information S1) from Bowman et al.38 1hfr, 1daj, and 1ai9 were chosen as target protein structures for docking to hDHFR, pcDHFR, and caDHFR, respectively.
Docking using AutoDock Vina
All docking simulations were performed using AutoDock Vina.39 Protein and ligand preparation was performed using our in-house PyMOL plugin40 that automatically calls the programs prepare_receptor4.py and prepare_ligand4.py that are part of AutoDockTools41. A cubic box with dimensions of 25Å × 25Å × 25Å centered on the centroid of each co-crystallized ligand defined the search volume for AutoDock Vina. Standard docking settings were used and the 10 energetically most favorable binding poses are outputted.
Relaxed Complex Scheme (RCS)26
MD simulations were employed to generate an ensemble of low-energy protein conformations. MD simulations were carried out using Amber42 and Gromacs43, 44 on the apo form and all 31 holo forms of thrombin and acetylcholinesterase. Two different simulation protocols were investigated for the apo form: One “short apo” simulation protocol (using Amber) consisted of 500 steps of energy minimization, 25ps of equilibration, and 50ps of production used to generate the ensemble of protein structures with a water cap of 25Å around the ligand. (This simulation protocol also was used for all holo MD simulations.) These simulations are time efficient but raise the question whether they extensively sample the conformational space of the protein accessible to different ligand-bound forms. To address this issue, we also performed 30ns MD “long apo” sampling runs (using Gromacs) using a water box with PME boundary conditions for the apo forms of thrombin and acetylcholinesterase to investigate the influence of simulation length and boundary conditions on the results of docking to the apo trajectory of a protein. The resulting trajectories from both settings were then separately clustered using quality threshold (QT) clustering. The RMSD criterion was adjusted automatically to generate 200-250 distinct protein conformations. AutoDock Vina was used to perform docking to the ensemble of protein conformations with identical settings as used in the static docking experiments. The top-10 ranked binding poses from each individual docking simulation were outputted and considered for subsequent clustering. The binding poses were clustered using QT clustering (1Å cluster radius). Following the procedure from S. Vajda and coworkers,45 clusters with less than 15 members were discarded and the predicted free energy of binding for a binding-mode cluster i was calculated based on the energy histogram over all binding modes j of a cluster i using:
| (1) |
Pij is the probability of identifying a pose j in cluster i and ΔGj, is the score of binding pose j.
Ligand-model concept (“Limoc”)
As discussed above, apo trajectories do not always represent an ensemble of protein structures visited by the holo form of the same protein. In order to guide the apo simulations into conformations visited by the ligand-bound form of the protein, we developed the ligand-model approach: Based on the initial apo protein structure, residues spanning the binding site of the protein are selected based on manually docked ligands chosen by the user (Figure 2a). For the protein systems studied in this manuscript a combination of ligands was chosen that best cover the volume of all co-crystallized ligands used in the subsequent docking studies. The binding modes of the ligands were obtained by aligning the associated holo protein structures to the apo using PyMOL. Existing steric clashes with the apo protein is not an issue as the ligands are only used to define the volume of the binding site. The use of artificial ligands defining the binding site are possible, too. A protein residue is selected to constitute the binding site if any atom of the residue is within a user-defined radius around any atom of the chosen ligands (we chose a radius of 5Å). Next, the solvent-accessible surface (SAS) of the binding pocket is computed (Figure 2b) using the NSC module that is part of the program package ASC/GM.46, 47 The SAS is represented by individual surface points. On this SAS, atoms of the hypothetical ligand model are distributed, dependent on the complementary properties of the amino acids of the binding site (Figure 2c): A hydrophobic atom with van der Waals parameters of an sp3 carbon is placed in hydrophobic moieties of the binding pocket, a hydrogen-bond donor group (represented by a dipole with van-der-Waals radii and masses of an oxygen and hydrogen atom and with complementary charges of -0.4 and 0.4, respectively) next to an acceptor in the binding site, and a hydrogen-bond acceptor (represented by an atom with van-der-Waals radius and mass of an oxygen atom, and a lone-pair, with complementary charges of 0.4 and -0.4, respectively) next to a donor. The discrete points of the SAS that are chosen for donor and acceptor group are those that are optimal in hydrogen-bond distance and directionality: For a protein's donor group, the distance between the donor hydrogen H and every surface point S (dH-S) and the angle between donor heavy atom D, donor hydrogen H and surface point S (∠(D,H,S)) is computed. The optimal position S to place a hydrogen-bond accepting group of the ligand model is determined by the minimum of the following empirical function:
Figure 2.

Scheme of ligand-model approach: Given a starting protein structure the binding site is identified (a) and the solvent-accessible surface for this binding site is computed (b). Molecular probes complementary to the physico-chemical properties of the residues of the binding site are distributed onto the solvent accessible surface (c) (gray: hydrophobic probe; blue-white: hydrogen-bond donor; red-orange: hydrogen-bond acceptor). Throughout the MD simulation the probes are harmonically restrained. (d) To sample the interactions different possible ligands binding to the same binding site would experience, donor and acceptor groups are copied and placed at positions nearby the optimally complementary position. They interact with different copies of the same complementary residue of the binding site using the Locally-Enhanced Sampling method (LES).48 (e) To sample the interactions of different sized ligands in various moieties of the binding site, the equilibrium position of a probe is altered, following the first principal component of a previous short MD simulation without ligand model.
| (2a) |
For a protein's acceptor group, the distance between acceptor heavy atom A and every surface point S (dA-s) and the angle between acceptor heavy atom A, lone pair L, and surface point S (∠(A,L,S)) is computed. The optimal position S to place a hydrogen-bond donating group of the ligand model is determined by the minimum of the following empirical function:
| (2b) |
As part of this assignment process, only hydrogen-bonding groups of the protein are considered as possible hydrogen-bond partner for ligand-model groups if they are not engaged in intra-protein hydrogen bond interactions. An intra-protein hydrogen bond is formed if the distance between donor hydrogen and acceptor heavy atom is smaller than 2.5Å, and the angle between donor heavy atom, donor hydrogen and acceptor atom is larger than 135°.
Hydrophobic ligand-model probes are placed on the surface points that are not occupied by donor or acceptor groups. The hydrophobic probes are equally distributed onto the SAS with a minimum distance of 0.8Å to other ligand-model probes to represent a smooth interaction of the protein with the ligand model representing different ligands able to bind to the protein. As the distance between atoms in a real ligand would be larger than 0.8Å, the van-der-Waals interaction between protein and ligand-model atoms are down-scaled.
The underlying assumption to place the probes of the ligand model on the SAS is that the interactions between protein and ligand, in particular hydrogen bonds, are close to optimal at this distance. MD simulations are run on the protein-ligand model complex using the following Hamiltonian:
| (3) |
Ri are the coordinates of protein and water atoms, and ri the coordinates of the ligand model. VP-P is the standard interaction potential between protein atoms (including water molecules) using the Amber03 force field, VP-LM is the corresponding interaction potential between protein and ligand model atoms. There is no interaction between individual LM probes. In a real ligand, the different functional groups are connected to each other via the ligand scaffold, and therefore restricted in their movement. To model this restriction during the simulation of protein and ligand model, the atoms of the ligand model are harmonically restrained around their equilibrium position on the SAS with a force constant that is four times larger in parallel to the SAS than perpendicular to the SAS. This is necessary to prevent overlaps between ligand model atoms but to allow fluctuations perpendicular to the SAS, consistent with the dynamics of a real ligand binding to the protein. Vrestr describes this potential in equation 3. Protein and ligand model atoms are separately coupled to a Berendsen thermostat at a given temperature T=300K with temperature coupling time τp =5ps. Simulations are performed with a water cap with a radius of 25Å.
Running a MD simulation of the protein with the specified ligand model, however, would just sample conformations close to the original structures and thus would only reproduce an ensemble of protein structures similar to the apo MD simulation. To simulate the conformational adaptation of the protein to different ligands, we allow the ligand model to change dynamically throughout the simulation, in an attempt to represent a large portion of the chemical ligand space accessible to the binding site. Both properties and the shape of ligand model are allowed to change:
1. Different positions and orientations of the hydrogen-bond donors and acceptors of the ligand model are probed, fundamentally representing different ligands, to investigate the capability of the protein to accommodate different configurations of the hydrogen-bond partners (Figure 2d). In the most primitive approach, this would extend the simulation length by a factor directly proportional to the product of the number of positions and orientations of all hydrogen-bond probes. This approach is computationally intractable, as there are easily several tens of different hydrogen-bond configurations for each individual probe (Figure 3, right panel). The conformational change at this stage is expected to be localized, so we introduced the method of Locally-Enhanced Sampling (LES) into our in-house MD code.48 The relevant portions of the simulation system are copied, which in this case are the different conformations of the ligand model's hydrogen-bonding groups and their protein counterpart. The individual copies of the same group, i.e. probe and directly interacting amino acid, don't experience any interaction with other copies of the same group, and all other parts of the simulation system experience the average interactions of all copies of the same group. This approach results in an efficient sampling of possible hydrogen-bond configurations without a tremendous computational overload.
Figure 3.

Example of ligand model binding to thrombin. Left: Initial frame of ligand model-protein complex without copying the molecular probes and their interacting protein (blue: hydrogen-bond donor probe (dark) and protein (light) atoms; red: acceptor probe (dark) and protein (light) atoms; green: protein groups that can be both donor and acceptor; brown: hydrophobic probe atoms). Right: Snapshot of MD simulation of ligand model-protein complex in which donor and acceptor probes, and interacting residues are copied. Only donor and acceptor probes and copied residues are displayed.
In more detail, starting from the initial optimal position of a ligand-model donor or acceptor group, the positions of ligand-model groups are identified that are a maximum distance of 2Å apart from the optimal donor or acceptor group. Furthermore, the software checks whether these alternative ligand-model donor or acceptor positions share the same closest complementary protein's hydrogen-bonding group. Alternative copies of ligand-model's hydrogen bonding groups are distributed onto these positions if both criteria (maximum distances to ideal position and same closest protein group) are fulfilled. For each alternative copy of a ligand-model hydrogen-bonding group an interacting copy of the protein hydrogen-bonding residue is automatically added to the simulation topology. The coordinates of the copied residues are initially identical but automatically adapt to the different positions of the interacting ligand-model groups throughout the equilibration period. This procedure also includes a copy for the hydrogen-bonding amino acid with a hydrophobic probe as ligand partner in order to study the localized impact on the protein configuration when a bound ligand is lacking a complementary hydrogen-bond partner at this moiety. Figure 3 displays one of the ligand models bound to thrombin with and without copied probes.
2. To study the effect of topologically different ligands binding to the protein, i.e. portions of the ligand smaller or larger in size, we run locally-steered MD simulations of the ligand model to slightly enlarge or decrease the size of the SAS accommodating the groups of the ligand model (Figure 2e). The amplitude of steering each ligand-model probe is determined by an initial principal component analysis of the covariance matrix derived from the short 50ps apo simulation. In more detail, the atomic coordinates of residues lining the active site in the initial protein structure are translated by the first principal component in both directions, and the modified SAS is calculated for the protein structures resulting from both translations. The size of protein's conformational change is limited to approximately 1-2Å RMSD. A new ligand model is generated as previously described utilizing the modified atomic protein coordinates. The coordinates of the probes of the new ligand model are used in subsequent steered MD simulations. In this process, the closest new ligand model group for each original ligand-model group is computed. This point determines the end point of the steered MD simulation for each ligand-model atom. The steering procedure is performed in both directions of the first principal component changing the equilibrium position of each ligand-model probe linearly throughout the steered MD simulation. After steered MD and equilibration, standard conformational sampling with the previously described ligand model is performed. The total simulation length was 20ps using a water cap of 25Å radius. Inclusion of copied atoms in the LES approach increases the CPU time per MD simulation step to approximately a factor of two compared to standard MD. The simulation time of 20ps, thus, is comparable in CPU time to the short apo simulations and significantly more efficient than the 30ns long apo MD simulations.
The underlying procedure to prepare and run Limoc simulations is fully automatic and default parameters are heuristically defined. In principle, the user is able to change most parameters using a parameter file, but we chose default settings for all protein systems studied in this manuscript. The only user input required to run a “ligand-model” simulation is the initial choice of ligands to define the size of binding pocket.
After MD simulation with the ligand-model, the trajectory was clustered in two steps: First, for each MD snapshot distinct clusters were identified for the copied amino acids. Second, all resulting MD frames were subsequently clustered producing an ensemble of 200-250 protein conformations for subsequent docking.
Results and Discussion
Chemical space covered by ligand model
Before utilizing the ligand-model approach for docking, we addressed the question whether the probes of the ligand model sufficiently cover the chemical space of structurally diverse compounds binding to a common target protein. As examples, we selected the 13 most diverse ligands from the thrombin dataset and analyzed the occupancy density of ligand atoms throughout the corresponding 13 holo MD simulations. We used ptraj from the Amber suite to create a grid in X-Plor density format that presents the occupancy of donor, acceptor, and any ligand atom in each grid cell throughout the MD simulations. The same analysis was repeated for the MD simulations on the ligand model-protein complex. The results are displayed in Figure 4, and demonstrate that the molecular probes of the ligand model (mesh) are covering the chemical space of the 13 structurally diverse ligands (density in surface representation). It should be noted that the ligand-model probes sample multiple additional interactions that are not present in the 13 co-crystallized ligands but could be potential interaction sites for other ligands.
Figure 4.
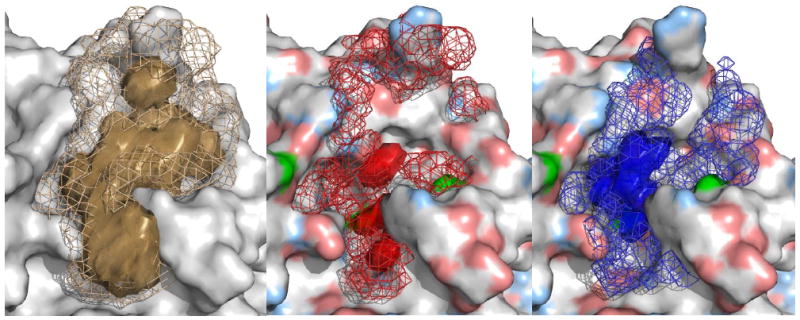
Density map over MD trajectories of 13 holo structures of thrombin (surface representations) and the ligand-model simulation (mesh representation). Overlap of occupied grid points by any atom (left, brown colors), acceptor groups (middle, red) and donor groups (right, blue). The corresponding physico-chemical properties of the protein are projected onto the protein's surface for the right two panels (light blue: hydrogen-bond donor atoms; light red: acceptor atoms; green: protein groups that can be both donor and acceptor).
Docking to apo and holo X-ray structures
To demonstrate the importance of including protein flexibility in docking and to validate the utility of AutoDock Vina for thrombin and acetylcholinesterase we performed static docking to the apo structures of both systems and to each individual holo structure. From 31 ligands bound to thrombin or acetylcholinesterase only 8, 9, 12 and 15 compounds could be successfully docked (RMSD < 2.5Å to the experimentally observed native binding pose) to the apo form of the protein among the top-1, top-2, top-5, and top-10 ranked poses, respectively (Figure 5, blue bars). When docking compounds to their native holo conformation of the protein, more than 70% of all compounds had a binding pose with an RMSD smaller than 2.5Å to the native pose for the top-ranked pose. When considering the top-10 ranked poses all except one ligand could be docked with RMSD < 2.5Å to the native ligand conformation (Figure 5, red bars).
Figure 5.

Percentage of successfully docked ligands into the static apo (blue bars) and holo (red) conformations of thrombin and acetylcholinesterase. A ligand is successfully docked if the RMSD between predicted and experimentally observed binding pose is less than 2.5 Å.
In summary, AutoDock Vina is able to reproduce the experimentally observed ligand binding pose if the native holo conformation of the protein for each ligand is known, but fails to do so in most cases when the apo form of the protein is used.
Cross-docking to holo X-ray structures
In real-life applications usually few or no holo X-ray structures are known and docking is performed into the apo form or an individual ligand-bound form of the protein. Thus, cross-docking experiments were performed for eight diverse ligands binding to thrombin. Each ligand is docked into the rigid protein structures of all seven other ligand-bound forms of thrombin used in this study. From seven ligands docked to each protein structure, between zero to five compounds can be successfully docked within an RMSD of 2.5Å (Figure 6, red bars). Thus, no holo structure is pre-organized to allow successful docking of all ligands to its binding site without additional protein flexibility. One X-ray structure (PDB-code: 1kts) is adapted to its own ligand such that not a single ligand other than its co-crystallized ligand can be successfully docked to its binding site, despite the fact that the overall RMSD deviation of residues in the binding site (0.79 Å) is inside the range of observed deviations of all holo structures from the apo form (0.44-0.87 Å).
Figure 6.
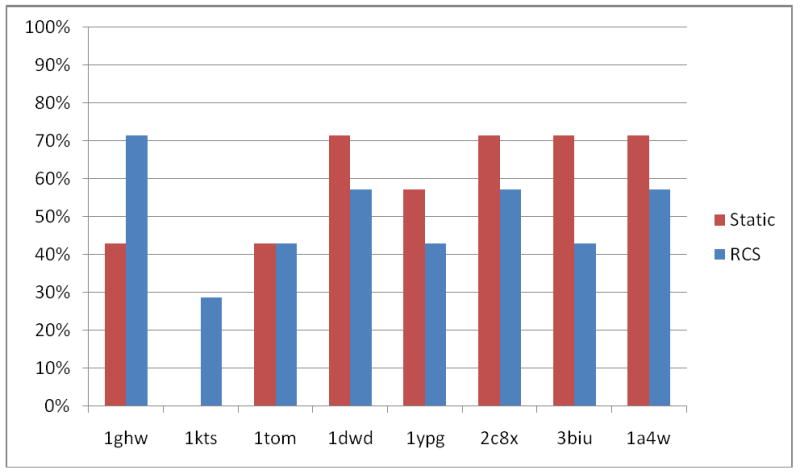
Cross-docking results: Percentage of successfully docked ligands (RMSD < 2.5Å ranked as top-1) to eight different X-ray holo structures of thrombin. In red are shown the results for docking into the x-ray holo structures, in blue those for docking into the holo MD ensembles.
Binding mode prediction using RCS on apo and holo trajectories
MD trajectories were generated for the apo forms of thrombin and acetylcholinesterase, along with each of the 25 and 6 holo forms for the two protein systems, respectively. For the apo forms two different settings were investigated: A short 50ps MD simulation using a water cap to simulate small protein fluctuations and a long 30ns simulation for each protein system to allow for sampling more diverse protein conformations. After QT clustering of each trajectory into 200-250 representative protein conformations, docking into each ensemble member was performed using AutoDock Vina. The individual poses were clustered and the scores of all members of a cluster were averaged using canonical ensemble statistics yielding a final predicted score for each cluster of binding poses, which are named RCS-poses in the following discussion. Results for the short and long apo as well as the holo ensemble docking results are displayed in Figure 7.
Figure 7.

Percentage of ligands successfully docked into the ensemble of protein conformations generated by a short (blue bars) and long (purple) MD simulation of the apo forms of thrombin and acetylcholinesterase as well as from short MD simulations of the holo forms (red) and from our ligand model simulations (green). A ligand is successfully docked if the RMSD between predicted and experimentally observed binding pose is less than 2.5Å.
Although no improvement in predicting the bioactive conformations of ligands can be observed for the top-1, -2, and -5 ranked RCS-poses when docking to the short apo MD simulation ensemble, a 10% improvement can be identified for the top-10 ranked RCS-poses. A significant improvement over the static apo docking results is observed if the ligands are docked to the long apo MD simulation ensemble, suggesting that alternative protein conformations relevant for docking diverse ligands can only be sampled using longer apo MD simulations. However, one third of the ligands still cannot be docked to the long apo MD simulation ensemble, suggesting that protein conformations important for binding a significant portion of the ligand library have not been sampled throughout the long MD simulations.
Cross-docking simulations were repeated for the same eight thrombin ligands as described earlier in “Cross-docking to holo X-ray structures”, but using the holo MD ensembles. Figure 6 (blue bars) shows that on average no significant improvement was observed using the RCS approach on the holo MD ensembles compared to the static cross-docking experiments. MD simulations of a ligand-bound form of the protein biases the trajectory towards the ligand used in the MD simulation. Other ligands are not able to bind to this biased ensemble of conformations.
Binding mode prediction using RCS on ligand-model trajectories
We hypothesize that induced fit of the protein is required upon ligand binding and that these conformational changes are not generally observed in the population of protein structures sampled throughout the apo MD simulations. Our ligand-model approach aims to sample protein conformations observed upon binding of structurally different ligands. Starting from the apo form of each protein, short 25ps MD simulations were run with the ligand model. After QT clustering of the MD trajectory, docking simulations were performed into an ensemble of 200-250 protein conformations. After clustering the binding poses, the predicted binding affinity was determined by the canonical ensemble average of the score of all members of a binding pose cluster. The results of docking into the ligand-model MD ensemble are shown in Figure 7 (green bars). A significant improvement in successfully predicting the bioactive conformations of the 31 ligands binding to thrombin and acetylcholinesterase can be observed compared to both the static and the MD ensembles on the apo form of the proteins. Compared to the short apo MD simulation, the rate of predicting the bioactive conformation increases for the ligand-model simulation by 35% to 48% for the top-1 to top-10 ranked poses. Even compared to the ensemble generated by computationally considerably more expensive long apo MD simulation, the success rate increases significantly by between 16% and 29% for top-1, top-2, top-5, and top-10 ranked poses. Success rates similar to docking into the holo form of each individual protein-ligand complex can be achieved when considering the top-2, top-5 or top-10 ranked poses.
Thus, our new ligand-model approach seems to be able to generate protein conformations that allow for successful docking of structurally diverse ligands to the same protein. These results also suggest that the ligand model stabilizes protein conformations through direct interactions with the protein throughout the MD simulation, which are absent in the apo simulations and that may reflect additional induced fit of the protein necessary to accommodate a ligand.
The significance of the induced fit associated with ligand binding is underlined in Figure 8 for the three thrombin ligands BMZ (PDB-code: 1ghw), DA2K (1a4w), C24 (1kts), and one acetylcholinesterase ligand G3X (3i6m). Histograms displaying the probability of indentifying poses with a certain predicted free energy show a shift in energy towards more negative values for the holo-docking simulations in comparison to the apo-docking simulations. Upon ligand binding, additional adaptation of the protein yields an optimally adapted protein-ligand complex with more negative predicted binding energies than observed for the poses generated by docking into the apo MD simulation. The corresponding histograms (Figure 8) for docking into the ligand-model MD ensemble show a shift from the apo histograms towards more negative predicted free energies that are generally in better agreement with the holo histograms. This shift of the ligand-model histogram is consistent with the improved results of docking into the ligand-model MD ensemble compared to the apo MD ensemble, and further suggests that using our ligand-model approach an ensemble of protein conformations can be generated that include a significant portion of the protein adaptation to the bound ligand as observed in the holo ensemble.
Figure 8.

Histograms showing the probability of identifying poses with a certain predicted free energy for docking into holo (purple), long apo (red), short apo (orange) and ligand model (green) MD ensembles for three thrombin (BMZ, DA2K, C24) and one (G3X) acetylcholinesterase inhibitor.
For ligand BMZ (Figure 8a), for example, the histogram of the ligand model overlaps rather well with the histogram of the holo form. The same is also true when considering only the population of poses with an RMSD < 2.5Å (Figure 8b). The figure also shows that the total number of good binding poses is relatively similar between holo and ligand model docking simulations, slightly larger than that for the long apo, and significantly larger than that of the short apo docking simulation. Consequently, a good RCS-binding pose can be identified at the top-1 position for ligand model and holo ensemble, at top-2 position for long apo but only at top-7 position for the short apo ensemble.
For ligand DA2K (Figure 8c) the difference between the ligand model and long apo histogram is even more pronounced, and no good binding poses are identified for the short apo ensemble. The ligand model ensemble, however, fails to produce the population of binding poses with scores between -10kcal/mol and -9kcal/mol for the holo ensemble. Consequently, the best ranked RCS-pose for docking into the holo ensemble is ranked at first position, whereas it is ranked second for the ligand model simulation. No RCS-pose among the top-10 ranked RCS-poses can be identified for either apo ensemble docking simulations.
The shift in energy between holo docking ensemble and ligand model simulation is largest for ligand C24 (Figure 8e). Although binding poses with RMSD < 2.5Å are observed for docking into apo and ligand model ensembles (Figure 8f), no RCS-pose is identified among the top-10 ranked solutions. The reason is that many solutions with RMSD > 2.5Å have more negative scores than poses with RMSD < 2.5Å. Additional induced fit not simulated in the apo and ligand model simulation seems to be necessary for stabilizing low RMSD poses which then would yield to more favorable scores.
For the acetylcholinesterase inhibitor G3X (Figure 8g and h), holo and ligand model histograms are almost identical, whereas the histograms of the apo ensembles are shifted to more positive energies. Consequently, the top-ranked RCS-pose of the ligand model ensemble displays an RMSD < 1.0Å, but no RCS-pose among the top-10 ranked poses could be identified for the long apo ensemble with an RMSD < 2.5 Å.
Structural analysis of trajectories
To further understand how the structural variations between holo, apo and ligand model MD ensembles result in the observed differences in docking success we address two particular questions. First, which structural differences between the holo structure and other protein structures sampled throughout the various MD simulations lead to failures in generating native-like ligand poses? Docking ligand DA2K to the short apo simulation of thrombin, for example, results in more energetically favorable binding poses than docking to the long apo simulation, but no ligand poses with an RMSD < 2.5Å to the native form are generated for the short apo simulation. Second, which structural differences between holo ensemble and apo ensembles result in the observed shift to more positive scores for docking into the apo MD ensembles as observed in Figure 8?
To answer those questions, detailed analysis was performed characterizing the structural changes of the protein relevant to ligand binding by distances between residues of the binding site. In detail, the backbone of each amino acid is represented by the Cα atom and one atom represents the side-chain of each residue (except glycine): Cβ for Ala, Nε for Arg, Cγ for Asn, Cγ for Asp, Sγ for Cys, Cδ for Gln, Cδ for Glu, Cγ for His, Cγ1 for Ile, Cγ for Leu, Cε for Lys, Sδ for Met, Cγ for Phe, Cγ for Pro, Oγ for Ser, Cβ for Thr, Cδ2 for Trp, Cζ for Tyr, and Cβ for Val. Distances dij are computed between all those representing atoms of the residues that directly interact with the ligand in its bioactive conformations. For thrombin residues His57, Tyr60A, Trp60D, Lys60F, Leu99, Ile174, Asp189, Ala190, Cys191, Glu192, Ser195, Va1213, Trp215, Gly216, Gly219, and Gly226, for acytylcholinesterase residues Asp72, Trp84, Gly119, Tyr121, Ser122, Tyr130, Glu199, Ser200, Phe288, Phe290, Phe330, Phe331, Tyr334, His440, and Gly441 are considered to directly interact with the individual ligands. We assume that the holo MD simulation samples distances between residues in the binding site optimal for the particular protein-ligand complex. We first identify the top-N% ranked poses from docking to the holo ensemble with RMSD < 2.5Å. From these top-N% docking poses, we compute the range of distances for each dij the minimum dij,min and maximum dij,max value for each distance is identified. Two variables describing the deviations from the optimal range of dij ∈ ⌊dij,mindij,max⌋ in positive and negative direction are computed:
| (4a) |
and
| (4b) |
This separation into smaller and larger than optimal dij values is due to the assumption that values that are too small might not provide enough space for binding the ligand in this particular moiety of the binding site, whereas excessively large distances might not provide optimal interactions between ligand and protein, resulting in a shift to more unfavorable score values.
To address the first question, which structural variations lead to failure in identifying nativelike binding poses, we correlated the RMSD of the binding poses to the native ligand conformation with and , characterizing the relative positions of amino acids in the binding site and their deviations from the optimal holo protein structure. We performed multi-linear regression analysis for all four ligands in Figure 8 using SAS software49 correlating and with the RMSD deviation from the native ligand conformation:
| (5a) |
where c0, , are the regression coefficients. For the definition of dij,min and dij,max all top-ranked poses from docking into the holo ensemble with RMSD < 2.5Å were considered (N=100). The optimal set of and are identified using stepwise regression. To ensure low multicolinearity among the predictors, Variance Inflation (VIF) is utilized to monitor the degree of multicolinearity in the model. The VIFs for all descriptors in the model are aimed to be smaller than 5. To achieve this goal, the significance level to stay (SLS) in the model is set to between 0.0001 and 0.0549.
The results for all four ligands are presented as Supporting Information S2. In the following discussion, we will focus on the structural interpretation of the results for DA2K as an example. For DA2K binding to thrombin, eleven descriptors are identified in the multi-linear regression with an overall regression coefficient of r2 = 0.75. Five out of eleven descriptors are distances that include the side chain-representing atom Cδ of Glu192 suggesting that the conformation of this particular residue is crucial for DA2K binding. Furthermore, a single descriptor d<(Cδ,Glu192−Cα,Trp60D) explains about one half of the total variance in the RMSD data. In the context of the X-ray structure of DA2K-bound thrombin (see Figure 9a), a side-chain orientation of Glu192 located closer to the opposite site of the binding pocket (here represented by Trp60D) does not allow enough space for binding DA2K in its native conformation. This inward-pointing conformation of Glu192 is predominant in the short apo simulation (percentage of d(Cδ,Glu192−Cα,Trp60D)<dmin(Cδ,Glu192−Cα,Trp60D) is 100%). Thus, no native-like binding poses could be identified when docking to the short-apo MD simulation. Although the short apo MD simulation doesn't have enough time to sample Glu192 side-chain conformations with d(Cδ, Glu192−Cα, Trp60D) values larger than dmin(Cδ, Glu192−Cα, Trp60D), that is not the case for the long apo MD simulation, where Glu192 conformations are identified with d(Cδ,Glu192−CαTrp60D)>dmin(Cδ,Glu192−CαTrp60D) in more than 70% of all snapshots.
Figure 9.

DA2K-bound X-ray structure of thrombin (top panel) with (a) distances that cause non-native binding poses when (magenta) smaller, or (black) smaller or larger than the corresponding distances in the holo MD ensemble. (b) Distances that cause more positive predicted binding affinities when larger than the poses resulting in lowest predicted free energies. The histograms for the distances in (b) for holo, long apo and ligand-model ensemble are shown in (c: d(Cα,His57 - Cα,Glu192)) and (d: d(Cδ2,Trp60D - Cα,Asp189)). dij,min and dij,max are displayed as dashed vertical lines in (c) and (d).
A similar probability of obtaining native-like poses is achieved for long apo and ligand-model docking simulations (see Figure 8d). The score, however, of the good binding poses of the long apo docking simulation is significantly shifted to less favorable values, resulting in a native-like RCS pose being ranked outside of the top-10.
To address the question why the score for good binding poses is shifted to positive values for the long apo simulation with respect to holo and also ligand-model docking simulations, we performed a multi-linear regression analysis between score and distance descriptors and , focusing only on good binding poses:
| (5b) |
The range of optimal dij values (dij,min <dij < dij,max) was defined by the range of dij values for the top-5% highest ranked poses from the holo MD docking simulations. Details of the multi-linear regression for all four compounds from Figure 8 can be found as Supporting Information S3. Only two descriptors, d>(Cα,His57 - Cα,Glu192) and d>(Cδ2,Trp60D - Cα,Asp189)), are needed to explain 68% of the score variance of DA2K docked into the various ensembles. Both distances include two residues that snuggly accommodate the ligand from two almost opposite sites and thus stabilize the native ligand conformation (Figure 9b). Trp60D even fills a small cleft in the ligand similar to a wedge. On the opposite side, Asp189 forms crucial salt bridges with the guanidinium group of the ligand. If the distance between both those residues is too large, an optimal interaction between protein and ligand is unlikely. As shown in Figure 9d, the distance between holo and ligand-model is quite similar. Due to the lack of a stabilizing effect of ligand or ligand model in the long apo simulation, predominantly larger distances are sampled between Trp60D and Asp189. The same shift to longer distances from the holo to the long apo docking ensemble is observed in Figure 9c for the residue pair His57-Glu192. In the ligand-model ensemble, however, the distances are on average also slightly shifted to larger values, resulting in slightly worse docking performance when compared to the holo-docking simulations.
Binding affinity prediction using RCS on apo and ligand-model trajectories
In a final experiment we addressed the question of whether the improved incorporation of holo-like protein structures using the ligand-model approach can yield a more accurate prediction of binding affinities using RCS. We docked 14 ligands with known binding affinities from a single laboratory into the ligand-model and long apo simulation ensemble of thrombin. Docking into the apo MD simulation resulted in an r2 = 0.51, and docking to the ligand-model MD simulation resulted in an r2 = 0.69 using the RCS pose with lowest RMSD to the x-ray structures (see Supporting Information S4 for details). Observed correlations between experimental and predicted binding affinities using docking and scoring methods are often dominated or at least strongly influenced by the inherent relationship between affinity and size of the ligands.50, 51 To test the specificity of our correlation we computed the r2 value of experimental affinity with the number of heavy atoms, approximately representing the size of each ligands. The resulting r2 of 0.31 suggests that there is some correlation between affinity and size of the ligand but that the correlation between predicted and experimental binding affinities using docking into the ligand-model MD ensemble is significantly stronger than the correlation by size only, and also stronger than the correlation obtained by docking into the apo MD ensemble.
Binding specificity prediction using RCS on DHFR
Including protein flexibility into structure-based virtual screening generates a larger pool of potential target conformations which can expand the chemical space of identified potential hits. As pointed out by Carlson and co-workers38, this increase in potentially accessible chemical space might on the other hand allow the binding of more promiscuous ligands that must be separated from high affinity ligands using the scoring function. Considering the known issues with scoring functions used in docking, this increased pool of potential binders can finally result in reduced performance of the virtual screening protocol. This raises the question whether the previously demonstrated improvement in predicting binding modes and binding affinities compared to utilizing a static protein structure can compensate the expected reduction in selectivity prediction performance. Based on the suggestion of one of the referees, we approached the question by predicting selectivity between three different DHFR species (human = hDHFR, P. carinii = pcDHFR, C. albicans = caDHFR). 20 high affinity ligands were selected for hDHFR and pcDHFR, and 19 ligands for caDHFR from Carlson and co-workers.38 These 59 ligands were docked into each of the three species and enrichment of the species-specific high affinity ligands against the other 39 or 40 compounds was computed (Figure 10). Virtual screening studies were performed on a static protein structure and on the Limoc-sampled protein structures utilizing RCS.
Figure 10.
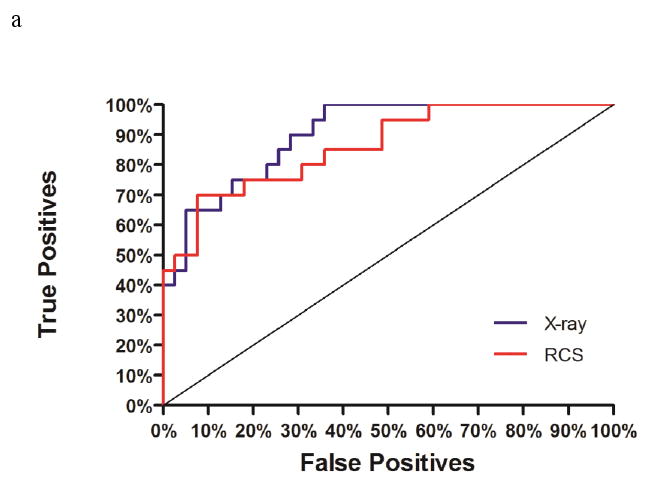
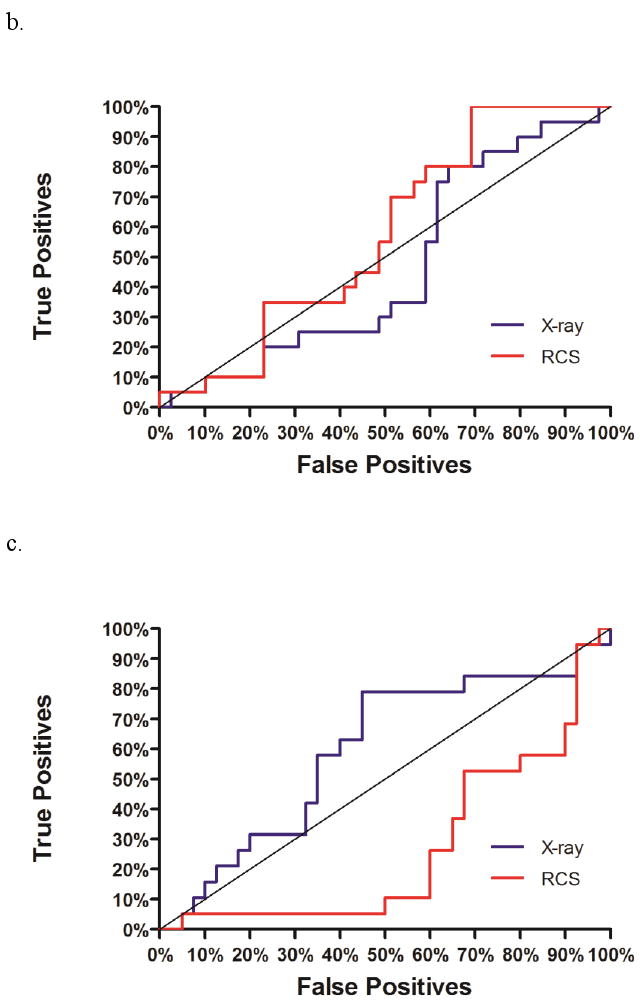
ROC curves for selectivity prediction accuracy of high-affinity ligands binding to three different DHFR species (a: hDHFR, b: pcDHFR, c: caDHFR). Plots of true positives (e.g. hDHFR-specific ligands for hDHFR) versus false positives (e.g. caDHFR- and pcDHFR-specific ligands for hDHFR) are displayed for docking to the X-ray structure (blue) or Limoc-generated conformational ensemble (red) of each DHFR species.
The area-under-the-curve (AUC) of the ROC plot ‘True positives versus false positives” (Figure 10) was computed for all three DHFR species. Using the static X-ray structure only hDHFR displays significant enrichment (AUC = 0.90; ideal = 1.0; random = 0.5) whereas no significant enrichment was observed for pcDHFR (AUC = 0.47) and caDHFR (0.59). Performing the same studies using the Limoc-RCS scheme similar enrichment for hDHFR (0.86), slightly improved enrichment for pcDHFR (0.57) and a drop in enrichment for caDHFR (0.27) was obtained.
We attribute this latter drop in enrichment to the combination of three factors: First, caDHFR-specific ligands are typically smaller than the selected hDHFR-specific ligands. Second, the scoring function is additive in character exaggerating the influence of ligand size onto binding affinity. Third, the scoring function of AutoDock Vina doesn't display strong energetic differentiation between hDHFR- and caDHFR-specific ligands binding to the static caDHFR structure; the score for 90% of the compounds ranges from -8.3 to -7.1 kcal/mol. Considering that there is no conformational change observed between apo and several holo structures for caDHFR (based on a superposition of 1ai9 with 1aoe, 1ia1, 1ia2, 1m7a, 1m78, 1m79 using PyMOL), the apo X-ray structure of caDHFR is optimally adapted to bind caDHFR-specific ligands. Thus, small conformational changes in the protein provide alternative structures that can accommodate hDHFR-specific ligands but do not additionally favor the binding of caDHFR-specific ligands. As a result, the binding affinity of hDHFR-specific ligands relative to caDHFR-specific ligands is increased in schemes that include protein flexibility into docking. Together with the three previously mentioned factors, this explains why hDHFR-specific ligands are ranked higher in the Limoc-RCS scheme compared to the static docking scheme. This trend is unlikely to be specific to the Limoc-RCS scheme but will probably be observed for other approaches that include protein flexibility in conjunction with additive scoring function such as AutoDock Vina.
Furthermore, utilizing receptor-based pharmacophore models based on multiple X-ray structures for the same three DHFR species, Carlson and co-workers also observed that caDHFR-models performed poorer in identifying species-specific ligands compared to hDHFR-and pcDHFR models.38
Conclusions
We have presented the development and validation of a new methodology, named the ‘ligand-model’ concept (“Limoc”), to sample protein conformations that are relevant for binding structurally diverse sets of ligands and that are unbiased towards a particular class of ligands. In this concept, MD simulations are performed with a virtual ligand, represented by a collection of functional groups, which binds to the protein. The ligand model dynamically changes its shape and properties during the simulations, essentially representing a large ensemble of different chemical species binding to the same target protein. We demonstrated that this approach allows sampling of protein conformations relevant to its interaction with different ligands. In combination with RCS, we obtained significant improvement in docking success compared to docking simulations into the ensembles of protein structures generated in short and long apo MD simulations: First, the percentage of reproducing native-like poses (RMSD < 2.5Å) for 31 compounds binding to thrombin or acetylcholinesterase among the top-1, -2, -5, -10 ranked RCS poses increased by between 16% and 29% compared with the long apo simulation docking results. Second, distances between amino acids in the binding site, that are critical for ligand binding, are more similar to the holo structure in the ligand-model MD ensemble than in the apo ensembles. That yields to the observed shift to more negative binding free energies for the ligand-model docking results compared to those of the apo simulations. Third, a stronger correlation between experimental and predicted binding affinity was observed for the RCS poses resulting from the ligand-model ensemble compared to the apo ensemble. That suggests that our ligand-model approach, in conjunction with RCS, is able to predict binding affinities and rank structurally diverse compounds more accurately.
We emphasize that our approach does not require knowledge of a ligand-bound X-ray structure. The co-crystallized ligands are currently only used to define the space of the binding pocket. For both systems discussed here, the sampling of protein conformations with the ligand-model concept started from an unbound structure. We also point out, however, that with the current implementation of the ligand-model approach it is only feasible to sample protein conformations that are distinct by approximately 1-2Å RMSD. Although it is possible to combine our approach with other protein conformational search methods (e.g. elastic network models,52-58 loop prediction,59-64 etc.) for sampling large conformational changes, we do not expect the ligand-model approach alone to be feasible for sampling large scale changes in protein structure, such as alternative loop conformation or large hinge-bending motions. Despite these shortcomings, however, the ‘ligand-model’ concept should prove to be a valuable tool for exposing previously inaccessible protein conformations.
Supplementary Material
Acknowledgments
We thank Dave Nichols, Matthew Danielson, Bingjie Hu, Laura Kingsley, Jared Thompson and Gregory Wilson for critical reading of the manuscript. M.A.L. thanks the National Institutes of Health (GM085604 and GM092855) for funding the present research.
Footnotes
Supporting Information Available. Compounds used for DHFR-selectivity predictions, results of multi-linear regression analysis of RMSD/score as a function of distances between protein residues in binding pocket; predicted versus experimental binding affinity for 14 thrombin ligands. This material is available free of charge via the Internet at http://pubs.acs.org.
Reference List
- 1.Zwanzig RW. High-Temperature Equation of State by A Perturbation Method. 1. Nonpolar Gases. J Chem Phys. 1954;22:1420–1426. [Google Scholar]
- 2.Kirkwood JG. Statistical mechanics of fluid mixtures. J Chem Phys. 1935;3:300–313. [Google Scholar]
- 3.Aqvist J, Medina C, Samuelsson JE. A new method for predicting binding affinity in computer-aided drug design. Protein Eng. 1994;7:385–391. doi: 10.1093/protein/7.3.385. [DOI] [PubMed] [Google Scholar]
- 4.Srinivasan J, Miller J, Kollman PA, Case DA. Continuum solvent studies of the stability of RNA hairpin loops and helices. J Biomol Struct Dyn. 1998;16:671–682. doi: 10.1080/07391102.1998.10508279. [DOI] [PubMed] [Google Scholar]
- 5.Cheng T, Li X, Li Y, Liu Z, Wang R. Comparative assessment of scoring functions on a diverse test set. J Chem Inf Model. 2009;49:1079–1093. doi: 10.1021/ci9000053. [DOI] [PubMed] [Google Scholar]
- 6.Teague SJ. Implications of protein flexibility for drug discovery. Nat Rev Drug Discov. 2003;2:527–541. doi: 10.1038/nrd1129. [DOI] [PubMed] [Google Scholar]
- 7.Carlson HA. Protein flexibility and drug design: how to hit a moving target. Curr Opin Chem Biol. 2002;6:447–452. doi: 10.1016/s1367-5931(02)00341-1. [DOI] [PubMed] [Google Scholar]
- 8.Zavodszky MI, Lei M, Thorpe MF, Day AR, Kuhn LA. Modeling correlated main-chain motions in proteins for flexible molecular recognition. Proteins. 2004;57:243–261. doi: 10.1002/prot.20179. [DOI] [PubMed] [Google Scholar]
- 9.Sousa SF, Fernandes PA, Ramos MJ. Protein-ligand docking: current status and future challenges. Proteins. 2006;65:15–26. doi: 10.1002/prot.21082. [DOI] [PubMed] [Google Scholar]
- 10.Mizutani MY, Takamatsu Y, Ichinose T, Nakamura K, Itai A. Effective handling of induced-fit motion in flexible docking. Proteins. 2006;63:878–891. doi: 10.1002/prot.20931. [DOI] [PubMed] [Google Scholar]
- 11.Sherman W, Day T, Jacobson MP, Friesner RA, Farid R. Novel procedure for modeling ligand/receptor induced fit effects. J Med Chem. 2006;49:534–553. doi: 10.1021/jm050540c. [DOI] [PubMed] [Google Scholar]
- 12.Corbeil CR, Moitessier N. Docking ligands into flexible and solvated macromolecules. 3. Impact of input ligand conformation, protein flexibility, and water molecules on the accuracy of docking programs. J Chem Inf Model. 2009;49:997–1009. doi: 10.1021/ci8004176. [DOI] [PubMed] [Google Scholar]
- 13.Englebienne P, Moitessier N. Docking ligands into flexible and solvated macromolecules. 4. Are popular scoring functions accurate for this class of proteins? J Chem Inf Model. 2009;49:1568–1580. doi: 10.1021/ci8004308. [DOI] [PubMed] [Google Scholar]
- 14.Lin JH. Accommodating Protein Flexibility for Structure-Based Drug Design. Curr Top Med Chem. 2010 doi: 10.2174/156802611794863580. [DOI] [PubMed] [Google Scholar]
- 15.Rao C, Subramanian J, Sharma SD. Managing protein flexibility in docking and its applications. Drug Discov Today. 2009;14:394–400. doi: 10.1016/j.drudis.2009.01.003. [DOI] [PubMed] [Google Scholar]
- 16.Sotriffer CA. Accounting for Induced-Fit Effects in Docking: What is Possible and What is Not. Curr Top Med Chem. 2010 doi: 10.2174/156802611794863544. [DOI] [PubMed] [Google Scholar]
- 17.Cozzini P, Kellogg GE, Spyrakis F, Abraham DJ, Costantino G, Emerson A, Fanelli F, Gohlke H, Kuhn LA, Morris GM, Orozco M, Pertinhez TA, Rizzi M, Sotriffer CA. Target flexibility: an emerging consideration in drug discovery and design. J Med Chem. 2008;51:6237–6255. doi: 10.1021/jm800562d. [DOI] [PMC free article] [PubMed] [Google Scholar]
- 18.Ferrari AM, Wei BQ, Costantino L, Shoichet BK. Soft docking and multiple receptor conformations in virtual screening. J Med Chem. 2004;47:5076–5084. doi: 10.1021/jm049756p. [DOI] [PMC free article] [PubMed] [Google Scholar]
- 19.Knegtel RM, Kuntz ID, Oshiro CM. Molecular docking to ensembles of protein structures. J Mol Biol. 1997;266:424–440. doi: 10.1006/jmbi.1996.0776. [DOI] [PubMed] [Google Scholar]
- 20.Leach AR. Ligand docking to proteins with discrete side-chain flexibility. J Mol Biol. 1994;235:345–356. doi: 10.1016/s0022-2836(05)80038-5. [DOI] [PubMed] [Google Scholar]
- 21.Hart TN, Read RJ. A multiple-start Monte Carlo docking method. Proteins. 1992;13:206–222. doi: 10.1002/prot.340130304. [DOI] [PubMed] [Google Scholar]
- 22.Lill MA, Dobler M, Vedani A. Prediction of small-molecule binding to cytochrome P450 3A4: flexible docking combined with multidimensional QSAR. ChemMedChem. 2006;1:73–81. doi: 10.1002/cmdc.200500024. [DOI] [PubMed] [Google Scholar]
- 23.Davis IW, Baker D. RosettaLigand docking with full ligand and receptor flexibility. J Mol Biol. 2009;385:381–392. doi: 10.1016/j.jmb.2008.11.010. [DOI] [PubMed] [Google Scholar]
- 24.Carlson HA, Masukawa KM, Rubins K, Bushman FD, Jorgensen WL, Lins RD, Briggs JM, McCammon JA. Developing a dynamic pharmacophore model for HIV-1 integrase. J Med Chem. 2000;43:2100–2114. doi: 10.1021/jm990322h. [DOI] [PubMed] [Google Scholar]
- 25.Lin JH, Perryman AL, Schames JR, McCammon JA. The relaxed complex method: Accommodating receptor flexibility for drug design with an improved scoring scheme. Biopolymers. 2003;68:47–62. doi: 10.1002/bip.10218. [DOI] [PubMed] [Google Scholar]
- 26.Lin JH, Perryman AL, Schames JR, McCammon JA. Computational drug design accommodating receptor flexibility: the relaxed complex scheme. J Am Chem Soc. 2002;124:5632–5633. doi: 10.1021/ja0260162. [DOI] [PubMed] [Google Scholar]
- 27.Kua J, Zhang Y, McCammon JA. Studying enzyme binding specificity in acetylcholinesterase using a combined molecular dynamics and multiple docking approach. J Am Chem Soc. 2002;124:8260–8267. doi: 10.1021/ja020429l. [DOI] [PubMed] [Google Scholar]
- 28.Csermely P, Palotai R, Nussinov R. Induced fit, conformational selection and independent dynamic segments: an extended view of binding events. Trends Biochem Sci. 2010;35:539–546. doi: 10.1016/j.tibs.2010.04.009. [DOI] [PMC free article] [PubMed] [Google Scholar]
- 29.Kar G, Keskin O, Gursoy A, Nussinov R. Allostery and population shift in drug discovery. Curr Opin Pharmacol. 2010 doi: 10.1016/j.coph.2010.09.002. [DOI] [PMC free article] [PubMed] [Google Scholar]
- 30.Ozbabacan SE, Gursoy A, Keskin O, Nussinov R. Conformational ensembles, signal transduction and residue hot spots: application to drug discovery. Curr Opin Drug Discov Devel. 2010;13:527–537. [PubMed] [Google Scholar]
- 31.Nevo R, Brumfeld V, Elbaum M, Hinterdorfer P, Reich Z. Direct discrimination between models of protein activation by single-molecule force measurements. Biophys J. 2004;87:2630–2634. doi: 10.1529/biophysj.104.041889. [DOI] [PMC free article] [PubMed] [Google Scholar]
- 32.McGovern SL, Shoichet BK. Information decay in molecular docking screens against holo, apo, and modeled conformations of enzymes. J Med Chem. 2003;46:2895–2907. doi: 10.1021/jm0300330. [DOI] [PubMed] [Google Scholar]
- 33.Murray CW, Baxter CA, Frenkel AD. The sensitivity of the results of molecular docking to induced fit effects: application to thrombin, thermolysin and neuraminidase. J Comput Aided Mol Des. 1999;13:547–562. doi: 10.1023/a:1008015827877. [DOI] [PubMed] [Google Scholar]
- 34.Hoffmann D, Kramer B, Washio T, Steinmetzer T, Rarey M, Lengauer T. Two-stage method for protein-ligand docking. J Med Chem. 1999;42:4422–4433. doi: 10.1021/jm991090p. [DOI] [PubMed] [Google Scholar]
- 35.Obst U, Banner DW, Weber L, Diederich F. Molecular recognition at the thrombin active site: Structure-based design and synthesis of potent and selective thrombin inhibitors and the x-ray crystal structures of two thrombin-inhibitor complexes. Chem Biol. 1997;4:287–295. doi: 10.1016/s1074-5521(97)90072-7. [DOI] [PubMed] [Google Scholar]
- 36.Schweizer E, Hoffmann-Roder A, Olsen JA, Seiler P, Obst-Sander U, Wagner B, Kansy M, Banner DW, Diederich F. Multipolar interactions in the D pocket of thrombin: large differences between tricyclic imide and lactam inhibitors. Org Biomol Chem. 2006;4:2364–2375. doi: 10.1039/b602585d. [DOI] [PubMed] [Google Scholar]
- 37.Schweizer E, Hoffmann-Roder A, Scharer K, Olsen JA, Fah C, Seiler P, Obst-Sander U, Wagner B, Kansy M, Diederich F. A fluorine scan at the catalytic center of thrombin: C-F, C-OH, and C-OMe bioisosterism and fluorine effects on pK(a) and log(D) values. ChemMedChem. 2006;1:611–621. doi: 10.1002/cmdc.200600015. [DOI] [PubMed] [Google Scholar]
- 38.Bowman AL, Lerner MG, Carlson HA. Protein flexibility and species specificity in structure-based drug discovery: dihydrofolate reductase as a test system. J Am Chem Soc. 2007;129:3634–3640. doi: 10.1021/ja068256d. [DOI] [PubMed] [Google Scholar]
- 39.Trott O, Olson AJ. AutoDock Vina: improving the speed and accuracy of docking with a new scoring function, efficient optimization, and multithreading. J Comput Chem. 2010;31:455–461. doi: 10.1002/jcc.21334. [DOI] [PMC free article] [PubMed] [Google Scholar]
- 40.Lill MA, Danielson ML. Computer-aided drug design platform using PyMOL. J Comput Aided Mol Des. 2011;25:13–19. doi: 10.1007/s10822-010-9395-8. [DOI] [PubMed] [Google Scholar]
- 41.Morris GM, Huey R, Lindstrom W, Sanner MF, Belew RK, Goodsell DS, Olson AJ. AutoDock4 and AutoDockTools4: Automated docking with selective receptor flexibility. J Comput Chem. 2009;30:2785–2791. doi: 10.1002/jcc.21256. [DOI] [PMC free article] [PubMed] [Google Scholar]
- 42.Case DA, Cheatham TE, III, Darden T, Gohlke H, Luo R, Merz KM, Jr, Onufriev A, Simmerling C, Wang B, Woods RJ. The Amber biomolecular simulation programs. J Comput Chem. 2005;26:1668–1688. doi: 10.1002/jcc.20290. [DOI] [PMC free article] [PubMed] [Google Scholar]
- 43.Kutzner C, van der SD, Fechner M, Lindahl E, Schmitt UW, de Groot BL, Grubmuller H. Speeding up parallel GROMACS on high-latency networks. J Comput Chem. 2007;28:2075–2084. doi: 10.1002/jcc.20703. [DOI] [PubMed] [Google Scholar]
- 44.van der SD, Lindahl E, Hess B, Groenhof G, Mark AE, Berendsen HJ. GROMACS: fast, flexible, and free. J Comput Chem. 2005;26:1701–1718. doi: 10.1002/jcc.20291. [DOI] [PubMed] [Google Scholar]
- 45.Kortvelyesi T, Dennis S, Silberstein M, Brown L, III, Vajda S. Algorithms for computational solvent mapping of proteins. Proteins. 2003;51:340–351. doi: 10.1002/prot.10287. [DOI] [PubMed] [Google Scholar]
- 46.Eisenhaber F, Lijnzaad P, Argos P, Sander C, Scharf M. The Double Cubic Lattice Method - Efficient Approaches to Numerical-Integration of Surface-Area and Volume and to Dot Surface Contouring of Molecular Assemblies. J Comput Chem. 1995;16:273–284. [Google Scholar]
- 47.Eisenhaber F, Argos P. Improved Strategy in Analytic Surface Calculation for Molecular-Systems - Handling of Singularities and Computational-Efficiency. J Comput Chem. 1993;14:1272–1280. [Google Scholar]
- 48.Roitberg A, Elber R. Modeling side chains in peptides and proteins: Application of the locally enhanced sampling technique and the simulated annealing methods to find minimum energy conformations. J Chem Phys. 1991;95:9277–9287. [Google Scholar]
- 49.The multilinear regression data analysis for this paper was generated using SAS software, Version 9.2 of the SAS system for Windows, Copyright © 2002-2008, SAS Institute Inc. SAS and all other SAS Institute Inc. product or service names are registered trademarks or trademarks of SAS Institute Inc., Cary, NC, USA. 2010.
- 50.Ferrara P, Gohlke H, Price DJ, Klebe G, Brooks CL., III Assessing scoring functions for protein-ligand interactions. J Med Chem. 2004;47:3032–3047. doi: 10.1021/jm030489h. [DOI] [PubMed] [Google Scholar]
- 51.Kuntz ID, Chen K, Sharp KA, Kollman PA. The maximal affinity of ligands. Proc Natl Acad Sci U S A. 1999;96:9997–10002. doi: 10.1073/pnas.96.18.9997. [DOI] [PMC free article] [PubMed] [Google Scholar]
- 52.Bahar I, Rader AJ. Coarse-grained normal mode analysis in structural biology. Curr Opin Struct Biol. 2005;15:586–592. doi: 10.1016/j.sbi.2005.08.007. [DOI] [PMC free article] [PubMed] [Google Scholar]
- 53.Bahar I, Lezon TR, Yang LW, Eyal E. Global Dynamics of Proteins: Bridging Between Structure and Function. Ann Rev Biophys. 2010;39:23–42. doi: 10.1146/annurev.biophys.093008.131258. [DOI] [PMC free article] [PubMed] [Google Scholar]
- 54.Chennubhotla C, Rader AJ, Yang LW, Bahar I. Elastic network models for understanding biomolecular machinery: From enzymes to supramolecular assemblies. Phys Biol. 2005;2:S173–S180. doi: 10.1088/1478-3975/2/4/S12. [DOI] [PubMed] [Google Scholar]
- 55.Keating KS, Flores SC, Gerstein MB, Kuhn LA. StoneHinge: Hinge prediction by network analysis of individual protein structures. Protein Sci. 2009;18:359–371. doi: 10.1002/pro.38. [DOI] [PMC free article] [PubMed] [Google Scholar]
- 56.Kuhn LA, Zavodszky MI, Thorpe MF, Lei M. Balancing large and small scale flexibility in protein : ligand docking. Abstr Paper Am Chem Soc Natl Meet. 2003;225:U743. [Google Scholar]
- 57.Rader AJ, Hespenheide BM, Kuhn LA, Thorpe MF. Protein unfolding: rigidity lost. Proc Natl Acad Sci U S A. 2002;99:3540–3545. doi: 10.1073/pnas.062492699. [DOI] [PMC free article] [PubMed] [Google Scholar]
- 58.Thorpe MF, Lei M, Rader AJ, Jacobs DJ, Kuhn LA. Protein flexibility and dynamics using constraint theory. J Mol Graph Model. 2001;19:60–69. doi: 10.1016/s1093-3263(00)00122-4. [DOI] [PubMed] [Google Scholar]
- 59.Xiang Z, Soto CS, Honig B. Evaluating conformational free energies: the colony energy and its application to the problem of loop prediction. Proc Natl Acad Sci U S A. 2002;99:7432–7437. doi: 10.1073/pnas.102179699. [DOI] [PMC free article] [PubMed] [Google Scholar]
- 60.Jacobson MP, Pincus DL, Rapp CS, Day TJ, Honig B, Shaw DE, Friesner RA. A hierarchical approach to all-atom protein loop prediction. Proteins. 2004;55:351–367. doi: 10.1002/prot.10613. [DOI] [PubMed] [Google Scholar]
- 61.Zhang C, Liu S, Zhou Y. Accurate and efficient loop selections by the DFIRE-based all-atom statistical potential. Protein Sci. 2004;13:391–399. doi: 10.1110/ps.03411904. [DOI] [PMC free article] [PubMed] [Google Scholar]
- 62.Zhu K, Pincus DL, Zhao S, Friesner RA. Long loop prediction using the protein local optimization program. Proteins. 2006;65:438–452. doi: 10.1002/prot.21040. [DOI] [PubMed] [Google Scholar]
- 63.Zhu K, Shirts MR, Friesner RA. Improved methods for side chain and loop predictions via the protein local optimization program: Variable dielectric model for implicitly improving the treatment of polarization effects. J Chem Theory Comput. 2007;3:2108–2119. doi: 10.1021/ct700166f. [DOI] [PubMed] [Google Scholar]
- 64.Danielson ML, Lill MA. New computational method for prediction of interacting protein loop regions. Proteins. 2010;78:1748–1759. doi: 10.1002/prot.22690. [DOI] [PubMed] [Google Scholar]
Associated Data
This section collects any data citations, data availability statements, or supplementary materials included in this article.