With the phase-contrast vastly undersampled isotropic projection technique described for MR velocity mapping, it was possible to noninvasively measure the hemodynamic significance of renal artery stenosis in a laboratory study with ventilated swine.
Abstract
Purpose:
To compare noninvasive transstenotic pressure gradient (TSPG) measurements derived from high-spatial- and temporal-resolution four-dimensional magnetic resonance (MR) flow measurements with invasive measurements obtained from endovascular pressure wires with digital subtraction angiographic guidance.
Materials and Methods:
After Animal Care and Use Committee approval, bilateral renal artery stenosis (RAS) was created surgically in 12 swine. Respiratory-gated phase-contrast vastly undersampled isotropic projection (VIPR) MR angiography of the renal arteries was performed with a 1.5-T clinical MR system (repetition time, 11.4 msec; echo time [first echo], 3.7 msec; 18 000 projection angles; imaging volume, 260 × 260 × 200 mm; acquired isotropic spatial resolution, 1.0 × 1.0 × 1.0 mm; velocity encoding, 150 cm/sec). Velocities measured with phase-contrast VIPR were used to calculate TSPGs by using Navier-Stokes equations. These were compared with endovascular pressure measurements (mean and peak) performed by using fluoroscopic guidance with regression analysis.
Results:
In 19 renal arteries with an average stenosis of 62% (range, 0%–87%), there was excellent correlation between the noninvasive TSPG measurement with phase-contrast VIPR and invasive TSPG measurement for mean TSPG (R2 = 95.4%) and strong correlation between noninvasive TSPG and invasive TSPG for the peak TSPG measures (R2 = 82.6%). The phase-contrast VIPR–derived TSPG measures were slightly lower than the endovascular measurements. In four arteries with severe stenoses and one occlusion (mean, 86%; range, 75%–100%), the residual lumen within the stenosis was too small to determine TSPG with phase-contrast VIPR.
Conclusion:
The unenhanced MR angiographic technique with phase-contrast VIPR allows for accurate noninvasive assessment of hemodynamic significance in a porcine model of RAS with highly accurate TSPG measurements.
© RSNA, 2011
Supplemental material: http://radiology.rsna.org/lookup/suppl/doi:10.1148/radiol.11101175/-/DC1
Introduction
Renal artery stenosis (RAS) is a recognized cause of hypertension and progressive renal insufficiency. RAS occurs in up to 45% of patients with peripheral vascular disease (1). These patients will often undergo percutaneous transluminal angioplasty or stent placement if a renal artery is found to have a hemodynamically significant stenosis (75% luminal reduction or more). However, the hemodynamic significance of a mild to moderate RAS (40%–75%) cannot be reliably derived from vessel diameter measurements alone (2), and additional tests are required for decision on proper treatment strategies. This information is generally acquired with intraarterial pressure measurements (3–6), differential renal vein renin samples (7), or duplex ultrasonography (US) (8). Intraarterial pressure measurements require an arterial puncture and catheterization with the associated risks and radiation exposure. Renal vein renin sampling also requires an interventional procedure. Duplex US is noninvasive but highly operator dependent with failure rates reported as high as 20% (9,10), and failure rates increase with increasing body mass index. The recognized reference standard is the use of intraarterial pressure measurements obtained during x-ray angiography. A peak systolic pressure gradient of more than 20%, or a mean pressure gradient difference of more than 10% across stenosis, is considered hemodynamically significant (11,12).
Magnetic resonance (MR) angiography is widely used for the detection of RAS because it is noninvasive and does not require the use of ionizing radiation or iodinated contrast material. Most RAS occur within the proximal 2 cm of the renal arteries and are well identified at contrast material–enhanced MR angiography (13). Recent advances in MR hardware and acquisition techniques have facilitated patient-tolerable imaging times for velocity-sensitive MR acquisitions with volumetric coverage, three-directional velocity encoding, and cardiac gating (14), also referred to as four-dimensional MR flow. Such acquisitions can provide velocity and flow measurements, as well as derived functional vascular parameters such as pulse wave velocity, wall shear stress, and pressure gradients, in addition to information on vascular anatomy without the need for a contrast agent. Most four-dimensional MR flow studies have focused on the aorta because of constraints in spatial and temporal resolution for this lengthy acquisition scheme. We developed phase-contrast vastly undersampled isotropic projection (VIPR) (15–17), an unenhanced four-dimensional MR flow imaging approach that provides high spatial and temporal resolution at reduced imaging times by employing radial undersampling strategies.
The purpose of this study was to compare the noninvasive transstenotic pressure gradient (TSPG) measurements derived from the rapid unenhanced vastly undersampled phase-contrast four-dimensional MR flow approach with invasive measurements obtained from endovascular pressure wires with digital subtraction angiographic (DSA) guidance.
Materials and Methods
Surgery
After Animal Care and Use Committee protocol approval, bilateral RAS was created surgically in 12 crossbred juvenile swine from a commercial vendor (Arlington Farms, Arlington, Wis) (mean weight, 36.4 kg ± 1.8 [standard deviation]; range, 34.0–39.3 kg). General anesthesia was induced with 2.2 mg per kilogram of body weight of xylazine hydrochloride (Rompun; Miles Agriculture, Shawnee Mission, Kan) and 7 mg/kg of tiletamine combined with zolazepam (Telazol; Parke-Davis, Morris Plains, NJ). Anesthesia was maintained with 1%–5% isoflurane and 100% oxygen endotracheal ventilation throughout the study. After median laparotomy and establishing hemostasis, the renal arteries were exposed from the aorta and surrounding tissues bilaterally. An MR imaging–compatible cable tie or umbilical cord was placed around the renal artery or a major branch and tightened to a moderate to severe stenosis level by hand, which was controlled by using intraoperative DSA. If vasospasm occurred, 2 mg of verapamil hydrochloride (American Regent, Shirley, NY) was administered selectively into the affected renal artery. The swine received heparin at 1000 IU/kg per hour during the entire course of the imaging study.
Endovascular Pressure Measurements (Reference Standard)
Femoral artery cutdown was performed for catheter access. Three-dimensional rotational flat panel DSA imaging (Innova 4100; GE Healthcare, Waukesha, Wis) and two-dimensional projectional DSA imaging were performed for quantification of the degree of stenosis in eight and four animals, respectively. Bilateral selective renal artery DSA imaging was performed after injection of 16 mL of iohexol (300 mg of iodine per milliliter, Omnipaque 300; GE Healthcare) by using a power injector (Mark V ProVis; Medrad, Indianola, Pa) at 2 mL/sec and with a 2-second x-ray delay. The magnitude of stenosis was calculated by using luminal diameter measurements from DSA data sets.
After selective catheterization of either renal artery, two pressure-sensing guidewires (Certus Pressure Wire; RADI, Uppsala, Sweden) were placed across the stenosis such that the pressure sensors were located approximately 1 cm proximal and distal to the stenosis (Fig 1a). The endovascular pressure measurements in each animal were simultaneously digitized with a sampling rate of 200 Hz and used for the quantification of the TSPG. The direct invasive pressure measurements with DSA guidance and the subsequent noninvasive measurements by using MR imaging were performed sequentially (within 30 minutes) by using a customized MR imaging–DSA suite with a single sliding door between the x-ray and MR systems to ensure minimal delay times between the two measurements.
Figure 1a:
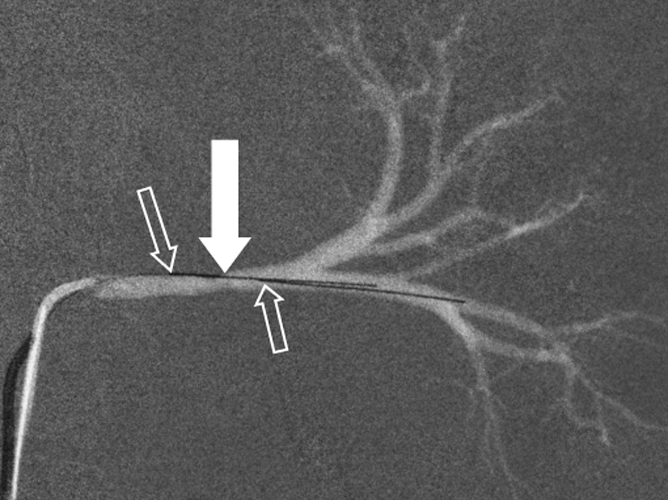
Porcine model of RAS at unenhanced phase-contrast VIPR MR angiography (pig 4). (a) DSA road-map image shows two endovascular pressure-sensing guidewires across a moderate left RAS (solid arrow). Pressure sensors are located at the end of each wire (open arrows). (b) Angiographic maximum intensity projection reconstruction of the complex difference signal obtained from phase-contrast VIPR MR shows stenosis (arrow). (c) Velocity map shows increased velocities (open arrow, color coded in gold and red) distal to RAS (solid arrow). (d) Corresponding pressure (P) map shows a pressure drop across the stenosis (arrow) (Movie [online]).
MR Imaging
Velocity-encoded MR data were acquired with phase-contrast VIPR, a radially undersampled imaging sequence (15). All MR angiographic examinations were performed with a clinical 1.5-T imager (slew rate = 150 mT/m/sec, maximum gradient amplitude = 40 mT/m) (Signa HDx; GE Healthcare) within 20–30 minutes after endovascular measures had been obtained. The phase-contrast VIPR sequence was used for imaging prior to administration of any gadolinium-based intravenous contrast agent by using the following imaging parameters: dual echo, 18 000 projection angles, 10° flip angle, repetition time of 11.4 msec, echo time (first echo) of 3.7 msec, receiver bandwidth of ±62.5 kHz, imaging volume of 260 × 260 × 200 mm, acquired isotropic spatial resolution of 1.0 × 1.0 × 1.0 mm, and velocity encoding of 150 cm/sec (Fig 1c). A dual-echo acquisition was used for improved sampling efficiency (18). Depending on the heart rate, between 15 and 20 cardiac phases were reconstructed with retrospective electrocardiographic gating in each ventilated animal. Respiratory gating was accomplished with a respiratory gating scheme based on bellows readings, which continuously adapted the gating threshold to compensate for potential baseline drifts. Data were acquired with 50% respiratory gating efficiency, extending the imaging time to 11 minutes with slight variations (±10 seconds) due to respiratory gating. In addition, several correction schemes were implemented to help limit T1 saturation effects, trajectory errors, motion, and aliasing associated with radial sampling (18).
Figure 1c:
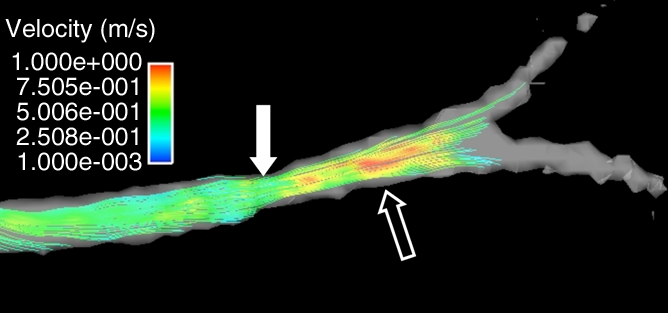
Porcine model of RAS at unenhanced phase-contrast VIPR MR angiography (pig 4). (a) DSA road-map image shows two endovascular pressure-sensing guidewires across a moderate left RAS (solid arrow). Pressure sensors are located at the end of each wire (open arrows). (b) Angiographic maximum intensity projection reconstruction of the complex difference signal obtained from phase-contrast VIPR MR shows stenosis (arrow). (c) Velocity map shows increased velocities (open arrow, color coded in gold and red) distal to RAS (solid arrow). (d) Corresponding pressure (P) map shows a pressure drop across the stenosis (arrow) (Movie [online]).
Pressure gradients in the renal arteries were calculated by using the Navier-Stokes equation on the basis of the analysis of the cine velocity vector fields as measured by using phase-contrast VIPR. An iterative algorithm was used that has been described elsewhere (19,20). In contrast to computational fluid dynamic approaches, the pressure gradients in this study were determined from the measured velocity vector fields throughout the whole vessel (Fig 1d).
Figure 1d:
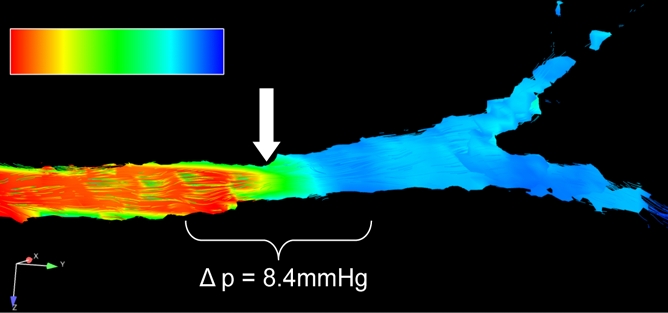
Porcine model of RAS at unenhanced phase-contrast VIPR MR angiography (pig 4). (a) DSA road-map image shows two endovascular pressure-sensing guidewires across a moderate left RAS (solid arrow). Pressure sensors are located at the end of each wire (open arrows). (b) Angiographic maximum intensity projection reconstruction of the complex difference signal obtained from phase-contrast VIPR MR shows stenosis (arrow). (c) Velocity map shows increased velocities (open arrow, color coded in gold and red) distal to RAS (solid arrow). (d) Corresponding pressure (P) map shows a pressure drop across the stenosis (arrow) (Movie [online]).
In addition, MR angiograms in the form of complex difference data sets were created from the phase-contrast VIPR data for the evaluation of vessel anatomy (Fig 1b). Two vascular radiologists (S.B.R. and C.J.F., with 20 and 8 years of experience, respectively) evaluated the degree of RAS by using measurements on the anonymized MR angiographic source images independently and were blinded to other imaging findings and the pressure analysis. The measures were also classified for degree of stenosis with a six-point ranking scale (0 = no stenosis; 1 = <24% luminal narrowing; 2 = mild stenosis, 25%–49% luminal narrowing; 3 = moderate stenosis, 50%–74% luminal narrowing; 4 = severe stenosis, 75%–99% luminal narrowing; and 5 = occlusion).
Figure 1b:
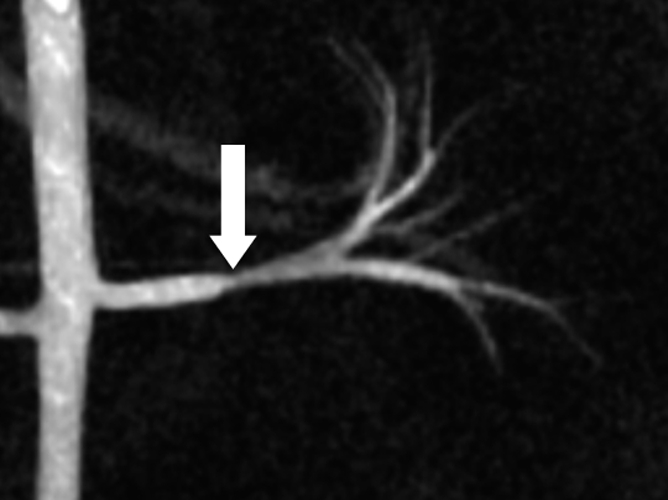
Porcine model of RAS at unenhanced phase-contrast VIPR MR angiography (pig 4). (a) DSA road-map image shows two endovascular pressure-sensing guidewires across a moderate left RAS (solid arrow). Pressure sensors are located at the end of each wire (open arrows). (b) Angiographic maximum intensity projection reconstruction of the complex difference signal obtained from phase-contrast VIPR MR shows stenosis (arrow). (c) Velocity map shows increased velocities (open arrow, color coded in gold and red) distal to RAS (solid arrow). (d) Corresponding pressure (P) map shows a pressure drop across the stenosis (arrow) (Movie [online]).
Statistical Analysis
To assess the degree of agreement between invasively obtained measurements and their phase-contrast VIPR–derived counterparts for mean and peak pressure differences, ordinary least-squares calibration (regression) equations were fitted, with the MR and DSA variables as independent and dependent variables, respectively. Ninety-five percent confidence intervals for slope and intercept were obtained, as well as P values for the hypothesis tests that the slope and intercept were 1 and 0, respectively. The same method was used to assess the degree of agreement between the DSA-derived stenosis measure and the average stenosis measure from both observers. Interreader agreement was assessed with Bland-Altman 95% limits of agreement (21). A P value less than .05 (two-sided) was the criterion for a statistically significant difference. Diagnostic and residual plots were used to examine whether any model assumptions were likely to be violated. Software (version R 2.12.1; R Development Core Team, Vienna, Austria) was used for statistical analysis.
Results
DSA results, endovascular pressure measurements, and phase-contrast VIPR data sets were successfully acquired in all cases. A total of 24 renal arteries in 12 swine were evaluated noninvasively with phase-contrast VIPR and invasively with pressure wire measurements after successful creation of RAS. One renal artery was left patent on purpose, and one renal artery was unintentionally fully occluded. No major complication occurred during surgery.
Various degrees of RAS (minimum, 0%; maximum, 100%; mean, 67.3% stenosis) were achieved; specifically, grade 0 was achieved in one renal artery, grade 1 in no renal arteries, grade 2 in two renal arteries, grade 3 in 11 renal arteries, grade 4 in nine renal arteries, and grade 5 in one renal artery. This resulted in a corresponding mean TSPG of 18.6 mm Hg (range, 0–48.5 mm Hg) and maximum TSPG of 37.4 mm Hg (range, 7.4–66.8 mm Hg) acquired with endovascular pressure-sensing guidewires.
By utilizing phase-contrast VIPR data, TSPG measures were obtained in 19 renal arteries (mean stenosis, 62%; range, 0%–87%). In four cases with severe RAS and one occlusion (stenoses measures: 75%, 80%, 80%, 95%, 100%; mean stenosis, 86%), the residual lumen within the stenosis was so small that TSPG could not be determined by using phase-contrast VIPR measurements. These lesions were excluded from statistical analysis because of lack of comparability. The renal arteries distal to the stenosis could still be visualized except in the one case of complete occlusion. The severity of stenosis based on visual lumen measurements was assessed in all 24 renal arteries on the complex difference images. We also observed one mild segmental RAS that was not visible on the complex difference images but showed associated flow accelerations when we assessed the phase-contrast VIPR data sets (Fig 2).
Figure 2a:
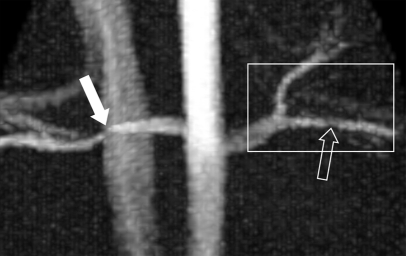
Porcine model of RAS at unenhanced phase-contrast VIPR MR angiography (pig 8). (a) Unenhanced MR angiographic image of the complex differences shows significant main RAS on the right (solid arrow). Mild to moderate stenosis in the left segmental renal artery (open arrow) is not visualized with certainty and was not identified during expert reading of the angiographic image obtained from the phase-contrast VIPR acquisition. (b) Enlarged velocity map of the left segmental renal artery shows increased flow (solid arrow) distal to the stenosis (open arrow). (c) Pressure (P) map calculated from the velocities according to the Navier-Stokes equations shows a pressure gradient across the stenosis (arrow) (Movie [online]).
Figure 2b:
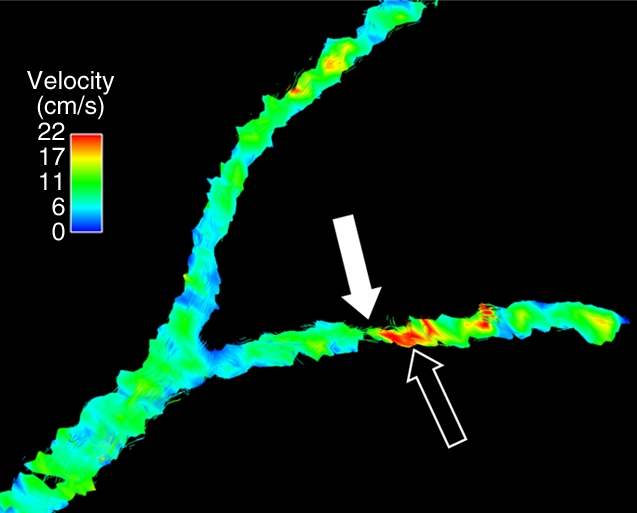
Porcine model of RAS at unenhanced phase-contrast VIPR MR angiography (pig 8). (a) Unenhanced MR angiographic image of the complex differences shows significant main RAS on the right (solid arrow). Mild to moderate stenosis in the left segmental renal artery (open arrow) is not visualized with certainty and was not identified during expert reading of the angiographic image obtained from the phase-contrast VIPR acquisition. (b) Enlarged velocity map of the left segmental renal artery shows increased flow (solid arrow) distal to the stenosis (open arrow). (c) Pressure (P) map calculated from the velocities according to the Navier-Stokes equations shows a pressure gradient across the stenosis (arrow) (Movie [online]).
Figure 2c:
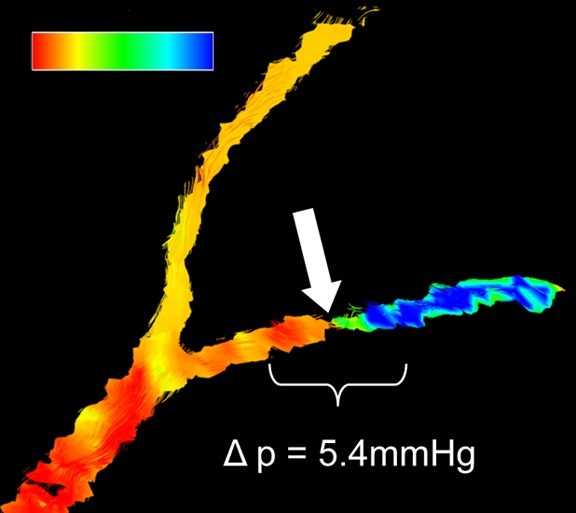
Porcine model of RAS at unenhanced phase-contrast VIPR MR angiography (pig 8). (a) Unenhanced MR angiographic image of the complex differences shows significant main RAS on the right (solid arrow). Mild to moderate stenosis in the left segmental renal artery (open arrow) is not visualized with certainty and was not identified during expert reading of the angiographic image obtained from the phase-contrast VIPR acquisition. (b) Enlarged velocity map of the left segmental renal artery shows increased flow (solid arrow) distal to the stenosis (open arrow). (c) Pressure (P) map calculated from the velocities according to the Navier-Stokes equations shows a pressure gradient across the stenosis (arrow) (Movie [online]).
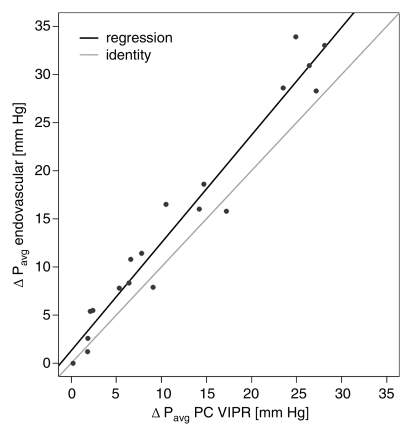
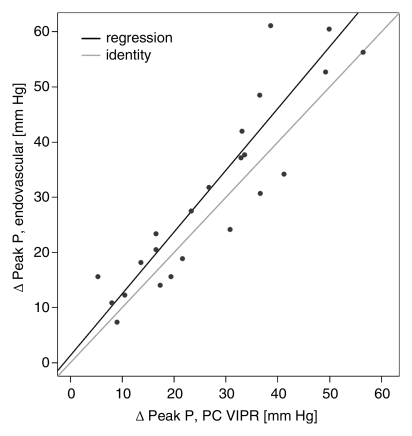
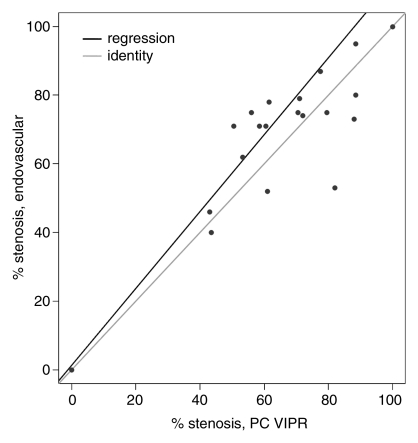
Calibration results obtained from regressing DSA variables with their phase-contrast VIPR equivalents are reported in the Table. For the mean pressure difference (Fig 3a), close linear agreement between the endovascular and the MR measurements was found (R2 = 95.4%). For peak pressure difference, the linear agreement was still strong (Fig 3b), although not as close (R2 = 82.6%). The degree of linear association for percentage of stenosis (Fig 3c) was slightly poorer (R2 = 72.5%), although still acceptable. Bland-Altman analysis of interreader agreement revealed a bias of −1.65% with limits of agreement of −21.8% to 18.5%.
Calibration (Regression) Equation Results of Phase-Contrast VIPR and Endovascular Measures for TSPG and Stenosis
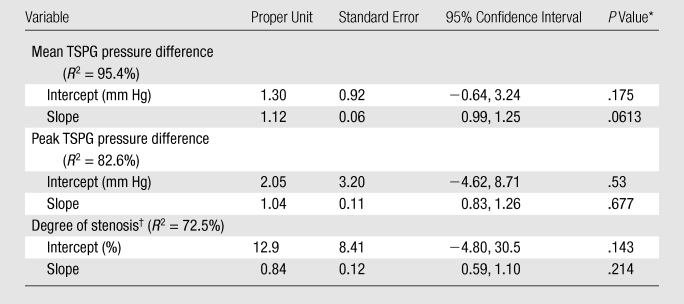
P value for the hypothesis test that the slope was 1 and the intercept was 0.
Average from observers 1 and 2.
Figure 3a:
(a, b) Calibration plots of (a) mean and (b) peak TSPGs as measured noninvasively with phase-contrast (PC) VIPR and invasively with endovascular guidewires. (c) Plot of degree of stenosis measurements from phase-contrast VIPR angiograms (average of both observers) and DSA images. Gray lines = identity lines. Black lines = linear fit from the regression analysis. P = pressure.
Figure 3b:
(a, b) Calibration plots of (a) mean and (b) peak TSPGs as measured noninvasively with phase-contrast (PC) VIPR and invasively with endovascular guidewires. (c) Plot of degree of stenosis measurements from phase-contrast VIPR angiograms (average of both observers) and DSA images. Gray lines = identity lines. Black lines = linear fit from the regression analysis. P = pressure.
Figure 3c:
(a, b) Calibration plots of (a) mean and (b) peak TSPGs as measured noninvasively with phase-contrast (PC) VIPR and invasively with endovascular guidewires. (c) Plot of degree of stenosis measurements from phase-contrast VIPR angiograms (average of both observers) and DSA images. Gray lines = identity lines. Black lines = linear fit from the regression analysis. P = pressure.
Discussion
The results of this study demonstrated that TSPG across RAS, and therefore the hemodynamic significance of mild to moderate stenoses, can be measured noninvasively by using an unenhanced MR angiographic technique, phase-contrast VIPR, with respiratory gating. Excellent agreement with the invasive reference standard that utilizes pressure-sensing endovascular guidewires was found. Our regression analysis showed that our data were consistent with the hypothesis that pressure measurements from endovascular guidewires and those from phase-contrast VIPR are similar.
Previous studies have demonstrated good results for the assessment of pressure gradients in aneurysms (22) and TSPG (16) with phase-contrast VIPR in other vascular territories. However, the previous iterations of this technique were limited in their ability to assess vessels in areas complicated by respiratory motion (16). Imaging the renal arteries requires a larger field of view and is affected by motion from breathing (23). Mean renal artery movement during a breathing cycle has been reported to be 1.6 mm ± 1.9 in the proximal and 4.4 mm ± 2.8 in the distal renal arteries (24). By combining retrospective electrocardiographic gating, adaptive respiratory gating, and other correction schemes, phase-contrast VIPR of the renal arteries has addressed these shortcomings. The high spatial resolution achievable with this technique dramatically reduces intravoxel dephasing in regions of turbulent flow. In addition, the high undersampling factors have reduced the imaging time to clinically feasible durations of less than 11 minutes. In comparison, a fully sampled, unaccelerated radial acquisition would have required an imaging time of 260 × 260 × π/2 × 18 [cardiac phases] × 4 [three directional velocity encoding] × 2 [respiratory gating efficiency = 50%] × 11.4 msec [repetition time] = 2903 minutes = 48 hours. A traditional Cartesian acquisition with identical spatial and temporal resolution and rectangular cuboid volume coverage of identical dimensions would have resulted in an imaging time of 260 [phase encodes in y] × 200 [phase encodes in z] × 18 [cardiac phases] × 4 [three directional velocity encoding] × 2 [respiratory gating efficiency = 50%] × 11.4 msec [repetition time] = 1422 minutes = 23 hours without any additional acceleration techniques. The phase-contrast VIPR approach provides high-quality unenhanced MR angiograms, which makes it a viable alternative for all patients, including those with impaired kidney function.
An RAS with a mean diameter stenosis greater than 70% is generally considered hemodynamically significant and is believed to induce elevated renin levels, resulting in systemic arterial hypertension and/or renal insufficiency (25). In clinical practice, it is often a challenge to decide whether invasive treatment, such as angioplasty, is indicated in cases with mild to moderate RAS and luminal stenosis of approximately 40%–75%. Often, vessel diameter measurements alone are insufficient, and verification of hemodynamic significance is necessary (25).
Two prospective randomized trials (Dutch Renal Artery Stenosis Intervention Cooperative Study Group [26], Angioplasty and Stent for Renal Artery Lesions [27,28]) have been conducted, and a third is underway (Cardiovascular Outcomes in Renal Atherosclerotic Lesions [29]) to compare two treatment options in patients with hypertension in the setting of RAS greater than 50% suitable for revascularization: (a) medical therapy alone and (b) stent placement in addition to medical therapy. The Dutch Renal Artery Stenosis Intervention Cooperative Study Group and Angioplasty and Stent for Renal Artery Lesions trials demonstrated no significant difference between the two treatment options. Interestingly, hemodynamic parameters (TSPG) were not measured and were not required for entry into any of these studies (11,12). However, it has been shown that mild to moderate stenoses based on luminal diameter measurements at DSA create a wide variety of TSPG ranging from close to none to about 60 mm Hg (2). This implies that many mild to moderate RAS in the trials may have undergone stent placement despite not being hemodynamically significant, which may have lead to the negative trial results. With the phase-contrast VIPR technique described, it was possible to noninvasively measure the hemodynamic significance of RAS in this laboratory study with ventilated swine. This may be helpful to identify the hemodynamic significance of mild to moderate RAS in patients on the basis of pressure drops in addition to morphologic changes and potentially assist in treatment decision.
With phase-contrast VIPR evaluated in this study, it is possible to comprehensively evaluate the vasculature (both anatomy and function) without intravenous contrast material. The excellent correlation between TSPG measurements by using phase-contrast VIPR and endovascular TSPG measurements suggests that this technique is ready for the transition from the animal laboratory to clinical trials. Preparations for human studies have begun.
While pressure differences measured with the pressure-sensing guidewires and derived from phase-contrast VIPR are very small, the MR-based measurements tend to estimate lower pressure gradients. The time delay of 20–30 minutes between the endovascular measures and the MR measurements could have possibly introduced a systematic bias due to heart rate and blood pressure changes during anesthesia. In addition, there are possible sources of errors for both techniques. TSPG measurements with well-calibrated guidewires are considered fairly accurate, but in this experimental setup, the presence of two wires across the stenosis augments the stenosis and possibly increases the measured pressure gradient. The intervention may also induce vasospasms, which can increase the apparent TSPG. The phase-contrast VIPR TSPG measurements are derived by using Navier-Stokes equations and incorporate all measures of the velocity field which are subject to errors such as inaccuracies in areas of complex or turbulent flow. The Navier-Stokes relationship also uses a constant blood viscosity even though it can change with hematocrit, and very high spatial and temporal resolution is required to capture all the flow features accurately.
While two-dimensional phase-contrast MR imaging is used in routine clinical care, four-dimensional MR flow imaging requires substantially more imaging time. Approaches based on traditional Cartesian k-space sampling are usually compromised in spatial and/or temporal resolution with anisotropic voxel sizes. The radial undersampling scheme utilized in phase-contrast VIPR allows for superior spatial and temporal resolution compared with more traditional four-dimensional MR flow acquisitions and provides small, isotropic voxels that are beneficial for the analysis of flow fields in smaller vessels such as the renal arteries. Nonetheless, the interpolated spatial resolution of 0.5 mm3 was not sufficient to provide adequate velocity information to allow for pressure gradient assessment across severe stenoses in four renal arteries in our study (mean stenosis, 86%; average of peak TSPG, 64 mm Hg). In these cases, the algorithm to calculate the TSPG failed to derive a result because of signal dephasing in the very narrow segment of highly stenosed renal arteries. In clinical practice, the lack of noninvasive TSPG measures in severe stenoses do not pose a true limitation because the hemodynamic significance of these stenoses is readily established by the degree of luminal narrowing on the complex difference image. However, the spatial resolution is likely a source of bias in the phase-contrast VIPR TSPG measurements of high-grade stenoses.
In summary, noninvasive assessment of TSPG by utilizing phase-contrast VIPR has the potential to become a major advance in the evaluation of RAS and, as a result, in the management of renovascular hypertension. In patients with moderate RAS, phase-contrast VIPR can accurately distinguish between hemodynamically significant and not hemodynamically significant RAS without an invasive procedure.
Advances in Knowledge.
With optimized imaging sequences, unenhanced vastly undersampled phase-contrast four-dimensional MR flow measurements in small arteries affected by respiratory motion have become feasible within approximately 11 minutes of acquisition time.
Hemodynamic analysis of high-resolution unenhanced vastly undersampled phase-contrast four-dimensional MR flow measurements allow for noninvasive assessment of transstenotic pressure gradients (TSPGs) in the renal arteries.
Comparison with invasively obtained mean TSPGs in 19 renal arteries with an average stenosis of 62% (range, 0%–87%) showed excellent correlation (R2 = 95.4%); noninvasive determination of hemodynamic significance of renal artery stenosis (RAS) has become feasible with this approach.
Implication for Patient Care.
Risks and side effects of invasive pressure measurements for the assessment of hemodynamic significance of RAS can be avoided when utilizing noninvasive measurements from high-resolution and respiratory-compensated MR flow imaging; consequently, this technique may potentially aid therapeutic decision making without the need for invasive measurements or application of intravascular contrast agents.
Disclosures of Potential Conflicts of Interest: T.A.B. Financial activities related to the present article: none to disclose. Financial activities not related to the present article: author receives speaker fees from GE, Bayer, Guerbet, and Bender. Other relationships: none to disclose. K.M.J. Financial activities related to the present article: none to disclose. Financial activities not related to the present article: consultant for CRC Publishing; author has patent with and receives royalties from the Wisconsin Alumni Research Foundation. Other relationships: none to disclose. C.J.F. No potential conflicts of interest to disclose. S.B.R. No potential conflicts of interest to disclose. M.L.S. Financial activities related to the present article: none to disclose. Financial activities not related to the present article: author is board member for GE Medical System (hyperpolarized medical imaging) and a consultant for Bracco Pharmaceuticals. Other relationships: none to disclose. B.R.L. No potential conflicts of interest to disclose. D.C. No potential conflicts of interest to disclose. T.M.G. Financial activities related to the present article: institution receives grants from GE Healthcare. Financial activities not related to the present article: author is consultant for Bracco and GE Healthcare; institution receives grants from GE Healthcare; institution negotiating patent agreements with GE, Siemens, and Philips. Other relationships: none to disclose. O.W. No potential conflicts of interest to disclose.
Supplementary Material
Acknowledgments
The authors thank Alejandro Munoz del Rio, PhD, from the Departments of Medical Physics and Radiology at the University of Wisconsin–Madison, for his contributions to the statistical analysis.
Received July 27, 2010; revision requested August 27; revision received February 18, 2011; accepted March 4; final version accepted May 27.
Funding: This research was supported by the National Heart, Lung and Blood Institute (grant R01HL072260).
Abbreviations:
- DSA
- digital subtraction angiography
- RAS
- renal artery stenosis
- TSPG
- transstenotic pressure gradient
- VIPR
- vastly undersampled isotropic projection
References
- 1.Missouris CG, Buckenham T, Cappuccio FP, MacGregor GA. Renal artery stenosis: a common and important problem in patients with peripheral vascular disease. Am J Med 1994;96(1):10–14 [DOI] [PubMed] [Google Scholar]
- 2.Gross CM, Krämer J, Weingärtner O, et al. Determination of renal arterial stenosis severity: comparison of pressure gradient and vessel diameter. Radiology 2001;220(3):751–756 [DOI] [PubMed] [Google Scholar]
- 3.Colyer WR, Jr, Cooper CJ, Burket MW, Thomas WJ. Utility of a 0.014″ pressure-sensing guidewire to assess renal artery translesional systolic pressure gradients. Catheter Cardiovasc Interv 2003;59(3):372–377 [DOI] [PubMed] [Google Scholar]
- 4.Garcia LA, Carrozza JP., Jr Physiologic evaluation of translesion pressure gradients in peripheral arteries: comparison of pressure wire and catheter-derived measurements. J Interv Cardiol 2007;20(1):63–65 [DOI] [PubMed] [Google Scholar]
- 5.Jones NJ, Bates ER, Chetcuti SJ, Lederman RJ, Grossman PM. Usefulness of translesional pressure gradient and pharmacological provocation for the assessment of intermediate renal artery disease. Catheter Cardiovasc Interv 2006;68(3):429–434 [DOI] [PubMed] [Google Scholar]
- 6.De Bruyne B, Manoharan G, Pijls NH, et al. Assessment of renal artery stenosis severity by pressure gradient measurements. J Am Coll Cardiol 2006;48(9):1851–1855 [DOI] [PubMed] [Google Scholar]
- 7.Huber T, Vetter W, Kuhlmann U, et al. Studies on the differential determination of renin activity in renal venous blood in renal artery stenosis. [in German] Schweiz Med Wochenschr 1977;107(48):1787–1789 [PubMed] [Google Scholar]
- 8.Drieghe B, Madaric J, Sarno G, et al. Assessment of renal artery stenosis: side-by-side comparison of angiography and duplex ultrasound with pressure gradient measurements. Eur Heart J 2008;29(4):517–524 [DOI] [PubMed] [Google Scholar]
- 9.Taylor DC, Kettler MD, Moneta GL, et al. Duplex ultrasound scanning in the diagnosis of renal artery stenosis: a prospective evaluation. J Vasc Surg 1988;7(2):363–369 [PubMed] [Google Scholar]
- 10.Leung DA, Hoffmann U, Pfammatter T, et al. Magnetic resonance angiography versus duplex sonography for diagnosing renovascular disease. Hypertension 1999;33(2):726–731 [DOI] [PubMed] [Google Scholar]
- 11.Rundback JH, Sacks D, Kent KC, et al. Guidelines for the reporting of renal artery revascularization in clinical trials. J Vasc Interv Radiol 2002;13(10):959–974 [DOI] [PubMed] [Google Scholar]
- 12.Blum U, Krumme B, Flügel P, et al. Treatment of ostial renal-artery stenoses with vascular endoprostheses after unsuccessful balloon angioplasty. N Engl J Med 1997;336(7):459–465 [DOI] [PubMed] [Google Scholar]
- 13.Tan KT, van Beek EJ, Brown PW, van Delden OM, Tijssen J, Ramsay LE. Magnetic resonance angiography for the diagnosis of renal artery stenosis: a meta-analysis. Clin Radiol 2002;57(7):617–624 [DOI] [PubMed] [Google Scholar]
- 14.Wigström L, Sjöqvist L, Wranne B. Temporally resolved 3D phase-contrast imaging. Magn Reson Med 1996;36(5):800–803 [DOI] [PubMed] [Google Scholar]
- 15.Gu T, Korosec FR, Block WF, et al. PC VIPR: a high-speed 3D phase-contrast method for flow quantification and high-resolution angiography. AJNR Am J Neuroradiol 2005;26(4):743–749 [PMC free article] [PubMed] [Google Scholar]
- 16.Lum DP, Johnson KM, Paul RK, et al. Transstenotic pressure gradients: measurement in swine—retrospectively ECG-gated 3D phase-contrast MR angiography versus endovascular pressure-sensing guidewires. Radiology 2007;245(3):751–760 [DOI] [PubMed] [Google Scholar]
- 17.Turk AS, Johnson KM, Lum D, et al. Physiologic and anatomic assessment of a canine carotid artery stenosis model utilizing phase contrast with vastly undersampled isotropic projection imaging. AJNR Am J Neuroradiol 2007;28(1):111–115 [PMC free article] [PubMed] [Google Scholar]
- 18.Johnson KM, Lum DP, Turski PA, Block WF, Mistretta CA, Wieben O. Improved 3D phase contrast MRI with off-resonance corrected dual echo VIPR. Magn Reson Med 2008;60(6):1329–1336 [DOI] [PMC free article] [PubMed] [Google Scholar]
- 19.Thompson RB, McVeigh ER. Fast measurement of intracardiac pressure differences with 2D breath-hold phase-contrast MRI. Magn Reson Med 2003;49(6):1056–1066 [DOI] [PMC free article] [PubMed] [Google Scholar]
- 20.Tyszka JM, Laidlaw DH, Asa JW, Silverman JM. Three-dimensional, time-resolved (4D) relative pressure mapping using magnetic resonance imaging. J Magn Reson Imaging 2000;12(2):321–329 [DOI] [PubMed] [Google Scholar]
- 21.Bland JM, Altman DG. Statistical methods for assessing agreement between two methods of clinical measurement. Lancet 1986;1(8476):307–310 [PubMed] [Google Scholar]
- 22.Moftakhar R, Aagaard-Kienitz B, Johnson K, et al. Noninvasive measurement of intra-aneurysmal pressure and flow pattern using phase contrast with vastly undersampled isotropic projection imaging. AJNR Am J Neuroradiol 2007;28(9):1710–1714 [DOI] [PMC free article] [PubMed] [Google Scholar]
- 23.Vasbinder GB, Maki JH, Nijenhuis RJ, et al. Motion of the distal renal artery during three-dimensional contrast-enhanced breath-hold MRA. J Magn Reson Imaging 2002;16(6):685–696 [DOI] [PubMed] [Google Scholar]
- 24.Wieben O, Grist TM, Hany TF, et al. Time-resolved 3D MR angiography of the abdomen with a real-time system. Magn Reson Med 2004;52(4):921–926 [DOI] [PubMed] [Google Scholar]
- 25.Voiculescu A, Grabensee B, Jung G, Mödder U, Sandmann W. Renovascular disease: a review of diagnostic and therapeutic procedures. Minerva Urol Nefrol 2006;58(3):127–149 [PubMed] [Google Scholar]
- 26.van Jaarsveld BC, Krijnen P, Pieterman H, et al. The effect of balloon angioplasty on hypertension in atherosclerotic renal-artery stenosis. Dutch Renal Artery Stenosis Intervention Cooperative Study Group. N Engl J Med 2000;342(14):1007–1014 [DOI] [PubMed] [Google Scholar]
- 27.Kalra PA. Late breaking clinical trials session: SCAI-ACCi. Presented at SCAI-ACCi2. Chicago, Ill, April 1, 2008 [Google Scholar]
- 28.Mistry S, Ives N, Harding J, et al. Angioplasty and Stent for Renal Artery Lesions (ASTRAL trial): rationale, methods and results so far. J Hum Hypertens 2007;21(7):511–515 [DOI] [PubMed] [Google Scholar]
- 29.Cardiovascular Outcomes in Renal Atherosclerotic Lesions (CORAL). NIH-NHLBI, Harvard Clinical Research Institute, Medical University of Ohio http://www.coralclinicaltrial.org/public/index.html Accessed July 10, 2011.
Associated Data
This section collects any data citations, data availability statements, or supplementary materials included in this article.


