

Abstract
Gene regulatory networks allow the control of gene expression patterns in living cells. The study of network topology has revealed that certain subgraphs of interactions or “motifs” appear at anomalously high frequencies. We ask here whether this phenomenon may emerge because of the functions carried out by these networks. Given a framework for describing regulatory interactions and dynamics, we consider in the space of all regulatory networks those that have prescribed functional capabilities. Markov Chain Monte Carlo sampling is then used to determine how these functional networks lead to specific motif statistics in the interactions. In the case where the regulatory networks are constrained to exhibit multistability, we find a high frequency of gene pairs that are mutually inhibitory and self-activating. In contrast, networks constrained to have periodic gene expression patterns (mimicking for instance the cell cycle) have a high frequency of bifan-like motifs involving four genes with at least one activating and one inhibitory interaction.
Keywords: essential interactions, genetic switch, transcription factors
Evolutionary forces have shaped living organisms since the beginning of life. It is thus not surprising that the framework for understanding features in today’s organisms is often based on considering the history of these organisms: a remarkable feature found today may be the trace of an evolutionary trajectory. But one can also take a different perspective, one in which design constraints may play a significant role. The expectation is then that the architecture of living organisms depends not just on their origin, but also on their functional capabilities. In the present context, we are concerned with biological networks. Are the constraints associated with network functionality major determinants of network architecture? We address this question in this paper, albeit using a somewhat narrow notion of functionality based on the output patterns produced by networks.
Our focus here is on gene regulatory networks (GRN), the set of interactions between genes. These interactions along with the gene expression machinery allow living cells to control their gene expression patterns. In the last decade, genetic interactions have been measured, modified, engineered, etc., and so quite a lot is known about how any given gene can affect another’s expression. Furthermore, small gene networks have been designed to implement simple functions in vivo (1, 2), and much larger sets of interactions have been reconstructed in a number of organisms (3–5). From these large networks it has been possible to show that several “motifs”—subgraphs with given interactions—arise far more often than might be expected (6–9). One of the most studied motif is the so called Feed Forward Loop or FFL, a graph based on three genes where the first regulates the second, and both the first and the second regulate the third. Another example is the bifan motif in which two genes control two others. Biological functions have been proposed for these motifs (10, 11) which give them some meaning, but one may ask whether other motifs could perform the same functions and what level of enrichment might be expected if function were the sole cause of motif overrepresentation. Unfortunately, the functional capabilities of GRN and the constraints they must satisfy (e.g., kinetic response characteristics or robustness to noise) are still poorly understood, so such questions cannot be addressed in a truly realistic framework. Instead, we will (i) work within a plausible model of transcriptional regulation, (ii) impose functional constraints on the patterns of gene expression, and (iii) determine which motifs emerge when considering the space of all possible functional GRN. This particular task is related to previous work that used genetic algorithms or simulated annealing to design genetic networks having given functional properties (12–14). Those studies found that the optimization procedures indeed led to particular architectures. Our approach differs by not relying on a design procedure: we want to get away from any dependence on the optimization algorithm and see how functional capability on its own constrains the possible architectures. In this framework, two types of constraints will be applied: we will impose either a set of steady-state expression patterns, or a time periodic pattern of expression motivated by previous studies of cell cycling. Interestingly, we find very different motifs for these two types; in Alon’s (15, 16) terminology, the first type leads to mutually inhibitory pairs acting as bistable switches, while the second type leads to bifan, diamond and four point cycle motifs.
Our model of transcriptional regulation is simple enough to be used for illustration and, hopefully, for identification of generic features of genetic networks. Of course it is only a model and it does not include many known aspects of regulation such as posttranslational modifications or chromatin remodelers; nevertheless it is rooted in biophysical reality to avoid ad-hoc assumptions. The inclusion of inhibitory interactions in this framework is a major qualitative advance with respect to our earlier work (17). Although technically simple, it gives access to questions arising when networks have complex expression patterns, and in particular it allows one to get insights into mechanisms of motifs emergence. Remarkably enough, we find that the structure of a fairly large genetic network is controlled by the cooperative action of small units—motifs—although the selection pressure is exerted only on the network as a whole.
We begin by describing our model and follow by examining its properties, focusing especially on the kinds of motifs that emerge when imposing functional capabilities on the networks (in practice, we impose gene expression patterns). Then the dependence of the motifs on these imposed patterns is exhibited. We also outline in the SI Text a way of taking into account possible cooperative behavior among different transcription factors.
Model
Transcription Factor Binding.
We start with N genes coding for transcription factors that may influence each other’s expression. To keep the model as realistic as possible, we include the known biophysical determinants of transcriptional control. In particular, the binding of a transcription factor (TF) to a site is described thermodynamically (18–20), that is through a free energy that depends on the mismatch of two character strings of length L, one for the TF and one for the binding site. Up to an additive constant, this free energy in units of kBT is taken to be εdij where dij is the number of mismatches, T is the temperature, and kB is Boltzmann’s constant. The parameter ε is a penalty per mismatch which has been measured experimentally to be between one and three if each base pair of the DNA is represented by one character (21–23). Also, by comparing to the typical number of base pairs found for experimentally studied binding sites, one has 10 ≤ L ≤ 15. For all the work presented here, we use ε = 2 and L = 12, but we have checked that our conclusions are not specific to these values.
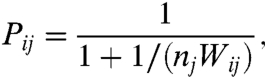
For simplicity of the framework, we prevent different TF types from accessing a same site. To this end we standardize the regulatory region of each gene as illustrated in Fig. 1. In Fig. 1, the gene gi (producing the transcription factor TFi) has a regulatory region of N binding sites, one dedicated to each of the N different TF types. Suppose that there are nj TF molecules of type j. We assume these and only these TFs can bind to the site j in gene i’s regulatory region and of course, a site can be occupied by only one TF molecule at a time. For the corresponding occupation probability Pij we use the result of ref. 20:
 |
[1] |
where
| [2] |
is the Boltzmann factor. Pij depends strongly on dij and is appreciable only when the mismatch is small, which is an a priori unprobable event. Nevertheless, small mismatches will arise in functional genotypes through the selection pressure.
Fig. 1.

Schematics of the model. Each gene’s regulatory region contains N binding sites, one for each of the N transcription factors produced by the N genes. The transcription factor TFj binds to its different binding sites with interaction strengths Wij that depend on the mismatches dij between the associated character strings. If transcription is not blocked by a bound inhibitory TF, the transcription rate of gene i is determined by the probability of occupation [POCC (34)] of its regulatory region.
Transcriptional Control.
Again for pedagogical reasons, we shall consider that all genes have the same maximal transcription rate; denoting by n the associated maximum number of TF molecules in the system of a given type, we shall set nj = Sjn where Sj is the current level of transcription for gene j, normalized to be between 0 and 1. Experimentally, n is known to range from order of unity to many thousands (24–26). Here we shall use n = 1,000, but again we have checked that using values ten times smaller or larger does not change our conclusions.
The expression Si of gene i will vary with the presence of transcription factors bound in its regulatory region, but present knowledge does not provide us with quantitative information on this dependence. Much past modeling work (27–31) has dealt with this obstacle by considering that each occupied binding site provides an activating or inhibitory signal and that all signals are then added and compared to a threshold: below (respectively above) this threshold, transcription is off (respectively on). However, more recent experimental work and associated modeling (32, 33) suggests that transcription rates in vivo can exhibit graded responses involving no cooperative effects. Our work thus follows (17, 32, 33) by considering continuous transcription rates determined solely by the independent probabilities that binding sites in a regulatory region are occupied.
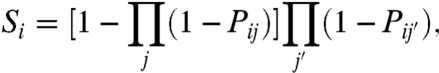
Recall from Eq. 1 that Pij is the probability that the binding site j of gene i’s regulatory region is bound by a TF. In the absence of inhibitory effects on this regulatory region, we take the transcription rate to be (up to an arbitrary scale) the Probability of OCCupation or “POCC” (34) of the regulatory region. However, if one of the interactions j is inhibitory, we consider that the presence of a TF of type j bound to its binding site will shut down the transcription; in effect, inhibitors act as vetoes on transcription in this picture. Then, denoting by Si the expression level of gene i, we set
 |
[3] |
where j runs over activating interactions and j′ over inhibitory interactions. (See SI Text for a detailed derivation.)
The transcriptional dynamics is then defined as follows. Just like in many other modeling frameworks, we take time to be discrete (27–31); at each time step we first update the Pij in Eq. 1 (using nj = nSj) and then update the Si in Eq. 3. These updates are deterministic, and in general the transcriptional trajectory goes towards a fixed point (corresponding to steady-state expression levels) or towards a cycle (corresponding to periodic behavior of the expressions in time). (See SI Text for additional details.)
Genotypes and Phenotypes.
The TFs and their binding sites are associated with character strings as illustrated in Fig. 1. We are interested in the space of all GRN, which means here all possible character strings. However, it is easy to see that, within our model, all choices of TF character strings are equivalent, so we can fix them without any loss of generality. Any given GRN is then completely specified by the N2 character strings of its binding sites and by the specification of the activating or inhibitory nature of each interaction. DNA bases come in four types, A,C,G, and T, and so do DNA base pairs because of Watson-Crick pairing. We thus use an alphabet of four characters for our strings, one for each base pair. This set of strings is referred to as the “genotype” of the GRN. Clearly the most relevant quantities in a genotype are the N2 mismatches dij, one for each binding site. A genotype can then usefully be represented by this N by N matrix of mismatches or by the corresponding matrix of interaction strengths Wij, plus the sign (activating vs. inhibitory) associated with each of these interactions.
At any time step t, the pattern of mean gene expression can be represented by the vector S(t) = {Sj(t)}j=1,…,N. We shall consider two classes of constraints to be imposed on our GRN. The first is motivated by the multitude of cell types in multicellular organisms: we want the GRN to be able to have fixed-point expression vectors that are very close to 2, 3, or more target patterns, each associated with a different tissue. Note that some such patterns involving up to a dozen or so genes have been inferred in various organisms (35, 36). The second kind of function we shall impose is for the vector to follow tightly and step by step a sequence of patterns that forms a target cycle. Such cases of cycling GRN have been studied previously within threshold and boolean models (30, 37). For each type of functional constraint imposed, we refer to the “phenotype” of the GRN as (i) the different fixed-point expression vectors for the first case; (ii) the cyclic pattern of expression vectors for the second case.
Methodological Issues.
Our goal is to understand how the phenotypic properties—having for instance the networks produce particular expression patterns—constrain the genotypes, in particular at the level of the architecture of the genetic interactions. For that, we generate in silico representative samples of genotypes having the desired phenotypes. This computational framework is based on the Markov Chain Monte Carlo (MCMC) method. MCMC allows one to sample an essentially arbitrary space according to an arbitrary distribution. The heart of the technique is to generate a biased random walk in the space, enforcing at each step the accept/reject Metropolis rule (38); this rule, in spite of its simplicity, ensures that at large times the sampling has the desired distribution. The approach is well known in statistical physics, so details are given in the SI Text. Note that, in contrast to a number of other approaches such as genetic algorithms, we do not work with populations. Rather, by performing a random walk for a single genotype, the Metropolis rule used in the MCMC allows for a controlled sampling of the space of all genotypes. Of special importance is the fact that the MCMC introduces no bias: the a priori specified distribution is obtained exactly. In our case, this distribution is obtained by imposing our constraints on the GRN’s expression patterns only, there is no other input. The situation is completely different when using optimization or population based approaches such as genetic algorithms: there the distributions obtained are unknown and uncontrolled.
Another point worth mentioning is that our equations for transcriptional dynamics involve the average number of transcription factors at a given time, and work with the probability of occupation of each binding site. Thus possible effects of fluctuations are not taken into account, and so one can say that our approach remains of the mean-field type. Nevertheless, we have checked that realistic fluctuations would not significantly influence our conclusions.
Results
Abundance of Functional GRN.
The space of all GRN is finite in our framework because each genotype is specified by N2 character strings of length L and the signs of the associated interactions. Is the constraint of having a given phenotype very stringent? We have generated millions of random genotypes and find that none of them have even approximately the phenotypes we have selected for our study. Thus, as in other gene network models (39), “functional” GRN constitute only an extremely small subset of all GRN; such extremely rare GRN may very well be atypical in many of their properties. In spite of this fact, it is also true that a huge number of different genotypes do lead to the desired phenotypes: our MCMC is able to produce seemingly as many different functional GRN as we want. This feature arises also in other genotype to phenotype mapping models such as RNA neutral networks (40).
Sparseness of the Essential Interactions.
Given a functional GRN, the interaction from gene j to gene i is considered essential if the setting of its strength Wij to zero changes the phenotype, i.e., takes one away from the desired expression patterns. Define the essential network for that GRN via the set of oriented edges Eij such that the interaction from gene j to gene i is essential. Such an essential network summarizes the key interactions of a GRN. We find that these essential networks are sparse.
In the case of the multistability phenotype, we impose n = 1, 2, 3, … target fixed points. In previous work (17) on a simpler model with n = 1 and no allowance for inhibitory interactions, we found that the great majority of genotypes had just one essential interaction Eij for each gene i. In the present model this sparseness property also holds. As we impose more fixed points, the mean number of essential interactions grows, but again each gene i will typically have just a few essential interactions (and almost never none), with a mean of 1.2, 1.5, 1.9 for n = 2, 3, and 4 fixed points at N = 16. Furthermore, these means are quite stable if one increases N. One gets analogous results by forcing the expression vector to cycle through given patterns. For our purposes, genes are put on a circle and the cycle shifts the “on” genes by a given number of steps clockwise. Again, we find that only a small fraction of the interactions are essential. (See Table S1 for a brief summary). Furthermore, the number of interactions per gene that are essential hardly changes as one increases the number of genes.
Qualitatively, the observed sparseness can be easily understood: at the level of the GRN, introducing an additional essential interaction generally means increasing a weight Wij. That increase has a high entropic cost as can be seen from the mismatches: there are few strings that have low mismatch values and many that have high mismatch values. Our result is in sharp contrast with what would arise in a model without molecular modeling of the interactions. Sparseness would then have to be enforced in an ad-hoc way because biological networks are indeed sparse experimentally (41, 42).
We have also investigated how essential interactions are divided according to the sign of the interaction. Interestingly, we find that a clear majority act as activators rather than as repressors. The bias is particularly strong in the case of phenotypes associated with n = 2, with a ratio of 6 to 1, and gets weaker as n increases. The ratio is about 2 to 1 for the GRN with cyclic phenotypes (see Table S1).
Topologies of Essential Networks.
Given the large number of essential networks obtained from the functional GRN sampled by the MCMC, we have determined which essential network topologies arise. In Fig. 2 we display the most frequent topology when imposing n = 2 and four fixed-point expression patterns. As n increases, the connections become more complex as expected; at small n much of the topology is tree-like; to a large extent, this reflects the sparseness and parsimony of these essential networks: a few master genes can cooperate to switch into one expression pattern, and then these few genes can drive all the other ones as slaves. In Fig. 3 we show the most frequent topology arising when imposing the cyclic phenotype on the GRN. The visual inspection immediately reveals the role of the clockwise feed-forward interactions driving the shifting expression patterns.
Fig. 2.

The most common essential network topologies when n fixed-point expression patterns are imposed. In each case, we see the presence of the motif with two mutually inhibitory and self-activating genes. Interactions shown are essential, and those genes whose target expression is the same in all the fixed points are omitted because they provide no information. Data for N = 16; subfigures A and B are for n = 2 and 4. These topologies arise for over 20% and nearly 1% of the networks, respectively.
Fig. 3.

The most common essential network topology when one imposes a particular cyclic expression pattern. That pattern corresponds to a group of active genes that shifts clockwise by two genes at each time step. One sees very clearly the activating interactions acting forward and the inhibitory interactions acting backward. (Data for N = 16; this topology arises for over 15% of the networks.)
Another interesting feature that emerges is that there are many different essential networks produced by our MCMC sampling (see SI Text for a quantitative study of this point). This finding demonstrates that the same functional capability can be obtained from a very large number of distinct essential networks. Note that we saw before that there are many GRN that have the same phenotype, but extending this to essential networks is non trivial. Thus for a given phenotype, we have many genotypes, many essential networks, and even many topologies of essential networks! This property is in close analogy with the high degeneracy of the genotype to phenotype map found in a number of other models of gene regulation (39). Furthermore, by construction of our MCMC, our networks are connected by a succession of point mutations, showing that gradual changes that are nearly neutral (i.e., keep the phenotype nearly constant) can lead to large evolutionary changes at long times, be it at the genotype level, the essential network level, or even at the level of essential network topologies.
Functionality Leads to Motif Selection.
Working with the full description of genotypes is cumbersome and difficult, whereas focusing just on essential networks provides a great deal of intuition, in particular for what features are relevant for functionality. The price to pay for this simplicity is some loss of information; for example, two interactions separately may be nonessential but nevertheless if one removes both of them the network’s functionality may be lost.
To obtain insights into network structure, one can search for network motifs; this has become very popular in recent years, to a large extent through the effort of Alon and collaborators (15, 43) (see Alon Laboratory Web page at Weizmann Institute, http://www.sciencemag.org/content/suppl/2002/10/23/298.5594.824.DC1/MiloSOMv4.pdf). The fact that a complex network can be constructed from small standard subelements is by itself not surprising: this property is at the root of electronics and is based on the mathematical structure of logical functions. However, the fact that nature also uses this strategy is not obvious, and that some motifs and not others are employed in different network functions is even less obvious. This presence of motifs is revealed through detailed studies of (rather rare, for obvious reasons) biological networks reconstructed from data, and it has been partly explained by arguments borrowed from communication systems techniques. Here we inquire what happens in a model where the transcriptional rules are known and where thousands of networks can be generated with given network functional capabilities. Will the same motifs emerge when the functional capabilities are modified?
To answer this question, we determine the motifs in our different ensembles. The web page mentioned above offers a software for motif search; it is not quite adapted to our needs because it does not distinguish between activators and repressors and it does not accept self-interactions. However, it was helpful in this work, enabling us to single out the relevant motif topologies (when a topology is irrelevant, it remains so when more detailed distinctions are introduced). Furthermore, we used it to test our own codes for motif extraction. The results presented here concern the most prominent motifs; others have frequencies that are either very small or at least roughly comparable to those of randomized networks. We discard motifs with leaves (degree-one nodes), which are somewhat trivial. We keep only motifs that are not a subgraph of a larger motif with the same number of nodes. However, our motifs can partly overlap. The randomization used is that proposed by Maslov and Sneppen (44): edges are interchanged so that both the in- and out-degrees of network nodes remain unchanged. Our results are summarized in Table S2 and the motifs are listed in Fig. 4.
Fig. 4.

The most prominent motifs found for our two classes of functionality constraints. Case of multistability (more than one fixed point): (A) double negative feedback loop with auto regulation, which has two mutually inhibitory and self-activating genes. Case of target expression patterns that are cyclic in time: (B and C) incoherent diamond, (D and E) frustrated four-node loop, (F) incoherent bifan.
We see right away a very strong dichotomy: the motifs are very different for our two classes of functional capabilities (imposing multistability vs. cycling). In the case of multistability, one single motif stands out as being extremely important: often referred to as the double negative feedback loop with autoregulation, its two genes are mutually inhibitory and self-activating. Interestingly, this simple motif is found in a number of biological gene networks, and in particular in the genetic switch between lysogeny and lysis of the phage λ (45). Clearly such a pair of genes can act as a bistable switch that will then influence downstream genes according to the expression pattern that is required for the considered fixed point. When dealing with more than two target fixed points, multiple copies of this motif should be necessary as illustrated in Fig. 2 which displays the most represented essential network (ignoring permutations of indices) for two and four imposed fixed points. Not surprisingly, the same trend also emerges for the less frequent essential networks. Roughly, the networks display a core of central genes that belong to one or more motifs of the double negative feedback type (labeled “A” in Fig. 4) and these genes then influence other genes by a simple downstream effect along the associated tree-like graph of activating interactions.
Now consider the motifs present when imposing cyclic expression targets. The motif “A”—double negative feedback loop with auto regulation—is absent and instead we have several four gene motifs that are strongly overrepresented as displayed in Fig. 4. In the nomenclature of Alon (15, 16), motifs “B” and “C” are incoherent diamonds, while motif “F” is the incoherent bifan; the others, motifs “D” and “E,” involve a regulatory loop, and in fact these loops are “frustrated” in that they have an odd number of inhibitory interactions. Again, biological gene networks have been found containing some of these motifs (16), the bifan motif being perhaps the most prominent.
None of the motifs “B” to “F” were overrepresented in the networks satisfying multistability. The presence of these motifs here can be understood by looking at the most frequent essential network displayed in Fig. 3. The phenotype used for that case corresponds to having a block of on genes that shifts by two units at each time step inside a background of off genes. One way to implement this shifting is to have genes activate the two genes ahead of them and to inhibit genes sufficiently far behind. As can be seen in Fig. 3, the actual strategy used in the most frequent essential network is very close to that: if we consider the two genes at the front of the on block, the front-most one activates the two ahead of it while the second has no excitatory action. And each inhibits one gene at the back of the block that is to be turned off at the next time step. The combination of these excitatory and inhibitory actions ensures that the block stays of the correct size as it shifts. Interestingly, and in contrast to the situation for the phenotypes consisting of steady states, the operation of the network is not readily understood from looking at the motifs in isolation. Indeed, the genes in these motifs do not provide oscillatory behavior on their own. In effect, the motifs here are just like parts in a larger machine, and it is necessary to consider how they cooperate within the overall network to reveal their function. Only if one considers much smaller networks do the corresponding motifs reveal function on their own. In the SI Text, we illustrate this fact by considering a three gene network which exhibits periodic oscillations (1, 46).
Discussion
The central question tackled by the present work is whether the emergence of motifs in gene regulatory networks can be due to the functional capabilities of these networks. Given the uncertainties in how real genetic networks operate, we have taken a modeling route and have addressed this question in silico. Our model incorporates known molecular mechanisms for the description of genetic interactions, and in fact the main parameters in our model come from parametrizing the affinities of transcription factors to their binding sites. Furthermore, in contrast to most other gene regulatory network modelings, the associated interactions are never completely absent; they can be important or unimportant for the functionality of the network, a notion we characterized by the essentiality of interactions. Finally, the expression level of each gene follows dynamical equations allowing for continuous values; this additional complexity compared to using digital “on-off” expression levels forces one to consider functionality as a soft constraint, imposing expression levels to be “sufficiently” close to target patterns. Network functionality is then quantified via a kind of fitness measure. Such a framework provides a close parallel with thermodynamic ensembles; all questions are then necessarily posed in a probabilistic framework where each network arises with a probability that is negligible unless the constraints are rather well satisfied. In practice, we explore the corresponding ensemble of genetic networks numerically, using MCMC.
Two types of gene network functional capabilities have been studied. The first is motivated by the different cell types in multicellular organisms and is implemented by constraining the genes in the networks to have steady-state expression levels close to given target levels; in effect, the transcriptional dynamics of the networks must allow for multistability, that is multiple fixed points of the expression dynamics. The second type of functional capability considered is motivated by previous work on the cell cycle; we implement this cycling type of capability by forcing the networks to have their expression levels follow a given cyclic pattern in time. Thus instead of fixed points, in this case we ask for a periodic behavior of the dynamics. In both cases, we find characteristic features shared with other models of living systems (40) as follows. (i) The constraints imposed are extremely stringent as can be seen from the fact that in practice they are never satisfied by networks generated at random. (ii) Although the fraction of networks of interest is tiny, the number of networks satisfying the constraints is astronomical as revealed by our MCMC sampling.
Of interest is the structure of these networks, presumably atypical. Particular architectures are known to arise when performing genetic network design via optimization algorithms (12–14). Is this property a bias of these algorithms or does it reflect an underlying constraint imposed by network function? It is difficult to tackle this question head-on except in very small systems; there one can explore all possible values for the model’s parameters (47) and see the functional consequences. Because motifs can involve three or even more genes inside a larger network, a different approach is necessary for moderate and large networks. The most adapted tool is MCMC and so we have applied this approach to our systems with up to 16 genes. MCMC then allows us to sample the subspace of functional networks in spite of the fact that this subspace represents only a tiny fraction of the space of all networks.
Given a gene regulatory network produced by the Monte Carlo algorithm, we first extract the essential interactions to obtain what we call the genotype’s essential network. This representation gets rid of irrelevant interactions that are too small to influence much the functionality. Interestingly, these essential networks are sparse and make use of inhibitory interactions parsimoniously. We then consider the motifs appearing in these essential networks, where a motif is an oriented subgraph that is overly frequent when comparing with a randomization test preserving each node’s degree. In the case of networks satisfying the multistability constraints, we find one very dominant motif of two genes acting as a switch: each gene represses the other while activating itself. Furthermore, this motif arises once when imposing two fixed points for the transcriptional dynamics, twice when imposing three fixed points, etc. This pattern makes good sense from a “design” perspective: the choice of going to one fixed point rather than to another can be implemented most simply by using bistable switches that operate in this logical fashion.
Moving on to the ensemble of networks that implement expression patterns that are cyclic in time, we find now that the dominant motifs involve four genes as shown in Fig. 4. One of these motifs corresponds to the bifan in Alon’s nomenclature, but four other motifs are also found and in fact are even more often present. All of these motifs involve at least one inhibitory interaction; this is appropriate for our imposed cycle as the newly turned on genes must at some point turn off the other genes they are replacing. Interestingly, the motifs we find in this ensemble of cyclic phenotypes are not present in the other (with fixed-points phenotypes). This difference shows that network function is a major determinant of the content in motifs, at least within our simplified framework. Some influence of the function could have been expected a priori, but the size of the effect is striking. We hope this result will encourage the search for functional biases between experimental motifs, in particular through comparative studies of close-by organisms.
Supplementary Material
Acknowledgments.
We thank V. Fromion, L. Giorgetti, and V. Hakim for helpful comments. This work was supported by the Polish Ministry of Science Grant No. N N202 229137 (2009-2012). The project operated within the Foundation for Polish Science International Ph.D. Projects Programme cofinanced by the European Regional Development Fund, agreement no. MPD/2009/6. The LPT, LPTMS, and UMR de Génétique Végétale are Unité de Recherche de l’Université Paris-Sud associées au CNRS. M.Z. is grateful to the LPT for hospitality.
Footnotes
The authors declare no conflict of interest.
This article is a PNAS Direct Submission.
This article contains supporting information online at www.pnas.org/lookup/suppl/doi:10.1073/pnas.1109435108/-/DCSupplemental.
References
- 1.Elowitz M, Leibler S. A synthetic oscillatory network of transcriptional regulators. Nature. 2000;403:335–338. doi: 10.1038/35002125. [DOI] [PubMed] [Google Scholar]
- 2.Gardner T, Cantor C, Collins J. Construction of a genetic toggle switch in Escherichia coli. Nature. 2000;403:339–342. doi: 10.1038/35002131. [DOI] [PubMed] [Google Scholar]
- 3.Herrgard M, Covert M, Palsson B. Reconstruction of microbial transcriptional regulatory networks. Curr Opin Biotech. 2004;15:70–77. doi: 10.1016/j.copbio.2003.11.002. [DOI] [PubMed] [Google Scholar]
- 4.Salgado H, et al. Regulondb (version 5.0): Escherichia coli k-12 transcriptional regulatory network, operon organization, and growth conditions. Nucleic Acids Res. 2006;34:D394–D397. doi: 10.1093/nar/gkj156. [DOI] [PMC free article] [PubMed] [Google Scholar]
- 5.Hu Z, Killion P, Iyer V. Genetic reconstruction of a functional transcriptional regulatory network. Nat Genet. 2007;39:683–687. doi: 10.1038/ng2012. [DOI] [PubMed] [Google Scholar]
- 6.Shen-Orr S, Milo R, Mangan S, Alon U. Network motifs in the transcriptional regulation network of Escherichia coli. Nat Genet. 2002;31:64–68. doi: 10.1038/ng881. [DOI] [PubMed] [Google Scholar]
- 7.Ma H, et al. An extended transcriptional regulatory network of Escherichia coli and analysis of its hierarchical structure and network motifs. Nucleic Acids Res. 2004;32:6643–6649. doi: 10.1093/nar/gkh1009. [DOI] [PMC free article] [PubMed] [Google Scholar]
- 8.Lee T, et al. Transcriptional regulatory networks in Saccharomyces cerevisiae. Science. 2002;298:799–804. doi: 10.1126/science.1075090. [DOI] [PubMed] [Google Scholar]
- 9.Zhu J, et al. Integrating large-scale functional genomic data to dissect the complexity of yeast regulatory networks. Nat Genet. 2008;40:854–861. doi: 10.1038/ng.167. [DOI] [PMC free article] [PubMed] [Google Scholar]
- 10.Mangan S, Alon U. Structure and function of the feed-forward loop network motif. Proc Natl Acad Sci USA. 2003;100:11980–11985. doi: 10.1073/pnas.2133841100. [DOI] [PMC free article] [PubMed] [Google Scholar]
- 11.Camas F, Poyatos J. What determines the assembly of transcriptional network motifs in Escherichia coli? PLoS One. 2008;3:e3657. doi: 10.1371/journal.pone.0003657. [DOI] [PMC free article] [PubMed] [Google Scholar]
- 12.François P, Hakim V. Design of genetic networks with specified functions by evolution in silico. Proc Natl Acad Sci USA. 2004;101:580–585. doi: 10.1073/pnas.0304532101. [DOI] [PMC free article] [PubMed] [Google Scholar]
- 13.François P, Hakim V, Siggia E. Deriving structure from evolution: metazoan segmentation. Mol Syst Biol. 2007;3:154. doi: 10.1038/msb4100192. [DOI] [PMC free article] [PubMed] [Google Scholar]
- 14.Rodrigo G, Carrera J, Jaramillo A. Genetdes: automatic design of transcriptional networks. Bioinformatics. 2007;23:1857–1858. doi: 10.1093/bioinformatics/btm237. [DOI] [PubMed] [Google Scholar]
- 15.Alon U. An Introduction to Systems Biology: Design Principles of Biological Circuits. Boca Raton, FL: Chapman and Hall; 2007. [Google Scholar]
- 16.Alon U. Network motifs: theory and experimental approaches. Nat Rev Genet. 2007;8:450–461. doi: 10.1038/nrg2102. [DOI] [PubMed] [Google Scholar]
- 17.Burda Z, Krzywicki A, Martin OC, Zagorski M. Distribution of essential interactions in model gene regulatory networks under mutation-selection balance. Phys Rev E. 2010;82:011908. doi: 10.1103/PhysRevE.82.011908. [DOI] [PubMed] [Google Scholar]
- 18.von Hippel P, Berg O. On the specificity of DNA-protein interactions. Proc Natl Acad Sci USA. 1986;83:1608–1612. doi: 10.1073/pnas.83.6.1608. [DOI] [PMC free article] [PubMed] [Google Scholar]
- 19.Berg O, von Hippel P. Selection of DNA binding sites by regulatory proteins: statistical-mechanical theory and application to operators and promoters. J Mol Biol. 1987;193:723–743. doi: 10.1016/0022-2836(87)90354-8. [DOI] [PubMed] [Google Scholar]
- 20.Gerland U, Moroz J, Hwa T. Physical constraints and functional characteristics of transcription factor-DNA interaction. Proc Natl Acad Sci USA. 2002;99:12015–12020. doi: 10.1073/pnas.192693599. [DOI] [PMC free article] [PubMed] [Google Scholar]
- 21.Sarai A, Takeda Y. Lambda repressor recognizes the approximately 2-fold symmetric half-operator sequences asymmetrically. Proc Natl Acad Sci USA. 1989;86:6513–6517. doi: 10.1073/pnas.86.17.6513. [DOI] [PMC free article] [PubMed] [Google Scholar]
- 22.Stormo G, Fields D. Specificity, free energy and information content in protein-DNA interactions. Trends Biochem Sci. 1998;23:109–113. doi: 10.1016/s0968-0004(98)01187-6. [DOI] [PubMed] [Google Scholar]
- 23.Bulyk M, Johnson P, Church G. Nucleotides of transcription factor binding sites exert interdependent effects on the binding affinities of transcription factors. Nucl Acids Res. 2002;30:1255–1261. doi: 10.1093/nar/30.5.1255. [DOI] [PMC free article] [PubMed] [Google Scholar]
- 24.Golding I, Paulsson J, Zawilski S, Cox E. Real-time kinetics of gene activity in individual bacteria. Cell. 2005;123:1025–1036. doi: 10.1016/j.cell.2005.09.031. [DOI] [PubMed] [Google Scholar]
- 25.Becskei A, Kaufmann B, van Oudenaarden A. Contributions of low molecule number and chromosomal positioning to stochastic gene expression. Nat Rev Genet. 2005;37:937–944. doi: 10.1038/ng1616. [DOI] [PubMed] [Google Scholar]
- 26.Elf J, Li GW, Xie X. Probing transcription factor dynamics at the single-molecule level in a living cell. Science. 2007;316:1191–1194. doi: 10.1126/science.1141967. [DOI] [PMC free article] [PubMed] [Google Scholar]
- 27.Kauffman S. Origins of Order: Self-Organization and Selection in Evolution. Oxford: Oxford University Press; 1993. [Google Scholar]
- 28.Wagner A. Does evolutionary plasticity evolve? Evolution. 1996;59:1008–1023. doi: 10.1111/j.1558-5646.1996.tb02342.x. [DOI] [PubMed] [Google Scholar]
- 29.Bornholdt S, Rohlf T. Neutral mutations and punctuated equilibrium in evolving genetic networks. Phys Rev Lett. 2000;84:6114–6117. doi: 10.1103/PhysRevLett.84.6114. [DOI] [PubMed] [Google Scholar]
- 30.Li F, Long T, Lu Y, Ouyang Q, Tang C. The yeast cell-cycle network is robustly designed. Proc Natl Acad Sci USA. 2004;101:4781–4786. doi: 10.1073/pnas.0305937101. [DOI] [PMC free article] [PubMed] [Google Scholar]
- 31.Azevedo R, Lohaus R, Srinivasan S, Dang K, Burch C. Sexual reproduction selects for robustness and negative epistasis in artificial gene networks. Nature. 2006;440:87–90. doi: 10.1038/nature04488. [DOI] [PubMed] [Google Scholar]
- 32.Segal E, Widom J. What controls nucleosome positions? Trends Genet. 2002;25:335–343. doi: 10.1016/j.tig.2009.06.002. [DOI] [PMC free article] [PubMed] [Google Scholar]
- 33.Giorgetti L, et al. Noncooperative interactions between transcription factors and clustered DNA binding sites enable graded transcriptional responses to environmental inputs. Mol Cell. 2010;37:418–428. doi: 10.1016/j.molcel.2010.01.016. [DOI] [PubMed] [Google Scholar]
- 34.Granek J, Clark N. Explicit equilibrium modeling of transcription-factor binding and gene regulation. Genome Biol. 2005;6:R87. doi: 10.1186/gb-2005-6-10-r87. [DOI] [PMC free article] [PubMed] [Google Scholar]
- 35.Espinosa-Soto C, Padilla-Longoria P, Alvarez-Buylla E. A gene regulatory network model for cell-fate determination during Arabidopsis thaliana flower development that is robust and recovers experimental gene expression profiles. The Plant Cell. 2004;16:2923–2939. doi: 10.1105/tpc.104.021725. [DOI] [PMC free article] [PubMed] [Google Scholar]
- 36.Chickarmane V, Peterson C. A computational model for understanding stem cell, trophectoderm and endoderm lineage determination. PLoS One. 2008;3:e3478. doi: 10.1371/journal.pone.0003478. [DOI] [PMC free article] [PubMed] [Google Scholar]
- 37.Davidich M, Bornholdt S. Boolean network model predicts cell cycle sequence of fission yeast. PLoS One. 2008;3:e1672. doi: 10.1371/journal.pone.0001672. [DOI] [PMC free article] [PubMed] [Google Scholar]
- 38.Metropolis N, Rosenbluth A, Rosenbluth M, Teller A, Teller E. Equation of state calculations by fast computing machines. J Chem Phys. 1953;21:1087–1092. [Google Scholar]
- 39.Ciliberti S, Martin OC, Wagner A. Robustness can evolve gradually in complex regulatory gene networks with varying topology. PLoS CB. 2007;3:e15. doi: 10.1371/journal.pcbi.0030015. [DOI] [PMC free article] [PubMed] [Google Scholar]
- 40.Wagner A. Robustness and Evolvability in Living Systems. Princeton, NJ: Princeton University Press; 2005. [Google Scholar]
- 41.Thieffry D, Huerta A, Perez-Rueda E, Collado-Vides J. From specific gene regulation to genomic networks: a global analysis of transcriptional regulation in Escherichia coli. BioEssays. 1998;20:433–440. doi: 10.1002/(SICI)1521-1878(199805)20:5<433::AID-BIES10>3.0.CO;2-2. [DOI] [PubMed] [Google Scholar]
- 42.Balazsi G, Heath A, Shi L, Gennaro M. The temporal response of the Mycobacterium tuberculosis gene regulatory network during growth arrest. Mol Syst Biol. 2008;4:225. doi: 10.1038/msb.2008.63. [DOI] [PMC free article] [PubMed] [Google Scholar]
- 43.Milo R, et al. Network motifs: simple building blocks of complex networks. Science. 2002;298:824–827. doi: 10.1126/science.298.5594.824. [DOI] [PubMed] [Google Scholar]
- 44.Maslov S, Sneppen K. Specificity and stability in topology of protein networks. Science. 2002;296:910–913. doi: 10.1126/science.1065103. [DOI] [PubMed] [Google Scholar]
- 45.Ptashne M. NY: Cold Harbor Spring Laboratory Press; 2004. A Genetic Switch: Phage λ Revisited. [Google Scholar]
- 46.Barkai N, Leibler S. Biological rhythms: circadian clocks limited by noise. Nature. 2000;403:267–268. doi: 10.1038/35002258. [DOI] [PubMed] [Google Scholar]
- 47.Guantes R, Poyatos J. Multistable decision switches for flexible control of epigenetic differentiation. PLoS CB. 2008;4:e1000235. doi: 10.1371/journal.pcbi.1000235. [DOI] [PMC free article] [PubMed] [Google Scholar]
Associated Data
This section collects any data citations, data availability statements, or supplementary materials included in this article.