

Abstract
Despite a 95% sequence similarity, the aggregation of human and mouse α-synuclein is remarkably different, as the human form is slower than the mouse form in forming fibrils, but is associated with Parkinson’s disease both in humans and transgenic mice. Here, the amino acid code underlying these differences is investigated by comparing the lag times, growth rates and secondary structure propensities of a systematic series of eight human-mouse chimeras. Fluorescence analysis of the human-mouse variants shows that the A53T substitution dominates the growth kinetics, while the lag phase is affected by a combination of the A53T and S87N substitutions. The secondary structure propensities derived from an NMR chemical shift analysis of the monomeric forms of the human-mouse variants enables us to establish a link between the changes in the conformational properties in the region of position 53 upon mutation and the corresponding changes in growth rates. These results suggest that the presence of an alanine residue at position 53 may be an evolutionary adaptation to minimize Parkinson’s disease in humans and indicates that effective drug development efforts may be directed to target this N-terminal region of the sequence.
Keywords: Amloid fibril formation, Nuclear magnetic resonance, Fluorescence, Intrinsically disordered protein, Parkinson’s diseases
INTRODUCTION
Protein misfolding diseases are associated with proteins that convert from their normally soluble form to large aggregates including amyloid fibrils that accumulate in the brain, or in affected organs.1 Among such conditions, Parkinson’s Disease (PD), the second most common neurodegenerative disorder, and dementia with Lewy bodies, are associated with the aggregation of α-synuclein (αSyn).2,3 Electron microscopy studies have shown that αSyn is the major protein component found in the Lewy bodies of patients with PD and that the protein exists as amyloid like fibrils, thus suggesting that this protein plays a key role in the etiology of the disease. αSyn is a 140-residue intrinsically disordered protein (IDP) that is highly expressed in presynaptic nerve terminals involved in promoting the assembly of the SNARE-complex in neuronal synapses.4 Thus, understanding the conversion of αSyn from its soluble to insoluble amyloid forms is critical to elucidating the molecular basis of PD.
αSyn fibrillation is a complex phenomenon that results from the interplay of the microscopic processes of nucleation, elongation, fragmentation and clearance of the aggregates.5 At the macroscopic level, this phenomenon is typically characterized by the presence of a lag phase followed by an exponential growth phase. Fibrillation studies in vitro using Thioflavin T (ThT) fluorescence have shown that the monomer form of αSyn undergoes a nucleation-dependent conversion to a cross-β rich oligomeric form whose morphology resembles that found in the diseased state.6,7 The delicate balance between the microscopic processes underlying αSyn fibril formation is revealed by the extreme sensitivity of the kinetics of this process to the sequence of the protein as well as to the solution conditions. For example, the point mutations A53T,8 A30P9 and E46K10 of human αSyn, which are autosomal dominant and linked to early onset disease, have faster rates of formation of pre-fibrillar oligomeric species and fibrillar species.11-14 Mouse αSyn, which differs from human αSyn at only seven positions has been shown to form fibrils significantly faster than human αSyn in previous studies.15 However, the detailed fibril assembly kinetics and the basis for the sequence dependent differences in fibrillation between human and mouse are not yet understood in detail.
In this work we designed a systematic set of human-mouse chimeras to pinpoint the residues or regions of the protein that result in faster fibrillation and are most sensitive to amino acid substitution. Kinetic measurements by ThT fluorescence experiments show that the identity of the N terminal substitution A53T plays a key role in controlling growth rates. Furthermore, we found the presence of specific local differences in secondary structure propensity at this position, as derived from a chemical shift analysis of the monomeric forms, which suggests a link between secondary structure propensity around residue 53 and aggregation rates.
RESULTS AND DISCUSSION
Design of human-mouse chimeras
αSyn is an IDP characterized by a low sequence complexity, low overall hydrophobicity and high net charge.16 The amino acid sequence of this protein can be divided into three regions: an N-terminal region (residues 1-60) with a highly conserved KTKEGV motif;17 a NAC region (residues 61-95) composed of a central hydrophobic region that has been proposed to be important for aggregatin; and a highly acidic C-terminal region (residues 96-140). The distribution of substitutions between human and mouse is asymmetric along the sequence with a single substitution (A53T) in the N-terminal region, a single substitution (S87N) in the NAC region and five substitutions (L100M, N103G, A107Y, D121G and N122S) in the C terminal region (Figure 1). The A53T substitution in mouse is the same as the mutation that results in early onset disease in humans and is considered to be a reversion to residues found in lower organisms.15 We analyzed in this work systematic variations of the different substituting residues to provide insight into the critical residues or regions that lead to faster nucleation and elongation of mouse versus human αSyn.
Figure 1.
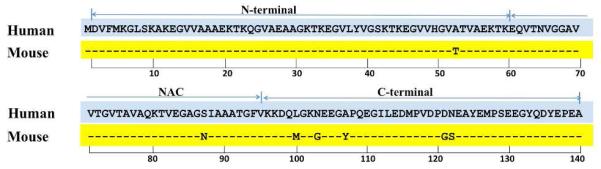
Sequence alignment of human and mouse αSyn; conserved residues are represented by dashed lines in the mouse sequence. Residue numbers are shown below the sequence and the N, NAC and C-terminal regions are identified above the sequence.
Sequence variants of human αSyn were designed by preparing a series of single-point mutations and domain chimeras. Starting with the human sequence as a control and denoting this sequence as HHH corresponding to human N-terminal, human NAC and human C-terminal, we prepared an additional seven variants in which each variant is composed of a combination of the three regions described above taken from mouse (M) or human (H) αSyn (Table 1). The variants contain either one substitution of the human to mouse region (for example MHH, HMH or HHM) or two substitutions (HMM, MHM or MMH) or all three substitutions (MMM) corresponding to the mouse sequence. The notation M or H is used for each region independently of the number of substitutions within the region, even if the N-terminal and NAC regions contain a single substitution while the C-terminal contains five substitutions.
Table 1.
αSyn human-mouse variants.
| αSyn Variants | Name |
|---|---|
| Human | HHH |
| Human A53T | MHH |
| Human S87N | HMH |
| Human L100M-N103G-A107Y-D121G-N122S | HHM |
| Human A53T-S87N | MMH |
| HumanA53T-L100M-N103G-A107Y-D121G-N122S | MHM |
| HumanS87N-L100M-N103G-A107Y-D121G-N122S | HMM |
| HumanA53T-S87N-L100M-N103G-A107Y-D121G-N122S (Mouse) | MMM |
Fibril morphology of human-mouse chimeras
All the variants were found to form amyloid fibrils (Figure 2.) within 8 days in a plate reader at 37 °C under linear 600 rpm shaking. Typically, for human αSyn and all the other variants, the fibril widths are around 10 nm and lengths vary from around 20 nm to 2 μm. The fibrils are always helically twisted or stuck together, however, for HMM, HHH and HHM long single fibrils prevail. Both straight and curved fibrils are observed. It is not clear whether the curved morphology is due to plasticity or the artifacts during drying on TEM grids.
Figure 2.

Negatively stained electron micrographs of the end products of fibril formation of the αSyn variants considered in this work. MMH (A), MHH (B), MHM (C), MMM (D), HMH (E), HMM (F), HHH (G) and HHM (H) are shown in each panel. The scale bar is 200 nm.
Fibril assembly kinetics: growth rates are dominated by the A53T substitution
To assess the effect of each mutational variant on the kinetics of fibril assembly, the growth rates and the lag times of all the variants were obtained from the fibril assembly process monitored by ThT fluorescence as a probe of the aggregation process. The kinetics of all the variants were recorded with multiple replicates simultaneously under physiological conditions with shaking (See Materials and Methods). All eight variants were measured at the same time and normalized data were used to determine the mean and standard deviation of the apparent growth rate and the lag time of each variant (Figure S1.).
Five-fold differences in apparent growth rates were observed for the eight variants (Figure 3A.). From Figure 3B., it is clear that the A53T substitution is the dominant factor in modulating the growth rates. Qualitatively the growth rates can be divided into two groups: one group contains the human A53 residue at the N-terminal (HMH, HMM, HHH and HHM) and has slower growth rates (Figure 4B.); a second group contains the mouse T53 residue (MMM, MHM, MHH and MMH) and has faster growth rates. For the group containing the human A53 residue, the apparent growth rates of the four variants are very similar to one another suggesting that other substitutions within the NAC and C-terminal region do not play a role in modulating the rates of growth. For the group containing the mouse T53 residue the growth rates of the four variants have a fivefold difference across the range. These results show that the growth rates in this group are sensitive not only to the mutation at position 53, but also to the human-mouse substitutions in the rest of the αSyn sequence. The 53T variants that contain a human C-terminal sequence (MHH, MMH) have faster growth rates than the 53T variants with the mouse C-terminal sequence (MHM, MMM) suggesting that the C-terminal sequence plays a secondary role in modulating the growth when residue 53 is a Thr. In contrast, substitutions in the NAC region do not impact on growth rates in a systematic way. Taken together, these data suggest that 1) Ala at position 53 is critical to slowing down the growth rates in the human-mouse chimeras; 2) Thr at position 53 results in faster growth rates in all the cases examined; the single A53T human to mouse mutation that results in early onset disease in humans has faster growth rates than mouse αSyn suggesting that the additional NAC or C-terminal substitutions in mouse may be compensatory mutations that slow down growth rates.
Figure 3.

Fluorescence kinetic analysis of αSyn and its variants. (A) The ratio of apparent growth rates of αSyn variants over that of human αSyn (HHH). (B) Schematic representation of variant sequences in the order of the slowest to the fastest growtu rates. The variants are color coded with the mouse region in yellow and the human region in blue. Dots represent substitutions from human to mouse αSyn. The bracket indicates the variants that have equivalent growth rates within the error bars. (C) The ratio of lag time of human αSyn (HHH) over that of αSyn variants. (D) Schematic representation of variant sequences in order of the longest to the shortest lag time. Color code and dots are the same as in (B). The bracket indicates the variants that have equivalent lag times within the error bars.
Fibril assembly kinetics: lag times are dominated by the combined N-terminal A53T and NAC S87N substitutions
We investigated the length of the lag phase for the eight human to mouse variants. The average lag time varied from 8 to 110 hours with the shortest lag time attributed to MMM and MMH and the longest to HHH and HHM (Figure 3C.). Variants with intermediate lag times include HMH, MHM, HMM and MHH. The lag time results are consistent with the previous observation by Rochet et al.15 that mouse αSyn (MMM) has a much shorter lag time than human αSyn (HHH) and human A53T (MHH). The data presented here suggest that two regions, the N-terminal and NAC region, of the sequence play a significant role in determining the length of the lag phase (Figure 3D.). Qualitatively the data can be divided into three groups. The longest lag time arises when the N-terminal and NAC region simultaneously contain the human residues 53A and 87S; the shortest lag time arises when both the N-terminal and NAC region contain the mouse residues 53T and 87N. Variants that contain either human and mouse sequences in the N-terminal and NAC result in intermediate lag times. In order to determine whether simultaneous mutations of residues 53 and 87 act in synergy, a statistical analysis has been performed to see whether the lag time of MMH, for instance, is what we expect if it is assumed that the effects of the HHH to HMH and MHH to MMH substitutions are independent. In Figure 4, we perform a factorial analysis in which the lag times for the variants XMH and XHH (X=H or M) are compared. If the effects on the lag time of the N-terminal and NAC region substitutions are independent of one another, then substitution of the N-terminal sequence to H or M should be independent of the context of the NAC sequence. In figure 4 we see that the difference in lag time between HMH and MMH is much smaller than the lag time difference for HHH and MHH showing that the identity of the NAC sequence plays a role in modulating the difference in lag time for the N-terminal substitutions. Another way of looking at the data is to note that the slopes of the two lines are not parallel showing that changing the NAC sequence from M to H within different N-terminal sequences results in different changes in lag times. These data suggest that the simultaneous A53T and S87N substitutions have a synergistic effect on the lag time and do not act independently of one another. Similar results are seen when comparing the variants that contain the mouse C-terminal substitutions (XMM and XHM).
Figure 4.

Factorial design analysis of the effect of A53T and S87N on the lag time of aSyn variants XMH and XHH with X=H and M. The brackets indicate the differences in the lag times of XMH with X=M and H and XHH with X=M and H. The slope of the lines represents the change in the lag time obtained by varying the NAC sequence while keeping the N-terminal sequence the same. Both the absolute differences shown by the brackets and the non parallel lines suggest a synergistic effect of A53T and S87N.
Different residues govern growth rates and lag times
The correlation between growth rates and lag times is analyzed to provide insight into whether sequence substitutions affect these two phases similarly. A plot of the growth rates versus lag times indicates that there is no correlation between the two parameters (Figure 5.). Previous studies have shown that polypeptide chains such as insulin, glucagon, Aβ peptide variants18 and β2-microglobulin19 have a high correlation between lag times and growth rates whereas a recent study on amyloid formation of Apolipoprotein C-II20 has revealed that DHPC affects only the lag time but not the growth rate of this process. The data presented here suggest that aggregation of αSyn is complex and that different regions of the protein are involved in different stages of the aggregation process. We show that the N-terminal A53T substitution plays a dominant role in altering the growth rates but that lag time is influenced by the N-terminal A53T and the NAC S87N substitution in synergy.
Figure 5.
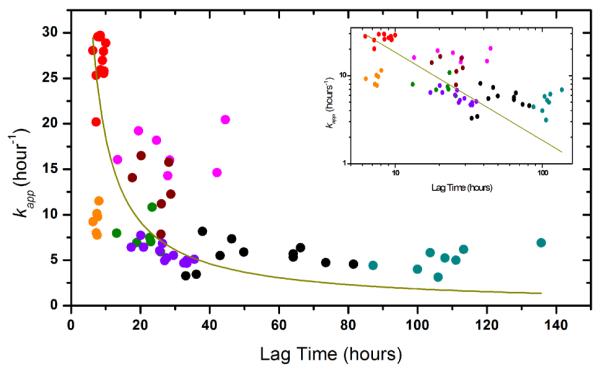
The correlation between lag time and kapp . The colors are MMH ( ), MHH (
 ), MHM (
 ), MMM (
 ), HMH (
 ), HMM (
 ), HHH (●), HHM (
 ). The fit kapp=a/(Tlag) lead to an adjusted r-square 0.04. Inset is the log-log plot of the same data set.
Evolutionary role of the N-terminal A53T and NAC S87N substitutions in affecting fibril assembly kinetics
To understand the functional significance of the A53T and S87N mutations we have investigated the conservation at positions 53 and 87 across different species using UniProt (www.uniprot.org) (Table S1). Thr is found at position 53 in many other species including New World primates and it has been hypothesized that the T53A mutation may be an evolutionary adaptation in humans to minimize the risk of PD.21 Our data support this view as A53 plays a dominant role in controlling the growth rates in human/mouse chimeras. In addition, further analysis of the 27 complete sequences from different species indicates that the A53T and S87N point mutations have less diversity than the other five residues in the C-terminal region as shown in Table S1. Thus the mutation in the NAC region at position 87, which has been shown in our studies to be a second key residue in minimizing the duration of the lag phase, may have functional significance. The sequence determinants of the lag times and growth rates in the αSyn human-mouse variants may provide a starting point for the design of aggregation inhibitors that target those regions of the protein.
Local differences in secondary structure propensities are observed at position 53 from NMR chemical shift data
It has been proposed that aggregation propensities are strongly influenced by conformational properties, including secondary structure propensities and long-range contacts.22-25 Previous NMR26 and CD15 studies have indicated that human and mouse αSyn are IDPs in the monomer form with conformations that are more compact than would be expected for a fully unfolded protein. NMR chemical shifts are sensitive indicators of secondary structure propensities of IDPs and have been analyzed to determine the differences in the conformational propensities of the eight variants described here. We use secondary structure propensity (SSP) scores23 with 13Cα and 13Cβ chemical shifts as input and a 5 residue sliding window to define a residue-specific secondary structure propensity. SSP scores were obtained for all variants and Figure 6. indicates that scores along the sequence are quite similar to one another except for the region around position 53. In this region, the SSP scores are divided into two groups of four variants each defined by whether residue 53 is an Ala or a Thr. For the group that has A53 (HHH, HHM, HMH, HMM) the SSP scores are negative suggesting that the conformational ensemble in this local region is sampling more β-sheet conformations on average. The group that contains a Thr at position 53 (MHH, MHM, MMH, MMM) has more positive SSP values suggesting more local helical conformation on average in the ensemble.
Figure 6.

SSP scores calculated using 13Cα and 13Cβ chemical shifts23 as a function of residue for all the αSyn human-mouse variants. The colors are MMH ( ), MHH (
 ), MHM (
 ), MMM (
 ), HMH (
 ), HMM (
 ), HHH (●), HHM (
 ). The region around position 53 is boxed and MXX represents the class of variants that have the mouse N-terminal sequence (MHH, MHM, MMH, MMM) and HXX represents the class of variants that contain the human N-terminal sequence (HHH, HHM, HMH, HMM). The inset is an enlarged region from residue 49 to 57.
The importance of the results presented here lies in the fact that there are systematic local differences in secondary structure propensities at and around position 53 as function of the amino acid type that occupies it. It is difficult to interpret SSP scores at any position along the sequence in terms of the absolute population of secondary structure elements as the scores represent ensemble-averaged values over a distribution. The SSP value does not uniquely define the α and β content within the distribution. Strikingly, the identity of position 53 as Ala or Thr is also responsible for regulating the growth rates in the human-mouse chimeras. The results on this series of eight human-mouse chimeras suggest that the growth rates of the human-mouse chimeras may be directly influenced by the secondary structure propensities at position 53 and that growth rates are correlated to local secondary structure propensities of the monomer conformational ensemble. Previous studies of PD-linked mutations A30P, A53T and E46K that have different fibrillation or aggregation rates have also shown small changes in local chemical shifts22,27 supporting the results presented here that local secondary structure propensities may be correlated to the kinetics of aggregation.
CONCLUSIONS
We have designed a systematic series of human-mouse αSyn variants to study the role of naturally occurring substitutions on the in vitro fibril assembly kinetics and have determined that the N-terminal A53T substitution, which is known to cause early-onset PD both in humans and in transgenic mice,28 plays a dominant role relative to the other substitutions in the NAC and C-terminal regions in speeding up the fibril assembly kinetics of mouse relative to human αSyn. Seen from a different perspective, the mutational variants that contain Ala at position 53 all have similar growth rates implying that this residue serves as a control mechanism for fibrillar aggregation. Indeed, an NMR chemical shift analysis suggests that the growth process is controlled by the nature of the secondary structure propensity in this region. These data support the notion that the presence of Ala at position 53 may be an evolutionary adaptation to minimize PD in humans and suggest that the monomer conformation, in particular the critical N-terminal region, may provide new targets for drug therapy in αSyn.
MATERIALS AND METHODS
αSyn variants were produced by site-directed mutagenesis using AccuPrime pfx from Invitrogen. The expression and purification of recombinant wild type and mutant αSyn were as previously described.25,26 Solutions containing αSyn were dialyzed against ammonium bicarbonate before lyophilization and the freeze-dried αSyn stored at −20 °C for fluorescence and NMR studies.
Protein was dissolved in Phosphate Buffer Saline (PBS) buffer (pH 7.4, NaCl 137 mM). The solution was filtered through a 100 kDa filter by centrifuging at 4 °C to remove the big aggregates and the final protein concentration was around 140 μM with 20 μM ThT for fluorescence measurements. 100 μL of the mixture was then pipetted into a well of the 96-well clear-bottom black-wall plate from Costar and sealed with clear sealing film from Axygen to prevent the evaporation during incubation. Measurements were recorded at 37 °C with linear shaking at 600 rpm. ThT fluorescence was recorded at 30-min intervals using a POLARstar Omega reader from BMG. All the variants formed fibrils within 200 hours. All the data were normalized to the final ThT signal and the resulting curves were used for analysis of lag time and apparent growth rate. At least six replicates were performed on each variant and then the averaged lag times and growth rates were calculated as well as the corresponding standard deviations. The growth rate was obtained by fitting a line to the slope of the growth phase and the lag time was determined from the intersect.29 Five biphasic curves were discarded.
Fibril morphology of the variants was observed with negative staining Transmission Electron Microscopy (TEM). The fibrils were grown in the well plates during the ThT kinetic experiments described above. One droplet of the sample from the well plate was placed on a discharged carbon-coated 300-mesh grid and then stained with freshly prepared 1% (w/v) uranyl acetate. Micrographs were recorded at a magnification of 100,000× with a JEM-100CXII manufactured by JEOL.
All NMR experiments were carried out using approximately 400 μM 15N labeled and 13C labeled αSyn in 10% (v/v) D2O in PBS buffer (same conditions as the kinetic studies) at 15 °C. Experiments were performed on either Varian 800 MHz or Bruker 700 MHz spectrometers. HNCACB/CBCACONH, HNCO/HN(CA)CO and HNN triple resonance experiments were collected for all variants to obtain HN, 15N ,13Cα ,13Cβ and 13CO resonance assignments. The data were processed with NMRPipe30 and then converted to Sparky 31,32 file format for data analysis. Proton chemical shifts were referenced to DSS (4,4-dimethyl-4-silapentane-1-sulfonic acid) as 0 ppm and 15N and 13C were indirectly calibrated by the gyromagnetic ratios.33 Duplicate triple resonance spectra collected on different machines several months apart showed that the 13Cα and 13Cβ chemical shifts have a standard deviation of 0.07 ppm.
Supplementary Material
ACKNOWLEDGMENT
This work has been supported by NIH grant GM45302 and GM087012 and NSF Grants DBI-0403062 and DBI-0320746. We thank David Fela for intellectual contributions at the earliest stages and for construction of some of the variant plasmids. We thank Daniel Weinstock and Ronald Levy for helpful discussions and Valentin Starovoytov for assistance with the TEM pictures
Footnotes
ASSOCIATED CONTENT
Supporting Information. The complete Reference 8 can be found in the SI. A plot of normalized kinetic data and a table containing aligned complete sequences of αSyn are included. This material is available free of charge via the internet at http://pubs.acs.org.
REFERENCES
- (1).Chiti F, Dobson CM. Annu. Rev. Biochem. 2006;75:333. doi: 10.1146/annurev.biochem.75.101304.123901. [DOI] [PubMed] [Google Scholar]
- (2).Goedert M. Nature Reviews. 2001;2:492. doi: 10.1038/35081564. [DOI] [PubMed] [Google Scholar]
- (3).Uversky VN. Front. Biosci. 2009;14:5188. doi: 10.2741/3594. [DOI] [PubMed] [Google Scholar]
- (4).Burre J, Sharma M, Tsetsenis T, Buchman V, Etherton MR, Sudhof TC. Science. 2010;329:1663. doi: 10.1126/science.1195227. [DOI] [PMC free article] [PubMed] [Google Scholar]
- (5).Knowles TP, Waudby CA, Devlin GL, Cohen SI, Aguzzi A, Vendruscolo M, Terentjev EM, Welland ME, Dobson CM. Science. 2009;326:1533. doi: 10.1126/science.1178250. [DOI] [PubMed] [Google Scholar]
- (6).Fink AL. Acc. Chem. Res. 2006;39:628. doi: 10.1021/ar050073t. [DOI] [PubMed] [Google Scholar]
- (7).Serpell LC, Berriman J, Jakes R, Goedert M, Crowther RA. Proc. Natl. Acad. Sci. U. S. A. 2000;97:4897. doi: 10.1073/pnas.97.9.4897. [DOI] [PMC free article] [PubMed] [Google Scholar]
- (8).Polymeropoulos MH, et al. Science. 1997;276:2045. doi: 10.1126/science.276.5321.2045. [DOI] [PubMed] [Google Scholar]
- (9).Krüger R, Kuhn W, Müller T, Woitalla D, Graeber M, Kösel S, Przuntek H, Epplen JT, Schols L, Riess O. Nat. Genet. 1998;18:106. doi: 10.1038/ng0298-106. [DOI] [PubMed] [Google Scholar]
- (10).Zarranz JJ, Alegre J, Gomez-Esteban JC, Lezcano E, Ros R, Ampuero I, Vidal L, Hoenicka J, Rodriguez O, Atares B, Llorens V, Tortosa E. Gomez, del Ser T, Munoz DG, de Yebenes JG. Ann. Neurol. 2004;55:164. doi: 10.1002/ana.10795. [DOI] [PubMed] [Google Scholar]
- (11).Fredenburg RA, Rospigliosi C, Meray RK, Kessler JC, Lashuel HA, Eliezer D, Lansbury PT., Jr. Biochemistry. 2007;46:7107. doi: 10.1021/bi7000246. [DOI] [PubMed] [Google Scholar]
- (12).Conway KA, Harper JD, Lansbury PT. Nat. Med. 1998;4:1318. doi: 10.1038/3311. [DOI] [PubMed] [Google Scholar]
- (13).Li J, Uversky VN, Fink AL. Biochemistry. 2001;40:11604. doi: 10.1021/bi010616g. [DOI] [PubMed] [Google Scholar]
- (14).Conway KA, Lee SJ, Rochet JC, Ding TT, Williamson RE, Lansbury PT., Jr. Proc. Natl. Acad. Sci. U. S. A. 2000;97:571. doi: 10.1073/pnas.97.2.571. [DOI] [PMC free article] [PubMed] [Google Scholar]
- (15).Rochet JC, Conway KA, Lansbury PT., Jr. Biochemistry. 2000;39:10619. doi: 10.1021/bi001315u. [DOI] [PubMed] [Google Scholar]
- (16).Uversky VN. Journal of Biomolecular Structure & Dynamics. 2003;21:211. doi: 10.1080/07391102.2003.10506918. [DOI] [PubMed] [Google Scholar]
- (17).Weinreb PH, Zhen W, Poon AW, Conway KA, Lansbury PT., Jr. Biochemistry. 1996;35:13709. doi: 10.1021/bi961799n. [DOI] [PubMed] [Google Scholar]
- (18).Fandrich M. J. Mol. Biol. 2007;365:1266. doi: 10.1016/j.jmb.2006.11.009. [DOI] [PubMed] [Google Scholar]
- (19).Platt GW, Routledge KE, Homans SW, Radford SE. J. Mol. Biol. 2008;378:251. doi: 10.1016/j.jmb.2008.01.092. [DOI] [PMC free article] [PubMed] [Google Scholar]
- (20).Ryan TM, Teoh CL, Griffin MD, Bailey MF, Schuck P, Howlett GJ. J. Mol. Biol. 2010;399:731. doi: 10.1016/j.jmb.2010.04.042. [DOI] [PMC free article] [PubMed] [Google Scholar]
- (21).Hamilton BA. Genomics. 2004;83:739. doi: 10.1016/j.ygeno.2003.09.016. [DOI] [PubMed] [Google Scholar]
- (22).Bussell R, Jr., Eliezer D. J. Biol. Chem. 2001;276:45996. doi: 10.1074/jbc.M106777200. [DOI] [PubMed] [Google Scholar]
- (23).Marsh JA, Singh VK, Jia Z, Forman-Kay JD. Protein Sci. 2006;15:2795. doi: 10.1110/ps.062465306. [DOI] [PMC free article] [PubMed] [Google Scholar]
- (24).Bertoncini CW, Jung YS, Fernandez CO, Hoyer W, Griesinger C, Jovin TM, Zweckstetter M. Proc. Natl. Acad. Sci. U. S. A. 2005;102:1430. doi: 10.1073/pnas.0407146102. [DOI] [PMC free article] [PubMed] [Google Scholar]
- (25).Wu K-P, Weinstock DS, Narayanan C, Levy RM, Baum J. J. Mol. Biol. 2009;391:784. doi: 10.1016/j.jmb.2009.06.063. [DOI] [PMC free article] [PubMed] [Google Scholar]
- (26).Wu KP, Kim S, Fela DA, Baum J. J. Mol. Biol. 2008;378:1104. doi: 10.1016/j.jmb.2008.03.017. [DOI] [PMC free article] [PubMed] [Google Scholar]
- (27).Rospigliosi CC, McClendon S, Schmid AW, Ramlall TF, Barre P, Lashuel HA, Eliezer D. J. Mol. Biol. 2009;388:1022. doi: 10.1016/j.jmb.2009.03.065. [DOI] [PMC free article] [PubMed] [Google Scholar]
- (28).Williamson JA, Loria JP, Miranker AD. J. Mol. Biol. 2009;393:383. doi: 10.1016/j.jmb.2009.07.077. [DOI] [PMC free article] [PubMed] [Google Scholar]
- (29).Routledge KE, Tartaglia GG, Platt GW, Vendruscolo M, Radford SE. J.Mol. Biol. 2009;389:776. doi: 10.1016/j.jmb.2009.04.042. [DOI] [PMC free article] [PubMed] [Google Scholar]
- (30).Delaglio F, Grzesiek S, Vuister GW, Zhu G, Pfeifer J, Bax A. J. Biomol. NMR. 1995;6:277. doi: 10.1007/BF00197809. [DOI] [PubMed] [Google Scholar]
- (31).Goddard TD, Kneller DG. University of California; San Francisco: [Google Scholar]
- (32).Yanagi K, Ashizaki M, Yagi H, Sakurai K, Lee YH, Goto Y. J. Biol. Chem. 2011 doi: 10.1074/jbc.M111.226688. [DOI] [PMC free article] [PubMed] [Google Scholar]
- (33).Wishart DS, Case DA. Methods Enzymol. 2001;3380:3. doi: 10.1016/s0076-6879(02)38214-4. [DOI] [PubMed] [Google Scholar]
Associated Data
This section collects any data citations, data availability statements, or supplementary materials included in this article.