

Abstract
Background and Aims
Germline variation in allele-specific expression (ASE) is associated with highly penetrant familial cancers, but its role in common sporadic cancers is unclear. ASE of the adenomatous polyposis coli (APC) gene plays a role in familial adenomatous polyposis coli. We hypothesized that moderate ASE variation in APC contributes to common forms of colorectal cancer (CRC).
Methods
Denaturing high performance liquid chromatography (DHPLC) was employed for germline APC ASE analysis in CRC cases (n=53) and controls (n=68). Means, medians, and variances of ASE were compared. Mutation analysis and SNP genotyping were performed.
Results
ASE distributions differed significantly between groups; cases had a significantly larger variance than controls (p = 0.0004). Importantly, CRC risk increased proportionally with the degree of deviation from the mean. Individuals with ASE deviating more than 1 SD from the mean had an odds ratio (OR) of 3.97 (1.71, 9.24 95% CI; p = 0.001); those deviating more than 1.645 SDs had an OR of 13.46 (1.76, 609.40 95% CI; p = 0.005). In support of these findings, sequence analysis revealed that a patient with marked ASE, who was negative for CRC family history, carried a nonsense APC mutation (p.Arg216X). Furthermore, APC genotyping showed that multiple SNPs were associated with ASE values and/or ASE variance in cases, but not in controls. Thus, cis variants may explain at least some of the ASE results.
Conclusion
Our results indicate that imbalanced germline ASE of APC is more frequent in CRC patients than controls, and represents an indicator of risk for common forms of CRC.
Keywords: ASE, APC gene, colorectal cancer, risk
Introduction
Variation in gene expression contributes to human phenotypic variability and can play a role in the etiology of disease (1, 2). This variation can be related to mechanisms affecting allele-specific expression (ASE) (3, 4, 5, 6). Germline ASE plays a role in relatively rare, but highly penetrant forms of cancer (3, 7, 8). For example, imbalanced germline ASE, affecting different genes, is known to be associated with familial breast cancer (9), male breast cancer (10), familial chronic lymphocytic leukemia (11), familial pancreatic cancer (12), familial adenomatous polyposis coli (FAP) (3, 7, 13, 14), hereditary non-polyposis colorectal cancer (HNPCC) (8, 15), and hereditary diffuse gastric cancer (HDGC) (16). The potential role of ASE in the more common, mostly sporadic, forms of cancer has recently received increasing attention, but the evidence supporting association, although intriguing, is still controversial (9, 17, 18, 19, 20, 21, 22, 23, 24). Four reports provided evidence that moderate degrees of germline ASE associate with sporadic cancer. Three suggested that altered germline ASE in TGFBR1 associates with colorectal cancer (CRC) (19, 22, 24) and another report indicated that ASE in BRCA1, and to a lesser extent in BRCA2, may affect risk of breast cancer, even in the absence of a BRCA1/2 mutation (9). However, three other reports failed to replicate the association between altered germline ASE in TGFBR1 and CRC (20, 21, 23).
In our study we investigated whether altered ASE of the adenomatous polyposis coli (APC) gene contributes to disease risk in a consecutive series of CRC patients. We chose to analyze APC for two reasons related to its crucial role in the etiology of both familial and sporadic CRC: 1) altered germline expression of APC is involved in monogenic CRC (i.e.: classical and attenuated FAP); 2) somatic APC mutations are found in most low-penetrance sporadic CRCs. In addition, while the role of germline ASE of APC has been documented in classical forms of FAP (3, 7, 13, 14, 25), its role in unselected CRC has not been previously investigated. We have also previously shown that allele-specific transcript dosage effects in APC may modulate clinical expression of FAP resulting in classical (>500 polyps) or attenuated (<30 polyps) phenotypes (13). Therefore, we hypothesized that less extreme ASE than that associated with FAP provides a level of CRC risk intermediate to that of the general population and FAP cases. Intriguingly, previous studies conducted in control individuals suggested that the range of ASE of the APC gene may be narrower in the general population than in FAP cases (3, 14, 25), supporting the hypothesis that modest variation in ASE may associate with pathogenic effects. Our results confirm that the range of variation in control individuals is relatively narrow and provide evidence that altered germline ASE of the APC gene associates with CRC risk.
Patients and Methods
Patients and nucleic acid preparation
Patients analyzed for ASE derive from a series of 334 consecutive consenting CRC patients diagnosed at the Division of Oncology of the “Santo Spirito” Hospital in Pescara, Italy, between December 2001 and July 2009. Consenting blood donors and geriatrics patients declaring no personal or family history for CRC were recruited as controls. All study participants gave written informed consent after verbal counseling; the research protocol was approved by the Human Investigations Committee of the “G. d’Annunzio” University of Chieti-Pescara.
The study included 127 individuals (70 controls and 57 patients) with available DNA and RNA from blood, who were heterozygous for the c.1458C>T (rs2229992) marker employed for subsequent ASE measurements. DNA and RNA were extracted as previously described (26). Synthesis of cDNA was performed using DNase I-treated RNA, random hexamers and the Superscript-II Reverse Transcriptase kit according to manufacturer specifications (Invitrogen, Carlsbad, CA).
ASE analysis
ASE analyses were carried out using a previously described method based on denaturing high performance liquid chromatography (DHPLC) (26). Primer sequences are provided in Supplementary Table 1.
We tested the reproducibility of the primer extension assay used for ASE with gDNA from the 127 heterozygous individuals included in the study (Supplementary Table 2). The mean ratio of peak heights corresponding to the two alleles was 0.88 (SD 0.04) and the overall coefficient of variation (CV) was 4.99%. Peak ratios deviating from the expected 1:1 using templates with equimolar allelic representation, such as gDNA, are commonly observed and potential explanations have been previously discussed (26). The mean ratio obtained with gDNA was employed to normalize the data generated in primer extension experiments conducted using cDNA templates. These normalized cDNA/gDNA ratios were designated as ASE values. Six individuals (two controls and four cases) with available gDNA data were not included in the statistical analysis for ASE because the CV% of their individual cDNA measures was large, indicating poor quality or insufficient quantity of target in the cDNA template (mean CV 33.68%; range 24.21%–50.94%). Inclusion of these individuals yielded virtually identical results (analyses not shown).
ASE measures were performed multiple times (mean 4.55; minimum 3, max 10) to test for assay consistency. Each primer extension experiment conducted for ASE analysis included gDNA and cDNA samples.
In controls ASE CVs of intra-individual determinations ranged from 0.02 to 16.80%, with a mean CV of 7.41% (Supplementary Table 3). Similar reproducibility was obtained for cases with CV ranging from 0.63 to 17.52%, with a mean CV of 9.24% (Supplementary Table 3). When multiple blood draws from the same cases were available the mean CV between independent ASE replicates was 7.85% (range = 0.63%–17.15%). These data support the overall reproducibility of our assays.
Screening for sequence variants and SNP genotyping
The entire coding sequence (exons 2–16) and intron-exon borders of APC were amplified in cases with altered ASE as previously described (27). The non-coding exon 1 was amplified using primers designed ad hoc (available upon request). Amplified fragments were analyzed by DHPLC (Wave 1100, Transgenomic, Omaha, NE) followed by sequencing as previously described (27, 28). SNP genotyping was conducted using the MassArray technology (Sequenom, San Diego, CA) (Supplementary Table 4). Linkage disequilibrium among SNPs was determined using Haploview (29).
Statistical analyses
ASE values were compared between cases and controls asking two distinct questions. First, we tested whether the ASE values (mean or median) differed between groups. Next, we asked whether the distribution of ASE values differed between cases and controls. Prior to testing for differences, the distribution within each group was tested for normality using a Shapiro Wilks test. Because the controls deviated from normality, comparison of ASE values (median) was done using the non-parametric Wilcoxon rank sum test. A second set of tests was performed to assess differences in distribution of ASE between cases and controls. This was done first with a Bartlett’s equal variance test, followed by tests to determine whether different proportions of individuals were a set distance from the mean in cases and controls (1.645 SDs from the mean and 1.00 SD from the mean). This was assessed with a Chi-square or Fisher’s exact test. Odds ratio of individuals in these categories was assessed with logistic regression. All analyses were performed with STATA (Version 10).
Association between single SNPs and ASE was analyzed using ANOVA. The Bartlett’s test was used to assess differences in variances between genotypes. STATA software was also used for these analyses.
Results
ASE measurements
ASE values were determined in 121 individuals (68 controls and 53 CRC cases) (Supplementary Table 3). The means of ASE values obtained in cases and controls were similar (Table 1). The distribution of ASE was tested for normality and the cases were normally distributed (p = 0.15), but the controls were not (p = 0.01). Of note the controls had smaller standard deviations, suggesting that the range of ASE values in the controls was tighter than in the cases. That is, the distribution of ASE in controls was more “canalized” than in cases. Because of the deviation from normality in the controls, a non-parametric test was performed to assess differences in ASE values between clinical groups. Median values were equivalent between cases and controls (1.27 and 1.20 respectively, p = 0.45) (Table 1). Similar results were found comparing the two groups with a t-test, assuming unequal variance (p = 0.57). These results clearly show that the mean and median ASE values do not differ significantly between groups.
Table 1.
Mean and median ASE values for cases and controls
| N | Mean (±SD) | Median | Min | Max | Shapiro- Wilk normality |
Wilcoxon rank sum |
Bartlett’s test |
|
|---|---|---|---|---|---|---|---|---|
| Case | 53 | 1.29 (0.33) | 1.27 | 0.43 | 2.46 | 0.147 | 0.4518 | 0.0004 |
| Control | 68 | 1.25 (0.21) | 1.20 | 0.89 | 1.92 | 0.014 | ||
| Total | 121 | 1.26 (0.27) | 1.23 | 0.43 | 2.46 | 0.0023 |
In contrast to the data indicating similar ASE medians and means in CRC patients and in control individuals, the distributions of ASE values differed significantly in the two groups, with cases having a larger ASE variance (p= 0.0004) (Table 1, Figure 1). Additional analyses confirmed this observation. Cases had a significantly larger proportion of individuals more than 1.645 and 1.0 standard deviations from the overall mean than controls (p = 0.005 and p = 0.001, respectively with Fisher’s Exact test) (Table 2). These analyses collectively demonstrate a wider distribution of ASE values in cases than in controls.
Figure 1. Boxplot for ASE values in cases and controls.
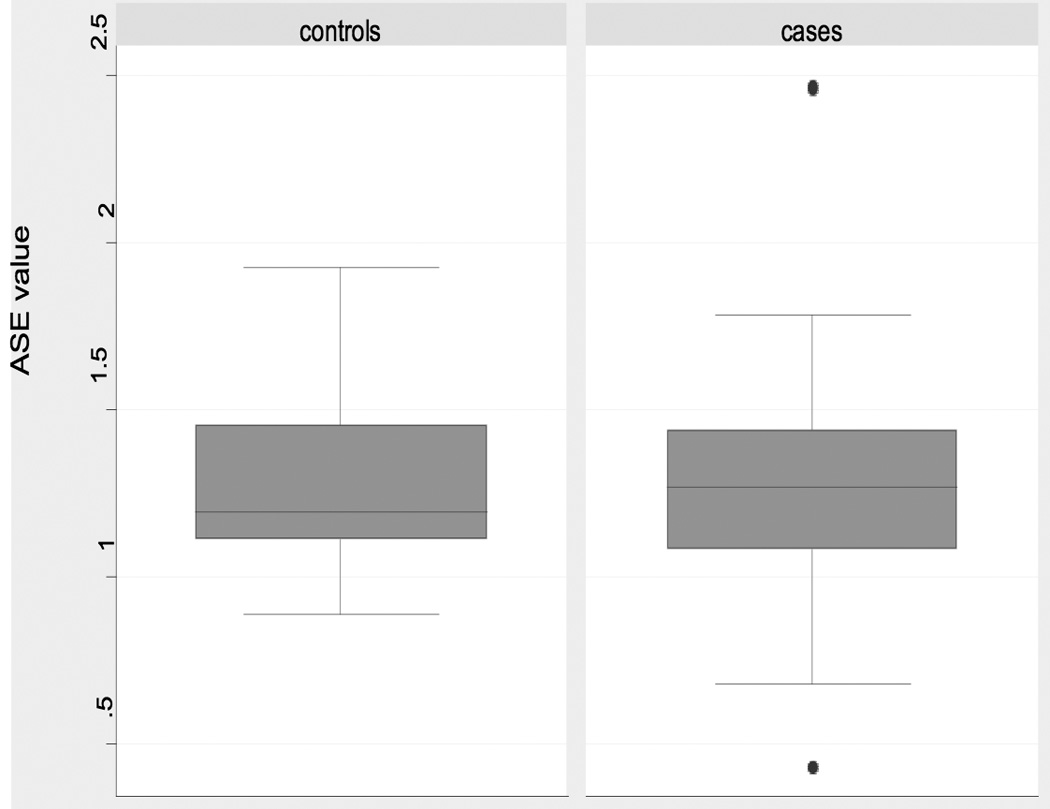
Boxplots of ASE distribution for individuals heterozygous at rs2229992. Note the outlying samples (cases) shown by filled circles.
Table 2.
Distribution of cases and controls at increasing distance from the overall mean ASE
| More than 1.645 standard deviations from the overall mean (<0.816 and >1.710) | |||||
|---|---|---|---|---|---|
| Status | Within 1.645 SD |
Out of 1.645 SD |
Total | Chi-square p-Value |
Fisher’s Exact p-value |
| Cases | 44 | 9 | 53 | 0.002 | 0.005 |
| Controls | 67 | 1 | 68 | ||
| Total | 111 | 10 | 121 | ||
|
More than 1.0 standard deviation from the overall mean (<0.991 and >1.534) | |||||
| Status | Within 1 SD |
Out of 1 SD |
Total | Chi-square p-Value |
Fisher’s Exact p-value |
| Cases | 30 | 23 | 53 | 0.001 | 0.001 |
| Controls | 57 | 11 | 68 | ||
| Total | 87 | 34 | 121 | ||
ASE and CRC risk
Deviation of ASE values from the overall mean was associated with increased risk of CRC. Individuals who deviated more than 1 SD from the mean had an odds ratio (OR) of 3.97 (1.71, 9.24 95% CI; p = 0.001) compared to those within 1 SD. Those who deviated from the mean by more than 1.645 SDs had an OR of 13.46 (1.76, 609.40 95% CI; p = 0.005), compared to those within 1.645 SDs. These data support a role of APC ASE distribution in CRC risk.
Sequence analysis
All patients showing pronounced or moderate ASE (falling outside of 1.645 or 1 SDs from the overall mean, respectively) were screened for germline variants in the APC coding sequence and intron-exon borders. Remarkably, one of the patients with more marked ASE (CASE 19, age at CRC diagnosis 43 years, Table 3) had a nonsense APC mutation (p.Arg216X) previously reported in classical FAP (30, 31). Thus, the patient, who reported a negative family history for CRC, was a putative de novo FAP case occurring in our unselected series. A posteriori examination of the surgical and pathological records confirmed that the patient had diffuse polyposis.
Table 3.
Results of sequence analysis
| Patient code |
Age at diagnosis |
Sex | ASE* value |
APC mutation/variant |
|||
|---|---|---|---|---|---|---|---|
| Exon | Variant | SNP code | Effect (if known) | ||||
| CASE 1 | 64 | F | 0.81 | 16 | c.4479G>A | rs41115 | p.Thr1493Thr |
| CASE 2 | 61 | F | 1.58 | 14 | c.1635A>G | rs351771 | p.Ala545Ala |
| 16 | c.5268G>T | rs866006 | p.Ser1756Ser | ||||
| 16 | c.5465A>T | rs459552 | p.Asp1822Val | ||||
| CASE 3 | 56 | M | 0.75 | wt | / | ||
| CASE 7 | 55 | M | 1.59 | 14 | c.1635A>G | rs351771 | p.Ala545Ala |
| 16 | c.5268G>T | rs866006 | p.Ser1756Ser | ||||
| CASE 12 | 68 | F | 0.93 | IVS6 | c.645+32C>T | rs29009961 | / |
| 14 | c.1635A>G | rs351771 | p.Ala545Ala | ||||
| 16 | c.5268G>T | rs866006 | p.Ser1756Ser | ||||
| 16 | c.5465A>T | rs459552 | p.Asp1822Val | ||||
| CASE 16 | 56 | M | 1.57 | IVS1 | c.1-111T>C† | - | / |
| 16 | c.3949G>C | rs1801166 | p.Glu1317Gln | ||||
| 16 | c.4479A | rs 41115 | p.1493Thr | ||||
| CASE 18 | 76 | F | 1.78 | wt | / | ||
| CASE 19 | 43 | F | 0.43 | 7 | c.646C>T | p.Arg216X | |
| CASE 22 | 66 | F | 1.64 | 16 | c.4479G>A | rs41115 | p.Thr1493Thr |
| CASE 23 | 65 | M | 2.46 | 16 | c.4479A | rs41115 | p.1493Thr |
| CASE 25 | 66 | M | 1.72 | IVS1 | c.1-111T>C† | - | / |
| 16 | c.3949G>C | rs1801166 | p.Glu1317Gln | ||||
| 16 | c.4479A | rs41115 | p.1493Thr | ||||
| CASE 28 | 76 | M | 1.76 | wt | / | ||
| CASE 29 | 68 | M | 0.98 | 14 | c.1635A>G | rs351771 | p.Ala545Ala |
| 16 | c.3512G>A | p.Arg1171His | |||||
| CASE 31 | 60 | M | 0.68 | IVS6 | c.645+32C>T | rs29009961 | / |
| 14 | c.1635A>G | rs351771 | p.Ala545Ala | ||||
| CASE 32 | 48 | F | 0.95 | 16 | c.5268G>T | rs866006 | p.Ser1756Ser |
| 16 | c.5465A>T | rs459552 | p.Asp1822Val | ||||
| CASE 33 | 45 | F | 0.94 | wt | / | ||
| CASE 34 | 74 | M | 1.70 | 16 | c.4479G>A | rs41115 | p.Thr1493Thr |
| 16 | c.5268G>T | rs866006 | p.Ser1756Ser | ||||
| 16 | c.5465A>T | rs459552 | p.Asp1822Val | ||||
| CASE 37 | 71 | M | 1.78 | wt | / | ||
| CASE 44 | 69 | F | 1.55 | 14 | c.1635A>G | rs351771 | p.Ala545Ala |
| 16 | c.4479G>A | rs41115 | p.Thr1493Thr | ||||
| 16 | c.5268G>T | rs866006 | p.Ser1756Ser | ||||
| 16 | c.5465A>T | rs459552 | p.Asp1822Val | ||||
| CASE 49 | 77 | F | 1.59 | IVS3 | c.220+4G>A† | - | / |
| 16 | c.4479G>A | rs41115 | p.Thr1493Thr | ||||
| 16 | c.5034A>G | - | p.Gly1678Gly | ||||
| 16 | c.5268G>T | rs866006 | p.Ser1756Ser | ||||
| CASE 50 | 41 | M | 1.58 | 16 | c.5268G>T | rs866006 | p.Ser1756Ser |
| 16 | c.5465A>T | rs459552 | p.Asp1822Val | ||||
| CASE 51 | 51 | M | 0.94 | 14 | c.1635A>G | rs351771 | p.Ala545Ala |
| 16 | c.5268G>T | rs866006 | p.Ser1756Ser | ||||
| 16 | c.5465A>T | rs459552 | p.Asp1822Val | ||||
| 16 | c.7862C>G | rs72541816 | p.Ser2621Cys | ||||
| CASE 53 | 36 | M | 0.96 | 16 | c.4479A | rs41115 | p.1493Thr |
ASE values outside 1.645 SD are in bold
Predicted effects on splicing and transcriptional regulation of these novel APC variants were evaluated in silico using fruitfly software (www.fruitfly.org) and a transcriptional regulatory element database (www.rulai.cshl.edu), respectively.
Additionally, 11 sequence variants were detected in 17 patients, including 2 novel intronic nucleotide substitutions (c.1-111T>C and c.220+4G>A) and 9 previously described variants (Table 3). The novel intronic variants were not predicted to have any effects on splicing or transcription. The missense variant rs1801166 (p.Glu1317Gln commonly designated E1317Q), whose association with cancer is controversial (32, 33), was detected at a relatively high frequency in cases with ASE (2 of 23) relative to all cases and to controls (Table 3, Supplementary Table 4), but our sample size does not allow us to draw conclusions regarding its association with disease.
SNPs and ASE
Of the 23 single nucleotide polymorphisms (SNPs) initially genotyped only eight were analyzed for association with ASE after excluding variants that were monomorphic or near monomorphic (minor allele frequency, MAF < 0.03) (Supplementary Table 4). The results are presented in Table 4 and Supplementary Table 5. In the analysis that included both cases and controls, rs41115, rs467033 (in a dominant model), rs971517 and rs2431507 were all associated with ASE (Table 4, Supplementary Table 5). For rs41115, individuals homozygous for the TT allele had highest ASE values compared to CC and CT, or combined CC and CT genotypes. For rs467033 the T allele was associated with a higher ASE value in a dominant model; for rs971517 the relationship between ASE and genotype appeared to be additive with the C allele associating with higher ASE values (p = 0.001). Comparisons of the variances with SNP genotypes showed that rs41115, rs459552, rs2431238 and rs10428710, all had p values for the Bartlett’s test indicating that also the variances were significantly different among genotypes in the combined data set (Table 4, Supplementary Table 5).
Table 4.
Association of SNPs in APC with ASE outcome*
| Cases and controls combined |
Controls only | Cases only | ||||
|---|---|---|---|---|---|---|
| SNP | Anova p-value |
Bartlett’s test p-value |
Anova p-value |
Bartlett’s test p-value |
Anova p-value |
Bartlett’s test p-value |
| rs41115 | 0.0091 | 0.066 | 0.5907^ | 0.803 | 0.0058 | 0.131 |
| rs41115 (dominant)** | 0.0268# | 0.015 | 0.9088^ | 0.802 | 0.0013 | 0.116 |
| rs459552 | 0.8310# | 0.013 | 0.9640^ | 0.653 | 0.7220# | 0.025 |
| rs467033 | 0.1060^ | 0.212 | 0.1752^ | 0.989 | 0.2535 | 0.289 |
| rs467033 (dominant)** | 0.0342^ | 0.222 | 0.1752^ | 0.989 | 0.0973 | 0.302 |
| rs971517 | 0.0010 | 0.084 | 0.1641^ | 0.935 | 0.0103 | 0.148 |
| rs2431238 | 0.7139^ | 0.097 | 0.9929 | 0.671 | 0.2476# | 0.041 |
| rs2431238 (dominant)** | 0.4118#^ | 0.019 | 0.9049 | 0.470 | 0.2476# | 0.041 |
| rs2431507 | 0.0168^ | 0.190 | 0.0920^ | 0.887 | 0.0973 | 0.302 |
| rs10428710 | 0.8598^ | 0.063 | 0.9337^ | 0.840 | 0.5819# | 0.013 |
| rs10428710 (dominant)** | 0.7851# | 0.019 | 0.9898^ | 0.775 | 0.5819# | 0.013 |
| rs13358140 | 0.1509^ | 0.178 | 0.1336^ | 0.591 | 0.6526 | 0.066 |
Analyses were done on untransformed data using either ANOVA, where appropriate, or Kruskal-Wallis (as noted). This was because transformation failed to normalize data that deviated from normality.
In situations where there were few homozygotes of one class, analyses were performed using all three genotypes, as well as on heterozygotes pooled with the rare homozygotes (dominant model).
Kruskal-Wallis test used because of deviations from equal variance
Kruskal-Wallis used because of deviation from normality
In the “control only” group there was no evidence of significant association of any SNP with ASE or ASE variance (Table 4, Supplementary Table 5). However, most SNPs that showed association with ASE or with ASE variance in the combined group were only statistically significant in the “case only” group, suggesting that the signal detected in the combined analyses was primarily due to the case group (Table 4, Supplementary Table 5). A difference between the genetic effects on ASE in these two groups is further supported by the observation that linkage disequilibrium patterns appear to differ in cases and controls (Supplementary Figure 1).
Discussion
Mendelian syndromes predisposing to CRC are estimated to account for at most 5–10% of the overall incidence of the disease and the nature of the residual susceptibility is presently undefined (34). Multiple germline mutations in several, often unrelated genes, including APC, have been linked to familial CRC (34). In our study we tested the hypothesis that ASE of APC associates with risk of CRC in patients unselected for family history.
Our mean and median values of APC ASE were similar in cases and controls, indicating that there were no differences in average values between the two groups. However, the ORs for CRC increased with the size of the deviation from the ASE mean, supporting the conclusion that having imbalanced ASE increased disease risk. In agreement with this finding, ASE in FAP may be even more extreme (13, 14), which is consistent with a continuum model where CRC risk increases as APC ASE imbalance increases. Data from other studies, that reported an excess of “outliers” among FAP cases as compared to controls, support such a model. For example, in Castellsagué et al. (Figure 3 in reference 14) no controls are outside of the range they define as normal. Also, other reports (3, 4, 7, 13) are compatible with a model that implicates ASE imbalance in APC as a marker of CRC risk, although in those studies differences of ASE distributions between cases and controls were not explicitly tested.
Our data are also consistent with studies on other tumor-predisposing genes, suggesting that imbalanced allelic expression of TGFBR1, BRCA1 and BRCA2 increases risk of sporadic colorectal or breast cancer (9, 19). However, while altered germline ASE of TGFBR1 was found to associate with CRC in two subsequent studies (22, 24), these findings were not replicated in three other studies (20, 21, 23). Important for the interpretation of our results: 1) several TGFBR1 studies focused on the analyses of mean and/or median ASE values, and it is possible that differences in these parameters do not affect risk, as our data on APC suggest; 2) ASE in TGFBR1 might be more tolerated than ASE of APC and therefore could be a less important risk factor of CRC; 3) discrepancies among TGFBR1 studies may be due to differences in study design and to the use of assays and/or samples yielding inconsistent results, as suggested by Tomsic et al. (22). It is noteworthy that a narrow range of APC ASE variation in controls was consistently reported in all studies that assessed this variability (3, 4, 14, 25), supporting the hypothesis that ASE of APC is likely to be pathogenic. With respect to the ASE assays we point out that the consistency of the APC assay used in our study is very close to that of the method considered state of the art (average SD of 0.1 in our study, compared to 0.094 obtained by pyrosequencing in reference 22) and samples yielding inconsistent ASE measurements were not considered in our analyses.
We note that in our and other studies not all individuals with allelic imbalance were affected by CRC (19, 21, 22, 23). The occurrence of ASE in APC among controls may relate to the possibility that allelic imbalance per se is predisposing, but with low penetrance. According to this hypothesis, other interacting factors, such as genetic and environmental modifiers, modulate penetrance of ASE imbalances. Another possibility, more consistent with the oncosuppressor nature of APC, is that ASE of this gene is pathogenic only when it reflects inappropriately decreased allelic expression. In fact, it has been shown that in FAP pathogenic ASE of APC may reflect virtually monoallelic expression (13, 14). Conversely, imbalanced ASE would be non-pathogenic when one allele is within the normal range and the other allele is upregulated. Thus, ASE will track pathogenic decreases in allelic expression in some but not all cases. However, ASE is more reliably measured than absolute allelic expression and can serve as an excellent marker for pathogenic decreases in allelic expression (9). In any case, the relevance of APC ASE as a marker of pathogenic imbalances is supported by the narrow range of ASE variation in the control population and by the significantly higher frequency of imbalanced ASE in cases.
In our study, independent support for a pathogenic role of imbalanced ASE in APC derives from sequence and SNP analyses. Sequencing of cases with imbalanced ASE showed that a patient with one of the most pronounced ASE values, but reporting negative family history, carried a stop codon in APC. Furthermore, SNP analyses showed associations between ASE and its variance with several SNPs in the APC gene. This implies that genetic variation in APC can play a role in ASE. This result was only observed in the cases, but the control samples often had similar trends in genotype-ASE relationships, which is not unexpected considering that as discussed above, ASE may reflect different phenomena in cases (pathogenic) versus controls (non-pathogenic). It is also reasonable to postulate that the case-control differences in patterns of association are driven by factors, either environmental or genetic, not assessed in our study. The genetic factors might be either cis or trans acting, but it is of interest that one of the most significant SNP, rs971517, is in the upstream region of APC, perhaps in linkage with some as yet unknown variant affecting regulatory control at the transcriptional level. This SNP is in linkage disequilibrium (LD) with another upstream SNP (rs10428710), as well as with other SNPs (rs467033, rs2431507, and rs41115) showing evidence of association with ASE in the combined case and control data (Supplementary Figure 1, Table 4). These data indicate that cis regulatory elements may explain at least some of the ASE results.
In conclusion, we detected wider variation in ASE of APC among CRC patients as compared to controls, which was reflected also by a greater proportion of individuals among cases having ASE more than 1 and 1.645 SDs from the overall means. Moreover, CRC risk appeared to increase proportionally with the degree of APC ASE, indicating that this is a novel promising marker for CRC predisposition. These data support the conclusion that the same genes that predispose to rare highly penetrant familial cancer may act in apparently sporadic cancer by mechanisms causing ASE.
Supplementary Material
Acknowledgments
We thank the DNA Resources Core Center for Human Genetics Research, Vanderbilt University, Nashville, TN, for SNP genotyping analyses.
Grant support: The study was supported by Italian Ministry of Instruction, University and Research to M.C.C. and A.C.
Abbreviations
- APC
adenomatous polyposis coli
- ASE
allele-specific expression
- CRC
colorectal cancer
- CV
coefficient of variation
- FAP
familial adenomatous polyposis
- MAF
minor allele frequency
- SD
standard deviation
Footnotes
Publisher's Disclaimer: This is a PDF file of an unedited manuscript that has been accepted for publication. As a service to our customers we are providing this early version of the manuscript. The manuscript will undergo copyediting, typesetting, and review of the resulting proof before it is published in its final citable form. Please note that during the production process errors may be discovered which could affect the content, and all legal disclaimers that apply to the journal pertain.
Author contributions:
Maria Cristina Curia: generation, collection, and assembly of data; drafting of the manuscript.
Sabrina De Iure: generation, collection and assembly of data.
Laura De Lellis: generation, collection and assembly of data.
Serena Veschi: generation, collection and assembly of data.
Sandra Mammarella: generation, collection and assembly of data.
Marquitta J. White: analysis and interpretation of data.
Jacquelaine Bartlett: analysis and interpretation of data.
Angelo Di Iorio: collection of data.
Cristina Amatetti: collection of data.
Marco Lombardo: collection of data.
Patrizia Di Gregorio: collection of data.
Pasquale Battista: collection of data.
Renato Mariani-Costantini: critical revision of the manuscript for important intellectual content.
Scott M. Williams: statistical analysis and interpretation of data; drafting and revision of the manuscript.
Alessandro Cama: conception and design of the study; drafting and revision of the manuscript.
Conflict of interest: The authors disclose no conflicts of interest.
References
- 1.Montgomery SB, Sammeth M, Gutierrez-Arcelus M, et al. Transcriptome genetics using second generation sequencing in a Caucasian population. Nature. 2010;464:773–777. doi: 10.1038/nature08903. [DOI] [PMC free article] [PubMed] [Google Scholar]
- 2.Emilsson V, Thorleifsson G, Zhang B, et al. Genetics of gene expression and its effect on disease. Nature. 2008;452:423–428. doi: 10.1038/nature06758. [DOI] [PubMed] [Google Scholar]
- 3.Yan H, Dobbie Z, Gruber SB, et al. Small changes in expression affect predisposition to tumorigenesis. Nat Genet. 2002;30:25–26. doi: 10.1038/ng799. [DOI] [PubMed] [Google Scholar]
- 4.Yan H, Yuan W, Velculescu VE, et al. Allelic variation in human gene expression. Science. 2002;297:1143. doi: 10.1126/science.1072545. [DOI] [PubMed] [Google Scholar]
- 5.Lo HS, Wang Z, Hu Y, Yang HH, et al. Allelic variation in gene expression is common in the human genome. Genome Res. 2003;13:1855–1862. doi: 10.1101/gr.1006603. [DOI] [PMC free article] [PubMed] [Google Scholar]
- 6.Pickrell JK, Marioni JC, Pai AA, et al. Understanding mechanisms underlying human gene expression variation with RNA sequencing. Nature. 2010;464:768–772. doi: 10.1038/nature08872. [DOI] [PMC free article] [PubMed] [Google Scholar]
- 7.Powell SM, Petersen GM, Krush AJ, et al. Molecular diagnosis of familial adenomatous polyposis. N Engl J Med. 1993;329:1982–1987. doi: 10.1056/NEJM199312303292702. [DOI] [PubMed] [Google Scholar]
- 8.Curia MC, Palmirotta R, Aceto G, et al. Unbalanced germ-line expression of hMLH1 and hMSH2 alleles in hereditary nonpolyposis colorectal cancer. Cancer Res. 1999;59:3570–3575. [PubMed] [Google Scholar]
- 9.Chen X, Weaver J, Bove BA, et al. Allelic imbalance in BRCA1 and BRCA2 gene expression is associated with an increased breast cancer risk. Hum Mol Genet. 2008;17:1336–1348. doi: 10.1093/hmg/ddn022. [DOI] [PubMed] [Google Scholar]
- 10.Ottini L, Masala G, D'Amico C, et al. BRCA1 and BRCA2 mutation status and tumor characteristics in male breast cancer: a population-based study in Italy. Cancer Res. 2003;63:342–347. [PubMed] [Google Scholar]
- 11.Raval A, Tanner SM, Byrd JC, et al. Downregulation of death-associated protein kinase 1 (DAPK1) in chronic lymphocytic leukemia. Cell. 2007;129:879–890. doi: 10.1016/j.cell.2007.03.043. [DOI] [PMC free article] [PubMed] [Google Scholar]
- 12.Tan AC, Fan JB, Karikari C, et al. Allele-specific expression in the germline of patients with familial pancreatic cancer: an unbiased approach to cancer gene discovery. Cancer Biol Ther. 2008;7:135–144. doi: 10.4161/cbt.7.1.5199. [DOI] [PMC free article] [PubMed] [Google Scholar]
- 13.Curia MC, Esposito DL, Aceto G, et al. Transcript dosage effect in familial adenomatous polyposis: model offered by two kindreds with exon 9 APC gene mutations. Hum Mutat. 1998;11:197–201. doi: 10.1002/(SICI)1098-1004(1998)11:3<197::AID-HUMU3>3.0.CO;2-F. [DOI] [PubMed] [Google Scholar]
- 14.Castellsagué E, González S, Guinó E, et al. Allele-Specific Expression of APC in Adenomatous Polyposis Families. Gastroenterology. 2010;139:439–447. doi: 10.1053/j.gastro.2010.04.047. [DOI] [PMC free article] [PubMed] [Google Scholar]
- 15.Renkonen E, Zhang Y, Lohi H, et al. Altered expression of MLH1, MSH2, and MSH6 in predisposition to hereditary nonpolyposis colorectal cancer. J Clin Oncol. 2003;21:3629–3637. doi: 10.1200/JCO.2003.03.181. [DOI] [PubMed] [Google Scholar]
- 16.Pinheiro H, Bordeira-Carriço R, Seixas S, et al. Allele-specific CDH1 downregulation and hereditary diffuse gastric cancer. Hum Mol Genet. 2010;19:943–952. doi: 10.1093/hmg/ddp537. [DOI] [PMC free article] [PubMed] [Google Scholar]
- 17.Castellví-Bel S, Castells A. Allele-specific expression as a new genetic susceptibility mechanism for colorectal cancer. Gastroenterology. 2009;136:2397–2399. doi: 10.1053/j.gastro.2009.04.035. [DOI] [PubMed] [Google Scholar]
- 18.de la Chapelle A. Genetic predisposition to human disease: allele-specific expression and low-penetrance regulatory loci. Oncogene. 2009;28:3345–3348. doi: 10.1038/onc.2009.194. [DOI] [PMC free article] [PubMed] [Google Scholar]
- 19.Valle L, Serena-Acedo T, Liyanarachchi S, et al. Germline allele-specific expression of TGFBR1 confers an increased risk of colorectal cancer. Science. 2008;321:1361–1365. doi: 10.1126/science.1159397. [DOI] [PMC free article] [PubMed] [Google Scholar]
- 20.Guda K, Natale L, Lutterbaugh J, et al. Infrequent detection of germline allele-specific expression of TGFBR1 in lymphoblasts and tissues of colon cancer patients. Cancer Res. 2009;69:4959–4961. doi: 10.1158/0008-5472.CAN-09-0225. [DOI] [PMC free article] [PubMed] [Google Scholar]
- 21.Carvajal-Carmona LG, Churchman M, Bonilla C, et al. Comprehensive assessment of variation at the transforming growth factor beta type 1 receptor locus and colorectal cancer predisposition. Proc Natl Acad Sci U S A. 2010;107:7858–7862. doi: 10.1073/pnas.1002816107. [DOI] [PMC free article] [PubMed] [Google Scholar]
- 22.Tomsic J, Guda K, Liyanarachchi S, et al. Allele-specific expression of TGFBR1 in colon cancer patients. Carcinogenesis. 2010;31:1800–1804. doi: 10.1093/carcin/bgq165. [DOI] [PMC free article] [PubMed] [Google Scholar]
- 23.Seguí N, Stevens KN, Guinó E, et al. No association between germline allele-specific expression of TGFBR1 and colorectal cancer risk in Caucasian and Ashkenazi populations. Br J Cancer. 2011;104:735–740. doi: 10.1038/sj.bjc.6606079. [DOI] [PMC free article] [PubMed] [Google Scholar]
- 24.Pasche B, Wisinski KB, Sadim M, et al. Constitutively decreased TGFBR1 allelic expression is a common finding in colorectal cancer and is associated with three TGFBR1 SNPs. J Exp Clin Cancer Res. 2010;29:57. doi: 10.1186/1756-9966-29-57. [DOI] [PMC free article] [PubMed] [Google Scholar]
- 25.Renkonen ET, Nieminen P, Abdel-Rahman WM, et al. Adenomatous polyposis families that screen APC mutation-negative by conventional methods are genetically heterogeneous. J Clin Oncol. 2005;23:5651–5659. doi: 10.1200/JCO.2005.14.712. [DOI] [PubMed] [Google Scholar]
- 26.Aceto GM, De Lellis L, Catalano T, et al. Nonfluorescent denaturing HPLC-based primer-extension method for allele-specific expression: application to analysis of mismatch repair genes. Clin Chem. 2009;55:1711–1718. doi: 10.1373/clinchem.2009.126300. [DOI] [PubMed] [Google Scholar]
- 27.Wu G, Wu W, Hegde M, et al. Detection of sequence variations in the adenomatous polyposis coli (APC) gene using denaturing high-performance liquid chromatography. Genet Test. 2001;5:281–290. doi: 10.1089/109065701753617408. [DOI] [PubMed] [Google Scholar]
- 28.Aceto G, Curia MC, Veschi S, et al. Mutations of APC and MYH in unrelated Italian patients with adenomatous polyposis coli. Hum Mutat. 2005;26:394. doi: 10.1002/humu.9370. [DOI] [PubMed] [Google Scholar]
- 29.Barrett JC, Fry B, Maller J, et al. Haploview: analysis and visualization of LD and haplotype maps. Bioinformatics. 2005;21:263–265. doi: 10.1093/bioinformatics/bth457. [DOI] [PubMed] [Google Scholar]
- 30.Stekrova J, Sulova M, Kebrdlova V, et al. Novel APC mutations in Czech and Slovak FAP families: clinical and genetic aspects. BMC Med Genet. 2007;8:16. doi: 10.1186/1471-2350-8-16. [DOI] [PMC free article] [PubMed] [Google Scholar]
- 31.Gómez-Fernández N, Castellví-Bel S, Fernández-Rozadilla C, et al. Molecular analysis of the APC and MUTYH genes in Galician and Catalonian FAP families: a different spectrum of mutations? BMC Med Genet. 2009;10:57. doi: 10.1186/1471-2350-10-57. [DOI] [PMC free article] [PubMed] [Google Scholar]
- 32.Frayling IM, Beck NE, Ilyas M, et al. The APC variants I1307K and E1317Q are associated with colorectal tumors, but not always with a family history. Proc Natl Acad Sci U S A. 1998;95:10722–10727. doi: 10.1073/pnas.95.18.10722. [DOI] [PMC free article] [PubMed] [Google Scholar]
- 33.Popat S, Stone J, Coleman G, et al. Prevalence of the APC E1317Q variant in colorectal cancer patients. Cancer Lett. 2000;149:203–206. doi: 10.1016/s0304-3835(99)00360-2. [DOI] [PubMed] [Google Scholar]
- 34.Jasperson KW, Tuohy TM, Neklason DW, et al. Hereditary and familial colon cancer. Gastroenterology. 2010;138:2044–2058. doi: 10.1053/j.gastro.2010.01.054. [DOI] [PMC free article] [PubMed] [Google Scholar]
Associated Data
This section collects any data citations, data availability statements, or supplementary materials included in this article.