Abstract
Background
Instability in ventricular repolarization in the presence of premature activations (PA) plays an important role in arrhythmogenesis. However, such instability cannot be detected clinically. This study developed a methodology for detecting QT interval (QTI) dynamics instability from the ECG, and explored the contribution of PA and QTI instability to ventricular tachycardia (VT) onset.
Methods and Results
To examine the contribution of PAs and QTI instability to VT onset, ECGs of 24 acute myocardial infarction (AMI) patients, 12 of which has sustained VT (VT) and 12 non-sustained VT (NSVT), were used. From each patient ECG, two 10-minutes-long ECG recordings were extracted, one right before VT onset (ONSET epoch) least 1h before it (CONTROL epoch). To ascertain how PA affects QTI dynamics stability, pseudo-ECGs were calculated from a MRI-based human ventricular model. Clinical and pseudo-ECGs were subdivided into 1-minute recordings (minECGs). QTI dynamics stability of each minECG was assessed with a novel approach. Frequency of PAs (fPA) and the number of minECGs with unstable QTI dynamics (Nus) were determined for each patient. In the VT group, fPA and Nus of the ONSET epoch were larger than in CONTROL. Positive regression relationships between fPA and Nus were identified in both groups. The simulations showed that both fPA and the PA degree of prematurity contribute to QTI dynamics instability.
Conclusions
Increased PA frequency and QTI dynamics instability precede VT onset in AMI patients, as determined by novel methodology for detecting instability in QTI dynamics from clinical ECGs.
Keywords: ventricular tachycardia, QT interval, acute myocardial infarction, premature activation, repolarization instability
Instability in the dynamics of ventricular repolarization plays an important role in the mechanisms of arrhythmia, especially when a premature activation (PA) is presented. At the cellular level, ventricular repolarization is measured by the action potential duration (APD), the latter often expressed as a function of the preceding diastolic interval (DI).1 This relationship is known as APD restitution. Over the past decade, much emphasis has been placed on the maximum slope of the restitution curve as a major factor in both the onset of arrhythmias, and the dynamic destabilization of reentrant waves that underlie arrhythmias. A large (>1) maximum APD restitution slope indicates instability in APD dynamics;1-3 it is observed in the short DI range, which is typically associated with PAs. The shorter the DI, the larger the maximum restitution slope. Research has demonstrated that unstable APD dynamics results in spatial gradients in APD,4, 5 leads to ventricular tachycardia (VT) following PA,6-8 and causes the transition from VT to ventricular fibrillation.2, 3, 5
To test the value of the restitution slope as an arrhythmia risk indicator in the clinic, several studies have measured this slope in patients using MAP catheters.9, 10 These studies reported increased APD restitution slopes in diseased human hearts, as identified by invasive constant-rate pacing protocols. The use of such pacing protocols eliminated short-term memory, which is the dependence of APD on activation history. Activation history is typically represented by several preceding APDs and DIs.11, 12 Since short-term memory can enhance or diminish instability in APD dynamics,13, 14 APD restitution slope cannot be used as an accurate measure of APD instability in the clinical setting.15
The QT interval (QTI) of an ECG is the global manifestation of ventricular APD. Based on the concept of APD restitution, larger-than-one slope of QTI restitution (dependence of QTI on the preceding TQ interval, TQI), which indicates instability in QTI dynamics, has been tested as an index of arrhythmia risk.16, 17 However, similar to APD restitution, QTI restitution slope has to be measured under invasive constant-rate pacing protocols, and similarly eliminates the effect of short-term memory on QTI dynamics. Currently, there is no robust methodology that can detect instability in QTI dynamics non-invasively from the clinical ECG and without canceling the important contribution of short-term memory. Furthermore, it remains unknown whether instability in QTI dynamics, if detected, precedes the onset of arrhythmia. Finally, the contributions of PA to instability in QTI dynamics and the onset of arrhythmias are also unknown.
In this study, we propose a novel methodology for detecting instability in QTI dynamics. The algorithm defines QTI dynamics as a function of both its preceding RR interval (RRI) and activation history, and assesses the stability of this function. Because the effect of short-term memory is included in the algorithm, the presented approach has an advantage over restitution slope in measuring repolarization instability. The methodology uses the clinical ECG and does not require a specific pacing protocol; it is thus noninvasive. In this study we test the hypothesis that instability in QTI dynamics, as detected by this methodology, precedes the onset of sustained VT, but not that of non-sustained VT (NSVT). Furthermore, we test the additional hypothesis that instability in QTI dynamics depends on both the PA degree of prematurity (DOP) and the frequency of PAs (fPA). The results of this study reveal the important contributions of PA and QTI instability to VT onset. Confirming these hypotheses would indicate that the present methodology for detecting instability in QTI dynamics could be used to develop a novel index that predicts the risk of arrhythmias.
We tested the first hypothesis using clinical ECG recordings collected from acute myocardial infarction (AMI) patients. However, an ECG recording could have different fPA, and each PA could be of different DOP, which makes directly testing the second hypothesis difficult. Instead, we used pseudo-ECG recordings generated by a novel biophysically-detailed MRI-based electrophysiological model of the human ventricles, so that fPA and the DOP of PAs could be controlled.
Methods
The details of the clinical data collection, the computer simulations with the MRI-based human ventricular model, and the algorithm for detecting instability in QTI dynamics are presented in the following sections.
ECG data
The ECG recordings used in this study are part of a clinical ECG database at the Johns Hopkins Hospital.18 We used 24 AMI patients from this database; 12 patients had sustained and 12 non-sustained monomorphic VT events (VT and NSVT groups, respectively). The clinical demographics of both groups, such as age, gender, diagnosis, beta-blocker usage, and antiarrhythmic drug therapy are presented in Table 1.
Table 1.
Clinical demographic of the studied population.
| VT | NSVT | p | |
|---|---|---|---|
| Age | 66.8±12.9 | 62.8±13.3 | 0.46 |
| Gender(male) % | 58.3 | 66.7 | 0.5 |
| Diagnosis | |||
| Heart Failure % | 25 | 8.3 | 0.3 |
| Arrhythmia % | 58.3 | 41.7 | 0.34 |
| Comorbidities | |||
| Diabetes Mellitus % | 25 | 25 | 0.68 |
| Hypertension % | 58.3 | 41.7 | 0.34 |
| Beta blocker % | 33.3 | 75 | 0.05 |
| Antiarrhythmic drug % | 66.7 | 75 | 0.5 |
| CL(ms) | 715±104 | 771±166 | <0.01 |
| PA CL(ms) | 521±101 | 561±119 | 0.02 |
| Number of PVC per minECG | (0.79, 1.02) | (0.78, 1.02) | 0.6 |
| Number of PAC per minECG | (0.36, 0) | (1.53, 0) | 0.02 |
From the multi-lead recordings of each patient, the recording with the best signal-to-noise ratio was chosen for analysis. VT events were identified from these ECG recordings by the cardiologist. Two ten-minute-long ECG recordings, extracted immediately before a chosen VT onset and at least 1 hour before that onset, were assembled into an ONSET epoch and a CONTROL epoch, respectively, with one recording per patient in each epoch. Each CONTROL ECG had to be at least 1 hour after any prior cardiac events. Each 10-minute ECG trace was then divided into ten 1-minute ECG recordings (minECGs).
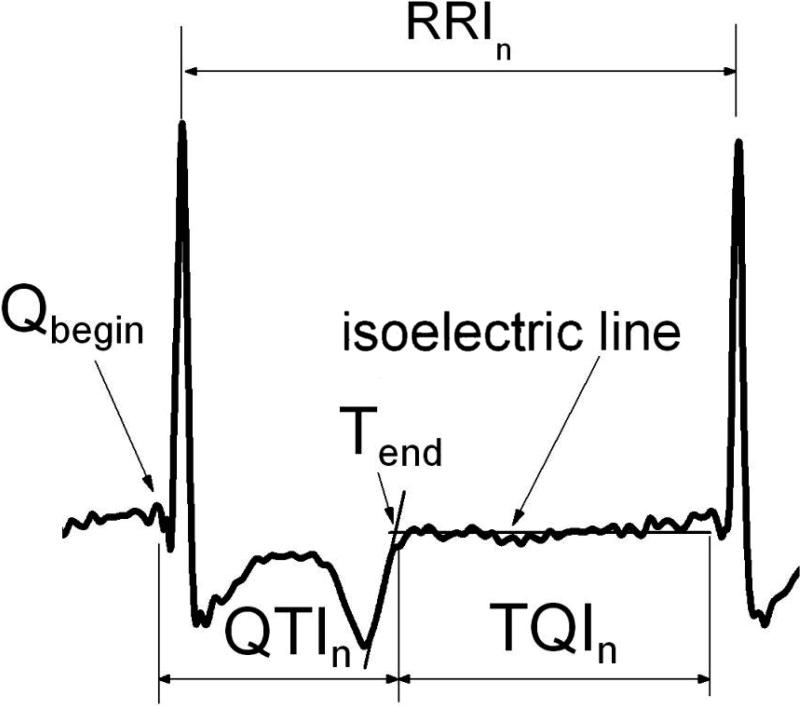
For each minECG, Q, R, and T waves were annotated and QTIs, TQIs, and RRIs were extracted (Fig.1). The QRS complex was first identified, followed by the T-wave and the isoelectric line, using the approach of Laguna et al.19 The end of the T-wave was found as the intersection of the isoelectric line with the tangent to the T-wave at the point of maximum slope. Annotations were visually checked to ensure accuracy. The number of PAs in each minECG was counted. In this study, PA could be a premature atrial contraction (PAC) or a premature ventricular contraction (PVC). Following the approach of Huikuri et al.,20 a PA was counted each time when RRI of a beat was shortened by at least 100ms with respect to that of the preceding beat.
Figure 1.
Clinical ECG annotation and intervals. See text for detail.
Computer simulations with the MRI-based biophysically-detailed model of human ventricular electrophysiology
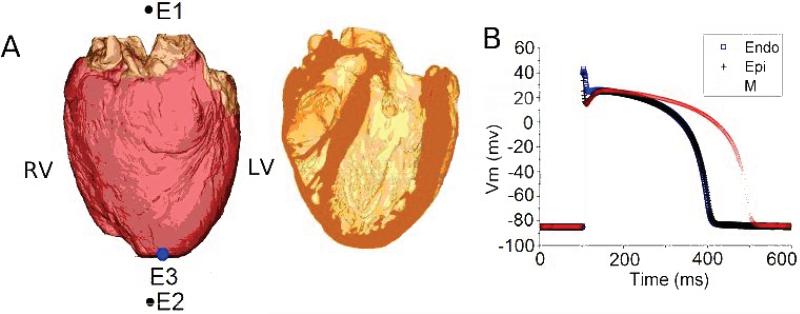
We used a novel anatomically-realistic model of electrophysiology in the human ventricles (Fig.2A), reconstructed in our lab from MRI and diffusion-tensor (DT) MRI data.21, 22 The model was employed to examine how fPA and the DOP of a PA affected stability of QTI dynamics. In this study, the DOP of a beat was defined as the shortening of the cycle length (CL) with respect to the one of the preceding beat.
Figure 2.
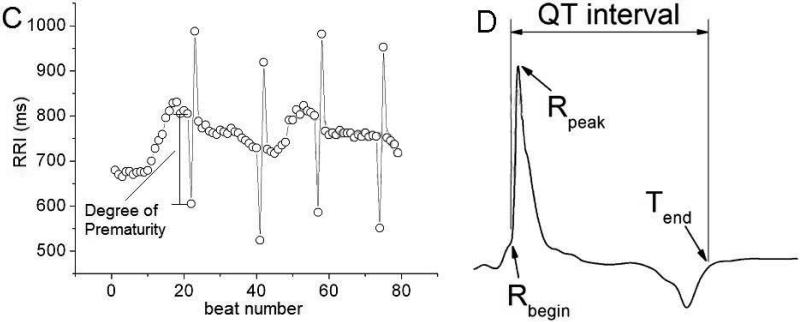
A. Epicardial (left) and transmural (right) views of the biophysically-detailed MRI-based human ventricular model (at left, ventricles are in pink and atria in brown). Atria were insulated from the ventricles during the simulation. ECG electrodes are E1 and E2; pacing electrode is E3. B. Action potentials of human endo-, M, and epicardial cells. C. RRI sequence with PAs used as a pacing train in the electrophysiological simulations (see text for detail). D. ECG annotation and QT interval in one beat from a pseudo-ECG.
Description of our pipeline for heart model construction was published previously.22, 23 Mathematical description of the electrophysiological behavior of cardiac tissue was based on the monodomain representation, ensuring speed of execution of the simulations. The membrane dynamics of the human ventricular cell was represented by the ten Tusscher et al ionic model.24 In order to obtain an ECG consistent with the clinical signal, we included transmural heterogeneities in cellular properties24 in the model ventricles. The spatial distribution of endo-, epicardial, and M-cells across the ventricular walls (Fig.2B) was implemented as in a previous study,25 based on data by Drouin et al.26
A one-minute long pacing train was delivered epicardially at the apex of the MRI-based human ventricular model (Fig.2A). The pacing intervals in this train were the same as the RRIs of one of the PA-free minECGs in the VT group ONSET epoch. To construct pacing trains with different fPA and DOP, the timings of 4, 8, or 12 randomly selected beats of this PA-free pacing train were shortened to simulate PAs. All PAs in a pacing train had the same DOP, either 150ms or 200ms (Fig.2C). The number of beats between the PAs in the pacing train was chosen such that it represented the most frequent pattern of distribution of PAs and sinus beats among the minECGs in the ONSET epoch of the VT group.
Following each one-minute pacing protocol, the MRI-based human ventricular model was used to generate one-minute long pseudo-ECGs (pseudo-minECGs), as done previously.25 We refer to the simulated ECGs as pseudo-ECGs since the model ventricles were not surrounded by torso25 (Fig.2A), as well as to distinguish them from the clinical minECGs. The model ECG leads were configured to simulate Lead II of the standard 12-lead ECG (Fig.2A). The pseudo-minECGs were annotated in the same way as the minECGs, except that QTI was defined as the interval between Rbegin and Tend (Fig. 2D), because pseudo-ECGs do not have a Q-wave.25
Detection of instability in QTI dynamics
For each minECG and pseudo-minECG, the dependence of a QTI on the preceding QTIs and RRIs was expressed as Eq.1 below, which constitutes a linear autoregressive model with exogenous input (ARX). This model has been used previously to describe APD dynamics.12
| Equation 1 |
In Eq.1, n is the beat number in the minECG or pseudo-minECG; ai and bi (i=1,..,M) are the weights (constants) with which each preceding QTI and RRI, respectively, contribute to QTIn. M is the number of beats representing the extent of the activation history. The autoregressive term is (dependence of a given QTI on preceding QTIs), while the term represents the exogenous input. In Eq.1 we chose to use RRIs and not TQIs (as done in restitution studies16, 17), because TQI is affected by the preceding QTI, and thus it is not an independent exogenous input.
The parameters ai and bi (i=1,..,M) of each ARX model were evaluated with a Matlab function. For each ARX model, the value of M was determined by increasing it from 1, in steps of 1, and examining, at each step, whether an accurate prediction of QTI dynamics in the minECG was achieved. The value of M at which the prediction reached a desired accuracy was denoted as Mmax. The chosen accuracy was that the mean square error between the predicted and the measured QTI was smaller than 5 ms2. We also used residual analysis (95% confidence interval) to validate the ARX modeling at each M value.
We used a well-established method27 to assess the stability of each ARX (i.e. the stability of Eq.1) and expressed it as a stability index, Pm. The definition and calculation of Pm can be found in the Online Supplement. Based on the value of Pm, the ARX model was found stable (if Pm <1) or unstable (if Pm >=1).27 When the ARX model was unstable, the degree of instability was manifested in the value of Pm; the larger the value of Pm, the larger the degree of instability in QTI dynamics.
To compare the performance of our methodology in predicting VT onset with that of other measures of QTI dynamics, we also calculated the QTI restitution slope for each minECG and the QT variability index (QTVI)28 over the entire ECG recording (10 min) for each patient.
Data Analysis
In this paper normally distributed data is presented as mean ± standard deviation and non-normally distributed data is presented as median and interquartile range. For comparisons between two sets of data, we used t-test for normal continuous data, Wilcoxon rank-sum test for non-normal continuous data, and Fisher exact test for categorical data. The significance level of all these tests was 0.05. For comparisons between more than 2 sets of data, we used one-way ANOVA for normal data and Kruskal-Wallis test for non-normally distributed data. The significance level was 0.05. If significant difference was identified in the preliminary test, post-hoc multiple comparisons test (Tukey's test) was used to perform pair-wise comparisons between the datasets.
Using the above algorithm, each minECG (or pseudo-minECG) was tagged as either stable or unstable based on its Pm value. To test the 1st hypothesis, the number of unstable minECGs (Nus) was counted for each ECG recording and was compared between the 4 epochs, i.e. the ONSET and CONTROL epochs of the VT and NSVT groups. Other variables, such as fPA, Mmax, and QTVI, were compared in the same way. The fPA in each ECG recording was obtained as the number of PAs divided by the duration of the recording (10 min). The relationship between Nus and fPA within each epoch was determined with linear regression. We also examined whether QTI instability evolved before VT onset. For each minute within the ONSET epochs of the VT and NSVT groups, the mean value of Pm was calculated and analyzed with linear regression and Generalized estimating equation (GEE) model to examine the evolution of Nus in time before VT onset.
The 2nd hypothesis was tested by comparing the stability of pseudo-minECGs with different fPA and different DOPs.
Results
ARX modeling
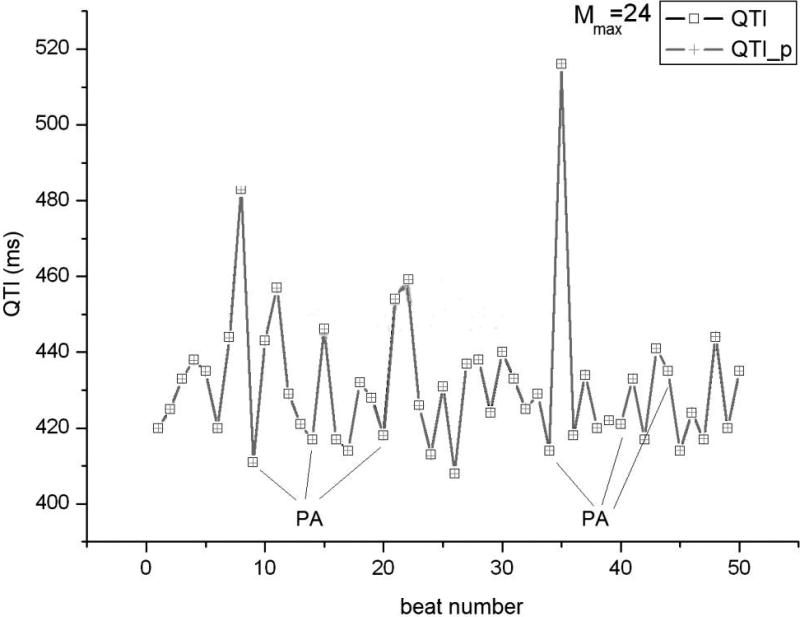
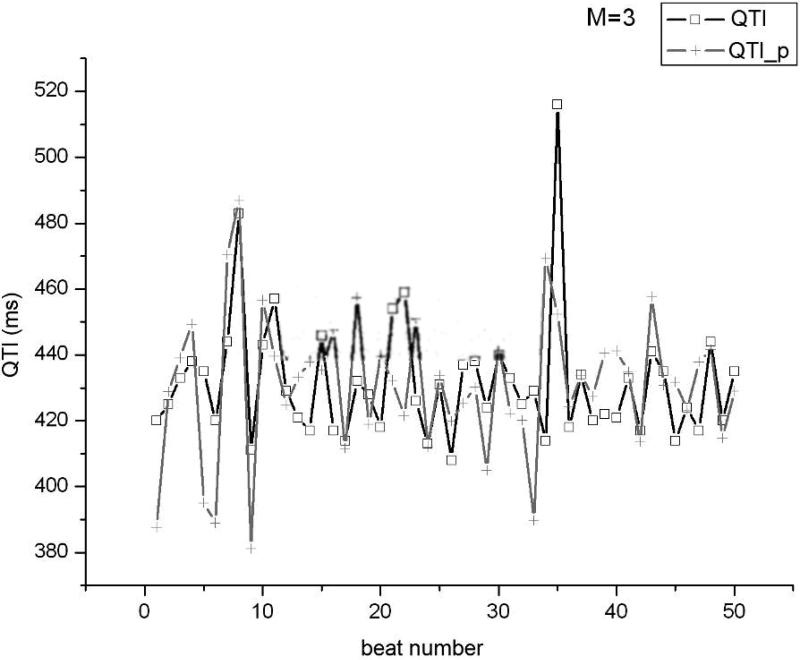
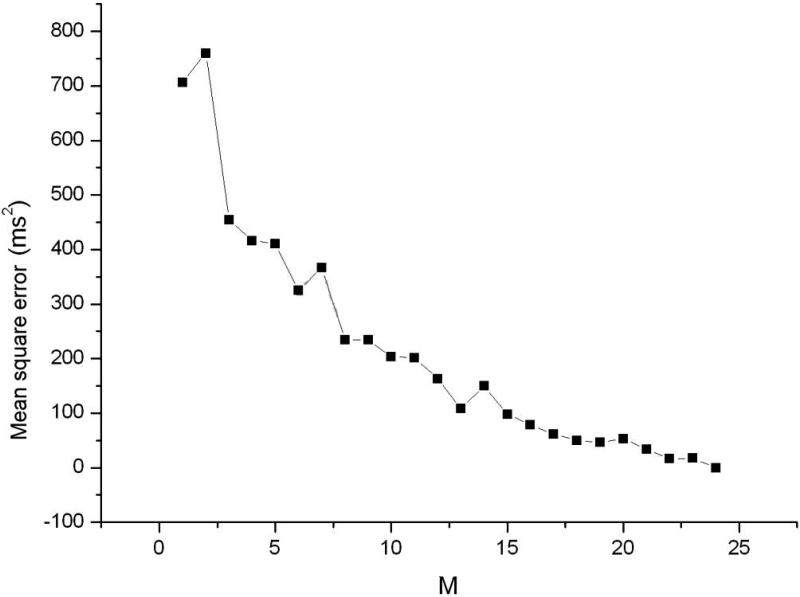
Using the clinical recordings from the AMI patients, an ARX model (Eq.1) was constructed for each minECG. The value of each QTI in the minECG was predicted with the ARX model and the accuracy of the prediction assessed. As illustrated in Fig.3A, an accurate prediction of QTI dynamics of an example minECG was achieved for Mmax=24. Fig.3B shows the discrepancy between the predicted and the measured QTI dynamics when M=3. The dependence of the mean square error in the prediction on the value of M is presented in Fig.3C, demonstrating that as M increases towards Mmax, the accuracy of the prediction increases.
Figure 3.
QTI dynamics predicted by the ARX model (QTI_p) compared with the QTI dynamics extracted from a minECG of the ONSET epoch from the VT group for A. Mmax=24 and B. M=3. C. Dependence of the mean square error in the prediction of QTI dynamics on the value of M (length of activation history).
The value of Mmax was determined from each minECG and is presented in Table 2. One-way ANOVA identified significant differences (p<0.01) in Mmax between the 4 epochs. Post-hoc multiple comparisons test further revealed that, within both VT and NSVT groups, Mmax was significantly larger during the ONSET epoch as compared to the CONTROL epoch. These findings indicate that in both groups, before VT onset, QTI dynamics has a longer short-term memory than in CONTROL.
Table 2.
Values of Mmax, Mmin, Nus, fPA, QTVI, and CL for the 4 epochs.
| VT | NSVT | |||
|---|---|---|---|---|
| ONSET | CONTROL | ONSET | CONTROL | |
| Mmax | 37.4±7.3 | 31.5±7.6 | 38±11.2 | 33.1±9.2 |
| Mmin | 8.1±6.5 | 10.7±5.6 | 5.9±3.5 | 7.1±5.4 |
| Nus | (3, 6) | (0.5, 2.5) | (1.5, 4.5) | (2, 3) |
| fPA(beat/minute) | (1.93, 3.25) | (0.38, 0.43) | (1.45, 2.54) | (0.7, 1.65) |
| QTVI | (0.03, 0.64) | (-0.1, 0.73) | (-0.09, 0.6) | (-0.29, 0.58) |
| CL(ms) | 671±122 | 737±95 | 717±148 | 774±150 |
Analysis of the stability of QTI dynamics
Next, the stability in QTI dynamics of each minECG (i.e. each ARX) was assessed. We found that instability in QTI dynamics, when present in a minECG, can be observed at different M values, the minimum of which was denoted as Mmin. For the minECG used in Fig.3, Mmin was 3. Although at that value of M the prediction of QTI dynamics was not accurate (Fig.3B), an incomplete activation history (i.e. M<Mmax) was nonetheless sufficient to detect instability present in the QTI dynamics of this minECG. The values of Mmin of the 4 epochs are presented in Table 2, and were compared using one-way ANOVA. The results did not show any significant difference (p=0.07).
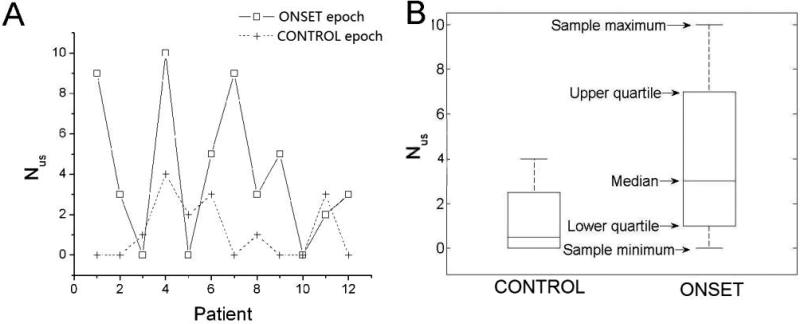
The number of unstable minECGs in each ECG recording, Nus, was counted for all 4 epochs. The medians and interquartile ranges of Nus are presented in Table 2. The data points and box plots of Nus of the VT group are presented in Fig.4A and 4B. The Kruskal-Wallis test showed that the 4 epochs are significantly different from each other (p=0.03) in the value of Nus. Multiple comparisons test (Table 3) further identified, within the VT group, a significantly larger value of Nus in the ONSET epoch compared to the CONTROL epoch. This difference was not observed in the NSVT group. This finding indicates that an increase in Nus took place only before the onset of sustained VT, but not NSVT.
Figure 4.
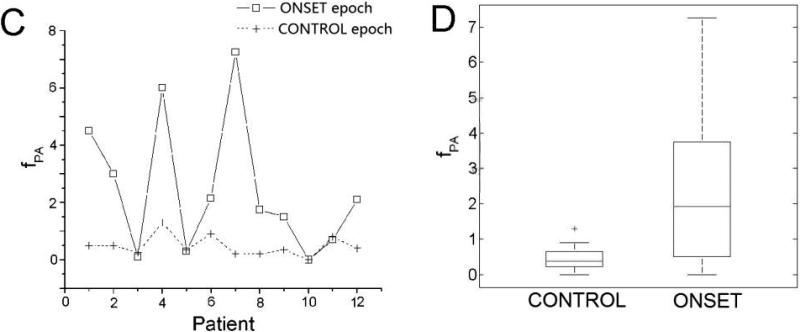
A. Nus and B. its medians and interquartile ranges for the ONSET and CONTROL epochs of the VT group. The difference in Nus between the ONSET and CONTROL epochs is significant. C. fPA and D. its medians and interquartile ranges for the ONSET and CONTROL epochs of the VT group. The difference in fPA between the ONSET and CONTROL epochs is significant.
Table 3.
Multiple comparisons results of Nus between the 4 sets of data: 1) the ONSET epoch of the VT group, 2) the CONTROL epoch of the VT group, 3) the ONSET epoch of the NSVT group, and 4) the CONTROL epoch of the NSVT group. The difference is considered as insignificant if the 95% confidence interval contains 0.
| Comparisons | 95% Lower Limit | Difference in Mean | 95% Upper Limit | Significant at 0.05 level |
|---|---|---|---|---|
| 1 vs. 2 | 1.0 | 11.8 | 22.6 | Yes |
| 1 vs. 3 | -7.3 | 3.5 | 14.4 | No |
| 1 vs. 4 | 3.4 | 14.2 | 25.0 | Yes |
| 2 vs 3 | -19.1 | -8.3 | 2.6 | No |
| 2 vs 4 | -8.5 | 2.4 | 13.2 | No |
| 3 vs 4 | -0.19 | 10.6 | 21.4 | No |
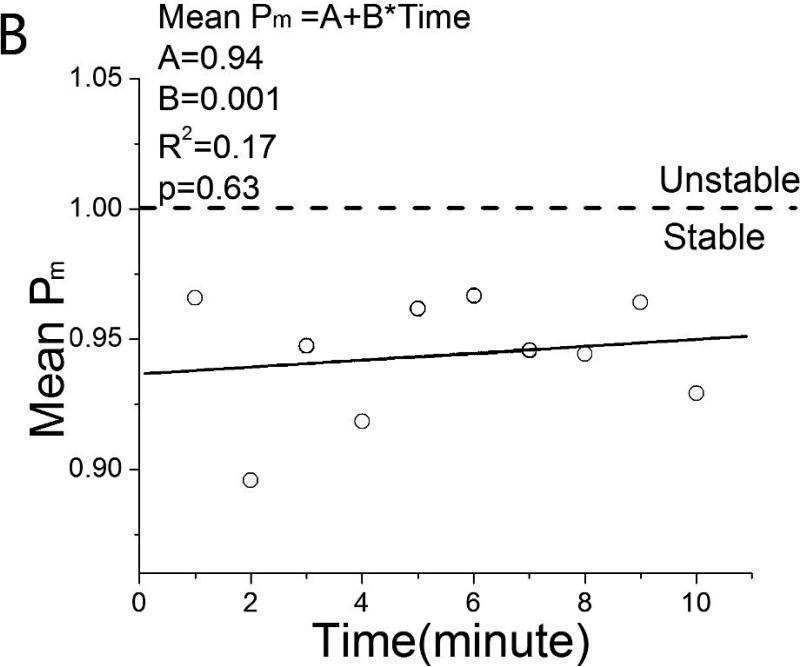
Fig. 5 presents plots of the mean value of Pm at each minute of the ONSET epochs of the VT and NSVT groups. Linear regression analysis of these data did not identify any trend in QTI instability; R2 was 0.38 (VT) and 0.17 (NSVT). The GEE model of Pm also showed that Pm is not dependent on time (p=0.39) or group (p=0.27). These findings indicate that QTI instability did not evolve within the 10 min prior to VT onset.
Figure 5.
Mean QTI instability index Pm as a function of time in the 10 min prior to onset of A. VT and B. NSVT.
fPA and its relation to QTI instability and VT onset
The medians and interquartile ranges of fPA of the 4 epochs are presented in Table 2. The data points and box plots of fPA of the VT group are presented in Fig.4C and 4D. One-way ANOVA identified significant differences (p<0.01) in the values of fPA between the 4 epochs. Post-hoc multiple comparisons showed that, within the VT group, fPA of the ONSET epoch was significantly larger than that of the CONTROL (Table 4). This difference was not observed in the NSVT group (Table 4). These findings indicate that fPA increased before VT onset in the VT group. Among all minECGs that presented PAs, 78% had PVCs and 35% had PACs. However, in 37.5% of the minECGs that had PACs, PVCs were also present. Similarly, in 16.8% of the minECGs that had PVCs, PACs were also present. Thus, the contributions of PACs and PVCs to QTI instability could not be evaluated separately.
Table 4.
Multiple comparisons results of fPA values between the 4 sets of data. See legend of Table 3 for details.
| Comparisons | Lower | Difference in Mean | Upper | Significant at 0.05 level |
|---|---|---|---|---|
| 1 vs. 2 | 9.4 | 20.5 | 31.7 | Yes |
| 1 vs. 3 | -9.6 | 1.5 | 12.7 | No |
| 1 vs. 4 | -1.1 | 10.1 | 21.3 | No |
| 2 vs 3 | -30.2 | -19 | -7.8 | Yes |
| 2 vs 4 | -21.6 | -10.5 | 0.7 | No |
| 3 vs 4 | -2.6 | 8.5 | 19.7 | No |
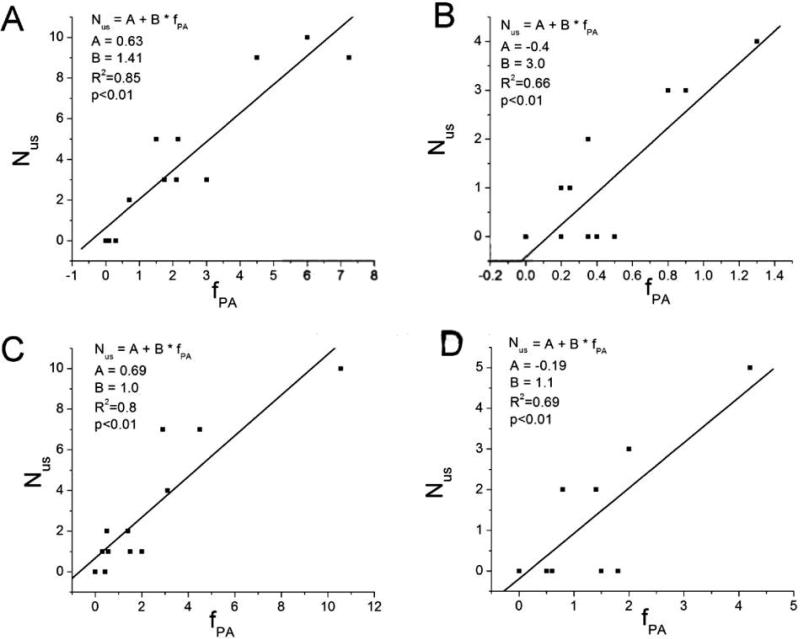
Finally, we found that QTI dynamics in all PA-free minECGs was stable. In all 4 epochs, a positive regression relationship was identified between Nus and fPA (Fig.6), suggesting a cause-and-effect relationship between the two variables.
Figure 6.
The positive regression relationship between Nus and fPA of A. the ONSET epoch of the VT group, B. the CONTROL epoch of the VT group, C. the ONSET epoch of the NSVT group, and D. the CONTROL epoch of the NSVT group.
QTI restitution, QTVI, and CL
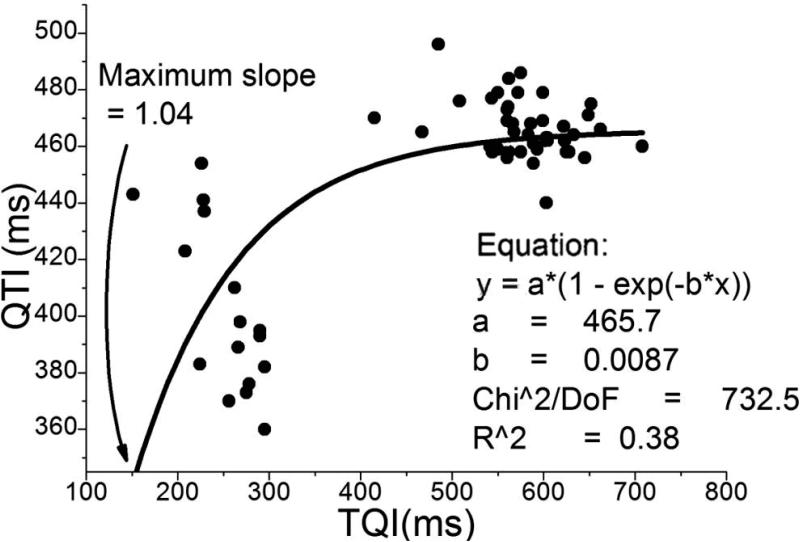
For most of the minECGs QTI restitution curves could not be constructed due to the large scatter in QTI(TQI) data. An example QTI restitution curve was constructed from a minECG from the ONSET epoch of the VT group (Fig.7). PAs were present in this minECG, and our methodology assessed its QTI dynamics as unstable. Fig.7 presents a mono-exponential function fitted through the data. Although the maximum slope of the fitted restitution curve was >1 (1.04), the small R2 value (0.38) indicates that the quality of curve fit was very low.
Figure 7.
QTI restitution constructed from a minECG before VT onset.
QTVI and CL values (presented in Table 2) were compared among the 4 epochs with one-way ANOVA. The results showed significant differences in the value of CL (p<0.01) but not in QTVI (p=0.22). Post-hoc multiple comparisons demonstrated that CL of the ONSET epoch was significantly larger than that of the CONTROL in the VT group, but not in the NSVT group.
QTI instability in pseudo-minECGs
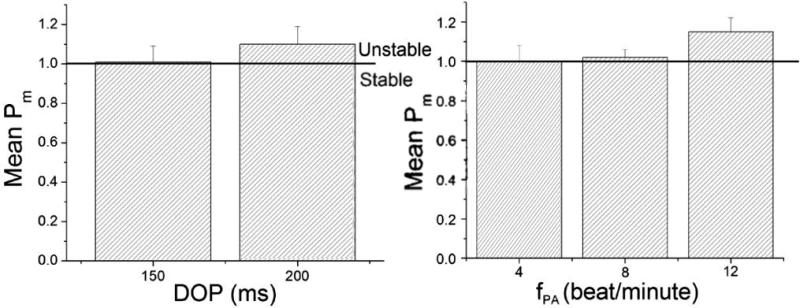
The simulation results (Fig.8) demonstrate that, at a given DOP, increasing fPA increased QTI instability. For a given fPA, increasing DOP also increased QTI instability, indicating that QTI stability depends on both DOP and fPA.
Figure 8.
The simulation results revealed the dependence of Pm on A. DOP and B. fPA.
Discussion
This study presents a novel methodology for detecting instability in QTI dynamics from the clinical ECG recording. The methodology does not require a specific pacing protocol; it is thus noninvasive and does not exclude the contribution of short-term memory to QTI dynamics. Using this methodology, we demonstrated that QTI dynamics becomes unstable before the onset of sustained VT, and found that this instability is related to the DOP and frequency of PAs. The results also show that fPA increased before the onset of VT but not NSVT. It was also found that in all 4 epochs Nus was positively correlated with fPa, which suggests that QTI instability is unmasked by PAs. These findings shed light on the mechanisms of arrhythmogenesis, and indicate a possibility for the development of an index that predicts arrhythmia risk from the clinical ECG.
The contribution of PAs and instability in QTI dynamics to VT onset
Theoretical studies have shown that instability in APD (resulting from steep restitution), manifested following PA occurrence (which brings the operational point of the system to the portion of the restitution curve with slope >1), leads to heterogeneous distribution of DIs in the heart, and consequentially, to the induction of conduction block, reentry, and VT.6-8 However, demonstrating in the clinical setting that repolarization instability precedes VT onset has proven difficult. Heart rhythm before arrhythmia onset is typically variable, rendering not applicable all restitution-based methodologies for assessing repolarization instability. Applying our novel methodology for assessing repolarization instability, which does not eliminate short-term memory, we were able to demonstrate, from clinical ECG recordings of AMI patients, that unstable QTI dynamics precedes VT onset.
Advantage of the present methodology over other approaches
With the inclusion of multiple beats comprising activation history in the ARX model, the present algorithm allows for the detection of instability in QTI dynamics directly from the clinical ECG, without the need for invasive pacing. Accounting for short-term memory provides a great advantage of the present methodology over the traditional restitution approach.
Another QTI-based index, QTVI, has been a valuable tool in arrhythmia risk stratification. QTVI characterizes, in a statistical manner, the relationship between QTI and RRI dynamics over the entire ECG recording, and provides an overall estimation of QTI variability normalized by the magnitude of RRI variability.28 Elevated QTVI, which has been reported in diseased hearts, indicates repolarization dynamics that is out of proportion to RRI dynamics.28, 29 Our approach evaluates the contribution to QTI dynamics not only of RRIs but also of prior QTIs; it is well understood that the latter contributes to arrhythmia initiation.13, 14 In addition, PAs (i.e. ectopic beats, which could be either PACs or PVCs) were included in the present study since they could uncover arrhythmogenic unstable repolarization dynamics in the heart; the present methodology captures this instability. These differences between QTVI and the present approach help to explain why our approach successfully predicted the onset of VT while QTVI did not.18
Using the present methodology, we were able to advance the knowledge of the relationship between ectopic beats and arrhythmia mechanisms. Research using heart rate turbulence (HRT) analysis has demonstrated that a single ectopic beat modulates heart rate dynamics through autonomic inputs, with the dynamics of RRI following the ectopic beat being depressed in the diseased heart.30 However, HRT algorithms have not been able to unravel the contribution of ectopic beats and the subsequent altered heart rate dynamics to the onset of arrhythmia. The results of our study revealed that the RRI dynamics following PA underlies the unstable QTI dynamics preceding VT onset.
Clinical significance
In this study, we propose a novel methodology for detecting instability in QTI dynamics, which uses the clinical ECG and does not require a specific pacing protocol. The methodology could be applied in both clinical monitoring of events preceding arrhythmias and arrhythmia risk stratification. While frequent PVCs and short coupling intervals are known risk factors for VT in the AMI patients,31 this study provides another measure of arrhythmia risk in this particular clinical setting, namely unstable QT dynamics. Because all patients, the ECG recordings of whom were used in this study, had AMI and VT (either sustained or non-sustained), the positive regression relationship between fPA and NUS reported here may not apply to the healthy heart. If this is proven to be the case, a positive regression relationship between fPA and NUS in the ECG would indicate arrhythmia risk, and could be used as a risk stratification index. Prospective studies need to be carried out to test this hypothesis.
Limitations
Both PVCs and PACs were included as PAs in this study. The QRS width of PVC is typically different from that of a sinus beat; sinus beats and PVCs could also be associated with different T-wave morphologies. This could affect QTI annotation. Therefore, analysis of QTI dynamics in ECG recordings with large number of PVCs might be less accurate than that of recordings without PVCs. An additional limitation in this study is that short-term memory was represented by a series of preceding QTIs and RRIs. This representation ignores the fact that the same QTI may be associated with different T-wave shapes.
A limitation of the simulations with the MRI-based electrophysiological model of the human ventricles is that epiventricular pacing, rather than sinus rhythm, was used. Inclusion of the Purkinje system would have complicated dramatically the model, and thus was not implemented in this study.
Finally, certain clinical demographics, such as LVEF, duration of AMI, the use of thrombolytics, and baseline ECG features could not be accessed from patient records and thus could not be reported here because the Johns Hopkins database was constructed under an IRB protocol which prohibited retention of any patient-specific identifier.
Supplementary Material
Acknowledgments
Funding Sources: This study is supported by NIH grant R01HL082729 and a research grant from Medtronic to Dr. Trayanova
Glossary of abbreviations
- APD
action potential duration
- AMI
acute myocardial infarction
- ARX
autoregressive model with exogenous input
- CL
cycle length
- DI
diastolic interval
- DOP
degree of prematurity
- ECG
electrocardiogram
- NSVT
non-sustained VT
- PA
premature activation
- PAC
premature atrial contraction
- PVC
premature ventricular contraction
- QTI
QT interval
- QTVI
QT variability index
- RRI
RR interval
- TQI
TQ interval
- VT
ventricular tachycardia
Footnotes
Publisher's Disclaimer: Advance online articles have been peer reviewed and accepted for publication but have not yet appeared in the paper journal (edited, typeset versions may be posted when available prior to final publication). Advance online articles are citable and establish publication priority; they are indexed by PubMed from initial publication. Citations to Advance online articles must include the digital object identifier (DOIs) and date of initial publication.
Journal Subject Codes: [4] Acute myocardial infarction; [171] Electrocardiology; [132] Arrythmias-basic studies
Conflict of Interest Disclosures: Dr. Trayanova is a co-founder of CardioSolv LLC. CardioSolv LLC was not involved in this research.
References
- 1.Nolasco JB, Dahlen RW. A graphic method for the study of alternation in cardiac action potentials. J Appl Physiol. 1968;25:191–196. doi: 10.1152/jappl.1968.25.2.191. [DOI] [PubMed] [Google Scholar]
- 2.Koller ML, Riccio ML, Gilmour RF. Dynamic restitution of action potential duration during electrical alternans and ventricular fibrillation. Am J Physiol. 1998;275:H1635–H1642. doi: 10.1152/ajpheart.1998.275.5.H1635. [DOI] [PubMed] [Google Scholar]
- 3.Garfinkel A, Kim Y, Voroshilovsky O, Qu Z, Kil J, Lee M, Karagueuzian H, Weiss J, Chen P. Preventing ventricular fibrillation by flattening cardiac restitution. Proc Natl Acad Sci U S A. 2000;97:6061–6066. doi: 10.1073/pnas.090492697. [DOI] [PMC free article] [PubMed] [Google Scholar]
- 4.Chen X, Fenton FH, Gray RA. Head-tail interactions in numerical simulations of reentry in a ring of cardiac tissue. Heart Rhythm. 2005;2:1038–1046. doi: 10.1016/j.hrthm.2005.08.015. [DOI] [PubMed] [Google Scholar]
- 5.Qu Z, Garfinkel A, Chen PS, Weiss JN. Mechanisms of discordant alternans and induction of reentry in simulated cardiac tissue. Circulation. 2000;102:1664–1670. doi: 10.1161/01.cir.102.14.1664. [DOI] [PubMed] [Google Scholar]
- 6.Gilmour RF, Gelzer AR, Otani NF. Cardiac electrical dynamics: maximizing dynamical heterogeneity. J Electrocardiol. 2007;40:S51–S55. doi: 10.1016/j.jelectrocard.2007.06.025. [DOI] [PMC free article] [PubMed] [Google Scholar]
- 7.Fox JJ, Riccio ML, Drury P, Werthman A, Gilmour RF. Dynamic mechanism for conduction block in heart tissue. New Journal of Physics. 2003;5:101.101–101.114. [Google Scholar]
- 8.Otani NF. Theory of action potential wave block at-a-distance in the heart. Phys Rev E. 2007;75:021910(17). doi: 10.1103/PhysRevE.75.021910. [DOI] [PubMed] [Google Scholar]
- 9.Pak Hn, Hong SJ, Hwang GS, Lee HS, Park S-W, Ahn JH, Ro YM, Kim Y-H. Spatial dispersion of action potential duration restitution kinetics is associated with induction of ventricular tachycardia/fibrillation in humans. J Cardiovasc Electrophysiol. 2004;15:1357–1363. doi: 10.1046/j.1540-8167.2004.03569.x. [DOI] [PubMed] [Google Scholar]
- 10.Koller ML, Maier SKG, Gelzer AR, Bauer WR, Meesmann M, Robert F, Gilmour J. Altered dynamics of action potential restitution and alternans in humans with structural heart disease. Circulation. 2005;112:1542–1548. doi: 10.1161/CIRCULATIONAHA.104.502831. [DOI] [PubMed] [Google Scholar]
- 11.Shiferaw Y, Qu Z, Garfinkel A, Karma A, Weiss JN. Nonlinear dynamics of paced cardiac cells. Ann N Y Acad Sci. 2006;1080:376–394. doi: 10.1196/annals.1380.028.x. [DOI] [PubMed] [Google Scholar]
- 12.Huang J, Zhou X, Smith WM, Ideker RE. Restitution properties during ventricular fibrillation in the in situ swine heart. Circulation. 2004;110:3161–3167. doi: 10.1161/01.CIR.0000147618.93579.56. [DOI] [PubMed] [Google Scholar]
- 13.Gilmour RF, Otani NF, Watanabe MA. Memory and complex dynamics in cardiac Purkinje fibers. Am J Physiol. 1997;272:H1826–1832. doi: 10.1152/ajpheart.1997.272.4.H1826. [DOI] [PubMed] [Google Scholar]
- 14.Otani NF, Gilmour RF. Memory models for the electrical properties of local cardiac systems. J Theor Biol. 1997;187:409–436. doi: 10.1006/jtbi.1997.0447. [DOI] [PubMed] [Google Scholar]
- 15.Narayan SM, Franz MR, Lalani G, Kim J, Sastry A. T-Wave alternans, restitution of human action potential duration, and outcome. J Am Coll Cardiol. 2007;50:2385–2392. doi: 10.1016/j.jacc.2007.10.011. [DOI] [PubMed] [Google Scholar]
- 16.Gilmour RF, Riccio ML, Locati EH, Maison-Blanche P, Coumel P, Schwartz PJ. Time- and rate-dependent alterations of the QT interval precede the onset of torsade de pointes in patients with acquired QT prolongation. J Am Coll Cardiol. 1997;30:209–217. doi: 10.1016/s0735-1097(97)00105-8. [DOI] [PubMed] [Google Scholar]
- 17.Fossa AA, Wisialowski T, Crimin K, Wolfgang E, Couderc J-P, Hinterseer M, Kaab S, Zareba W, Badilini F, Sarapa N. Analyses of dynamic beat-to-beat QT-TQ interval (ECG Restitution) changes in humans under normal sinus rhythm and prior to an event of torsades de pointes during QT prolongation caused by sotalol. Ann Noninvasive Electrocardiol. 2007;12:338–348. doi: 10.1111/j.1542-474X.2007.00183.x. [DOI] [PMC free article] [PubMed] [Google Scholar]
- 18.Sachdev M, Fetics BJ, Lai S, Dalal D, Insel J, Berger RD. Failure in short-term prediction of ventricular tachycardia and ventricular fibrillation from continuous ECG in intensive care unit patients. J Electrocardiol. 2010;43:400–407. doi: 10.1016/j.jelectrocard.2010.02.005. [DOI] [PMC free article] [PubMed] [Google Scholar]
- 19.Laguna P, Jané R, Caminal P. Automatic detection of wave boundaries in multilead ECG signals: validation with the CSE database. Comput Biomed Res. 1994;27:45–60. doi: 10.1006/cbmr.1994.1006. [DOI] [PubMed] [Google Scholar]
- 20.Huikuri HV, Valkama JO, Airaksinen KE, Seppanen T, Kessler KM, Takkunen JT, Myerburg RJ. Frequency domain measures of heart rate variability before the onset of nonsustained and sustained ventricular tachycardia in patients with coronary artery disease. Circulation. 1993;87:1220–1228. doi: 10.1161/01.cir.87.4.1220. [DOI] [PubMed] [Google Scholar]
- 21.Vadakkumpadan F, Arevalo H, Prassl A, Chen J, Kickinger F, Kohl P, Plank G, Trayanova N. Image-based models of cardiac structure in health and disease. Wiley Interdiscip Rev Syst Biol Med. 2010;2:489–506. doi: 10.1002/wsbm.76. [DOI] [PMC free article] [PubMed] [Google Scholar]
- 22.Vadakkumpadan F, Rantner L, Tice B, Boyle P, Prassl A, Vigmond E, Plank G, Trayanova N. Image-based models of cardiac structure with applications in arrhythmia and defibrillation studies. J Electrocardiol. 2009;42:157.e1–e10. doi: 10.1016/j.jelectrocard.2008.12.003. [DOI] [PMC free article] [PubMed] [Google Scholar]
- 23.Prassl A, Kickinger F, Ahammer H, Grau V, Schneider J, Hofer E, Vigmond E, Trayanova N, Plank G. Automatically generated, anatomically accurate cardiac electrophysiology problems. IEEE-Trans Biomed Eng. 2009;56:1318–1330. doi: 10.1109/TBME.2009.2014243. [DOI] [PMC free article] [PubMed] [Google Scholar]
- 24.ten Tusscher KH, Noble D, Noble PJ, Panfilov AV. A model for human ventricular tissue. Am J Physiol Heart Circ Physiol. 2004;286:H1573–H1589. doi: 10.1152/ajpheart.00794.2003. [DOI] [PubMed] [Google Scholar]
- 25.Maharaj T, Blake R, Trayanova N, Gavaghan D, Rodriguez B. The role of transmural ventricular heterogeneities in cardiac vulnerability to electric shocks. Prog Biophys Mol Biol. 2008;96:321–338. doi: 10.1016/j.pbiomolbio.2007.07.017. [DOI] [PMC free article] [PubMed] [Google Scholar]
- 26.Drouin E, Charpentier F, Gauthier C, Laurent K, Le Marec H. Electrophysiologic characteristics of cells spanning the left ventricular wall of human heart: evidence for presence of M cells. J Am Coll Cardiol. 1995;26:185–192. doi: 10.1016/0735-1097(95)00167-x. [DOI] [PubMed] [Google Scholar]
- 27.Lathi BP. Linear systems and signals. Berkeley-Cambridge Press; 1992. [Google Scholar]
- 28.Berger RD, Kasper EK, Baughman KL, Marban E, Calkins H, Tomaselli GF. Beat-to-beat QT interval variability: novel evidence for repolarization lability in ischemic and nonischemic dilated cardiomyopathy. Circulation. 1997;96:1557–1565. doi: 10.1161/01.cir.96.5.1557. [DOI] [PubMed] [Google Scholar]
- 29.Berger RD. Sex discrimination and the QT interval. Heart Rhythm. 2009;6:187–188. doi: 10.1016/j.hrthm.2008.11.031. [DOI] [PubMed] [Google Scholar]
- 30.Schmidt G, Malik M, Barthel P, Schneider R, Ulm K, Rolnitzky L, Camm AJ, Bigger JT, Schömig A. Heart-rate turbulence after ventricular premature beats as a predictor of mortality after acute myocardial infarction. Lancet. 1999;353:1390–1396. doi: 10.1016/S0140-6736(98)08428-1. [DOI] [PubMed] [Google Scholar]
- 31.Desanctic R, Block P, Hutter A. Tachyarrhythmias in myocardial infarction. Circulation. 1972;45:755–759. doi: 10.1161/01.cir.45.3.681. [DOI] [PubMed] [Google Scholar]
Associated Data
This section collects any data citations, data availability statements, or supplementary materials included in this article.


