

Abstract
Sickle erythrocytes exhibit abnormal morphology and membrane mechanics under deoxygenated conditions due to the polymerization of hemoglobin S. We employed dissipative particle dynamics to extend a validated multiscale model of red blood cells (RBCs) to represent different sickle cell morphologies based on a simulated annealing procedure and experimental observations. We quantified cell distortion using asphericity and elliptical shape factors, and the results were consistent with a medical image analysis. We then studied the rheology and dynamics of sickle RBC suspensions under constant shear and in a tube. In shear flow, the transition from shear-thinning to shear-independent flow revealed a profound effect of cell membrane stiffening during deoxygenation, with granular RBC shapes leading to the greatest viscosity. In tube flow, the increase of flow resistance by granular RBCs was also greater than the resistance of blood flow with sickle-shape RBCs. However, no occlusion was observed in a straight tube under any conditions unless an adhesive dynamics model was explicitly incorporated into simulations that partially trapped sickle RBCs, which led to full occlusion in some cases.
Introduction
Sickle cell anemia was the first disorder to be identified as a molecular disease (1). The hemoglobin molecules inside sickle red blood cells (SS-RBCs) differ from healthy cells due to the substitution of a single amino acid in the β-chain of hemoglobin. In a deoxygenated state, the sickle hemoglobin (HbS) molecules exhibit low solubility and tend to aggregate and form a polymerized state (2) characterized by the double nucleation mechanism (3). Due to the polymerized HbS, the SS-RBCs undergo various morphological changes depending on the mean corpuscular hemoglobin concentration (MCHC) and the deoxygenation procedure used (4, 5). With a slow deoxygenation procedure and low MCHC value, SS-RBCs tend to form into a classical sickle shape, where HbS inside a single sickle cell tends to form into a single aligned polymerized domain. On the other hand, fast deoxygenation and high MCHC conditions favor mosaic or granular shapes, where multiple polymerized domains are typically found inside the cell.
In addition to the various cell morphologies, the membrane mechanics of a SS-RBC also exhibits different properties in oxygenated and deoxygenated states. In the fully oxygenated state, measurements of the effective cell membrane elasticity by optical tweezers (6) showed a 50% increase compared with healthy cells. Measurements by micropipette (7) showed that the effective shear modulus of the sickle cell membrane is approximately two to three times greater than that of the healthy cell. In contrast, the shear modulus of the SS-RBC increases sharply as the oxygen tension is decreased below 60 mmHg (8). Moreover, the rigidity of the fully deoxygenated cell depends on the MCHC value for each single cell. For a sickle cell with a low value of MCHC (e.g., 25.5 g/dL), the effective cell rigidity is ∼100 times larger than the healthy value, whereas for cells with a higher value of MCHC (> 35 g/dL), the cell rigidity shows further increases and could be even larger than the upper limit of the instrument used in the experiment.
Intracellular polymerization and a stiffened cell membrane lead to an elevation in the flow resistance of SS-RBC suspensions. Extensive experimental studies have focused on the dynamics of SS-RBC suspensions in both shear flow and isolated vascular systems (4, 9, 10, 11). Usami et al. (9) measured the shear viscosity of HbS cell suspensions in a Ringer's solution with a hematocrit (Hct) of 45%. Although the viscosity of normal blood exhibits shear-thinning behavior, the behavior of fully deoxygenated HbS blood is similar to Newtonian flow, because the viscosity value is nearly shear-independent. Kaul et al. (4) and Kaul and Xue (10, 11) investigated the rheological and hemodynamic properties of SS-RBC suspensions with various cell morphologies obtained at different MCHC values and deoxygenation rates. They found that the dynamics of the SS-RBC suspensions with various cell morphologies was heterogeneous. More recently, Higgins et al. (12) studied SS-RBC suspensions in a microfluidic network in which the oxygen tension of the environment could be controlled. Vaso-occlusion was observed as the oxygen was gradually removed, and blood flow was resumed as the oxygen was refilled into the microfluidic device. The basis of the occlusion phenomenon was attributed to the stiffened cell membrane in deoxygenated state; however, the detailed biophysical mechanism of the occlusion event was not explained.
Numerical simulations can be used to gain a qualitative and quantitative understanding of the behavior of blood flow in sickle cell anemia. However, relatively fewer numerical studies have been reported, probably due to the complexity of the sickling process and the heterogeneous characteristics of SS-RBCs. Dong et al. (13) studied the effects of cell deformability and cytosol polymerization in a two-dimensional (2D) model of sickle cell in capillaries where an RBC was represented as a 2D cylinder shape. The blood flow resistance for different values of the cell membrane shear modulus and cytosol viscosity was investigated. Dupin et al. (14) studied a collection of SS-RBCs passing through an aperture of diameter less than the size of a single cell.
To quantify the hemodynamics of blood flow with sickle cell anemia under various physiological conditions, we employed a multiscale model (15, 16) to simulate healthy RBCs and SS-RBCs. We modeled an RBC as a network of viscoelastic bonds combined with bending energy and constraints for surface area and volume constraints. We fully determined the mechanical properties of the cell membrane using microscopic parameters such that we could impose various cell membrane mechanical states without changing the model's parameters. Different realistic 3D cell morphologies were constructed according to the typical shapes observed in experiments by scanning electron microscopy (SEM) (4, 10). We analyzed the quantitative shape characteristics by introducing asphericity and elliptical shape factors (ASF and ESF, respectively). The corresponding shear viscosity and peripheral resistance were computed in shear and tube flow systems. Here, we compare our findings with available experimental results, and discuss the physical mechanisms. We show that the model can capture the heterogeneous hemodynamics of SS-RBC suspensions with different cell morphologies. We also discuss the physiological conditions for the occurrence of vaso-occlusion. Although the flow resistance of diseased blood exhibits an apparent elevation compared with healthy blood, no occlusion events occur until proper adhesive interactions are introduced into the system. Our simulation results indicate that the adhesive interactions between the sickle cells and the vascular endothelium play a key role in triggering the vaso-occlusion phenomenon in straight vessels.
In this work, we constructed SS-RBCs in various 3D morphological states and quantified them using the ASF and ESF. We studied the dynamic properties of SS-RBC suspensions in shear flow and tube flow with a diameter of 9 μm. The shear viscosity and tube flow resistance were computed and compared with available experimental results. Finally, we examined the effect of the blood cell-endothelium interaction on the hemodynamics of SS-RBCs.
Multiscale Model
The RBC model was developed within the framework of the dissipative particle dynamics (DPD) method (17, 18). DPD is a particle-based method that is widely used for simulation of soft matter at the mesoscopic level (19). Each DPD particle represents a virtual cluster of atoms or molecules rather than an individual atom. In contrast to the molecular dynamics (MD) method, additional dissipative and random forces are included in the particle interactions due to the degrees of freedom eliminated during the coarse-graining procedure (20). Details about the methods used can be found elsewhere (19).
RBC membrane
In our model, the RBC membrane is represented by a 2D triangulated network with Nv = 500 vertices, where each vertex is represented by a DPD particle. For each single cell, the free energy is defined by
| (1) |
where Vs represents the viscoelastic bond interaction between the cell vertices such that proper membrane mechanic properties can be imposed. Vb represents the bending energy of the cell membrane. Va and Vv respectively represent the area and volume constraints to mimic the incompressibility of the lipid bilayer and the intracellular cytosol. More details on the RBC model and the scaling between the model and the physical units can be found in the Supporting Material and Fedosov et al. (16).
Sickle cell membrane
In contrast to normal RBCs, sickle cells exhibit various morphological states due to the presence of polymerized HbS inside the cell. In the deoxygenated state, the HbS molecules polymerize and grow into bundles of fiber. Consequently, the sickle cell undergoes various degrees of distortion due to the interaction between the growing fiber and the cell membrane. The final shape of the sickle cell depends on the intracellular HbS polymer configuration. In general, classical sickle and holly leaf shapes originate from a single HbS polymer domain growing along one direction, and granular and near-biconcave shapes originate from multiple domains with homogeneous growth directions. The configuration of the HbS polymer is determined by several physiological conditions (e.g., the MCHC of the sickle cell, rate of the deoxygenation process, final gas tension, temperature, and pH level) that are difficult to incorporate explicitly into the model.
Alternatively, we directly consider the surface tension applied on the cell membrane exerted by the growing HbS fibers in a system similar to those discussed by Daniels et al. (21). Fig. 1 shows the triangulated mesh of a healthy RBC with biconcave shape. We define the direction along the thickness of RBC as the z direction, and the plane determined by the two long axes is defined as the x-y plane. The letters A, B, C, and D indicate the four points with the maximum/minimum values in the x/y directions, representing the four anchor points where the intracellular growing fibers can potentially approach the cell membrane. Each anchor point is represented by vertices, where ϵ = 0.016. A different surface tension is exerted on the cell membrane depending on the configuration of the HbS fibers. For deoxygenated SS-RBCs with low MCHC, the intracellular HbS polymers tend to grow into a single domain, whereas the angular width is relatively small due to the limited heterogeneous nucleation and branching rates, resulting in the classical sickle shape. Accordingly, the surface tension is applied only on points A and C to represent the specific direction of the polymer growth. For SS-RBCs with high MCHC, the intracellular HbS polymers tend to form spherulitic configurations due to the explosive growth via the high heterogeneous nucleation rate on the preexisting HbS polymers, resulting in the granular shape. In this case, the growing HbS fibers may approach the cell membrane from multiple directions, and thus the surface tension is applied on all four anchor points. We note that the HbS polymer may interact with the cell membrane at more than four positions, resulting in the multiple spicules distributed in the cell membranes. However, this type of cell exhibits a similar granular shape. Therefore, we use four anchor points in this study to represent the positions where the growing HbS fibers interact with the cell membrane.
Figure 1.
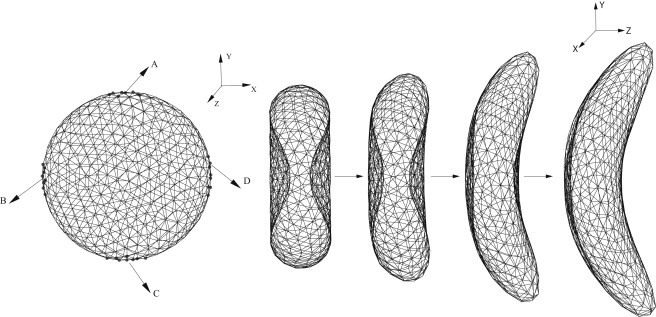
(Left) Triangulated mesh of the RBC membrane. Labels A–D represent the four anchor points where the stretching force is applied. (Right) Successive snapshots of an RBC during the morphological transition to the sickle shape.
Starting from the original biconcave shape, the cell membrane undergoes various deformations until a certain new shape is achieved. We define the new shape as the equilibrium state of the sickle cell and remove the surface tension applied at the anchor points. To define the distorted shape as the stable state of the sickle cell with minimum free energy, we have to eliminate the local stress on the cell membrane generated by the distortion. To that end, we apply a stress-free model to the new state of the sickle cell. The equilibrium length of of each bond is set to the edge length of the new state for . This leads to individual maximum extension for each bond as , where x0 is a constant < 1. This annealing procedure provides a bond network that is free of local stress abnormalities. Finally, the bond parameters are adjusted according to the shear modulus of the sickle cell. A mathematical description of the three main shapes (sickle, elongated, and granular) is given in the Supporting Material.
Adhesion model
In addition to abnormal cell morphologies, the SS-RBCs also exhibit adhesive behavior with the blood vessel wall as well as with leukocytes present in the blood stream. In this first study, we omit the important effect of the cell-cell interaction because it deserves to be examined in a separate study. To investigate the effect of the SS-RBC/wall adhesive mechanism on the hemodynamics of the SS-RBC suspensions, we employ a stochastic model (22, 23) to represent the multifunctional interactions. Specifically, we assume that the sickle cell vertices can interact with the endothelial ligands within an interaction distance don. For each time step Δt, transient bonds can be formed between the cell vertices and the endothelial ligands with probability , and the existing bonds can be ruptured with probability , where are the reaction rates defined by
| (2) |
where σon and σoff are the effective formation/rupture strengths. For existing bonds, the force between the receptors and ligands is defined by , where ks is the spring constant and l0 is the equilibrium length.
Results
We constructed three different types of sickle cell membranes as typically observed in experiments (10), and further quantified their various morphologies using the ASF and ESF to represent the degree of distortion of the cell membrane. We then investigated the shear viscosity of SS-RBC suspensions with different morphologies and Hct values, and compared our findings with experiment results. We studied the hemodynamics of SS-RBC suspensions in a tube with a diameter of 9.0 μm. Finally, we investigated the effect of the adhesive interaction between the SS-RBCs and a modeled vascular endothelium on the vaso-occlusion phenomenon.
Morphology of the SS-RBCs
The morphologic characteristics of sickle cells were previously studied with the use of SEM for different intracellular MCHC values (4) and deoxygenation rates (10). Sickle cells with medium MCHC values exhibit a sickle shape, whereas cells with high MCHC values exhibit a granular shape. Similarly, a slow deoxygenation rate results in a sickle shape and a fast deoxygenation rate favors a granular shape. Remarkably, a third type of SS-RBC is observed with a prolonged (30 min) incubation of the granular cell in the deoxygenated condition. In contrast to the sickle and granular shapes, the cell exhibits an extremely elongated shape in one direction with a projection much longer than the diameter of the cell. This type of cell probably originates from further polymerization of HbS in a certain direction during the prolonged deoxygenated condition.
To mimic the various distortion effects on the cell membrane, we apply different forces at the anchor points, as discussed in the previous section and shown in Fig. 1. An opposite force is applied uniformly on the rest of the vertices to keep a total force of zero on the cell. The sickle shape is obtained from the aligned HbS polymer growing along one direction. The stretching force is only applied on the anchor points A and C. The z-component of the forces represents the deflection of the HbS fiber widely observed in experiment. The successive snapshots in Fig. 1 show the shape transition of an SS-RBC from the biconcave to the classical sickle shape. Similarly, we obtain a granular shape by applying the stretching force on all four of the anchor points. Detailed information about the stretching force is presented in the Supporting Material.
The distorted shape of the cell is defined as the equilibrium state for the sickle cell through the procedure explained in the previous section (see also Supporting Material). The degree of distortion can be identified by an eigenvalue analysis of the gyration tensor defined by
| (3) |
where ri are the RBC vertex coordinates; rC is the center of mass; and m, n can be x, y, or z. The three eigenvalues obtained from the gyration tensor are denoted by λ1, λ2, and λ3, where λ1 < λ2 < λ3. The ASF and ESF are defined by , ESF = λ3 / λ2, where Rg is the radius of gyration defined by .
The ASF measures the deviation of the RBC from a perfect sphere shape, and the ESF measures the degree of distortion on the x-y plane. Fig. 2 plots the ASF and ESF for the three types of cells constructed above. The granular cell shows characteristics similar to those of a healthy cell, and the elongated cell exhibits the largest deviation from the perfect biconcave shape. A similar morphological analysis was previously conducted on the medical image of different sickle cells on 2D plane, and circular and elliptical shape factors were computed for granular- and sickle-shaped cells (24, 25). The different morphologies we constructed in this work show consistent agreement with the results from the medical image analysis (24, 25).
Figure 2.
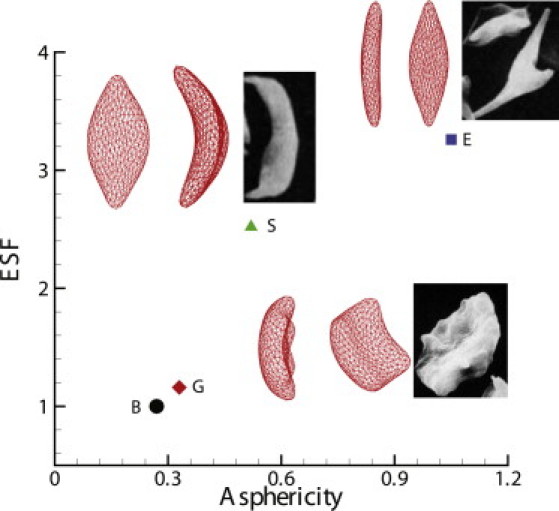
ASF and ESF for the different shapes of sickle cells. Labels G, S, and E represent the granular, sickle, and elongated shapes of the sickle cells, respectively, and the inset shows their morphologic projections on the x-z and x-y planes. The inset images represent experimental observations for different morphologic states of deoxygenated SS-RBCs by SEM (reproduced with permission from Kaul and Xue (10)). The label B corresponds to the original biconcave shape, the morphological projection of which is shown in Fig. 1.
Shear viscosity of SS-RBC suspensions
The abnormal rheological properties of SS-RBCs are correlated with the stiffened cell membrane, which was previously measured in micropipette experiments (8) at different stages of deoxygenation. The shear modulus of the fullly deoxygenated sickle cell falls within a wide range of values depending on the intracellular HbS polymerization. For SS-RBCs with a low MCHC value (25.5 g/dL), the shear modulus is ∼100 times the value of healthy cells. However, for SS-RBCs with a high MCHC value (> 35 g/dL), the ratio between the sickle and healthy cells varies from 300 to ∞, where ∞ represents a certain high value beyond the instrument's measurement range. For SS-RBCs studied in rheological experiments, the typical MCHC value reported is between 32.2 g/dL and 41 g/dL. Therefore, we choose the shear modulus of the fully deoxygenated sickle cell to be 2000 times the value of the healthy cells. The bending rigidity of sickle cell under different deoxygenated stages is unknown. We set its value to be 200 times the value of healthy RBCs. With respect to the specific value of the shear modulus we used, sensitivity studies reveal that the shear viscosities of SS-RBC suspensions have a weak dependence on the shear rate until the ratio of the SS-RBC shear modulus to the value of healthy cells is on order of 1000; similarly, for bending rigidity, a weak dependence on the shear rate is achieved with the value of SS-RBC ∼200 times the value of healthy cells.
Blood flow in sickle cell anemia is modeled by a suspension of SS-RBCs in a solvent, which is represented by a collection of coarse-grained particles with DPD interactions. The dissipative force coefficient γ for the vertex-solvent interaction defines the RBC-solvent boundary conditions (16). A short-range Lennard-Jones repulsive interaction is imposed between the membrane vertices of different (i.e., healthy or diseased) cells for volume exclusion between the cells. The Lennard-Jones potential is defined by , where , ϵ = 1.0 in the DPD unit and the repulsive interaction vanishes for .
With the SS-RBC suspension defined above, we first consider the shear flow system with Hct = 45% following the experiment of Usami et al. (9). The viscosity of the solvent is chosen to be η0 = 1.2 cp. The specific morphological characteristics of the SS-RBCs were not specified in the experiment. However, we note that the reported MCHC value of the sickle cell is relatively high (37.7 g / dL). Therefore, the granular shape is adopted for the current simulation. Periodic Lees-Edwards boundary (26) conditions are imposed on the fluid system in which different shear rates can be obtained. The simulation domain has the size of 40×38×28 in DPD units, with 182 cells placed in the system. Fig. 3 shows the viscosity computed for both healthy and diseased blood with different shear rates. The dashed lines represent the simulation results fitted by , where γ is the shear rate, and a, b, and c are fitting parameters specified in Fig. 3. Good agreement with the experimental results is obtained for both types of blood. Healthy blood behaves as a non-Newtonian fluid under normal conditions with shear-dependent viscosity (27). The blood cells are less deformed at low shear rate conditions and exhibit solid-like properties with relatively high viscosity. On the other hand, the blood cells can be largely deformed at high shear rate conditions, with the fluid properties being more pronounced. Therefore, the viscosity of healthy blood decreases as the shear rate increases, as shown in Fig. 3. In contrast to the healthy RBC suspension, the deoxygenated SS-RBC suspension shows elevated viscosity values that are nearly independent of the shear rate. This difference arises from the largely stiffened sickle cell membrane, which is so rigid that the cell cannot be deformed even with the high shear rate employed in the experiment (9). Therefore, the sickle cell exhibits solid-like behavior throughout the entire region of shear rate conducted in this study. Our model, which consists solely of SS-RBCs in suspension, clearly captures this transition from non-Newtonian to Newtonian flow.
Figure 3.
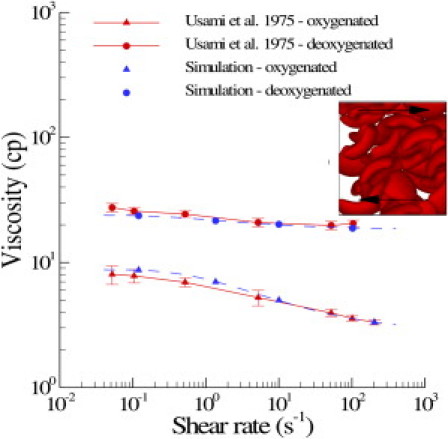
Shear viscosity of healthy blood and SS-RBC suspensions with Hct = 45%. The dashed lines represent the fitted curve to the simulation result by , where γ is the shear rate; a, b, and c = 1.43, –6.04, 8.78, respectively, for healthy blood; and 1.08, –5.5, 23.9, respectively, for deoxygenated SS-RBC suspension. The inset plot shows a snapshot of the granular SS-RBCs in shear flow.
To investigate the relationship between the rate of deoxygenation effect and the rheology of SS-RBC suspensions, Kaul et al. (10) examined the shear viscosity of SS-RBC suspensions subjected to both fast and gradual deoxygenation procedures. SS-RBC suspensions subjected to a gradual deoxygenation procedure showed a monotonic elevation of shear viscosity and the formation of sickle-shaped blood cells over a period of 30 min until the full deoxygenated state was achieved. In contrast, SS-RBC suspensions subjected to a fast deoxygenation procedure exhibited two distinct phases. The shear viscosity of the SS-RBC suspensions showed fast elevation within the first 7 min of deoxygenation accompanied by a cellular morphology transition to the granular shape. However, the shear viscosity decreased gradually during further deoxygenation. A large portion of cells appears extremely elongated with the intracellular HbS fibers aligned in one direction. To study the effect of morphology on the rheological behavior of SS-RBCs, we simulate the shear flow of SS-RBC suspensions with the three distinct types of sickle cells reported in the experiment (Hct = 40 %). Fig. 4 plots the shear viscosity with shear rate from 25 to 75s−1, and the shear modulus of the cell membrane is the same for all three types. In similarity to Fig. 3, the SS-RBC suspension shows elevated and shear-independent viscosity values for all three types. Moreover, the SS-RBC suspensions exhibit different viscosity values for the different cell shapes. Within the shear rate of the current simulation, the viscosities of SS-RBC suspensions with granular, sickle, and elongated shapes are approximately 13.5, 12.2 and 9.4 cp, respectively. This result explains the progressive decrease of the viscosity value with further deoxygenation, because a large portion of granular cell transforms into the elongated shape during the procedure. This result is probably due to the different effective volume for each type of the SS-RBC in the shear flow system (10), which affects the momentum transport ability between the cells.
Figure 4.
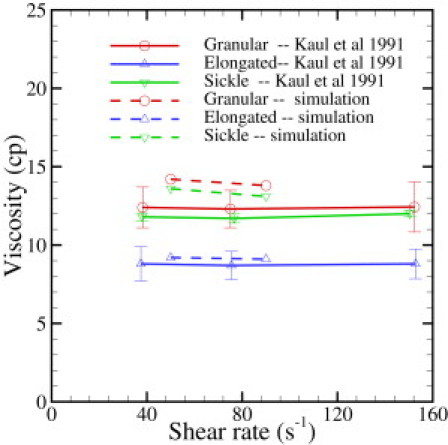
Shear viscosity of the sickle blood flow with different cell morphologies reported by Kaul and Xue (10). Hct = 40%.
SS-RBC suspensions in tube flow
The hemodynamics of SS-RBCs was previously studied in an isolated vasculature (4) with subpopulations of different MCHC values. Whereas the oxygenated SS-RBCs exhibit hemodynamics similar to those observed in healthy blood flow, the deoxygenated SS-RBCs show distinctive dynamic properties for each type of subpopulation. In the simulation, we consider SS-RBC suspensions in a tube flow system with Hct = 30 %, in similarity to the experiment. However, the size and topology of the microvasculature in the experiment are unknown. Therefore, we set the diameter of the tube to be 9.0 μm, which is a typical size for capillary flow. In this sense, we do not expect the apparent viscosity obtained from the simulation to match exactly with the experimental results. Instead, we explore the effect of different types of SS-RBCs on the flow resistance in the microcirculation.
Deoxygenated blood flow is represented by a suspension of RBCs with sickle and granular shapes. The membrane shear modulus and bending rigidity are similar to the values adopted in the simulation of a shear flow system. Blood plasma and cytosol are explicitly represented by DPD, and they are separated by the cell membrane through the bounce-back reflection on membrane surface. The viscosity of the cytosol is set to 4η0 and 50η0 for healthy and deoxygenated blood flow, respectively, where η0 is the viscosity of the blood plasma. (We note that the viscosity of the cytosol under deoxygenated conditions could be much larger than 50η0. On the other hand, a sensitivity study we performed with cytosol viscosity ηinner = 100η0 shows that the blood dynamics is nearly independent of ηinner with ηinner > 50η0.)
Fig. 5 plots the increase of the flow resistance with different oxygen tensions for the sickle and granular shapes. Although both types of blood flow show a further increase in flow resistance in the deoxygenated state, the granular type of blood flow shows a more pronounced elevation compared with the sickle shape. Kaul et al. proposed that this may be due to the different distribution of SS-RBCs in the capillary (4). The inset plot of Fig. 5 shows snapshots of sickle and granular cells in the tube flow. The cells of sickle shape tend to flow along the axis of the tube, as observed by LaCelle (28, 29) in experimental studies. To quantify this phenomenon, we computed the cell orientation angle distribution in the tube flow, as shown in Fig. 6. The cell orientation is defined by the angle θ between the flow direction and the eigenvector of the gyration tensor V1 defined by Eq. 3. For each type of cell, the simulated orientation angle distribution is fitted by superimposed Gaussian wave functions. Detailed fitted functions and parameters are presented in Fig. 6. Compared with the granular cells, the orientation angle of the sickle-shape blood shows a wider distribution for large values of θ, indicating that the sickle-shape SS-RBCs are more likely to orient along the flow direction. (This is also supported by unpublished data (Ming Dao and Sarah E. Du, Massachusetts Institute of Technology, personal communication, 2011).) This configuration results in a lower flow resistance as compared with the granular cells, which exhibit a scattered distribution near the centerline of the tube. Finally, we note that the elevation of the flow resistance is underestimated by the simulation as compared with the experimental results. This discrepancy is probably due to the entrapment of certain cells in the microvascular endothelium, which may further increase the flow resistance of the blood flow. We discuss this mechanism in the following section.
Figure 5.
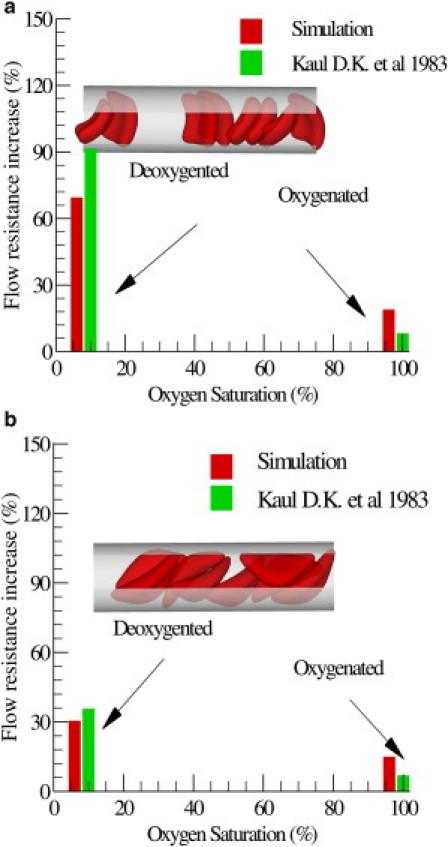
Increase of the flow resistance induced by the sickle blood flow for both granular (a) and sickle (b) shapes. The inset plot shows a snapshot of the sickle cells in the tube flow.
Figure 6.
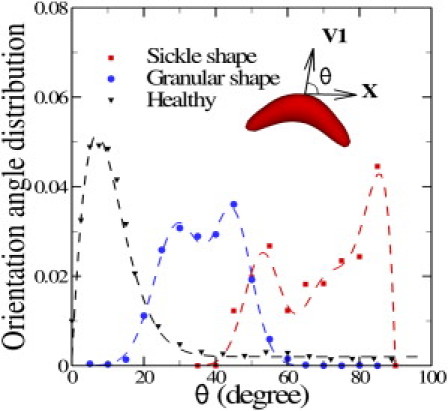
Cell orientation angle distribution for healthy, sickle. and granular cells in pipe flow. The cell orientation is defined by the angle θ between the flow direction (x) and the eigenvector V1 of the gyration tensor, as shown in the inset plot. The dashed lines represent the fitted curves to the simulated results by superimposed Gaussian wave functions. For the healthy cell, , where a = 0.014, b = 0.047, p = 1.4, c = 0.002. For the granular cell, , where a1 = 0.0315, b1 = 29.42, c1 = 0.012, a2 = 0.033, b2 = 44.75, c2 = 0.018. For the elongated cell, , where a1 = 0.024, b1 = 53.2, c1 = 0.021, a2 = 0.015, b2 = 70.3, c2 = 0.015, a3 = 0.025, c3 = 0.2. The fitting parameters are subject to the constraint .
Adhesion dynamics of SS-RBCs
The hemodynamic results presented in the previous section show elevated flow resistance for deoxygenated SS-RBC suspensions. However, we observed no full flow occlusion in our simulations (16 sets of simulations with different combinations of cell membrane rigidities and inner viscosity). In contrast, recent in vitro experiments by Higgins et al. (12) showed that SS-RBC suspensions may result in full flow occlusion in microchannels under deoxygenated conditions, i.e., without any adhesion with the wall. We suspect that the occlusion reported in the experiment is due to the complex geometry of the microchannel used in the experiment. Some deoxygenated cells with stiffened membrane may get stuck at the corner of certain channels that are smaller than a single cell, as was observed in a microchannel experiment with malaria-infected RBCs conducted by Shelby et al. (30). However, we observed no full occlusion in this study with a straight tube of diameter D = 9 μm under different parametric variations.
A previous study on SS-RBC occlusion indicated that the adhesive interaction between SS-RBCs and vascular endothelium plays a key role in the vicious occlusion-and-sickle cycle (31). The mechanism of the adhesive interaction is relatively complicated, with several interrelated factors playing important roles during the procedure. In addition to the interactions between SS-RBC and endothelium, an in vivo experiment indicated that SS-RBCs can also interact with the leukocytes adherent to inflamed postcapillaries (32). However, the detailed adhesive mechanisms are beyond the scope of this work. To investigate the effect of a general adhesive interaction on the dynamics of blood flow, we simply assume that there exist certain types of endothelial ligands coated on the wall of the tube, referring to the relevant adhesive proteins that we model indirectly, as shown in Fig. 7. The ligands are uniformly distributed with density 4 μm−2. A bond interaction can be formed and ruptured between the cell vertices and the ligands with a stochastic model as described in the “Multiscale Model” section. The simulation parameters are included in the Supporting Material.
Figure 7.
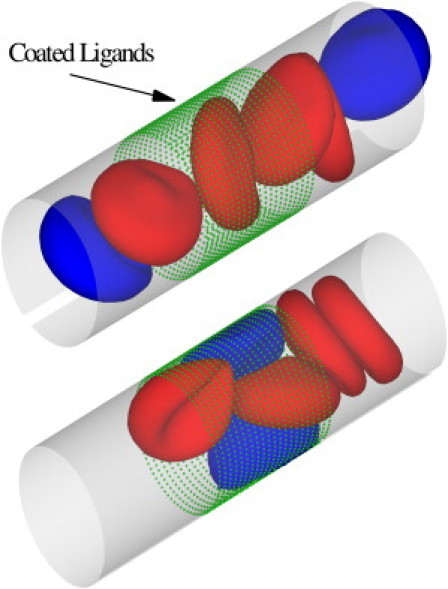
Sickle blood flow with adhesive dynamics. The green dots represent the ligands coated on the vessel wall. The blue cells represent the active group of sickle cells that exhibit adhesive interaction with the coated ligands. The red cells represent the nonactive group of cells. Top: A snapshot showing the active group of cells flowing into the region coated with ligands. Bottom: A snapshot of SS-RBCs in the local occlusion state.
With the simplified adhesive model defined above, we reconsider blood flow in a tube as described above. The stiff biconcave shape is adopted for the RBC model, and the shear modulus of the cell membrane is 100 times the value of healthy cell. For a comparison study, steady flow is first achieved with the adhesive interaction being turned off. The measured relative apparent viscosity is ∼1.52 and no blood occlusion is observed in the simulation. Next, we consider blood flow with the adhesive interaction incorporated. As shown in Fig. 7, the blood cells are divided into two groups. Each SS-RBC in the active group (colored blue) expresses the adhesive receptors with the average adherent force ∼68 pN, whereas the nonactive group (in red) does not interact with the ligands. The active group of cells, once it flows into the region coated with the ligands, shows firm attachment to the wall of the channel, which results in a substantial decrease in the effective tube diameter and the shear rate near the trapped cells. Moreover, the entrapped cells result in a secondary trapping of the nonactive cells in the adhesion area due to the largely increased membrane stiffness. This procedure is accompanied by a further decrease in the shear rate, which eventually leads to partial or even full occlusion of the tube flow.
Fig. 8 presents the mean velocity of the blood flow as a function of time, corresponding to the procedure described above. For the case without adhesion, the steady flow state is reached with average velocity of ∼180 μm/s and 115 μm/s, respectively. With the adhesive dynamics turned on, blood flow exhibits a transition from steady flow to a partial/full occluded state, which can be roughly divided into three stages according to the velocity values shown in Fig. 8. The first stage (t < 6.9 s) represents the steady flow state before the active cells arrive at the region coated with ligands. The velocity value is similar to the case without adhesion. However, the average velocity undergoes a sharp decrease to 40 μm/s during the second stage (6.9 s < t < 7.3 s), representing the adhesion procedure between the active cells and the coated ligands with decreased effective tube diameter. In the third stage, the blood flow (blue curve) with the larger pressure drop exhibits a partially occluded state with average velocity of 50 μm/s due to persistently adherent cells on the wall of channel. Moreover, the velocity of the blood flow with the smaller pressure drop (red curve) decreases slowly to ∼10 μm/s, representing the secondary entrapment of the nonactive cells and the fully occluded state.
Figure 8.
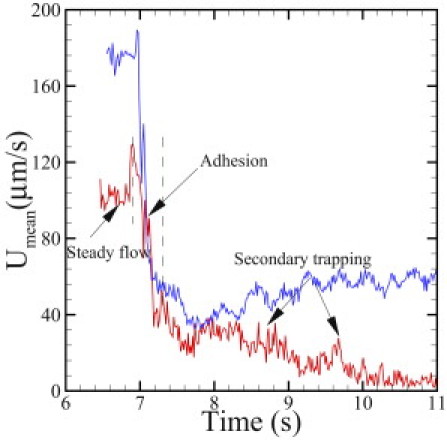
Mean velocity of sickle blood at different stages of the adhesive dynamics. The red and blue curves correspond to pressure drops of 8.3×10⁴Pa/m and 1.35×10⁵Pa/m, respectively.
Discussion
In this study, we employed a validated multiscale model to quantify the morphology and dynamic properties of SS-RBCs. To the best of our knowledge, this is the first work on multiscale 3D modeling of SS-RBCs to capture the heterogeneous nature of both realistic single cell shapes and the corresponding collective hemodynamics. Specifically, we constructed three typical shapes of distorted sickle cells according to experimental observations by SEM with different deoxygenation rates and MCHC values. We quantified the different degrees of distortion by the ASF and ESF of each cell shape, and our results are consistent with the medical image observations. We note that the modeling procedure provides a general framework to link the experimental results obtained at the macroscale with the numerical modeling of blood cells at the mesoscale level, which can be further extended to general modeling of diseased cells with other specific shapes characterized by optical techniques.
With regard to the rheological properties, the simulated results are in good agreement with the experimental results for both healthy and deoxygenated SS-RBC suspensions. Compared with the healthy blood, the shear viscosity of the deoxygenated SS-RBC suspensions shows a general elevation for different shear rate conditions. Two main points emerge from the shear viscosity results for SS-RBC suspensions: First, the transition from shear-thinning flow to shear-independent flow reveals the profound effect of the cell membrane stiffening during the deoxygenation procedure, as reported by Itoh et al. (8). Second, the simulated results of shear flow with different cell shapes indicate that the cell morphology further influences the shear viscosity values. Although the blood with granular shape exhibited the largest viscosity, the elongated shape that originated from the granular cell with further deoxygenation resulted in the least-viscous state. Our simulation results further validate the dependence of SS-RBC rheology on cell morphology as reported by Kaul and Xue (10).
In addition to the shear flow system, the heterogeneous nature of SS-RBCs is also observed in the microtube flow system. The change of the flow resistance induced by granular RBCs shows a greater increase than the resistance of blood with sickle-shape RBCs because the latter may align along the flow directions, resulting in a wider plasma layer. Compared with the experiments conducted in isolated microvasculature, our simulations indicate a general underestimation of the blood flow resistance induced by SS-RBCs. This discrepancy is mainly due to the two simplifications in our model: 1), the isolated vasculature is modeled as a simple tube flow, whereas the detailed wall topological information is omitted; and 2), the erythrocyte-endothelium interaction is not considered. Remarkably, the perfusion of the Ringer's solution after the deoxygenated SS-RBC suspensions only results in partial recovery of the pressure and flow rate (4), indicating persistent adhesion events and local vascular obstruction.
The introduction of adhesive dynamics in our model shows a profound effect on the hemodynamics of SS-RBCs. The attachment of adhesive cells to the vessel wall reduces the effective diameter of the blood vessel, which results in further elevation of the flow resistance. Moreover, the adhesive cell attached on the vessel wall can further entrap nonadhesive, less-deformable cells, leading to a secondary elevation of the flow resistance, or even full occlusion of the channel. The adhesion-trapping procedure predicted here resembles the essential stages of the two-step model for SS-RBC occlusion in postcapillary venules proposed by Kaul and Fabry (31) and Kaul et al. (33). However, we note that the multifunctional, interrelated adhesion interactions are represented by a stochastic model with simple formation/rupture events between the mediation molecules adopted here. To the contrary, the different adhesive pathways involved in the procedure may exhibit different responses to the physiological conditions (e.g., local wall shear stress, target protein density, and endothelium inflammation), which may result in different adhesive dynamics. Therefore, an experimental characterization of the adhesion response under different physiologic conditions would be of great interest. Moreover, recent studies in transgenic sickle mice revealed that the leukocytes may play an important role in vascular occlusion (32). The sickle disease may significantly enhance the endothelium-leukocyte interaction, and the adherent leukocytes may further facilitate the entrapment of the sickle cells. These unresolved issues require further experimental and numerical investigations.
Acknowledgments
We thank Dmitry Fedosov (Institut für Festkörperforschung, Forschungszentrum Jülich) for useful discussions.
This work was supported by the National Science Foundation (CBET-0852948) and National Institutes of Health (R01HL094270). Computations were performed on the BG/P system at Argonne National Laboratory and on the Kraken computer at the National Institute for Computational Sciences.
Editor: Charles Wolgemuth.
Footnotes
Two movies, more details on the RBC model, a mathematical description of the three main shapes (sickle, elongated, and granular), a mathematical description of the three main shapes (sickle, elongated, and granular), simulation parameters, four tables, four figures, and references (34, 35, 36, 37, 38) are available at http://www.biophysj.org/biophysj/supplemental/S0006-3495(11)05403-8.
Supporting Material
References
- 1.Pauling L., Itano H.A., Singer S.J., Wells I.C. Sickle cell anemia a molecular disease. Science. 1949;110:543–548. doi: 10.1126/science.110.2865.543. [DOI] [PubMed] [Google Scholar]
- 2.Samuel R.E., Salmon E.D., Briehl R.W. Nucleation and growth of fibres and gel formation in sickle cell haemoglobin. Nature. 1990;345:833–835. doi: 10.1038/345833a0. [DOI] [PubMed] [Google Scholar]
- 3.Ferrone F.A., Hofrichter J., Eaton W.A. Kinetics of sickle hemoglobin polymerization. II. A double nucleation mechanism. J. Mol. Biol. 1985;183:611–631. doi: 10.1016/0022-2836(85)90175-5. [DOI] [PubMed] [Google Scholar]
- 4.Kaul D.K., Fabry M.E., et al. Nagel R.L. Erythrocytes in sickle cell anemia are heterogeneous in their rheological and hemodynamic characteristics. J. Clin. Invest. 1983;72:22–31. doi: 10.1172/JCI110960. [DOI] [PMC free article] [PubMed] [Google Scholar]
- 5.Christoph G.W., Hofrichter J., Eaton W.A. Understanding the shape of sickled red cells. Biophys. J. 2005;88:1371–1376. doi: 10.1529/biophysj.104.051250. [DOI] [PMC free article] [PubMed] [Google Scholar]
- 6.Brandão M.M., Fontes A., et al. Saad S.T. Optical tweezers for measuring red blood cell elasticity: application to the study of drug response in sickle cell disease. Eur. J. Haematol. 2003;70:207–211. doi: 10.1034/j.1600-0609.2003.00027.x. [DOI] [PubMed] [Google Scholar]
- 7.Evans E., Mohandas N., Leung A. Static and dynamic rigidities of normal and sickle erythrocytes. Major influence of cell hemoglobin concentration. J. Clin. Invest. 1984;73:477–488. doi: 10.1172/JCI111234. [DOI] [PMC free article] [PubMed] [Google Scholar]
- 8.Itoh T., Chien S., Usami S. Effects of hemoglobin concentration on deformability of individual sickle cells after deoxygenation. Blood. 1995;85:2245–2253. [PubMed] [Google Scholar]
- 9.Usami S., Chien S., et al. Bertles J.F. Effect of deoxygenation on blood rheology in sickle cell disease. Microvasc. Res. 1975;9:324–334. doi: 10.1016/0026-2862(75)90069-2. [DOI] [PubMed] [Google Scholar]
- 10.Kaul D.K., Xue H. Rate of deoxygenation and rheologic behavior of blood in sickle cell anemia. Blood. 1991;77:1353–1361. [PubMed] [Google Scholar]
- 11.Kaul D.K., Liu X.D. Rate of deoxygenation modulates rheologic behavior of sickle red blood cells at a given mean corpuscular hemoglobin concentration. Clin. Hemorheol. Microcirc. 1999;21:125–135. [PubMed] [Google Scholar]
- 12.Higgins J.M., Eddington D.T., et al. Mahadevan L. Sickle cell vasoocclusion and rescue in a microfluidic device. Proc. Natl. Acad. Sci. USA. 2007;104:20496–20500. doi: 10.1073/pnas.0707122105. [DOI] [PMC free article] [PubMed] [Google Scholar]
- 13.Dong C., Chadwick R.S., Schechter A.N. Influence of sickle hemoglobin polymerization and membrane properties on deformability of sickle erythrocytes in the microcirculation. Biophys. J. 1992;63:774–783. doi: 10.1016/S0006-3495(92)81655-7. [DOI] [PMC free article] [PubMed] [Google Scholar]
- 14.Dupin M., Halliday I., et al. Munn L.L. Lattice Boltzmann modelling of blood cell dynamics. Int. J. Comput. Fluid Dyn. 2008;22:481–492. [Google Scholar]
- 15.Pivkin I.V., Karniadakis G.E. Accurate coarse-grained modeling of red blood cells. Phys. Rev. Lett. 2008;101:118105. doi: 10.1103/PhysRevLett.101.118105. [DOI] [PubMed] [Google Scholar]
- 16.Fedosov D.A., Caswell B., Karniadakis G.E. A multiscale red blood cell model with accurate mechanics, rheology, and dynamics. Biophys. J. 2010;98:2215–2225. doi: 10.1016/j.bpj.2010.02.002. [DOI] [PMC free article] [PubMed] [Google Scholar]
- 17.Hoogerbrugge P.J., Koelman J.M.V.A. Simulating microscopic hydrodynamic phenomena with dissipative particle dynamics. Europhys. Lett. 1992;19:155–160. [Google Scholar]
- 18.Espanol P., Warren P. Statistical mechanics of dissipative particle dynamics. Europhys. Lett. 1995;30:191–196. [Google Scholar]
- 19.Groot R.D., Warren P.B. Dissipative particle dynamics: bridging the gap between atomistic and mesoscopic simulation. J. Chem. Phys. 1997;107:4423–4435. [Google Scholar]
- 20.Lei H., Caswell B., Karniadakis G.E. Direct construction of mesoscopic models from microscopic simulations. Phys. Rev. E. 2010;81:026704. doi: 10.1103/PhysRevE.81.026704. [DOI] [PMC free article] [PubMed] [Google Scholar]
- 21.Daniels D.R., Marenduzzo D., Turner M.S. Stall, spiculate, or run away: the fate of fibers growing towards fluctuating membranes. Phys. Rev. Lett. 2006;97:098101. doi: 10.1103/PhysRevLett.97.098101. [DOI] [PubMed] [Google Scholar]
- 22.Hammer D.A., Apte S.M. Simulation of cell rolling and adhesion on surfaces in shear flow: general results and analysis of selectin-mediated neutrophil adhesion. Biophys. J. 1992;63:35–57. doi: 10.1016/S0006-3495(92)81577-1. [DOI] [PMC free article] [PubMed] [Google Scholar]
- 23.Fedosov D.A., Caswell B., Karniadakis G.E. Wall shear stress-based model for adhesive dynamics of red blood cells in malaria. Biophys. J. 2011;100:2084–2093. doi: 10.1016/j.bpj.2011.03.027. [DOI] [PMC free article] [PubMed] [Google Scholar]
- 24.Horiuchi K., Ohata J., et al. Asakura T. Morphologic studies of sickle erythrocytes by image analysis. J. Lab. Clin. Med. 1990;115:613–620. [PubMed] [Google Scholar]
- 25.Asakura T., Mattiello J.A., et al. Ohene-Frempong K. Partially oxygenated sickled cells: sickle-shaped red cells found in circulating blood of patients with sickle cell disease. Proc. Natl. Acad. Sci. USA. 1994;91:12589–12593. doi: 10.1073/pnas.91.26.12589. [DOI] [PMC free article] [PubMed] [Google Scholar]
- 26.Lees A.W., Edwards S.F. The computer study of transport processes under extreme conditions. J. Phys. Chem. 1972;5:1921–1928. [Google Scholar]
- 27.Fedosov D.A., Pan W., et al. Karniadakis G.E. Predicting human blood viscosity in silico. Proc. Natl. Acad. Sci. USA. 2011;108:11772–11777. doi: 10.1073/pnas.1101210108. [DOI] [PMC free article] [PubMed] [Google Scholar]
- 28.LaCelle P.L. Oxygen delivery to muscle cells during capillary vascular occlusion by sickle erythrocytes. Blood Cells. 1977;3:263–272. [Google Scholar]
- 29.Reference deleted in proof.
- 30.Shelby J.P., White J., et al. Chiu D.T. A microfluidic model for single-cell capillary obstruction by Plasmodium falciparum-infected erythrocytes. Proc. Natl. Acad. Sci. USA. 2003;100:14618–14622. doi: 10.1073/pnas.2433968100. [DOI] [PMC free article] [PubMed] [Google Scholar]
- 31.Kaul D.K., Fabry M.E. In vivo studies of sickle red blood cells. Microcirculation. 2004;11:153–165. [PubMed] [Google Scholar]
- 32.Turhan A., Weiss L.A., et al. Frenette P.S. Primary role for adherent leukocytes in sickle cell vascular occlusion: a new paradigm. Proc. Natl. Acad. Sci. USA. 2002;99:3047–3051. doi: 10.1073/pnas.052522799. [DOI] [PMC free article] [PubMed] [Google Scholar]
- 33.Kaul D.K., Fabry M.E., Nagel R.L. Erythrocytic and vascular factors influencing the microcirculatory behavior of blood in sickle cell anemia. Ann. N. Y. Acad. Sci. 1989;565:316–326. doi: 10.1111/j.1749-6632.1989.tb24179.x. [DOI] [PubMed] [Google Scholar]
- 34.Evans E.A., Skalak R. CRC Press; Boca Raton, FL: 1980. Mechanics and Thermodynamics of Biomembranes. [Google Scholar]
- 35.Discher D.E., Boal D.H., Boey S.K. Simulations of the erythrocyte cytoskeleton at large deformation. II. Micropipette aspiration. Biophys. J. 1998;75:1584–1597. doi: 10.1016/S0006-3495(98)74076-7. [DOI] [PMC free article] [PubMed] [Google Scholar]
- 36.Dao M., Li J., Suresh S. Molecularly based analysis of deformation of spectrin network and human erythrocyte. Mater. Sci. Eng. C. 2006;26:1232–1244. [Google Scholar]
- 37.Helfrich W. Elastic properties of lipid bilayers: theory and possible experiments. Z. Naturforsch. C. 1973;28:693–703. doi: 10.1515/znc-1973-11-1209. [DOI] [PubMed] [Google Scholar]
- 38.Espanol P. Fluid particle model. Phys. Rev. E. 1998;57:2930–2948. [Google Scholar]
Associated Data
This section collects any data citations, data availability statements, or supplementary materials included in this article.