Abstract
The mechanistic relevance of intergenic disease-associated genetic loci (IDAGL) containing highly statistically significant disease-linked SNPs remains unknown. Here, we present experimental and clinical evidence supporting the importantance of the role of IDAGL in human diseases. A targeted RT-PCR screen coupled with sequencing of purified PCR products detects widespread transcription at multiple IDAGL and identifies 96 small noncoding trans-regulatory RNAs of ∼100–300 nt in length containing SNPs (snpRNAs) associated with 21 common disorders. Multiple independent lines of experimental evidence support functionality of snpRNAs by documenting their cell type-specific expression and evolutionary conservation of sequences, genomic coordinates and biological effects. Chromatin state signatures, expression profiling experiments and luciferase reporter assays demonstrate that many IDAGL are Polycomb-regulated long-range enhancers. Expression of snpRNAs in human and mouse cells markedly affects cellular behavior and induces allele-specific clinically relevant phenotypic changes: NLRP1-locus snpRNAs rs2670660 exert regulatory effects on monocyte/macrophage transdifferentiation, induce prostate cancer (PC) susceptibility snpRNAs and transform low-malignancy hormone-dependent human PC cells into highly malignant androgen-independent PC. Q-PCR analysis and luciferase reporter assays demonstrate that snpRNA sequences represent allele-specific “decoy” targets of microRNAs that function as SNP allele-specific modifiers of microRNA expression and activity. We demonstrate that trans-acting RNA molecules facilitating resistance to androgen depletion (RAD) in vitro and castration-resistant phenotype (CRP) in vivo of PC contain intergenic 8q24-locus SNP variants (rs1447295; rs16901979; rs6983267) that were recently linked with increased risk of PC. Q-PCR analysis of clinical samples reveals markedly increased and highly concordant (r = 0.896; p < 0.0001) snpRNA expression levels in tumor tissues compared with the adjacent normal prostate [122-fold and 45-fold in Gleason 7 tumors (p = 0.03); 370-fold and 127-fold in Gleason 8 tumors (p = 0.0001) for NLRP1-locus and 8q24-locus snpRNAs, respectively]. Our experiments indicate that RAD and CR phenotype of human PC cells can be triggered by ncRNA molecules transcribed from the NLRP1-locus intergenic enhancer at 17p13 and by downstream activation of the 8q24-locus snpRNAs. Our results define the IDAGL at 17p13 and 8q24 as candidate regulatory loci of RAD and CR phenotypes of PC, reveal previously unknown molecular links between the innate immunity/inflammasome system and development of hormone-independent PC and identify novel molecular and genetic targets with diagnostic and therapeutic potentials, exploration of which should be highly beneficial for personalized clinical management of PC.
Key words: SNP, prostate cancer, rs16901979, rs2670660, snpRNA, NLRP1, innate immunity, microRNA, apoptosis, castration resistance
Introduction
Meta-analysis of genomic coordinates of nearly 800 significant SNP phenotype associations (p < 5 × 10⁻⁸) identified in nearly 600 genome-wide association studies (GWAS) of 150 distinct diseases and traits demonstrates that only 12% of disease-linked SNPs identified to date are located within exons of protein-coding genes (or occur in tight linkage disequilibrium with protein-coding regions of genes), and a vast majority (80%) of variations occurs within non-protein-coding sequences.1 These findings are particularly striking, because SNPs in protein-coding regions are heavily over-represented on genotyping arrays,2,3 which further highlights the significant knowledge gap in our understanding the role of intronic and intergenic sequences in regulation of phenotypes. Intergenic SNPs, which are located in genomic regions distant from known protein-coding genes and microRNAs, comprise ∼40% and represent the largest class of SNP variations with significant associations to multiple common human disorders.4 Recently, we reported identification of 13 intergenic small trans-regulatory RNAs (trans-RNAs) containing disease-linked SNPs and manifesting cell type-specific patterns of expression in human cells.4 Functional analysis of one of these trans-RNAs (rs2670660), which are transcribed from the intergenic sequence located in the 17p13 region at ∼30 kb distance from the NLRP1 gene and termed NLRP1-locus snpRNA, demonstrates SNP allele-specific biological effects of trans-RNAs on cell cycle progression, differentiation and gene expression in human cells.4 These initial observations indicate that intergenic disease-associated genetic loci (IDAGL) are transcriptionally active and may influence the biological behavior of human cells via noncoding RNA intermediaries.
Several independent GWAS identified prostate cancer susceptibility SNPs within the 8q24 gene desert,5–12 which were subsequently classified into three adjacent genomic regions of increased risk for prostate cancer.13 These regions contain multiple prostate cancer risk SNPs with the most significant convincingly replicated SNPs being rs1447295 in region 1, rs16901979 in region 2 and rs6983267 in region 3.13 Consistent with the hypothesis of biological significance of IDAGL, several groups reported that multiple long-range enhancers are present within genetically defined prostate cancer risk regions of the 8q24 gene desert14–18 and demonstrated functional correlations of enhancer's activity with prostate cancer risk SNP sequences.
In this work, we report sequences of 96 snpRNAs transcribed from IDAGL that were discovered in GWAS and linkage studies of common human disorders and replicated in independent cohorts of patients (Supplemental refs. 1–43). Functional analyses of snpRNAs associated with prostate cancer reveal novel genome-wide trans-regulatory networks of noncoding snpRNAs that are transcribed from long-range enhancers and facilitate development of a castration-resistant phenotype of human prostate cancer. Expression level of 8q24-locus prostate cancer (PC) susceptibility snpRNAs is regulated by NLRP1-locus snpRNAs (rs2670660), which are transcribed from the intergenic long-range enhancer sequence located in the 17p13 region at ∼30 kb distance from the NLRP1 gene. Highly concordant expression profiles of the NLRP1-locus snpRNAs and 8q24 snpRNAs (r = 0.896; p < 0.0001) in clinical PC samples and experimental evidence of trans-regulatory effects of NLRP1-locus snpRNAs on expression of 8q24-locus snpRNAs indicate that resistance to androgen depletion (RAD) in vitro and thecastration resistance (CR) phenotype in vivo of human PC cells can be triggered by noncoding (nc) RNA molecules transcribed from the NLRP1-locus intergenic enhancer and downstream activation of the 8q24-locus snpRNAs. Our experiments indicate that activation of the NLRP1-locus snpRNA/miR-205 axis may contribute to development of clinically significant prostate cancer by reducing expression of the PTEN tumor suppressor.
Results
IDAGL generate evolutionarily conserved small noncoding snpRNAs and display common chromatin state signatures.
To date, we analyzed 109 IDAGL using a targeted RT-PCR-based screening protocol that is designed for identification of RNA molecules containing disease-associated SNP sequences.4 We identified 96 trans-regulatory RNAs (snpRNAs) 100 to 300 nucleotides in length containing intergenic SNPs that are associated with 21 common human disorders (Tables S1–9). Molecular identities of discovered RNA molecules were established based on a requirement of reverse transcription for detection of expected size PCR products and confirmed by size correspondence, sensitivity to RNase treatment and resistance to DNase treatment of primary PCR products and nested PCR products, which were derived from second round of amplification of purified primary PCR products. In all instances, molecular identities of discovered RNA molecules were validated by direct sequencing of purified primary PCR products (Tables S6–9).
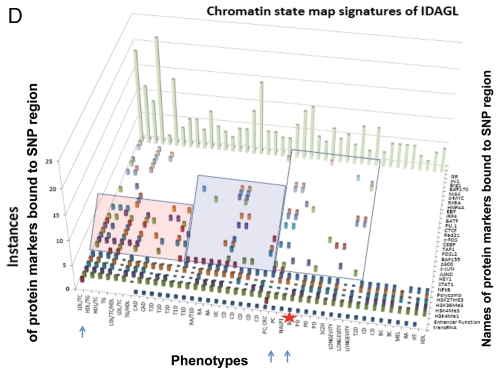
Considering the evidence of evolutionary conservation as one of the important criteria supporting the hypothesis of functionality of discovered snpRNA molecules, we analyzed a set of 13 IDAGL that generate evolutionarily conserved snpRNAs. Notably, 9 of 13 (70%) evolutionarily conserved intergenic sequences manifest common genomic topologies in the mouse and human genomes; that is, snpRNA-encoding sequences in both species have the same flanking protein-coding genes (Fig. S1). We made use of the extensive genome-wide chromatin domain maps19,20 to assess the chromatin state of evolutionarily conserved IDAGL. This analysis reveals a consensus chromatin signature of evolutionarily conserved snpRNA-encoding IDAGL comprising H3K27Me3, CBP/CREB and POL2 proteins (Fig. S2), which indicate that IDAGL may represent a distinct class of Polycomb-regulated enhancers. Consistent with this notion, many evolutionarily conserved snpRNA-encoding IDAGL display enhancer's signature H3K4me1 histone marks (Fig. S2), whereas histones H3K4Me3 and H3K36Me3, which represent chromatin signatures of promoters and transcriptionally active sites,21–23 appear less frequently. We confirmed the validity of these findings for both evolutionary-conserved and non-conserved IDAGL by performing the analysis of the chromatin state maps of IDAGL in human embryonic stem cells, ESC (Figs. S1–3 and Table S10). Based on this analysis, we concluded that the nearly ubiquitous chromatin state signature of IDAGL in human ESC consists of histone H3K27me3 and Ezh2 protein (Figs. S2 and S3). In addition to consensus components, the IDAGL chromatin maps display clearly discernable disorder type-specific protein marks that manifest common association patterns for pathogenetically- and epidemiologically related disease phenotypes (Fig. S4 and Table S10). Analysis of ENCODE chromatin state maps in nine human cell lines validates this conclusion and reveals a consensus chromatin signature of IDAGL comprising H3K27Me3 and H3K4Me1 histones, Ezh2 and disease-state-specific parts of transcription factors (genome.ucsc.edu/ENCODE).
Expression of NLRP1-locus snpRNAs induces clinically relevant phenotypic changes in human cells.
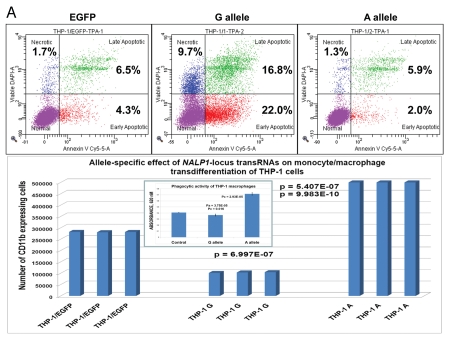
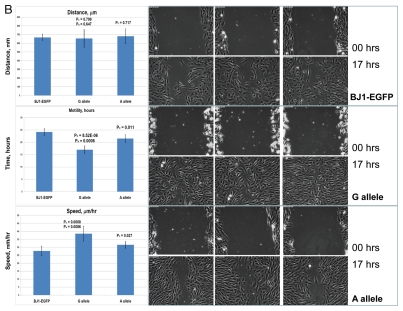
Given that SNP phenotype associations can result from tagging and may, therefore, not necessarily indicate the true causal relationships, we thought to undertake the functional analysis of selected snpRNAs to show that snpRNA-mediated phenotype-altering effects on cellular behavior reflect their role in diseases. Functional analysis of human cell lines engineered to constitutively express distinct allelic variants of NLRP1-locus snpRNAs revealed marked changes of biological behavior of cells expressing disease-associated allelic variants of snpRNAs that are consistent with targeted alterations of cell cycle progression/differentiation pathways.4 To ascertain whether changes of cellular functions caused by forced expression of NLRP1-locus snpRNAs are consistent with their suspected role in diseases, we analyzed monocyte/macrophage transdifferentiation of human THP-1 cells constitutively expressing 52 nt NLRP1-locus snpRNAs containing either ancestral, major A allele or disease-linked, minor G allele (Fig. 1). We found that G allele-expressing THP-1 cells, in contrast to control or A allele-expressing cells, undergo massive apoptosis during the differentiation process and are capable of generating 5-fold less macrophages compared with A allele-expressing cells (Fig. 1A). Expression of snpRNAs containing ancestral A allele confers protection against apoptosis and facilitates production of nearly 2-fold more macrophages compared with control cells (Fig. 1A). Notably, macrophages derived from A allele-expressing THP-1 cells manifest significantly more potent phagocytic activity compared with control cells or macrophages derived from G allele-expressing THP-1 cells (Fig. 1A, inset). These phenotypic changes are not due to the generally diminished cellular functions, because G allele-expressing cells manifest a sustained long-term viability in optimal growth conditions and have significantly higher motility compared with the control cultures and A allele-expressing cells (Fig. 1B).
Figure 1.
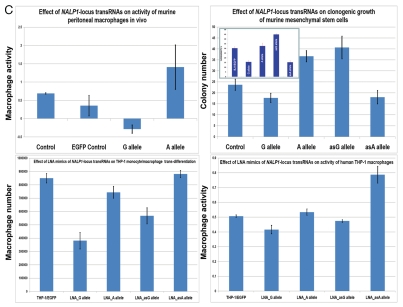
Constitutive expression of distinct allelic variants of NLRP1-locus snpRNAs exerts allele-specific clinically relevant effects on phenotypes of human cells. (A) THP-1 cells were engineered to stably express distinct allelic variants of the NLRP1-locus snpRNAs and induced to differentiate into macrophages. Efficiency of the monocyte/macrophage transdifferentiation was assessed by analysis of viable and apoptotic cells (top parts) and measurements of the number (bottom parts) and phagocytic activity (inset, bottom part) of macrophages. Note that in response to induction of differentiation, THP-1 cells expressing pathology-linked G-allele snpRNAs undergo massive apoptosis and produce ∼5-fold less macrophages that are twice less potent in the sheep erythrocyte phagocytosis assay compared with macrophages derived from THP-1 cells expressing ancestral A-allele snpRNAs. Pathology-linked G allele-expressing human fibroblast BJ1 cells manifest significantly higher motility compared with ancestral A allele-expressing BJ1 cells. Gaps of defined distances were created in confluent cultures of BJ1 cells, and motility sequences were continuously monitored and recorded using time-lapse video cinematography. For each culture, the initial distance, motility sequence time (time to complete closing of the gap) and motility speed were measured. Average values of six replicate measurements are reported. Human NLRP1-locus snpRNAs manifest allele-specific biological activities in mouse macrophages (top left set of bar graphs) and mouse mesenchymal cells (top right set of bar graphs; inset shows results of the similar assay in human mesenchymal cells), which recapitulate the corresponding allele-specific biological activities in human cells. Bottom set of bar graphs shows the biological activities of synthetic 19 nt LNA-oligonucleotide-based structural analogs of the allele-specific variants of NLRP1-locus snpRNAs, which were assessed using THP-1 monocyte/macrophages transdiferentiation assays. Note that synthetic LNA analogs recapitulate the allele-specific patterns of NLRP1-locus snpRNA bioactivities mimicking effects on macrophage numbers (left) and phagocytic activity (right).
Next, we thought to determine whether the evolutionary conservation of NLRP1-locus snpRNAs is sufficient to facilitate the similar biological effects on mouse cells. We found that human NLRP1-locus snpRNAs exert biological effects on mouse macrophages and mesenchymal cells that are strikingly similar to those documented for human cells (Fig. 1C, top parts). Furthermore, the allele-specific biological effects of forced expression NLRP1-locus snpRNAs mediated by the lentiviral gene transfer can be readily reproduced by transfection of synthetic LNA oligonucleotide analogs of snpRNA molecules (Fig. 1C, bottom parts). Based on these observations, we conclude that substitution of a single nucleotide in snpRNA molecules may cause dramatic alterations of cell fate and result in marked changes of cellular phenotypes of potential clinical relevance.
>NLRP1-locus snpRNAs transform low-malignancy, hormone-dependent human PC cells into highly malignant, castration-resistant PC by inducing 8q24-locus PCS-snpRNAs.
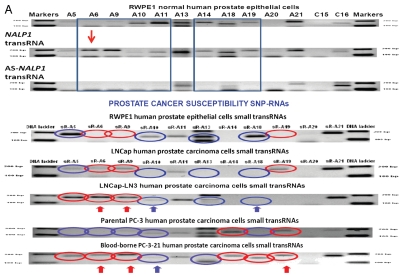
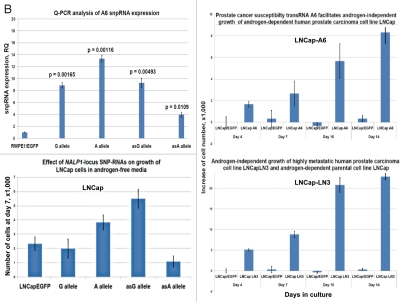
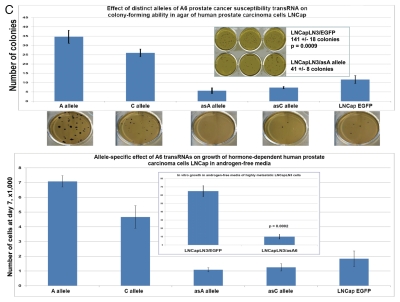
Q-RT-PCR expression profiling experiments reveal that NLRP1-locus snpRNAs markedly alter the expression of prostate cancer susceptibility (PCS) snpRNAs in human cells (Fig. 2), which suggests that extensive phenotypically relevant regulatory crosstalk may exist between distinct classes of snpRNAs. We noted particularly interesting patterns of association between expression of NLRP1-locus snpRNAs and 8q24-locus PCS-snpRNAs A6, expression of which appears elevated in highly metastatic variants of human prostate cancer cell lines as well as prostate cancer cell lines selected for growth in androgen-free media (Fig. 2). To confirm that observations of clinically relevant biological effects of IDAGL snpRNAs are not limited to the NLRP1-locus snpRNAs, we analyzed the effect of forced expression of distinct allelic variants of PCS-snpRNAs on behavior of hormone-dependent human prostate carcinoma cell line LNCap cultured under various growth conditions. We found that expression of both NLRP1-locus and PCS-snpRNAs have no effect on growth of LNCap cells in adherent cultures (data not shown), whereas the anchorage-independent growth potential of LNCap cells in agar was markedly enhanced by PCS-snpRNAs A6, which was more significant for PCS-snpRNAs containing the prostate cancer susceptibility allele (Fig. 2C). Human prostate carcinoma LNCap cells are hormone-dependent and are not capable of growing in androgen-free media (Fig. 2C). Intriguingly, when we cultured LNCap cells engineered to stably express snpRNAs in androgen-free conditions, we found that expression of either NLRP1-locus snpRNAs or PCS-snpRNAs A6 facilitates hormone depletion-independent growth of LNCap cells (Fig. 2C).
Figure 2.
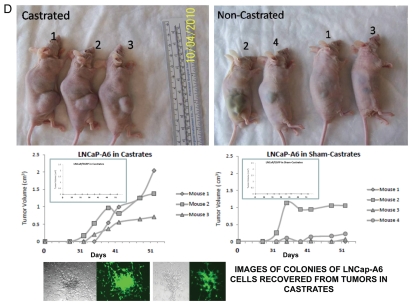
Expression of PCS-snpRNAs induces resistance to androgen depletion (RAD) and castration-resistant (CR) phenotypes of human prostate cancer. Expression of 8q24 PCS-snpRNAs (red arrows) is induced by NLRP1-locus snpRNAs (top gel image) and is increased in highly metastatic PC cells and circulating tumor cells (CTC) from orthotopic human PC xenografts (bottom gel images). Prostate cancer susceptibility snpRNAs A6 (rs16901979) manifest increased expression in highly metastatic human prostate carcinoma cells (LNCapLN3, PC321) and assert biologically and clinically relevant effects on growth of hormone-dependent human prostate carcinoma cells LNCap. RT-PCR analysis demonstrates low expression of prostate cancer susceptibility snpRNAs A6 in normal human prostate epithelial cells RWPE1 and markedly higher expression level in LNCapLN3 cells, which were selected in vivo for increased metastatic potential by serial orthotopic implantation of parental, poorly metastatic LNCap cells. Similarly, expression of multiple PCS-snpRNAs is elevated in blood-borne human prostate carcinoma metastasis precursor cells PC-3-21 compared with the parental cell line PC-3. p values of the two-tailed t-tests between corresponding experimental settings and control experiments are shown (Fig. 2B). Hormone-dependent human prostate carcinoma LNCap cells engineered to stably express the prostate cancer susceptibility snpRNA A6 acquired the ability to survive and grow in androgen-depleted media (set of bars in the top right part). Note that growth patterns in androgen-depleted media of LNCap cells expressing prostate cancer susceptibility snpRNA allele became similar to highly metastatic LNCapLN3 cells (set of bars in the bottom right part). Set of bars in the bottom left part shows the increased survival and growth in androgen-depleted media of LNCap cells constitutively expressing A alleles of NLRP1-locus snpRNAs. Set of bars in the top left part shows the results of the Q-PCR analysis of the expression of PCS-snpRNA A6 in RWPE1 normal prostate epithelial cells engineered to stably express distinct allelic variants of the NLRP1-locus snpRNAs. Hormone-dependent human prostate carcinoma LNCap cells engineered to stably express the prostate cancer susceptibility snpRNA A6 acquired markedly higher anchorage-independent clonogenic growth potential in agar (top) and the ability to survive and grow in androgen-depleted media (bottom). Note that growth potentials in both agar cultures and androgen-free media of LNCap cells expressing prostate cancer susceptibility A allele of snpRNA A6 are significantly higher compared with LNCap cells expressing ancestral C allele. Transfection of antisense alleles of PCS-SNP RNA A6 (asA6) diminishes clonogenic growth in agar (inset in top figure) and survival and growth in androgen-depleted media of highly metastatic LNCapLN3 human prostate carcinoma cells (inset in bottom figure). Inoculation of hormone-dependent, low-malignancy human prostate carcinoma LNCap cells engineered to stably express prostate cancer susceptibility snpRNA A6 (LNCap-A6 cells) induces rapidly growing tumors in castrated mice (left). Note that tumors in castrates appear to grow faster be larger and compared with the sham-operated mice (right). No tumors were detected in either castrate or sham-operated groups within the indicated observation periods after inoculation of parental or control-transfected LNCap (insets). Bottom set of figures show images of cultured in vitro in androgen-depleted media of LNCap-A6 cells that were recovered from tumors in castrated mice.
Highly metastatic LNCapLN3 cells that were selected for increased metastatic potential by serial orthotopic re-implantation after recovery from metastatic lesions acquire markedly increased ability to grow in agar and in androgen-depleted media (Fig. 2C, insets). RT-PCR expression profiling analysis reveals that LNCapLN3 cells manifest markedly higher expression level of the PCS-snpRNA A6 (Fig. 2A). To determine whether altered grow properties of the highly metastatic LNCaLN3 cells are associated with increased expression of PCS-snpRNA A6, we engineered LNCapLN3 cell variants stably expressing antisense variants of the PCS-snpRNA A6 (AS-PCS-snpRNA A6). We found that expression of AS-PCS-snpRNA A6 did not affect growth of adherent cultures of LNCapLN3 cells in complete media (data not shown). In contrast, expression of AS-PCS-snpRNA A6 markedly diminishes growth of LNCapLN3 cells in agar cultures and in androgen-depleted media (Fig. 2C, insets).
Parental LNCap cells are poorly tumorigenic in vivo and are not capable of forming tumors in castrated mice. Remarkably, when we inoculated LNCap cells engineered to stably express PCS-snpRNAs A6 (LNCap-A6 cells), all castrated mice developed rapidly growing, large tumors (Fig. 2D), which appear to grow faster in castrated animals compared with sham-operated controls. As expected, no tumors were detected in castrated mice after inoculation of parental or control-transfected LNCap cells. These experiments demonstrate that stable expression of PCS-snpRNA A6 in low-malignancy, hormone-dependent human prostate carcinoma cells confers castration-resistant phenotype and facilitates androgen depletion-independent growth.
Q-PCR analysis reveals markedly increased levels of NLRP1-locus snpRNAs and 8q24-locus PCS-snpRNAs in tumor tissue samples from prostate cancer patients diagnosed with clinically significant early-stage disease.
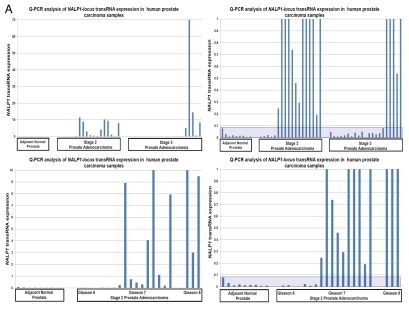
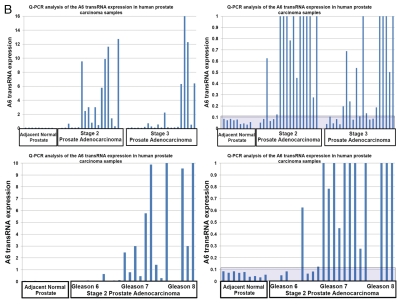
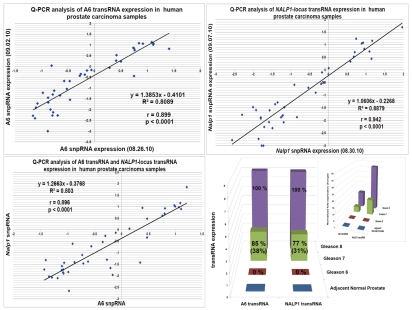
To facilitate evaluation of the clinical significance of discovered RNA molecules, we developed and validated a Q-PCR-based method of quantitative analysis of snpRNA expression. Our Q-PCR method of snpRNA expression demonstrates excellent reproducibility for both NLRP1-locus snpRNAs (r2 = 0.888 for technical replicates) and 8q24-locus snpRNAs (r2 = 0.808 for technical replicates) and > 8,000-fold dynamic range of detection's sensitivity in 3–5 ng of cDNA (Fig. 3C). snpRNAs expression analysis in clinical PC samples reveals markedly increased snpRNA expression levels in tumor tissues compared with the adjacent normal prostate (Fig. 3A and B). Notably higher expression levels of snpRNAs in human prostate adenocarcinoma samples and apparent association of increased snpRNA expression with pathohistological features of clinically significant disease [122-fold and 45-fold in stage 2, Gleason 7 tumors (p = 0.03); 370-fold and 127-fold in stage 2, Gleason 8 tumors (p = 0.0001) for NLRP1-locus and 8q24-locus snpRNAs, respectively; Fig. 3C] underscore potential translational relevance of our findings. Unexpectedly, we found a remarkably high correlation (r = 0.896; p < 0.0001) of expression levels of the NLRP1-locus snpRNAs and 8q24 RAD-locus snpRNAs (r2 = 0.803) in clinical PC samples (Fig. 3C). We conclude that Q-PCR analysis of clinical samples reveals pathophisiological relevance of discovered snpRNA molecules by demonstrating (1) markedly increased expression levels in prostate cancer; (2) association of increased expression levels with pathohistological features of the clinically aggressive disease; (3) highly concordant expression profiles of snpRNAs transcribed from genetic loci located at distinct chromosomes (17p13 and 8q24). Collectively, these data indicate the presence of a novel trans-regulatory pathway that involves increased expression of intergenic snpRNAs transcribed from 17p13 and 8q24 loci and suggest co-selection of these regulatory features in clinically significant prostate cancer. Our clinical and experimental findings, presented in Figures 2 and 3, indicate that prostate cancer cells that will emerge in individuals expressing high level of the prostate cancer susceptibility snpRNAs are more likely to acquire the intrinsic ability to grow in androgen-low or androgen-free conditions, and, therefore, this type of prostate cancer is more likely to progress early to hormone-independent, incurable metastatic disease.
Figure 3.
Increased expression of NLRP1-locus snpRNAs and PCS-snpRNA A6 in clinical prostate carcinoma samples. (A and B) Q-PCR analysis reveals markedly increased expression of NLRP1-locus snpRNAs (A) and PCS-snpRNA A6 (B) in clinical PC samples compared with adjacent normal prostate (far left set of bars in each part). Note the apparent correlation of the expression levels with the stage (top parts) and Gleason scores (bottom parts). Each data set is shown in two different scales to account for markedly distinct PCS-snpRNA expression levels in different group of samples. Each bar shows the actin-normalized value of the expression level of corresponding snpRNAs in samples from individual patients as determined by the Q-PCR analysis. Shaded areas highlight the thresholds of expression levels exceeding 99% confidence intervals defined by the expression levels in adjacent normal prostate samples. Forty-eight pathologist-verified clinical samples of the OriGene TissueScan Cancer qPCR Arrays Prostate Cancer Part III were analyzed in accordance with the supplier's protocols. QC data, pathology reports and associated clinical information are available at www.origene.com/qPCR/Tissue-qPCR-Arrays.aspx. Correlation plots and linear regression analyses documenting reproducibility of technical replicates of the Q-PCR analysis of the expression levels of PCS-snpRNA A6 (top left: r = 0.899; p < 0.0001) and NLRP1-locus snpRNA (top right: r = 0.942; p < 0.0001). Bottom left figure illustrates highly significant correlation of the expression of NLRP1-locus snpRNA and PCS-snpRNA A6 in prostate tumor samples from patients diagnosed with prostate adenocarcinoma (r = 0.896; p < 0.0001). Bottom right figure shows the average expression values of the PCS-snpRNA A6 and NLRP1-locus snpRNA in adjacent normal prostate samples and prostate cancer samples from tumors with different Gleason scores. Note markedly higher average expression levels of snpRNAs in tumor samples with high Gleason scores and increasing proportion of patients in high Gleason score groups with snpRNA expression levels exceeding thresholds of 99% confidence interval defined by the expression levels in adjacent normal prostate samples. Inset illustrates these relationships within the 400x scale of fold expression changes normalized to the average expression values in adjacent normal prostate samples.
snpRNAs are products of transcriptional activity of long-range intergenic enhancers.
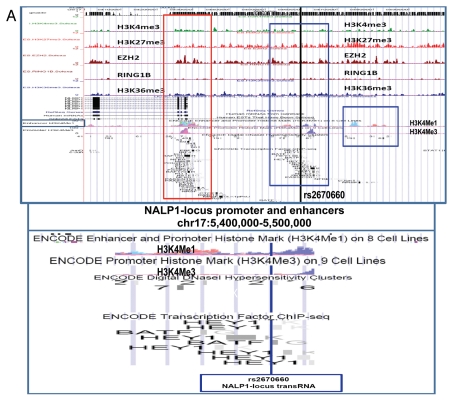
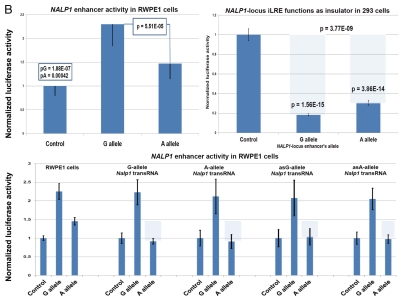
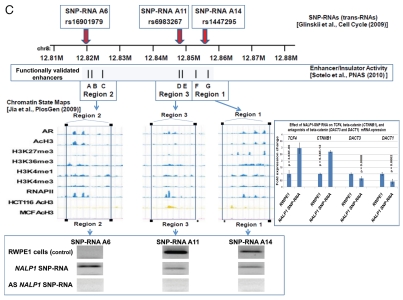
Several intergenic PC-risk SNPs were mapped to functional enhancer elements in human cells,14–18 suggesting that snpRNAs are products of transcriptional activity of long-range enhancers. Consistent with this idea, RNA polymerase II (RNAPII) binding to thousands of enhancers and widespread transcription of neuronal activity-regulated enhancers in mice has been documented recently.19 RNAPII at enhancers transcribes bi-directionally to generate small non-coding enhancer RNA (eRNAs), synthesis of which appears to require the engagement of the enhancers with promoters of target protein-coding genes.19 We thought to investigate whether the NLRP1-locus IDAGL may assert the detectable allele-specific functional effect on transcription by cloning distinct allelic variants of the chemically synthesized 2 kb NLRP1 IDAGL region into the vector containing the firefly luciferase reporter, transfecting the purified experimental and control plasmids into target cells and measuring the levels of luciferase activity. To control for transfection efficiency, the IDAGL-containing firefly luciferase reporter plasmids were co-transfected with plasmids containing a renilla luciferase reporter. We found that the presence of distinct allelic variants of IDAGL sequences significantly alter the expression of firefly luciferase (Fig. 4), which suggests that IDAGL may function as SNP allele-specific intergenic enhancers/insulators and affect the transcription of protein-coding genes. DNA/RNA complementarily rules suggest that snpRNAs may affect the activity of corresponding enhancer elements. Consistent with this idea, both enhancer and insulator activities of the NLRP1-locus IDAGL are regulated by NLRP1-locus snpRNAs (Fig. 4). The enhancer/insulator functions of IDAGL/snpRNA feedback regulatory loops appear specific, because they are dependent on the SNP allele status of both DNA and RNA sequences (Fig. 4 and data not shown). Collectively, results of Chip-seq experiments and luciferase reporter assays are consistent with the hypothesis that many snpRNAs are products of transcriptional activity of intergenic long-range enhancers.
Figure 4.
Identification and characterization of genomic trans-regulatory domains (GTRDs) that are located in intergenic disease-associated genetic loci (IDAGL), manifest enhancer/insulator activities and transcribe biologically active snpRNAs. Examples of the chromatin state map analysis of the intergenic disease-associated genomic region transcribing NLRP1-locus snpRNA rs2670660. Boxed areas depict the locations of the NLRP1 promoter (red box) and two intergenic enhancers (blue boxes), one of which is characterized in this study and shown at higher resolution in the bottom figure. Positions of disease-linked SNP nucleotides within snpRNA-encoding sequences are indicated by vertical lines. Chromatin state maps of individual snpRNA-encoding genomic sequences in human embryonic stem cells are visualized using the custom tracks of the UCSC Genome Browser (genome.ucsc.edu/ENCODE/). Color-coded horizontal lines depict alignments of DNA sequences derived from Chip-Seq experiments using antibodies against corresponding proteins. Individual zoom-in chromatin state maps aligned to corresponding snpRNA-encoding sequences are shown with the corresponding disease-linked SNPs (Figs. S2–4). Original experiments describing the corresponding mouse and human genome-wide chromatin state maps were reported in reference 20. Luciferase reported assay reveals allele-specific enhancer/insulator activities of the 2 kb intergenic DNA sequence containing distinct allelic variants of the rs2670660 NLRP1-locus SNP. Luciferase reporter assay to assess the enhancer activity of 2 kb NLRP1-locus intergenic region was performed in RWPE1 (set of bars in left top part) and HEK293 set of (set of bars in the right top part) cells transiently expressing either control luciferase reporter plasmids or plasmids containing chemically synthesized 2 kb sequences flanking distinct allelic variants of the NLRP1-locus integenic SNP rs2670660, which is positioned exactly in the middle of the enhancer's sequence. Note decreased enhancer's and insulator's activities in ancestral A allele constructs compared with pathology-linked G allele constructs. Bottom parts of bars show the effects of NLRP1-locus snpRNAs on enhancer and insulator activities in RWPE1 cells. Note that distinct alleles of the NLRP1-locus intergenic enhancer manifest different responses to the NLRP1-locus snpRNAs and enhancer's activities in ancestral A allele constructs are completely blocked compared with pathology-linked G allele constructs. Molecular anatomy of the network of intergenic long-range enhancers (iLRE s) and snpRNAs facilitating castration-resistant phenotype of human prostate cancer. NLRP1-locus snpRNAs, which are transcribed from the intergenic long-range enhancer sequence located in the 17p13 region at ∼30 kb distance from the NLRP1 gene, regulate expression level of 8q24-locus PC susceptibility snpRNAs (bottom gel images and Fig. 2), which are transcribed from intergenic enhancers located in the prostate cancer susceptibility regions 1, 2 and 3 (middle). Activity of the iLRE containing PCS SNP rs6983267 is increased 15–20-fold by the co-transfection of β-catenin/TCF4 transcription factors, expression of which is significantly elevated in RWPE1 cells engineered to constitutively express NLRP1-locus snpRNAs (sets of bars in inset). In contrast, expression of antagonists of β-catenin, DACT3 and DACT1 is decreased in NLRP1-locus snpRNA-expressing cells. References to the original publications reporting chromatin state maps, activity of intergenic enhancers and identification of trans-regualtory snpRNAs of the 8q24 prostate cancer susceptibility regions 1, 2 and 3 are indicated and discussed in the main text. Graphical representations of the reported in Table S10 and Figure S4 chromatin state maps of 43 IDAGLs. Areas highlighted in red and blue indicate disease type-specific transcription factor signatures that appear associated with sets of pathogenetically- and/or epidemiologically related disorders. Each column represents the individual IDAGL containing an SNP associated with a particular trait or disease phenotype. Each row corresponds to the individual chromatin state marker protein. The last row shows a cumulative chromatin state score indicating how many proteins were bound in close proximity of the corresponding SNPs. Visualization tools and links to original experimental data are publicly available (http://genome.ucsc.edu/ENCODE/). Arrows indicate functionally validated enhancers. Star indicates NLRP1-locus enhancer.
NLRP1-locus snpRNAs regulate expression of 14q32 locus microRNAs.
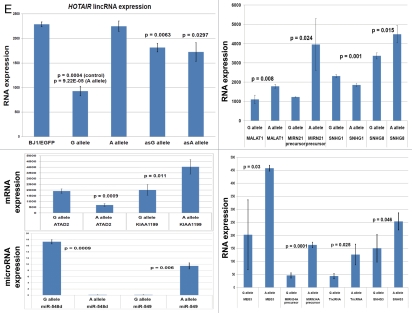
Analysis of the predicted secondary structures of identified RNA molecules reveals that one of the notable common features of snpRNAs secondary structures is the presence of loop sequences that contain SNP-bearing 8–11 nt segments identical to primary sequences of microRNAs (Fig. S5). Intergenic snpRNA sequences contain multiple potential target sites for microRNAs, which are often clustered around SNP nucleotides (Fig. S5). These data suggest that an epigenetic regulatory crosstalk between snpRNAs and microRNAs may exist with the potential downstream effect on expression of protein-coding genes. Analysis of human cell lines engineered to stably express distinct allelic variants of the NLRP1-locus snpRNAs confirmed the validity of this hypothesis.4 Expression profiling experiments identify 36 microRNAs differentially regulated in BJ1 cells expressing distinct allelic variants of the NLRP1-locus snpRNAs (Figs. 5 and S6). Analysis of genomic coordinates reveals that genes encoding 18 of 36 (50%) NLRP1-locus snpRNA-regulated microRNAs are located within ∼200 kb regions on 14q32, which is immediately adjacent to the long noncoding RNA gene, MEG3 (Figs. S6 and S7). Thus, our analysis demonstrates that principal molecular targets for allele-specific trans-regulatory actions of NLRP1-locus snpRNAs are clusters of microRNAs within a 200 kb segment of the 14q32 region, which is adjacent to the snpRNA-targeted long noncoding RNA gene, MEG3. Detailed exploration of individual snpRNA-regulated transcripts shows that expression levels of distinct classes of noncoding RNAs are significantly altered in human cells engineered to stably express NLRP1-locus snpRNAs (Figs. 5E and S6). These results indicate that one of the important epigenetic features of snpRNA-mediated regulatory effects is genome-wide changes in expression of multiple diverse classes of noncoding RNAs, documented examples of which include snoRNAs and snoRNA-host genes (SNORD113; SNHG1; SNHG3; SNHG8); long noncoding RNAs (MEG3, HOTAIR, tncRNA and MALAT1); microRNAs, microRNA-precursors and protein-coding genes introns of which host microRNA genes (ATAD2; KIAA1199; Figs. 5E and S6).
Figure 5.
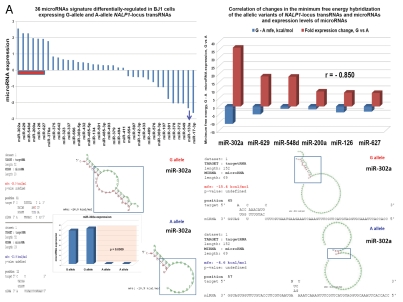
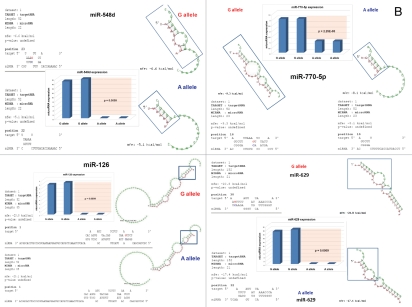
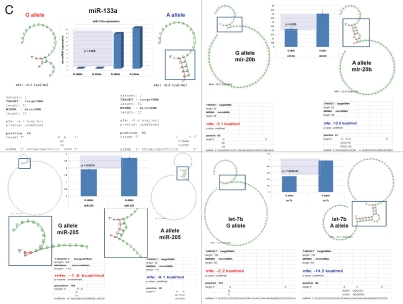
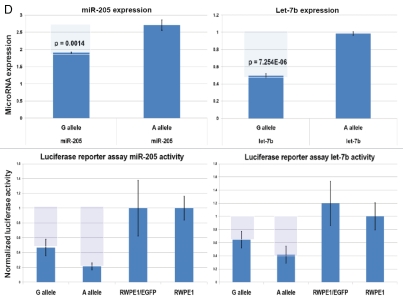
snpRNA sequences represent allele-specific “decoy” targets of microRNAs that function as SNP allele-specific enhancers of microRNA expression and activity. Experimental evidence and computational analysis supporting the allele affinity model of snpRNA-mediated regulation of microRNA expression and activity. ABI TaqMan PCR-based screen identifies a statistically significant set of 36 microRNAs, expression of which is (1) altered at least 1.5-fold in NLRP1-locus snpRNA-expressing cells compared to control BJ1/EGFP cells and (2) differentially regulated in pathology-linked G allele-expressing BJ1 cells compared to the ancestral A allele-expressing cells (set of bars in the top left panel). Note that 18 of 36 (50%) of these microRNAs are derived from the single microRNA cluster on the ∼ 200 kb continuous region of 14q32 band of chromosome 14, which suggests that 14q32 cluster microRNAs may be primary molecular targets of the NLRP1-locus snpRNAs (Fig. S6). Statistically highly significant inverse correlation between allele-specific changes in minimal free energy (mfe) of snpRNA/microRNA hybridization and experimentally defined changes of microRNA expression; that is, lower mfe values correspond to higher levels of microRNA expression (set of bars in the top right panel). Experimental evidence and computational analysis supporting the allele affinity model of snpRNA-mediated regulation of microRNA expression and activity. Expression of high affinity (low mfe) snpRNA alleles in human cells (defined by allele-specific changes in minimal free energy of snpRNA/microRNA hybridization) is associated with increase in abundance levels of corresponding microRNAs. These relationships are shown for individual microRNAs, the abundance levels of which in human cells are induced [miR-302a; miR-629; miR-548d; miR-126; miR-770-5p] by forced expression of pathology-linked G-allele snpRNAs compared to ancestral A allele-expressing cells. Inset bars show the results of Q-PCR analysis of expression of corresponding microRNAs (see additional analysis and examples in the Sup. Material and Fig. S8). Experimental evidence and computational analysis supporting the allele affinity model of snpRNA-mediated regulation of microRNA expression and activity. Expression of high affinity (low mfe) snpRNA alleles in human cells (defined by allele-specific changes in minimal free energy of snpRNA/microRNA hybridization) is associated with increase in abundance levels of corresponding microRNAs. These relationships are shown for individual microRNAs, the abundance levels of which in human cells are repressed [miR-20b; let-7b; miR-133a; miR-205] by forced expression of pathology-linked G-allele snpRNAs compared to ancestral A allele-expressing cells. Inset bars show the results of Q-PCR analysis of expression of corresponding microRNAs (see additional analysis and examples in the Sup. Material and Fig. S8). Experimental evidence and computational analysis supporting the allele affinity model of snpRNA-mediated regulation of microRNA expression and activity. Expression of NLRP1-locus snpRNAs in human cells induces allele sequence-dependent changes in expression (top sets of bars) and activity (bottom sets of bars) of microRNAs. Q-PCR measurements of the expression levels (top sets of bars) and luciferase reporter assay of miR-205 and let-7b activities (bottom sets of bars) in RWPE1 cells stably expressing distinct allelic variants of the NLRP1-locus snpRNAs demonstrate significant changes of expression and activity of both microRNAs in high-affinity (A allele) snpRNA-expressing cells compared to low affinity (G allele) snpRNA allele-expressing cells. Experimental evidence and computational analysis supporting the allele affinity model of snpRNA-mediated regulation of microRNA expression and activity. Microarray analysis of human BJ1 cells engineered to stably express distinct allelic variants of the NLRP1-locus transRNAs reveals allele-specific alterations of expression levels of multiple distinct classes of noncoding RNAs which include snoRNAs and snoRNA host genes (SNORD113; SNHG1; SNHG3; SNHG8), long noncoding RNAs (MEG3, tncRNA, HOTAIR, and MALAT1), microRNAs, microRNA precursors, and proteincoding microRNA host genes (ATAD2; KIAA1199). Note that changes of expression of intron-residing microRNAs miR-548d (intron of the ATAD2 gene) and miR-549 (intron of the KIAA1199 gene) are in good correspondence with allele-specific expression levels of corresponding microRNA host genes, which suggests a coordinated mechanism of regulation (see also Fig. S6).
Allele affinity model of snpRNA-mediated regulation of microRNA expression and activity.
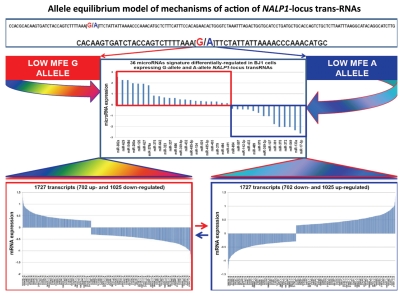
To understand the molecular basis of the regulatory crosstalk between snpRNAs and a diverse network of noncoding RNAs, we performed sequence homology profiling and structure-functional analysis of relevant molecular entities. This analysis shows that snpRNA-regulated noncoding RNAs manifest discernable homology/complementarity features of primary sequences. Notably, all 36 NLRP1-locus snpRNA-regulated microRNAs have at least one potential target site within 152 nt sequence of the NLRP1-locus snpRNA molecule, and many microRNA target sites manifest allele-associated changes of the minimal free energy (mfe) snpRNA/microRNA hybridization (Figs. 5 and S5–7). Comparisons of the allele-associated changes of the mfe values and experimentally defined changes of the microRNA expression levels reveal a highly significant inverse correlation between these two variables; that is, lower mfe values appear to correspond to higher levels of microRNA expression (Figs. 5 and S8). These results suggest a model of snpRNA-mediated regulation of microRNA expression according to which high affinity (low mfe) snpRNA alleles would facilitate increase abundance levels of corresponding microRNAs (Figs. 5 and S8).
Recent experiments demonstrate that let-7 microRNA release from complexes with Argonaute proteins and subsequent degradation can both be blocked by addition of microRNA target RNA, which results in increased let-7 microRNA levels.24 Computer modeling experiments demonstrate that let-7b microRNA follows the pattern of allele-associated mfe changes characteristic of microRNAs expression levels of which are lower in G allele-expressing cells (Figs. 5 and S6D). We reasoned that if let-7 bioactivity model is valid for snpRNA-mediated effects on microRNAs, we should be able to detect the corresponding snpRNA allele-context-specific changes of the let-7b expression and activity in NLRP1-locus snpRNA-expressing cells. Consistent with this hypothesis, Q-PCR experiments and luciferase reporter assays demonstrate that both expression and activity of the let-7 microRNA are significantly modified in RWPE1 cells genetically engineered to stably express NLRP1-locus snpRNAs (Figs. 5 and S8D). We confirmed the validity of these conclusions by documenting similar relationships between snpRNA allele-context-specific mfe changes and effects on microRNA expression and activity for miR-205 microRNA (Figs. 5 and S8D, bottom parts). Based on these observations, we propose that one of the mechanisms of snpRNA-mediated effects on microRNA-regulated processes is associated with snpRNA allele-specific changes of microRNA abundance level and activity. The underlying molecular events are likely to resemble the let-7 bioactivity model, according to which interaction of RNA molecules with microRNAs interfer with microRNA release from complexes with Argonaute proteins and prevent subsequent degradation of microRNA.24
NLRP1-locus snpRNA-regulated microRNAs recapitulate molecular features and biological phenotypes induced by snpRNAs.
Microarray analysis demonstrates that epigenetic reprogramming of human cells following activation of the NLRP1-locus snpRNA-regulated network of noncoding RNAs involves thousand's of downstream protein-coding targets, including 586 transcripts encoded by Polycomb-regulated bivalent chromatin domain genes4 and 209 mRNAs encoded by human homologs of mouse genes flanking intergenic enhancers (data not shown). Collectively, these results as well as functional data support the model of sequential regulatory pathway of NLRP1-locus snpRNAs > microRNAs > protein-coding transcripts. Further analysis of the regulatory circuitries of this network reveals markedly altered expression of prostate susceptibility snpRNAs in cell lines genetically engineered to stably express either NLRP1-locus snpRNAs or snpRNA-regulated microRNAs (Figs. 2A, 2B and S8). Results of these experiments demonstrate that:
Constitutive expression of NLRP1-locus snpRNAs enhances expression levels of several microRNAs (Figs. 5, S8–10) and induces expression of prostate cancer susceptibility snpRNAs (Figs. 2 and S8);
Expression of cancer susceptibility snpRNAs is similarly induced in cells engineered to overexpress either NLRP1-locus snpRNAs or snpRNA-regulated microRNAs (Fig. S8 and 9);
Forced expression of selected snpRNA-regulated microRNAs recapitulate snpRNA-induced phenotypic changes in human cells, such as the increased propensity for anchorageindependent growth in agar and enhanced clonogenic growth potential (Figs. 6 and S9 and 10);
Microarray analysis of protein-coding transcripts in human cells engineered to overexpress either NLRP1-locus snpRNAs or snpRNA-regulated microRNAs identifies common gene expression signatures (GES), expression profiles of which distinguishes highly metastatic human prostate carcinoma cell lines vs. parental counterparts (Fig. 6), clinical samples of distant metastatic lesions vs. primary prostate tumors (Fig. 6) and prostate cancer patients with significantly distinct likelihood of therapy failure after radical prostatectomy (Fig. 6).
Figure 6.
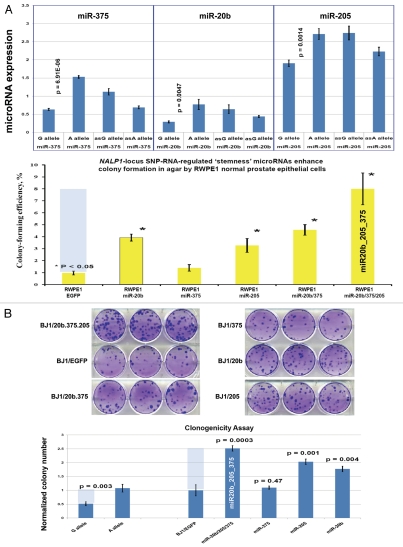
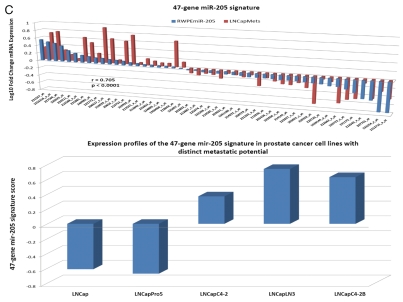
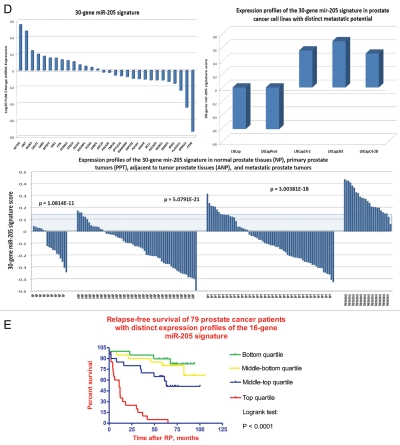
Regulatory crosstalk between NLRP1-locus snpRNAs, 8q24-locus PCS-snpRNAs and snpRNA-regulated microRNAs induces similar clinically relevant phenotypes in human cells. (A) Q-PCR analysis of microRNA expression in human cells engineered to constitutively express NLRP1-locus snpRNAs identifies concordant SNP allele-sequence-specific changes of expression levels of three microRNAs, miR-375, miR-20b, miR-205, expression of which increased in human embryonic stem cells and blood-borne human prostate carcinoma metastasis precursor cells (Fig. S10). Human cell lines engineered to constitutively express NLRP1-locus snpRNAs manifest altered expression profiles of PCS-snpRNAs (Fig. 2; induced PCS-snpRNAs are marked with red arrows) and expression levels of three stemness microRNA (miR-375, miR-20b, miR-205). Human cells engineered to constitutively express NLRP1-locus snpRNA-regulated stemness microRNAs (miR-375, miR-20b, miR-205) manifest dramatic changes of anchorage-independent growth in agar [RWPE1 cells; (A, bottom part)] and clonogenic growth potential in clonogenicity assays [BJ1 cells; (B)]. These microRNA-induced phenotypic changes recapitulate phenotypes of human cells engineered to constitutively express NLRP1-locus snpRNAs and PCS-snpRNAs (Figs. 1, 2 and S9 and ref. 4). Microarray expression profiling experiments identify a set of 47 transcripts manifesting highly concordant expression profiles (r = 0.705; p < 0.0001) in RWPE1 human prostate epithelial cells engineered to stably express either microRNA miR-205 or NLRP1-locus snpRNAs in blood-borne human prostate carcinoma metastasis precursor cells of PC3 lineage and in highly metastatic variants (LNCapLN3; LNCap-C4-2; LNCap-C4-2B) of LNCap lineage (C). Microarray analysis reveals activation of snpRNAs/miR-205 axis in human prostate cancer. (D) Refinement of the 47-transcript signature to yield individual Pearson correlation coefficients > 0.5 in highly metastatic cell lines and < −0.6 in parental and less metastatic variant LNCapPro5 (top sets of bars) generates the 30-gene expression signature, which signifies highly concordant expression profiles in clinical samples of distant metastatic lesions (bottom sets of bars) compared with normal prostate samples (p = 1.1E-11), histologically normal prostate tissue samples adjacent to tumors (p = 5.1E-21) and primary prostate tumors (p = 3.0E-18). Multivariate Cox regression analysis of the 30 genes comprising the miR-205 signature identifies a highly significant 16-gene therapy failure prediction model (Chi Square = 47.1919; p = 0.0001); Kaplan-Meyer analysis of clinical samples from 79 prostate cancer patients with known clinical outcomes after radical prostatectomy39,41 using weighted survival prediction algorithm39 demonstrates that patients with distinct expression profiles of the 16-gene miR-205 signature have statistically distinct probability of therapy failure [Log rank test: Chi Square = 64.67; p < 0.0001; (E)]. Note that all patients (100%) in the top quartile failed therapy; in contrast, only 16% of patients in the bottom quartile failed therapy within 5 y after radical prostatectomy.
Interestingly, forced expression of miR-205 recapitulates many molecular, phenotypic and clinical features associated with expression of NLRP1-locus snpRNAs (Fig. 6), including markedly decreased expression of the PTEN tumor suppressor. These data in conjunction with the experimental evidence of NLRP1-locus snpRNA-induced expression and activity of miR-205 in human cells (Fig. 5) indicate that activation of the NLRP1-locus snpRNA/miR-205 axis may contribute to development of clinically significant prostate cancer.
Discussion
GWAS identify highly significant SNP phenotype associations (p < 5 × 10⁻⁸), the vast majority of which (80%) occur within non-protein-coding sequences.1 These consistent and reproducible findings highlight a major knowledge gap in our understanding of phenotype-defining functions of human genome segments lacking protein-coding potentials. Our experiments reveal widespread transcription at IDAGL, raising the possibility that non-protein-coding RNA molecules may play an important role in predisposition to multiple common human disorders. We demonstrate that forced expression of 52 nt snpRNAs imposes a castration-resistant phenotype on human prostate carcinoma cells. It transforms low-malignancy, hormone-dependent human prostate cancer cells into highly malignant, androgen depletion-independent prostate cancer. To facilitate the assessment of clinical significance of discovered snpRNAs, we developed Q-PCR methods of quantitative analysis of snpRNAs and validated its utility by analysis of snpRNA expression in clinical samples. Our analysis reveals markedly elevated snpRNA expression levels in prostate cancer tissues compared with the adjacent normal prostate (Fig. 3). Notably higher expression levels of snpRNAs in human prostate adenocarcinoma samples and apparent association of increased snpRNA expression with pathohistological features of clinically significant disease (high Gleason score) highlight potential translational relevance of our findings. Collectively, our data imply that prostate cancer cells that emerge in individuals expressing high levels of the prostate cancer susceptibility snpRNAs are more likely to progress early to hormone-independent, incurable, metastatic disease. Our work defines the intergenic 8q24 region as RAD-regulatory locus of critical significance for human prostate cancer, reveals previously unknown molecular links between the innate immunity/inflammasome system and development of hormone-independent PC and identifies novel diagnostic and therapeutic targets successful validation of which should be highly beneficial for clinical management of prostate cancer patients.
Our experiments demonstrate that IDAGLs represent multifunctional genomic trans-regulatory domains possessing a broad range of intrinsic regulatory functions that are mediated by both DNA sequences and transcribed RNA molecules. Many IDAGLs harbor a consensus chromatin signature comprising H3K27Me3 and H3K4Me1 histones, Ezh2 and disease-state-specific parts of transcription factors. IDAGL's functions as cell type-specific, long-range enhancers or insulators appear dependent on the allelic status of a disease-linked SNP and are regulated by snpRNAs. Our experiments indicate that microRNAs that have complementary sequences in corresponding snpRNAs may constitute one of the primary targets of snpRNA-induced genomewide epigenetic regulatory networks, engagement of which is triggered by distinctive single-base-level molecular recognition events (Figs. 7 and S8). Altered microRNA expression and activity would facilitate an epigenetic amplification of a single-base-driven regulatory event by inducing downstream mRNA expression changes of many (perhaps, thousands) protein-coding genes which would ultimately cause clinically significant alterations of cellular functions. Examples of experimentally identified components of such a regulatory network are key inflammasome/innate immunity pathway-related genetic targets.4 In agreement with this mechanism, we found markedly altered expression of prostate cancer susceptibility snpRNAs in cell lines genetically engineered to stably express either NLRP1-locus snpRNAs or snpRNA-regulated microRNAs (Figs. 2 and S8). Further, our data suggest that microRNAs may contribute to biogenesis of snpRNAs by guiding Argonaute family endonucleases to execute a sequence-specific cleavage of snpRNAs and putative small snpRNA-precursors, long noncoding snpRNAs. Consistently, we found that many small snpRNAs exhibit cell type specific expression profiles, whereas long noncoding snpRNAs containing disease-associated SNP sequences manifest more ubiquitous expression patterns.4 These observations indicate that small snpRNAs may represent products of a cell type-specific processing of long noncoding snpRNAs and support the hypothesis that microRNAs are intrinsic regulatory components of snpRNA/enhancer IDAGL networks that contribute to maintenance of epigenetic regulatory state in a cell.
Figure 7.
Application of the allele affinity model of snpRNA-mediated regulation of microRNA expression and activity (Figs. 5 and S8) to development of the allele equilibrium hypothesis explaining a dynamic transition, the allele-specific phenotype-altering effects of trans-regulatory snpRNAs as the consequence of direct actions on microRNAs expression levels and activity and downstream effects of snpRNA-regulated microRNAs on mRNA abundance levels of protein-coding genes. See text for details.
Our experiments indicate that activation of the NLRP1-locus snpRNA/miR-205 axis may contribute to development of clinically significant prostate cancer by reducing expression of the PTEN tumor suppressor. We found that NLRP1-locus snpRNAs induce expression and activity of miR-205 in human cells (Fig. 5) and forced expression of miR-205 recapitulates many molecular, phenotypic and clinical features associated with expression of NLRP1-locus snpRNAs (Fig. 6), including markedly decreased expression of the PTEN tumor suppressor. PTEN tumor suppressor has been identified as a target for miR-205 based on target prediction algorithms and miR-205 overexpression experiments using the pGL3-PTEN 3′UTR reporter constructs with mutations of miR-205-binding sites, microarray and TaqMan Q-PCR analyses and protein gel blot analysis.25 Altered expression and activity of miR-205 have been associated with epithelial-to-mesenchymal transition (EMT), emergence of stem cell-like properties and maintenance of mammary epithelial cell progenitors.25–27
Results of our experiments are highly consistent with the emerging concept of the pervasive, global transcriptional activity of human genomes, which is supported by observations that vast majority of transcripts in human cells is represented by noncoding RNAs (refs. 28–37; see Sup. Material for discussion and additional references). Collectively, they lend credence to the idea that intergenic DNA sequence variations may contribute to disease pathogenesis via noncoding RNA intermediaries that assert trans-regulatory effects on epigenetic regulatory circuitry of a cell. This concept challenges the dominant position of protein-centric experimental paradigm that is focused on analysis of effects of genetic variations on protein-coding genes within or near boundaries where the genetic variants are located. Conclusive evidence of ubiquitous expression in human cells of intergenic disease-associated genetic loci indicates the potential clinical benefits of the concurrent analyses of DNA sequences and expression profiling of corresponding RNA products. This is critically important, because the transcriptional activity and transcript abundance levels are genetically defined, quantitative traits, assessment of which should enhance the disease risk prediction power of corresponding genetic tests. We anticipate that findings reported here should have a major near-term implication on design and execution of genome-wide association studies and follow-up mechanistic studies of non-protein-coding disease-linked loci. To this end, we provide sequences of validated primers and experimental protocols (Tables S1–5) to facilitate the immediate implementation of this type of analyses for 96 intergenic SNPs associated with increased risk of developing 21 common human disorders.
Experimental progress in defining candidate SNP variations associated with human disorders is rapidly generating leads with potential clinical relevance. Analysis of defined SNP variations appears to distinguish distinct autoimmune disorders and has a prognostic significance in leukemia and lymphoma.44,45 This progress is not limited to the investigations of disease phenotypes. Aging and longevity phenotypes in human populations have been associated with multiple SNP variations.46–48 Novel conceptual principles and comprehensive analytical approaches are beginning to emerge that signify growth and maturity of this exciting field. There is increasing understanding of a requirement for systematic, in-depth analysis of tge functional and clinical significance of non-protein-coding risk regions, particularly with respect to the cancer risk loci.49,50 Rapidly emerging experimental and clinical evidence supports the growing recognition of the important roles of microRNAs and other classes of noncoding RNAs in human diseases.51,52 Based on theoretical considerations as well as computational and bioinformatics analyses, we proposed a disease phenocode hypothesis that integrates the potential mechanistic relationships between structural features and gene expression patterns of disease-linked SNPs, microRNAs and mRNAs of protein-coding genes in association to phenotypes of multiple common human disorders.53–58 In this context, our work documents several important steps toward critical experimental testing and validation of potential practical utility and clinical relevance of a disease phenocode hypothesis.
Methods
Detailed description of all aspects of the experimental procedures, including snpRNAs and microRNA isolation and activity analysis; microRNA expression analysis; cell staining and flow cytometry; induced differentiation of THP-1 cells; lentivirus production and generation of stably transfected BJ1, RWPE1, U937 and THP-1 cells; colony growth and clonogenic growth assays can be found in the online Supplement and previous publications.4 Supplemental information is available at www.genlighttechnology.com
Cell lines.
Human BJ1, U937, THP-1, RWPE1 and HME1 cell lines were obtained from ATCC. hTERT-immortalized BJ1, LNCap and LNCapLN3 cells were previously described in references 38–42.
Tumor cell xenografts.
Sub-confluent monolayers of control LNCaP or LNCaP-A6 cells were trypsinized and counted then resuspended in RPMI-1640 medium with 25% charcoal-dextran stripped fetal bovine serum (CDS-FBS) and 50% (vol/vol) 2x Matrigel (Millipore, Inc.). Aliquots (250 µls) containing 106 cells were then injected subcutaneously in the flanks of 8-week-old male NCR Nu/Nu mice (Taconic, Inc.) that had been surgically castrated 10 d prior through a scrotal incision under anesthesia or sham-castrated, involving the scrotal incision without removal of the testis. Tumor size was estimated from largest diameter (a), smallest diameter (b) and height (c) measurements with calipers, with tumor volume calculated using the formula V = π/6 × a × b × c. Mice were euthanized at the end of the experiments; tumors were surgically recovered, weighted and processed for pathological and molecular analyses.
Disease-associated SNP meta-analysis and mapping of genomic coordinates.
Primary data sets of SNPs for metaanalysis of genomic coordinates of SNP variations identified in genome-wide association studies (GWAS) of up to 712,253 samples comprising 221,158 disease cases, 322,862 controls and 168,233 case/control subjects of obesity GWAS were obtained from previously published studies (references in online Sup. Material). Mapping of the SNP genomic coordinates was performed based on the NCBI release of Human Genome Build 36.3 (reference assembly). Genomic coordinates of the human K4-K36 domains and human lincRNAs are available in the online Supplemental Data Set (Sup. Methods, ref. 7). Genomic coordinates and gene names of the human bivalent domain genes were obtained from a recently published study (Sup. Methods, ref. 8).
Microarray gene expression analysis.
Technical and analytical aspects as well as stringent QC and statistical protocols of gene expression analysis experiments was carried-out essentially as described in our published work.39–42 Briefly, the array hybridization and processing, data retrieval and analysis was performed using standard sets of the Affymetrix equipment, software and protocols in a state-of-the-art Affymetrix microarray core facility. RNA was extracted from cell cultures of two independent biological replicates of each experimental condition and analyzed for sample purity and integrity using BioAnalyzer (Agilent). Expression analysis of 54,675 transcripts was performed for each sample in duplicates using Affymetrix HG-U133A Plus 2.0 arrays. Data retrieval and analysis was performed using MAS5.0 software, and concordant changes of gene expression for each experimental condition were determined at the statistical threshold p-value < 0.05 (two-tailed t-test). All microarray analysis data are publicly available coincident with the date of publication.
microRNA isolation and activity analysis.
microRNA was extracted from adherent cells lysed on culture plates using the mirVana miRNA Isolation kit (Ambion). Homogenized cell lysates were frozen at −80°C for at least 24 h prior to microRNA purification. miRNA concentration was checked using a NanoDrop (Thermo Scientific) before checking quality on a Bioanalyzer (Agilent Technologies).
To assay the activity of microRNAs in transfected cells, we used a miRNA Luciferase Reporter Vector (Signosis) specific for the microRNA of interest. The target site sequence of the reporter vector is complementary to the miRNA, therefore a decrease in luciferase signal would indicate an increase in microRNA activity. Cells were transfected with the reporter vector using FuGENE 6 Transfection Reagent (Roche); the transfection was allowed to run 48 h before the cells were lysed using Luciferase Cell Culture Lysis Reagent (Promega). The lysates were read using the FLUOstar OPTIMA system (BMG Lab Technologies), with 20 micro liters of Luciferase Assay Reagent (Promega) injected into each well immediately prior to reading.
miRNA expression analysis.
To analyze a spectrum of miRNA activity in the infected cell lines, we performed qPCR using the TaqMan Human MicroRNA Array v1.0 (Applied Biosystems) run on the 7900HT Fast Real-Time PCR System fitted with the specific block to run 384-well TaqMan Low Density Arrays (Applied Biosystems). This TaqMan array is distributed on a micro fluidics card, which allows for high reproducibility with minimal error. The array contains 365 different human miRNA assays and two small nucleolar RNAs that function as endogenous controls for data normalization. All miRNA samples were analyzed for quality control and processed at the Functional Genomics Core of the University of Rochester in Rochester, New York. We used the SDS 2.2 software, the platform for the computer interface with the 7900HT PCR System, to generate normalized data, compare samples and calculate RQ.
Protocols for identification of endogenous trans-regulatory RNAs.
(Detailed descriptions of protocols A–E are presented in the Supplement)
Extract small RNA from cells using mirVana isolation kit (protocol A)
Detect if there is DNA contamination by performing PCR using extracted RNA as template and β-actin primers (protocol B)
Synthesize cDNA from extracted small RNA (protocol C)
Perform first-round PCR using appropriate primer set (protocol B)
Clean up PCR product and evaluate cleanup PCR product on 1.2% gel (protocol D)
Perform nested PCR using purified product of the first-round PCR as template and appropriate primer set; evaluate nested PCR product on 1.2% gel (protocol B)
Cut the single DNA band of interest from the gel, extract and purify the product for sequencing (protocol E).
Luciferase reporter assays.
Luciferase reporter assays were performed to identify allele-specific features of SNP-bearing RNA and DNA sequences. Enhancer/insulator activities of the 2 kb intergenic DNA sequence containing distinct allelic variants of the rs2670660 NLRP1-locus SNP. Luciferase reporter assays to assess the enhancer activity of 2 kb NLRP1-locus intergenic region were performed on RWPE1 and HEK293 cells transiently expressing either control luciferase reporter plasmids or plasmids containing chemically synthesized 2 kb sequences flanking distinct allelic variants of the NLRP1-locus intergenic SNP rs2670660, which is positioned exactly in the middle of the enhancer's sequence. Because allelic differences in the luciferase reporter assays tend to be modest, measurements were controlled by multiple replications of all experimental elements of the enhancer assay. We considered the possibility of multiple levels of variations, including plasmid preps, transfection replicates (along with transfection efficiency measurements, such as using the Renilla lucferase co-transfection controls for normalization). At least three independent experiments were performed for each setting and three replicates of the luciferase assay were performed in each experiment. Results were validated using at least two independent plasmid preps to control for this potentially significant source of variation.
Cell staining and flow cytometry.
Cells were stained at a concentration of 1 × 10⁶ cells per 100 ul of HBSS with 2% HICS. Antibodies at appropriate dilutions (CD14-Pacific Blue, Biolegend, Inc. and CD11b-Alexa Fluor® 647, Biolegend, Inc.) were added. Staining duration was for 30 min with rotation at 4°C. Cells were then washed with staining medium three times and re-suspended in staining medium. The stained specimens were then analyzed using FACSVantage (BD Biosciences; www.bdbiosciences.com) or FACSAria with either Diva or CellQuest software (BD Biosciences). The cell counter of the flow cytometers was used to determine cell numbers. Cells were collected into HBSS with 2% HICS.
Induced differentiation of THP-1 cells.
Approximately 2 × 10⁶ THP-1 cells (5 × 10⁵ cells/ml) in a 25 cm flask were induced to differentiate by treatment with 20 uM PMA (Sigma-Aldrich) for 4 d.
Lentivirus production and generation of stably transfected BJ1, U937, RWP E1, LNCap and THP-1 cells.
Allele-specific sense and antisense variants of the rs2670660 sequence of 52 nt in length (Fig. 1A in ref. 4; nucleotide sequence shown in shaded box) were chemically synthesized and cloned sequentially into pUC57 plasmid by EcoRV (GeneScript Corporation) and pCDH-CMV-MCS-EF1-copGFP plasmid by EcoRI and NotI (SystemsBio). The integrity and molecular identity of the synthetic sequences as well as designed plasmid vectors were monitored by restriction enzyme-mapping analysis and direct sequencing. Lentiviruses were generated by co-transfecting pLentiviral vector with GFP only plasmids (control cultures) or GFP plasmids with synthetic allele-specific 52 nt sequences of the SNP rs2670660, as shown in Figure 1 (ref. 4 and Sup. Material for additional information), and packaging mix (Invitrogen) into 293FT cells using Lipofectamine 2000 according to the manufacturer's instructions (Invitrogen). Target cells were then infected with viral supernatant for 24 hr. Flow cytometry analysis for GFP expression was performed to confirm the infection and assess the transfection efficiency. Experiments were performed using cultures with transfection efficiency > 90%.
Colony growth assay.
Cells from sub-confluent cultures (∼70% confluence) were seeded in triplicates into 6-well plates (100 cells per well), cultured for 2 weeks and then stained with 0.1% crystal violet for 5 min. Plates were scanned, and the number of colonies containing > 50 cells was counted.
Statistical and bioinformatics analysis.
Detailed protocols for data analysis and documentation of the sensitivity, reproducibility and other aspects of the quantitative statistical microarray analysis using Affymetrix technology have been reported previously in references 39–42. Forty to 60 percent of the surveyed genes were called present by Affymetrix Microarray Suite version 5.0 software in these experiments. The concordance analysis of differential gene expression across the data sets was performed using Affymetrix MicroDB version 3.0 and DMT version 3.0 software as described previously in references 39–42. We processed the microarray data using the Affymetrix Microarray Suite version 5.0 software and performed statistical analysis of the expression data set using the Affymetrix MicroDB and Affymetrix DMT software. The Pearson correlation coefficient for individual test samples and the appropriate reference standard were determined using GraphPad Prism version 4.00 software (GraphPad Software). Two-tailed t-test or Fisher's exact tests were employed to estimate the statistical significance of the differences between various experimental conditions and corresponding controls. We calculated the significance of the overlap between the lists of differentially regulated genes and other experimental end-points by using the hypergeometric distribution test.43 Analyses of the predicted secondary structures of identified snpRNAs, screening for potential target sites of microRNAs and sequence homology profiling of snpRNAs and microRNAs were performed using web-accessible, publicly available resources (rna.tbi.univie.ac.at/cgi-bin/RNAfold.cgi; www.ncrna.org/centroidfold; bioinfo.uni-plovdiv.bg/microinspector; www.mirbase.org).
Acknowledgments
This work was supported, in part, by the grants from the National Institute of Health and Charitable Leadership Foundation (CLF), Clifton Park, NY. We thank you many reviewers for constructive critical comments during the nearly two-year-long peer review process of this manuscript and acknowledge their contribution to our work.
Abbreviations
- SNP
single-nucleotide polymorphism
- NALP1
NLRP1
- AD
Alzheimer disease
- BD
bipolar disease
- RA
rheumatoid arthriti
- CAD
coronary artery disease
- CD
Crohn disease
- T1D
type 1 diabetes
- T2D
type 2 diabetes
- HT
hypertension
- AS
ankylosing spondylitis
- AITD
autoimmune thyroid disease (Graves disease)
- MS
multiple sclerosis
- BC
breast cancer
- PC
prostate cancer
- SLE
systemic lupus erythematosus
- VIT
vitiligo-associated multiple autoimmune disease
- HD
Huntington disease
- UC
ulcerative colitis
Author Contributions
A.B.G., J.M. and S.M. contributed equally to this work. G.V.G. conceived the idea and conceptualized the framework of the experimental work. G.V.G. and A.B.G. conceived and designed the experiments. S.M., J.M., D.G., CL. I.G., R.B. performed the experiments. G.V.G., A.B.G., S.M., J.M., D.G., C.L., R.B. analyzed the data. G.V.G., A.B.G., S.S., R.B. contributed reagents/materials/analysis tools/financial support. G.V.G. wrote the paper.
Disclosure of Potential Conflicts of Interest
No potential conflicts of interest were disclosed.
Supplementary Material
References
- 1.Manolio TA. Genomewide association studies and assessment of the risk of disease. N Engl J Med. 2010;363:166–176. doi: 10.1056/NEJMra0905980. [DOI] [PubMed] [Google Scholar]
- 2.Hindorff LA, Sethupathy P, Junkins HA, Ramos EM, Mehta JP, Collins FS, et al. Potential etiologic and functional implications of genome-wide association loci for human diseases and traits. Proc Natl Acad Sci USA. 2009;106:9362–9367. doi: 10.1073/pnas.0903103106. [DOI] [PMC free article] [PubMed] [Google Scholar]
- 3.Hardy J, Singleton AB. Genomewide association studies and human disease. N Engl J Med. 2009;360:1759–1768. doi: 10.1056/NEJMra0808700. [DOI] [PMC free article] [PubMed] [Google Scholar]
- 4.Glinskii AB, Ma J, Ma S, Grant D, Lim C, Sell S, et al. Identification of intergenic trans-regulatory RNAs containing a disease-linked SNP sequence and targeting cell cycle progression/differentiation pathways in multiple common human disorders. Cell Cycle. 2009;8:3925–3942. doi: 10.4161/cc.8.23.10113. [DOI] [PubMed] [Google Scholar]
- 5.Yeager M, Orr N, Hayes RB, Jacobs KB, Kraft P, Wacholder S, et al. Genome-wide association study of prostate cancer identifies a second risk locus at 8q24. Nat Genet. 2007;39:645–649. doi: 10.1038/ng2022. [DOI] [PubMed] [Google Scholar]
- 6.Amundadottir LT, Sulem P, Gudmundsson J, Helgason A, Baker A, Agnarsson BA, et al. A common variant associated with prostate cancer in European and African populations. Nat Genet. 2006;38:652–658. doi: 10.1038/ng1808. [DOI] [PubMed] [Google Scholar]
- 7.Gudmundsson J, Sulem P, Manolescu A, Amundadottir LT, Gudbjartsson D, Helgason A, et al. Genome-wide association study identifies a second prostate cancer susceptibility variant at 8q24. Nat Genet. 2007;39:631–637. doi: 10.1038/ng1999. [DOI] [PubMed] [Google Scholar]
- 8.Haiman CA, Patterson N, Freedman ML, Myers SR, Pike MC, Waliszewska A, et al. Multiple regions within 8q24 independently affect risk for prostate cancer. Nat Genet. 2007;39:638–644. doi: 10.1038/ng2015. [DOI] [PMC free article] [PubMed] [Google Scholar]
- 9.Freedman ML, Haiman CA, Patterson N, McDonald GJ, Tandon A, Waliszewska A, et al. Admixture mapping identifies 8q24 as a prostate cancer risk locus in African-American men. Proc Natl Acad Sci USA. 2006;103:14068–14073. doi: 10.1073/pnas.0605832103. [DOI] [PMC free article] [PubMed] [Google Scholar]
- 10.Tomlinson I, Webb E, Carvajal-Carmona L, Broderick P, Kemp Z, Spain S, et al. A genome-wide association scan of tag SNPs identifies a susceptibility variant for colorectal cancer at 8q24.21. Nat Genet. 2007;39:984–988. doi: 10.1038/ng2085. [DOI] [PubMed] [Google Scholar]
- 11.Zanke BW, Greenwood CM, Rangrej J, Kustra R, Tenesa A, Farrington SM, et al. Genome-wide association scan identifies a colorectal cancer susceptibility locus on chromosome 8q24. Nat Genet. 2007;39:989–994. doi: 10.1038/ng2089. [DOI] [PubMed] [Google Scholar]
- 12.Haiman CA, Le Marchand L, Yamamato J, Stram DO, Sheng X, Kolonel LN, et al. A common genetic risk factor for colorectal and prostate cancer. Nat Genet. 2007;39:954–956. doi: 10.1038/ng2098. [DOI] [PMC free article] [PubMed] [Google Scholar]
- 13.Witte JS. Multiple prostate cancer risk variants on 8q24. Nat Genet. 2007;39:579–580. doi: 10.1038/ng0507-579. [DOI] [PubMed] [Google Scholar]
- 14.Pomerantz MM, Ahmadiyeh N, Jia L, Herman P, Verzi MP, Doddapaneni H, et al. The 8q24 cancer risk variant rs6983267 demonstrates long-range interaction with MYC in colorectal cancer. Nat Genet. 2009;41:882–884. doi: 10.1038/ng.403. [DOI] [PMC free article] [PubMed] [Google Scholar]
- 15.Jia L, Landan G, Pomerantz M, Jaschek R, Herman P, Reich D, et al. Functional Enhancers at the Gene-Poor 8q24 Cancer-Linked Locus. PLoS Genet. 2009;5:1000597. doi: 10.1371/journal.pgen.1000597. [DOI] [PMC free article] [PubMed] [Google Scholar]
- 16.Sotelo J, Esposito D, Duhagon MA, Banfield K, Mehalko J, Liao H, et al. Long-range enhancers on 8q24 regulate c-Myc. Proc Natl Acad Sci USA. 2010;107:3001–3005. doi: 10.1073/pnas.0906067107. [DOI] [PMC free article] [PubMed] [Google Scholar]
- 17.Wright JB, Brown SJ, Cole MD. Upregulation of c-MYC in cis through a large chromatin loop linked to a cancer risk-associated single-nucleotide polymorphism in colorectal cancer cells. Mol Cell Biol. 2010;30:1411–1420. doi: 10.1128/MCB.01384-09. [DOI] [PMC free article] [PubMed] [Google Scholar]
- 18.Wasserman NF, Ivy Aneas I, Nobrega MA. An 8q24 gene desert variant associated with prostate cancer risk confers differential in vivo activity to a MYC enhancer. Genome Res. 2010;20:1191–1197. doi: 10.1101/gr.105361.110. [DOI] [PMC free article] [PubMed] [Google Scholar]
- 19.Kim TK, Hemberg M, Gray JM, Costa AM, Bear DM, Wu J, et al. Widespread transcription at neuronal activity-regulated enhancers. Nature. 2010;465:182–187. doi: 10.1038/nature09033. [DOI] [PMC free article] [PubMed] [Google Scholar]
- 20.Ku M, Koche RP, Rheinbay E, Mendenhall EM, Endoh M, Mikkelsen TS, et al. Genome wide analysis of PRC1 and PRC2 occupancy identifies two classes of bivalent domains. PLoS Genet. 2008;4:1000242. doi: 10.1371/journal.pgen.1000242. [DOI] [PMC free article] [PubMed] [Google Scholar]
- 21.Heintzman ND, Stuart RK, Hon G, Fu Y, Ching CW, Hawkins RD, et al. Distinct and predictive chromatin signatures of transcriptional promoters and enhancers in the human genome. Nat Genet. 2007;39:311–318. doi: 10.1038/ng1966. [DOI] [PubMed] [Google Scholar]
- 22.Visel A, Blow MJ, Li Z, Zhang T, Akiyama JA, Holt A, et al. ChIP-seq accurately predicts tissue-specific activity of enhancers. Nature. 2009;457:854–858. doi: 10.1038/nature07730. [DOI] [PMC free article] [PubMed] [Google Scholar]
- 23.Xi H, Shulha HP, Lin JM, Vales TR, Fu Y, Bodine DM, et al. Identification and characterization of cell type-specific and ubiquitous chromatin regulatory structures in the human genome. PLoS Genet. 2007;3:136. doi: 10.1371/journal.pgen.0030136. [DOI] [PMC free article] [PubMed] [Google Scholar]
- 24.Chatterjee S, Grosshans H. Active turnover modulates mature microRNA activity in Caenorhabditis elegans. Nature. 2009;461:546–549. doi: 10.1038/nature08349. [DOI] [PubMed] [Google Scholar]
- 25.Greene SB, Gunaratne PH, Hammond SM, Rosen JM. A putative role for microRNA-205 in mammary epithelial cell progenitors. J Cell Sci. 2010;123:606–618. doi: 10.1242/jcs.056812. [DOI] [PMC free article] [PubMed] [Google Scholar]
- 26.Ibarra I, Erlich Y, Muthuswamy SK, Sachidanandam R, Hannon GJ. A role for microRNAs in maintenance of mouse mammary epithelial progenitor cells. Genes Dev. 2007;21:3238–3243. doi: 10.1101/gad.1616307. [DOI] [PMC free article] [PubMed] [Google Scholar]
- 27.Tellez CS, Juri DE, Do K, Bernauer AM, Thomas CL, Damiani LA, et al. EMT and Stem Cell-Like Properties Associated with miR-205 and miR-200 Epigenetic Silencing Are Early Manifestations during Carcinogen-Induced Transformation of Human Lung Epithelial Cells. Cancer Res. 2011;71:3087–3097. doi: 10.1158/0008-5472.CAN-10-3035. [DOI] [PMC free article] [PubMed] [Google Scholar]
- 28.Bertone P, Stolc V, Royce TE, Rozowsky JS, Urban AE, Zhu X, et al. Global identification of human transcribed sequences with genome tiling arrays. Science. 2004;306:2242–2246. doi: 10.1126/science.1103388. [DOI] [PubMed] [Google Scholar]
- 29.ENCODE Project Consortium, author. Identification and analysis of functional elements in 1% of the human genome by the ENCODE pilot project. Nature. 2007;447:799–816. doi: 10.1038/nature05874. [DOI] [PMC free article] [PubMed] [Google Scholar]
- 30.Washietl S, Pedersen JS, Korbel JO, Stocsits C, Gruber AR, Hackermüller J, et al. Structured RNAs in the ENCODE selected regions of the human genome. Genome Res. 2007;17:852–864. doi: 10.1101/gr.5650707. [DOI] [PMC free article] [PubMed] [Google Scholar]
- 31.Rozowsky JS, Newburger D, Sayward F, Wu J, Jordan G, Korbel JO, et al. The DART classification of unannotated transcription within the ENCODE regions: associating transcription with known and novel loci. Genome Res. 2007;17:732–745. doi: 10.1101/gr.5696007. [DOI] [PMC free article] [PubMed] [Google Scholar]
- 32.Kapranov P, Cheng J, Dike S, Nix DA, Duttagupta R, Willingham AT, et al. RNA maps reveal new RNA classes and a possible function for pervasive transcription. Science. 2007;316:1484–1488. doi: 10.1126/science.1138341. [DOI] [PubMed] [Google Scholar]
- 33.Gerstein MB, Bruce C, Rozowsky JS, Zheng D, Du J, Korbel JO, et al. What is a gene, post-ENCODE? History and updated definition. Genome Res. 2007;17:669–681. doi: 10.1101/gr.6339607. [DOI] [PubMed] [Google Scholar]
- 34.Gingeras TR. Origin of phenotypes: genes and transcripts. Genome Res. 2007;17:682–690. doi: 10.1101/gr.6525007. [DOI] [PubMed] [Google Scholar]
- 35.Affymetrix ENCODE Transcriptome Project, Cold Spring Harbor Laboratory ENCODE Transcriptome Project, author. Post-transcriptional processing generates a diversity of 5′-modified long and short RNAs. Nature. 2009;457:1028–1032. doi: 10.1038/nature07759. [DOI] [PMC free article] [PubMed] [Google Scholar]
- 36.Seila AC, Calabrese JM, Levine SS, Yeo GW, Rahl PB, Flynn RA, et al. Divergent transcription from active promoters. Science. 2008;322:1849–1851. doi: 10.1126/science.1162253. [DOI] [PMC free article] [PubMed] [Google Scholar]
- 37.Hirota K, Miyoshi T, Kugou K, Hoffman CS, Shibata T, Ohta K. Stepwise chromatin remodeling by a cascade of transcription initiation of noncoding RNAs. Nature. 2008;456:130–134. doi: 10.1038/nature07348. [DOI] [PubMed] [Google Scholar]
- 38.Holt SE, Glinsky VV, Ivanova AB, Glinsky GV. Resistance to apoptosis in human cells conferred by telomerase function and telomere stability. Mol Carcinog. 1999;25:241–248. doi: 10.1002/(SICI)1098-2744(199908)25:4<241::AIDMC2>3.0.CO;2-9. [DOI] [PubMed] [Google Scholar]
- 39.Glinsky GV, Glinskii AB, Berezovskaya O. Microarray analysis identifies a death-from-cancer signature predicting therapy failure in patients with multiple types of cancer. J Clin Invest. 2005;115:1503–1521. doi: 10.1172/OCI23412. [DOI] [PMC free article] [PubMed] [Google Scholar]
- 40.Glinsky GV, Higashiyama T, Glinskii AB. Classification of human breast cancer using gene expression profiling as a component of the survival predictor algorithm. Clin Cancer Res. 2004;10:2272–2283. doi: 10.1158/1078-0432.CCR-03-0522. [DOI] [PubMed] [Google Scholar]
- 41.Glinsky GV, Glinskii AB, Stephenson AJ, Hoffman RM, Gerald WL. Gene expression profiling predicts clinical outcome of prostate cancer. J Clin Invest. 2004;113:913–923. doi: 10.1172/JCI20032. [DOI] [PMC free article] [PubMed] [Google Scholar]
- 42.Glinsky GV, Krones-Herzig A, Glinskii AB, Gebauer G. Microarray analysis of xenograft-derived cancer cell lines representing multiple experimental models of human prostate cancer. Mol Carcinog. 2003;37:209–221. doi: 10.1002/mc.10139. [DOI] [PubMed] [Google Scholar]
- 43.Tavazoie S, Hughes JD, Campbell MJ, Cho RJ, Church GM. Systematic determination of genetic network architecture. Nat Genet. 1999;22:281–285. doi: 10.1038/10343. [DOI] [PubMed] [Google Scholar]
- 44.Zhebrun D, Kudryashova Y, Babenko A, Maslyansky A, Kunitskaya N, Popcova D, et al. Association of PTPN22 1858T/T genotype with type 1 diabetes, Graves' disease but not with rheumatoid arthritis in Russian population. Aging (Albany NY) 2011;3:368–373. doi: 10.18632/aging.100305. [DOI] [PMC free article] [PubMed] [Google Scholar]
- 45.Post SM, Pant V, Abbas H, Quintás-Cardama A. Prognostic impact of the MDM2SNP309 allele in leukemia and lymphoma. Oncotarget. 2010;1:168–174. doi: 10.18632/oncotarget.123. [DOI] [PMC free article] [PubMed] [Google Scholar]
- 46.Gravina S, Lescai F, Hurteau G, Brock GJ, Saramaki A, Salvioli S, et al. Identification of single-nucleotide polymorphisms in the p21 (CDKN1A) gene and correlations with longevity in the Italian population. Aging (Albany NY) 2009;1:470–480. doi: 10.18632/aging.100041. [DOI] [PMC free article] [PubMed] [Google Scholar]
- 47.Yashin AI, Wu D, Arbeev KG, Ukraintseva SV. Joint influence of small-effect genetic variants on human longevity. Aging (Albany NY) 2010;2:612–620. doi: 10.18632/aging.100191. [DOI] [PMC free article] [PubMed] [Google Scholar]
- 48.Vijg J. SNP'ing for longevity. Aging (Albany NY) 2009;1:442–443. doi: 10.18632/aging.100048. [DOI] [PMC free article] [PubMed] [Google Scholar]
- 49.Coetzee GA, Jia L, Frenkel B, Henderson BE, Tanay A, Haiman CA, et al. A systematic approach to understand the functional consequences of non-protein coding risk regions. Cell Cycle. 2010;9:256–259. doi: 10.4161/cc.9.2.10419. [DOI] [PMC free article] [PubMed] [Google Scholar]
- 50.Freedman ML, Monteiro AN, Gayther SA, Coetzee GA, Risch A, Plass C, et al. Principles for the post-GWAS functional characterization of cancer risk loci. Nat Genet. 2011;43:513–518. doi: 10.1038/ng.840. [DOI] [PMC free article] [PubMed] [Google Scholar]
- 51.Glinsky GV. Remarkable features of tiny RNA molecules: highlights of revolutionary discoveries on the path from the bench to bedside. Cell Cycle. 2008;7:2451. doi: 10.4161/cc.7.16.6754. [DOI] [PubMed] [Google Scholar]
- 52.Junn E, Mouradian MM. MicroRNAs in neurodegenerative disorders. Cell Cycle. 2010;9:1717–1721. doi: 10.4161/cc.9.9.11296. [DOI] [PubMed] [Google Scholar]
- 53.Glinsky GV. Integration of HapMap-based SNP pattern analysis and gene expression profiling reveals common SNP profiles for cancer therapy outcome predictor genes. Cell Cycle. 2006;5:2613–2625. doi: 10.4161/cc.5.22.3498. [DOI] [PubMed] [Google Scholar]
- 54.Glinsky GV. Disease phenocode analysis identifies SNP-guided microRNA maps (MirMaps) associated with human “master” disease genes. Cell Cycle. 2008;7:3680–3694. doi: 10.4161/cc.7.23.7153. [DOI] [PubMed] [Google Scholar]
- 55.Glinsky GV. SNP-guided microRNA maps (MirMaps) of 16 common human disorders identify a clinically accessible therapy reversing transcriptional aberrations of nuclear import and inflammasome pathways. Cell Cycle. 2008;7:3564–3576. doi: 10.4161/cc.7.22.7073. [DOI] [PubMed] [Google Scholar]
- 56.Glinsky GV. An SNP-guided microRNA map of fifteen common human disorders identifies a consensus disease phenocode aiming at principal components of the nuclear import pathway. Cell Cycle. 2008;7:2570–2583. doi: 10.4161/cc.7.16.6524. [DOI] [PubMed] [Google Scholar]
- 57.Glinsky GV. Human genome connectivity code links disease-associated SNPs, microRNAs and pyknons. Cell Cycle. 2009;8:925–930. doi: 10.4161/cc.8.6.7937. [DOI] [PubMed] [Google Scholar]
- 58.Glinsky GV. Phenotype-defining functions of multiple noncoding RNA pathways. Cell Cycle. 2008;7:1630–1639. doi: 10.4161/cc.7.11.5976. [DOI] [PubMed] [Google Scholar]
Associated Data
This section collects any data citations, data availability statements, or supplementary materials included in this article.


