

Abstract
HIV infection is characterized by a gradual deterioration of immune function mainly in the CD4 compartment. To better understand the dynamics of HIV-specific T cells, we analyzed the kinetics and polyfunctional profiles of Gag-specific CD4+ and CD8+ T cell responses in 12 subtype C-infected individuals with different disease progression profiles from acute to chronic HIV infection. The frequencies of Gag-responsive CD4+ and CD8+ T cells showed distinct temporal kinetics. The peak frequency of Gag-responsive IFNγ+CD4+ T cell was observed at a median of 28 days (IQR: 21-81) post Fiebig I/II staging, whilst Gag-specific IFNγ+CD8+ T cell responses peaked at a median of 253 days (IQR: 136-401 and showed a significant biphasic expansion. The proportion of TNFα-expressing cells within the IFNγ+CD4+ T cell population increased (p=0.001) over time, whilst TNFα-expressing cells within IFNγ+CD8+ T cells declined (p=0.005). Both Gag-responsive CD4+ and CD8+ T cells showed decreased Ki67 expression within the first 120 days post Feibig I/II staging. Prior to the disappearance of Gag-responsive Ki67+CD4+ T cells, these cells positively correlated (p=0.00038) with viremia, indicating that early Gag-responsive CD4 events are shaped by viral burden. No such associations were observed in the Gag-specific CD8+ T cell compartment. Overall, these observations indicate that circulating Gag-responsive CD4+ and CD8+ T cell frequencies and functions are not synchronous and properties change rapidly at different tempos during early HIV infection.
INTRODUCTION
In many viral infections, functional antigen-specific CD4+ T cells play a critical role in orchestrating immune responses. In animal models, the absence or disruption of CD4+ T cell responses can impair immune protection (1, 2) by limiting antibody production (3, 4), CD8+ T cell activation (5-7) or the maintenance of cytotoxic T lymphocyte responses (8-10). Maintenance of antigen-specific CD4+ T cell responses during HIV infection, presents a particular challenge, as these cells are targets for the virus (11, 12). During acute HIV-1 infection, there is an ordered burst of inflammatory cytokines (13) promoting cell activation and conceivably increasing the pool of CD4+ T cell targets, which would fuel viral replication. Moreover, due to preferential targeting of HIV-specific CD4+ T cells (11), it could be hypothesized that these cells are rendered dysfunctional or eliminated early during infection. The timing of HIV-specific CD4+ T cell impairment appears to occur early after infection (14) and it is of importance to understand more precisely the dynamics and functional characteristics of virus-specific CD4+ T during acute HIV infection. We have previously shown that Gag-responsive CD4+ T cell differentiation and activation profiles at 3 months post seroconversion associate with those observed at 12 months, suggesting that a steady state of activation is reached in the early phase of HIV infection (15). We now examine more closely the evolution of CD4+ T cell responses during acute HIV-1 infection and describe the distinct kinetics of Gag-responsive CD4 and CD8+ T cell frequencies, function and activation. Our results show that major changes occur in peripheral blood Gag-responsive CD4+ T cells within the first few months of infection and that acute viral burden likely plays a dominant role in driving these dynamics.
MATERIAL AND METHODS
Study Participants
Twelve HIV-1 clade-C infected subjects were enrolled as part of the CHAVI 001 acute infection cohort. Five individuals were recruited from Durban, South Africa (CHA198, CHA067, CHA164, CHA162, CHA696), 6 from Lilongwe, Malawi (CHA010, CHA228, CHA813, CHA1280, CHA895) and one from Durham, USA (CHA470). Fiebig staging was used to characterize the timing of infection after enrolment and the stage was classified by measuring the presence/absence of plasma HIV RNA content and HIV-specific antibodies using ELISA and Western Blot. Participants were enrolled and the first blood samples drawn between 2 to 24 days post screening and all participants were antiretroviral therapy-naive throughout the study. Viral load was measured with the COBAS AMPLICOR™ HIV-1 monitor test version 1.5 (Roche Diagnostics, Branchburg, New Jersey, USA) and the CD4 count was measured by flow cytometry. Six of the participants presented a Fiebig I/II stage at screening, with detectable plasma HIV mRNA and no detectable HIV-1 serum antibodies. Three individuals were classified as Fiebig III stage at screening, with HIV antibodies detectable by ELISA (Bio-Rad, HIV-1/HIV-2 PLUS O EIA 3rd generation, Hercules, CA, USA) but negative by Western Blot (Bio-Rad, Hercules, CA, USA). The last three participants had detectable HIV antibodies by ELISA but indeterminate using Western blot and were considered as Fiebig IV stage. The time post Fiebig I/II stage (when unavailable) was calculated by adjusting the time at screening by 3 days for subjects in stage III at screening and by 6 days for subjects in stage IV at screening (3 days of phase 3 and 3 days to the midpoint of phase 4) (16). We also used a secondary classification of early and chronic HIV infection, using the arbitrary cut-off of 120 days before (early) and after (chronic) Fiebig stage I/II. Samples analyzed in this study were taken from individuals who were not taking antiretroviral therapy. According to the CHAVI 001 protocol, both voluntary HIV counseling and testing (VCT) and risk-reduction and safe-sex counseling were offered and were done so in accordance with local standards and regulations. The participants requiring clinical care for the management of symptomatic STIs were either received at the clinical site or referred. Enrolled participants were referred for HIV care following each country’s national guidelines for management and treatment of people with HIV. If referral for antiretroviral treatment was made, this included possible enrollment into other available HIV treatment resources (such as the Global Fund, PEPFAR or national roll-out programs). The protocol for CHAVI 001 acute HIV-1 infection prospective cohort study can be found: https://chavi.org/wysiwyg/downloads/CHAVI_001_protocol_v2.pdf. Duke University, University of North Carolina, University of Witwatersrand and University of Cape Town institutional review boards approved this study, and all the subjects provided written informed consent for participation in this study.
Cell preparation
Blood samples were collected at different time points post infection. Peripheral blood mononuclear cells (PBMC) were isolated by a standard Ficoll-Hypaque density gradient centrifugation (Amershan Pharmacia, Uppsala, Sweden), cryopreserved in 90% heat-activated fetal bovine serum (FBS) (Invitrogen, Paisely, United Kingdom) plus 10% DMSO, and stored in liquid nitrogen until needed. Thawed PBMC were washed twice with RPMI 1640 supplemented with 10% heat inactivated FBS, 100U/ml penicillin G, 100 μg/ml streptomycin sulfate, and 1.7mM sodium glutamate (R10). The cells were then rested in R10 at 37°C and 5% CO2 for 2 hours in the presence of 10U/ml Dnase I (Roche Diagnostics, Branchburg, New Jersey, USA) prior to use in intracellular cytokine staining assays.
Synthetic subtype C peptides
Peptides were synthesised by Sigma, (St Louis, MO, USA) and/or the Medical Research Council Human Immunology Unit (Weatherall Institute of Molecular Medicine, Oxford, UK) as 18mers overlapping by 10 amino acids. Consensus subtype C Gag peptides were used for 7 (CHA10, CHA228, CHA696, CHA813, CHA895, CHA976, CHA1280) study participants and peptides matching the founder autologous virus was used in 5 (CHA067, CHA162, CHA164, CHA198, CHA470). Peptides were pooled by protein and used at a final concentration of 2μg/ml in a maximum of 0.45%DMSO.
Cell Stimulation and intracellular staining
Thawed PBMC were washed, resuspended at 2×10⁶ cells/ml with RPMI 1640 supplemented with 10% heat inactivated FCS, and rested at 37°C and 5% CO2 over night. Cells were then stimulated for 6h with autologous or consensus HIV-1 C Gag pools (2μg/ml) in the presence of 1μg/ml αCD28 and αCD49d co-stimulatory antibodies (BD Bioscience, San Diego, CA, USA) and 10μg/ml brefeldin A (Sigma-Aldrich, St-Louis, MO, USA). A negative control containing PBMC and co-stimulatory antibodies from the same subject, but without the peptide mix was also included for each assay. Following stimulation, cells were washed with PBS and surface stained with red-amine live/dead reagent (Molecular Probes/Invitrogen, Paisely, United Kingdom) and a cocktail of monoclonal antibodies (mAbs) containing CD14 PE-TexRed (Beckman Coulter, Brea, CA, USA), CD19 PE-TexRed (Beckman Coulter, Brea, CA, USA), CD3 QD655 (Invitrogen, Paisely, United Kingdom), CD4 PEcy5.5 (BD Pharmingen, San Diego, CA, USA), CD8 QD705 (Invitrogen, Paisely, United Kingdom), CD45RA QD605 (Invitrogen, Paisely, United Kingdom), CD27 PEcy5 (BD Pharmingen, San Diego, CA, USA), CD38 APC (BD Pharmingen, San Diego, CA, USA) for 30 min in the dark at 4°C. The cells were then washed with PBS containing 1% FBS and permeabilized according to the manufacture’s instructions using a Cytofix/Cytoperm buffer kit (BD Biosciences, San Diego, CA, USA) and stained with Interferon-gamma (IFNγ) Alexa700 (BD Pharmingen, San Diego, CA, USA), Interleukine-2 (IL-2) PE (BD Pharmingen, San Diego, CA, USA), Tumor Necrosis Factor-alpha (TNFα) Pacific Blue (e-Bioscience, San Diego, CA, USA) and Ki-67 FITC (BD Pharmingen, San Diego, CA, USA). After labelling, cells were washed and fixed in PBS containing 1% paraformaldehyde and stored at 4°C prior to flow cytometry acquisition within 24 hours.
IFNγ-Enzyme-linked immunospot (ELISpot) assay
Briefly, cryopreserved PBMCs were thawed and rested for 2 h before being placed in the ELISpot plates at 1 × 10⁵ cells/well. PBMC were then stimulated with 9- to 18-mer autologous single peptides (2μg/ml, based on transmitted viral sequence) and incubated for 20h at 37°C, 5% CO2. Coating, development, and reading of ELISpot plates have been described previously (17). Peptide used: CH162: Nef KRQEILDLWVYHTQGYFP, Vif HMHYFDCFAGS, Gag HKGIKVKDTKEALDKIEE. CH470 : Nef FDSRLAYQHIAKEKHPEF, Pol QIYPGIKVK, Env RQGLERALI, Gag DIKDTKEAL. CH164 : Nef EEVGFPVRPQV, Pol KGEAIHGQVDCSPGIWQL, Env CPKISFDPIPIHYCAPAG and Gag PGHKARVLAEAMSQANNA. Positive responses were defined as ≥50 SFU/ million, >4× background. For all assays, six negative control wells (media only) and at least 1 positive control well (10 μg/ml PHA [Sigma-Aldrich, St Louis, MO, USA) were used.
Flow cytometry analysis
Approximately 700,000 to 1,200,000 events were collected per sample on an LSRII flow cytometer (BD Bioscience, San Diego, CA, USA). Electronic compensation was conducted with antibody capture beads (BD Bioscience, San Diego, CA, USA) stained separately with individual mAbs used in test samples. Data was analysed with FlowJo Version 8.8.6 (Tree Star, Ashland, OR, USA). Dead cells (Live/Dead+), monocytes (CD14+) and B cells (CD19+) were removed from the analysis. Cells were then gated on singlets, live CD3+, CD4+, CD8+, memory cells and then on combinations of maturation and activation markers. Gating strategy is depicted in Supplementary Figure 1. For cytokine expression, values greater than 0.04% (after background subtraction) and than twice the background were considered as positive. Evaluation of all non-stimulated samples tested (n=69, 4 to 9 time-points in 12 donors) showed that the average (±SD) frequencies for IFNγ positive events was 0.0115% (±0.0103) for CD4+T cells and 0.0125% (±0.019) for CD8+ T cells. Maturation and activation phenotype were analyzed only on HIV-specific IFNγ+ cells presenting the following criteria: i) frequency of HIV-specific CD4+ T cells > 0.04% of total memory T cells, ii) cytokine responses higher than 2 times the corresponding non-stimulated sample and iii) number of positive event in HIV stimulated samples is higher than 30.
Statistical Analysis
Statistical analysis and graphical presentation were performed using GraphPad Prism version 4.0 software (GraphPad Software, La Jolla, CA, USA) and Mathematica 8.0 (Wolfram research, IL, USA). For correlations, data were analyzed by the use of nonparametric statistics. Statistical significance was determined using either Mann-Whitney or Wilcoxon Paired t test. All tests were two-tailed, and a value of p<0.05 was considered statistically significant. The relationship between the HIV-Specific CD4+ T cell phenotype and plasma viral loads were assessed by Spearman rank correlations. To investigate whether changes in a particular cell phenotype follow change determined by a single slope or bi-phasic change (determined by 2 different slopes) we did the following. We fitted the data with a model allowing biphasic change to the data to determine the slopes and the time when the slopes change. The resulting model was then compared to the model with a single slope change and using an F-test for nested models, we determined whether bi-phasic model describes the data significantly better (18). For significance we report p-value from an F-test when comparing the best model for the data against the model with no change of phenotype over time. In our analysis we log-transformed the data to normalize the behavior of residuals in the regressions.
RESULTS
Cohort Characteristics
We analyzed longitudinally 12 subtype C HIV infected subjects enrolled into the CHAVI 001 acute infection cohort. Ten out of twelve were male, and the median age of subjects was 27 years (range of 17 to 42 years). Longitudinal characteristics of absolute CD4+ T cell counts and viral loads are shown in Figure 1. Time post infection was adjusted according to Fiebig staging (16) at screening as discussed in the methods. Subjects with a viral set point >100,000 RNA copies/ml, persisting beyond the first year of infection, were classified as rapid progressors (n=5); subjects whose set point fell between 10,000-100,000 RNA copies/ml were classified as intermediate progressors (n=5) and individuals with viral set point consistently below 10,000 RNA copies/ml, were classified as slow progressors (n=2) (Figure 1A). As expected, CD4+ T cell counts of less than 350 CD4 cells/μl were observed in the rapid progressors (Figure 1B); while intermediate and slow progressors were characterized by higher CD4 counts. Of note, two individuals (CH813 and CH696) maintained CD4 counts (745 and 440 CD4+ T cells/μl, respectively) over a 2-year follow-up, despite high viremia. Viral load was negatively associated with absolute CD4+ T cell count at set point (r=-0.48, p=0.0013, data not shown).
Figure 1. Clinical characteristics of study subjects (n=12).

The course of viral loads over time (A) and absolute CD4 counts (B) in each individual. Time is defined as days post Fiebig I/II staging for each donor. Dotted horizontal lines identify 10,000 and 100,000 RNA copies/ml in (A) and 200- 350 CD4+ T cells/μl in (B). Individuals displaying viral loads consistently greater than 100,000 RNA copies/ml were classified as rapid progressors (red, n=5). Individuals with viral load below 1000 RNA copies/ml were considered as slow progressors (green, n=2). All other subjects were defined as intermediate progressors (blue, n=5).
Differential kinetics of Gag-specific CD4+ and CD8+ T cell responses
The dynamics of Gag-specific T cell responses were evaluated by analyzing the changes in the frequency of Gag-responsive IFNγ+ cells within total memory CD4+ and CD8+ T cells (excluding naïve cells) from early to chronic stage of infection. The gating strategy consistently employed for each sample is shown in supplementary Figure 1.
In the CD4 compartment, the pattern of Gag-specific IFNγ+ responses showed three profiles: i) Gag-specific CD4+ T cell responses decreasing over time in 7/12 (58%) individuals (CH10, CH976, CH162, CH164, CH198, CH1280 and CH470), where a 1.6 to 4.4-fold decay in responses were observed between early and later samples; ii) Gag-specific CD4+ T cell responses being barely detectable and consistently lower than 0.05% at any time point analyzed in 3/12 (25%) individuals (CH228, CH895 and CH067) and iii) Gag-specific CD4+ T cell responses increasing over time in 2/12 (17%) individuals (CH696 and CH813) (Figure 2). In most subjects with detectable CD4 responses (7/9, 78%), the maximal frequency of Gag-responsive CD4+ T cells were observed at a median of 28 days [IQR: 21-81] post Feibig I/II staging. Of note, the three patterns of response were unrelated to disease progression or the magnitude of viremia. To address the possibility that the apparent decay of Gag-responsive CD4+ T cell frequencies was a reflection of changes within absolute CD4+ T cells, we correlated the number of Gag-responsive CD4+ T cells per μl of blood with the frequency of Gag-specific CD4+ T cell responses and observed a positive association (p<0.0001) (Figure 3A). This would indicate that there are selective changes of absolute numbers of circulating Gag-responsive CD4+ T cells. This is further supported by the finding that no association existed between the rate of decline of Gag-responsive CD4+ T cell frequencies and the rate of decline in absolute CD4+ T cell counts (data not shown).
Figure 2. Kinetics of Gag-responsive CD4+ and CD8+ T cells.

Profiles of IFNγ positive CD8+ (blue solid lines) and CD4+ T cell responses (red solid lines) over time. IFNγ responses (left Y-axis), expressed as % of total CD4+ or CD8+ memory T cells, were analyzed by flow cytometry. The lower dotted line was set at 0.04% and considered as a postive cut-off for IFNγ responses. Viral load (VL) is denoted by open symbols (엯, solid black lines) and absolute CD4 counts as solid symbols (●, Dotted black line). The upper dotted line identifies Log10 Viral load=5 ( i.e 100,000 RNA copies/ml).
Figure 3. Profiles of Gag-responsive T cells.

(A) Correlation between absolute numbers of Gag-responsive IFNγ positive CD4+ T cells/μl of blood (calculated based on CD4 count) and the frequency of Gag-responsive IFNγ+CD4+ T cells expressed as % of total memory CD4+ T cells. Each symbol represents one studied individual, with red denoting rapid progressors, blue as intermediate progressors and green as the two controllers. (C) Longitudinal assessment of Gag-responsive IFNγ+CD8+ T cells expressed as a % of total CD8+ T cells (including naïve CD8+ T cells). Each solid line represents one studied individual, non-linear regression analyse is depicted with a black solid line (D) Comparison of time post Fiebig I/II (days) to maximal frequencies of IFNγ+ Gag-specific T cell responses in CD4+ and CD8+ T cells. Each symbol represents one individual (X: Rapid progressors, 엯: Slow progressors and ●: Intermediates progressors). Statistical comparisons were determined using non-parametric Wilcoxon matched pair t-test. Tot Memo: Total memory cells; Abs numb: Absolute number; Gag-resp: Gag-responsive cells.
In the CD8 compartment, the dynamics of Gag-specific responses showed a similar tempo over time in most of the studied individuals, where the first detectable responses occurred at a median of 72 days [IQR: 34-103] post Fiebig I/II staging (Figure 3B). The maximal frequency of Gag-responsive CD8+ T cells was reached at a median of 253 days [IQR: 136-401] post Fiebig I/II staging and regression analysis showed a significant (p=1.6×10⁻⁶) bi-phasic expansion of these cells over time (Figure 3B), reaching a plateau at around 120 days post Fiebig I/II staging.
The asynchronous nature of Gag-responsive CD4+ and CD8+ T cell kinetics was further accentuated by comparing the time to maximal frequency of Gag-responsive CD4+ and CD8+ T cells. The median peak for Gag-specific CD4+ T cell responses (at 28 days [IQR: 21-81] post Fiebig I/II staging) was significantly earlier (p=0.039) when compared to the median peak response for CD8+ T cells (at 253 days [IQR: 136-401]) (Figure 3C). Notably, in 5/9 individuals (CH164, CH10, CH696, CH162 and CH470), the first detectable Gag-specific CD4+ T cells response were observed either in the absence, or with very low frequencies, of Gag-specific IFNγ+CD8+ T cells responses. Furthermore, discordant dynamics was also confirmed by calculating the rates of overall change in the frequency of Gag-responsive IFNγ+ CD4+ and CD8+ T cells where significant difference in the slopes for the change in CD4+ and CD8+ T cell frequencies was observed (p=0.024, data not shown).
Importantly, as Gag-specific CD8+ T cell responses have been shown to emerge at a later time as compared to other HIV proteins (19-21), we wished to identify whether other regions of the proteome were targeted prior to Gag during acute infection. Supplementary Figure 2 shows that in three of the participants using previously derived ELISpot epitope mapping data using autologous peptides, responses in Nef and/or Pol were identified prior to Gag: as early as 22 days post Fiebig I/II staging. However, it was not possible to delineate whether CD4+ or CD8+ T cells imparted these responses.
Divergent cytokine profiles between Gag-responsive CD4+ and CD8+ T cells
To assess if the distinct frequencies of Gag-responsive CD4+ and CD8+ T cells over time where also accompanied by polyfunctional changes, IFNγ, TNFα and IL-2 expression levels were measured. Due to the inherent high backgrounds in TNFα and IL-2 observed in non-stimulated samples (phenomena previously described in African cohorts (22, 23)), we focused on IFNγ producing cells and measured the proportional expression of TNFα and IL-2 within IFNγ+ T cells. Representative dot plots of TNFα, IL-2 and IFNγ expression by total memory CD4+ and CD8+ T cells at less than 120 days post Fiebig I/II staging (early) and more than 120 days post Fiebig I/II staging (chronic) are shown in Figure 4A.
Figure 4. Evolution of TNFα expression profiles of Gag-responsive IFNγ positive CD4+ T cells over time.

(A) Representative dot plots of IFNγ, TNFα and IL-2 expression profiles in Gag-responsive CD4+ T cells at less than 120 days after Fiebig I/II staging (early) or more than 120 days after Fiebig I/II staging (chronic). Percentages correspond to the proportion of TNFα expressing cells within the total IFNγ+ population. Longitudinal assessment of the proportion of TNFα-expressing cells within IFNγ+CD4+ T cells (B) and CD8+ T cells (D). Non-linear regression analyses are depicted with black solid lines.
In the CD4 compartment, there was a significant biphasic increase in the proportion of Gag-responsive dual-functional CD4+ T cells (IFNγ+TNFα+) over time (p=0.001, Figure 4B), where IFNγ+CD4+ T cells co-expressing TNFα increased from a median of 55% [IQR: 46-67%] to 83% (IQR: 76-88%) from early to chronic infection. Of note, IL-2 expression within IFNγ+CD4+ T cells was at a median of 15% (IQR: 11-22%) at the earliest time-point analyzed and remained constant over time (data not shown).
In the CD8 compartment, a contrasting pattern was observed (Figure 4C). Expression levels of TNFα within IFNγ+CD8+ T cells significantly decreased over time (p=0.004) from a median of 51% (IQR: 19-72%) to 33% (IQR: 21-44%). Of note, changes in TNFα expression occurred predominantly during early infection (within the first 120 days post Fiebig I/II staging). Collectively, these data show that Gag-specific CD8+ T cell responses, which increase in magnitude over time (Figure 3B), progressively lose their ability to express TNFα, as previously described (24).
Gag-responsive CD4+ T cells lose of Ki67 and CD38 expression
We have previously shown that at 3 months post seroconversion, Gag-responsive CD4+ T cells were highly activated and that this state persisted over the first year of infection (15). In the current study, we had the opportunity to examine activation and proliferation potential much closer to the time of infection. Representative expression levels of CD38 and Ki67 in Gag-responsive IFNγ+CD4+ and CD8+ T cells are shown in Figure 5A. There was a significant decline in the proportion of Gag-responsive CD4+Ki67+ (p=7.6×10⁻⁶) and Gag-responsive CD4+CD38+ (p=0.0082) over time (Figures 5B and D). A similar significant decline in Gag-responsive CD8+ Ki67+ T cells was observed (Figure 5C), whereas the profiles of CD38+Gag-responsive CD8+ T cells were more heterogeneous amongst different individuals and did not show any significant changes over time (Figure 5E). The decay of Ki67 expression in both Gag-responsive CD4+ and CD8+ T cells was biphasic with a rapid loss of replicating cells within approximately the first 120 days. In contrast, the decay of CD38 expression levels on Gag-responsive CD4+ T cells was mono-phasic.
Figure 5. Evolution of proliferation and activation profiles of Gag-responsive IFNγ positive T cells.

(A) Representative dot plots of IFNγ, TNFα and CD38, Ki67 expression profiles in Gag-responsive CD4+ (left panel) and CD8+ (right panel) T cells at less than 120 days after Fiebig I/II staging (early) or more than 120 days after Fiebig I/II staging (chronic). The grey density plots represent total memory T cell population staining for CD38/Ki67 cells and the red dots correspond to IFNγ+ Gag-responsive T cells. Longitudinal assessments of the proportion of Ki67+IFNγ+CD4+ T cells (B) and Ki67+IFNγ+CD8+ T cells (C). Longitudinal assessments of the proportion of CD38+IFNγ+CD4+ T cells (D) and CD38+IFNγ+CD8+ T cells (E). Linear and non-linear regression analyses are depicted with black solid lines.
When we compared Gag-responsive CD4+ T cells with total memory CD4+ T cells, it was evident that antigen-responsive CD4+ T cells were significantly more activated, as measured by CD38 expression, when compared to the total memory compartment in both early and chronic infection (Figure 6). The median frequency of CD38+ cells, during early infection was 14% [IQR: 7-34%] of total CD4+ T cells and 87% [IQR: 61-95%] of Gag-responsive CD4+ T cells, (p<0.0001). During chronic infection, the median frequencies of CD38+ cells were 19% [IQR: 8-35%] and 62% [IQR: 54-84%] of total and Gag-responsive memory CD4+ T cells, respectively, p=0.0002, Figure 6). In the CD8 compartment, activation of total and Gag-responsive CD8+ T cells was similar during both early and chronic infection. These data suggest that Gag-responsive CD4+ T cells are preferentially activated within the overall CD4 compartment and specifically during early infection. Activation of CD8+ T cells appears more uniform both in specificity and over time post infection.
Figure 6. Comparison of CD38 expression levels in Gag-responsive IFNγ+ T cells and total memory T cells in early (<120 days post Fiebig I/II staging) and chronic (>120 days post Fiebig I/II staging) phase of infection.

Each symbol represents one individual (X: Rapid progressors, 엯: Slow progressors and ●: Intermediates progressors), where CD38 expression was evaluated at the maximal IFNγ+ responses measured. Statistical significance was determined using a two-tailed non-paired Mann-Whitney t test. Value of p<0.05 was considered statistically significant. Tot Memo: Total memory cells; Gag-resp: Gag-responsive cells.
Collectively, these data show that Gag-responsive CD4+ T cells show high expression of CD38 and Ki67 at the onset of infection, with Ki67+ cells being rapidly lost within the first 120 days after Fiebig I/II staging. Although the residual circulating Gag-responsive CD4+ T cells remain activated, these data suggest that these cells are not replenished.
Impact of early viremia on Gag-responsive CD4+ T cells
We hypothesized that the magnitude of viremia occurring during acute HIV infection may influence the dynamics and function of T cells. When we investigated the association between viral load and the proportion of TNFα+ cells expressed in IFNγ+ cells in early infection (before 120 days post Fiebig I/II staging) or in chronic infection (after 120 days post Fiebig I/II staging), there was a negative correlation with the Gag-responsive CD4 compartment during early infection (p=0.03) but no association with Gag-responsive CD8+ T cells at any period post infection (Figure 7A). It would thus appear that elevated viremia is associated with IFNγ+ Gag-responsive CD4+ T cells expressing low levels of TNFα during the early stage of infection. However, there was a loss of CD4+ T cell associations over time, probably reflecting the almost complete absence of circulating Gag-responsive IFNγ+TNFα− CD4+ T cells.
Figure 7. Correlations between TNFα expression, Ki67, and CD38 expressing in IFNγ+ GAG-responsive CD4+ and CD8+ T cells with viral load.
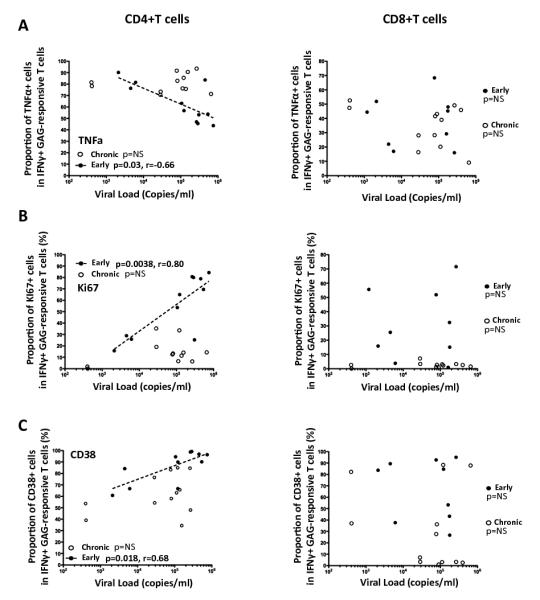
Correlations between the proportion of TNFα+ cells (A), Ki67+ cells (B) and CD38+ cells (C) within IFNγ+ Gag-responsive T cells with viral load in early (●) and chronic (엯) infection. Each symbol represents one individual, where studied markers were quantified at the maximal IFNγ+ responses measured during early (<120 days after Fiebig I/II staging) or chronic (>120 days after Fiebig I/II staging) infection. Statistical associations were performed by a two-tailed non-parametric Spearman rank correlation.
When viral load was correlated with the proportion of Ki67+ Gag-responsive CD4+ T cells, there was a highly significant positive correlation between the proportion of Ki67+ Gag-responsive CD4+ T cells and viral load but only during the early stage of infection (p=0.00038, r=0.8, Figure 7B). At the chronic stage, Gag-responsive CD4+ T cells were characterized by low expression of Ki67 (Figure 7B), despite the maintenance of relatively high viral loads. There was no correlation between the proportions of Ki67+ Gag-responsive CD8+ T cells and viral load at either the early or chronic stage of infection (Figure 7B). Similarly, CD38 expression by Gag-responsive CD4+ T cells was also positively associated with viral load during early infection (p=0.018), while no associations were found at the chronic stage or for Gag-responsive CD8+ T cells at any time point (Figure 7C). It is worthwhile also noting that the magnitude, activation level, TNFα proportion and proliferation status of Gag-responsive IFNγ+CD4+ T cells during acute infection bore no relationship with viral set point, calculated as the average viral load of the last three data points spanning 6-18 months post infection (data not shown). This would suggest that the polyfunctionality and activation status of circulating Gag-responsive CD4+ T cells, as measured during early infection, is short-term and that viral set point is independent of these early systemic events.
Together, these data suggest that during the first few months of HIV infection, antigenemia most likely shapes these early measured events and is unique to the CD4 compartment.
DISCUSSION
This paper describes the frequencies, activation profile, functional and proliferative potential of Gag-specific CD4+ and CD8+ T cell responses from acute to chronic infection, in 12 untreated subtype-C HIV-1 infected individuals. We reveal that these cells display distinct kinetics and no longer have proliferative potential by 3 months after infection.
We showed that in 68% (6/9) of individuals, where CD4 responses are detectable, the maximal frequencies of Gag-specific IFNγ+ CD4+ T cell responses were observed at the earliest time point studied. This suggests that Gag-specific CD4+ T cell responses are high in the peripheral blood during acute infection, after which the magnitude of these cells rapidly declines. The lack of detectable Gag-specific CD4+ T cell responses in the remaining 3/9 individuals could be due to missing early kinetics, where a more rapid elimination of these cells may have occurred prior to measurement. Several mechanisms may account for disappearance of these cells: a) HIV-specific CD4+ T cell contraction (25); b) preferential elimination (due to being in vivo targets for HIV) (11) and/or c) cell exhaustion (12). Support for the latter possibility is that residual Gag-responsive CD4+ T cells measured during chronic infection do not actively proliferate (26). By the time we first measured Gag-responsive IFNγ+CD4+ T cells, they were expressing high levels of Ki67, were activated and co-expressed moderate levels of TNFα. By 3 months post infection, these cells had lost Ki67 expression, showed reduced CD38 expression and there was an accumulation of TNFα in the residual cells. Loss of HIV-specific CD4+ T cell proliferative ability has been considered a hallmark of HIV infection (27-29) and our data shows this likely occurs rapidly soon after infection. We hypothesize that antigen-triggered activation of CD4+ T cells is proportional to antigen concentration during early infection, after which there is a deleterious effect on CD4+ T cell maintenance and possible renewal capacities (30). Although several publications have reported on the functional profile of HIV-specific CD4+ T cells in chronic infection (22, 31, 32), less is known about the evolution of HIV-specific CD4+ T cell function over time from the acute infection. The importance of CD4 cells during acute infection has been recently highlighted in SIV-infected rhesus macaques, where depletion of total CD4+ T cells abrogates post-peak decline of viremia (33). Although there is a decline in total Gag-responsive IFNγ+CD4+ T cells, we observed the seeming paradox of increased expression of TNFα+ within these cells. This may likely reflect the selective elimination of IFNγ+TNFα−CD4+ T cells. The resulting negative association of TNFα expression profiles in Gag-responsive CD4+ T cells with viremia during early infection, further accentuates that high antigenic burden drives functional and phenotype changes in Gag-responsive CD4+T cells. Of note, no differences in CD38 and Ki67 expression levels were observed between IFNγ+TNFα− and IFNγ+TNFα+ Gag-responsive CD4+ T cells (data not shown).
Gag-specific CD8+ T cell responses showed different kinetics in comparison to Gag-specific CD4+ T cell responses, where the magnitude of Gag-specific CD8+ T cell responses reached maximal frequencies significantly later than Gag-specific CD4+ T cell responses. Throughout the course of infection, Gag-responsive IFNγ+ CD8+ T cells accumulated but remained highly activated and lost the ability to co-express TNFα at around 120 days post Feibig I/II staging. These data corroborate reports showing progressive impairment of multi-cytokine production observed in chronically infected individuals (24). Unusual T cell response kinetics, where antigen-specific CD4 responses were detected prior to CD8 responses, such as HCV in chimpanzees (34), acute EBV infection in humans (35) and in response to live antigenic cells in mice (36). One potential explanation for the failure to detect high frequency of Gag-responsive CD8+ T cells in peripheral blood of some patients is that cells may accumulate in other compartments such as lymph nodes or in tissues at the site of infection (37-39). It is also plausible that the delayed detection of Gag protein by CD8+ T cells could be inherent to the tempo of Gag processing and presentation (40, 41) during HIV replication. MHC-class I tetramers or a more extended cytokine ICS panel would be necessary to define the exact timing of appearance of Gag-responsive CD8+ T cell responses during HIV infection. The lack of samples precluded us from measuring either of these options. Further experiments would also be required to determine separately the precise kinetics of CD4+ and CD8+ T cell responses towards other immunodominant HIV regions (such as Nef and Pol) in order to define if distinct CD4+ and CD8+ T cell kinetics observed in peripheral blood are merely specific to Gag or a general hallmark of HIV-specific responses.
We show by using markers of replication, cytokine function and activation levels, that circulating Gag-responsive CD4+ T cells generated at the onset of HIV infection are not sustainable. The rapid loss of these cells in the blood occurs regardless of the course of viremia or categories of disease progression. By the time these cells disappear, there is a significant expansion in the magnitude of Gag-responsive IFNγ+CD8+ T cells, which infers that there is a limited window of time after infection when systemic Gag-responsive CD4+ T cells are potentially functional. We speculate that preventing high levels of viral replication, with either an effective vaccine or with other early interventions, would mitigate the early loss of peripheral CD4+ T cell responses upon HIV infection.
Supplementary Material
Acknowledgments
We would like to thank the clinical site investigators, sample repository staff, specimen managers and notably the patients who were enrolled into this study.
This work was supported by funding from the NIH NIAID Center for HIV/AIDS Vaccine Immunology (grant A1067854) and by the Grand Challenges in Global Health Program of the Bill and Melinda Gates Foundation (grant 37874) (PB). PB and AJM are Jenner Institute Investigators.
Footnotes
Authorship: Conceived and designed the experiments: NG, PB, GF, MRB, BFH, AJM, CMG. Performed the experiments: CR, MM, SC, MKPL, VEW. Analyzed the data: CR, VVG. Contributed reagents/materials/analysis tools: SC, MKPL, VEW. Wrote the paper: CR, GF, PB, MRB, CMG
Disclosure: The authors have no financial conflict of interest.
REFERENCES
- 1.Whitmire JK. Induction and function of virus-specific CD4+ T cell responses. Virology. 2011;411:216–228. doi: 10.1016/j.virol.2010.12.015. [DOI] [PMC free article] [PubMed] [Google Scholar]
- 2.Altfeld M, Rosenberg ES. The role of CD4(+) T helper cells in the cytotoxic T lymphocyte response to HIV-1. Current opinion in immunology. 2000;12:375–380. doi: 10.1016/s0952-7915(00)00103-5. [DOI] [PubMed] [Google Scholar]
- 3.Reinhardt RL, Liang HE, Locksley RM. Cytokine-secreting follicular T cells shape the antibody repertoire. Nature immunology. 2009;10:385–393. doi: 10.1038/ni.1715. [DOI] [PMC free article] [PubMed] [Google Scholar]
- 4.Haynes NM. Follicular associated T cells and their B-cell helper qualities. Tissue antigens. 2008;71:97–104. doi: 10.1111/j.1399-0039.2007.00995.x. [DOI] [PubMed] [Google Scholar]
- 5.Leist TP, Kohler M, Zinkernagel RM. Impaired generation of anti-viral cytotoxicity against lymphocytic choriomeningitis and vaccinia virus in mice treated with CD4-specific monoclonal antibody. Scandinavian journal of immunology. 1989;30:679–686. doi: 10.1111/j.1365-3083.1989.tb02476.x. [DOI] [PubMed] [Google Scholar]
- 6.Maloy KJ, Burkhart C, Junt TM, Odermatt B, Oxenius A, Piali L, Zinkernagel RM, Hengartner H. CD4(+) T cell subsets during virus infection. Protective capacity depends on effector cytokine secretion and on migratory capability. The Journal of experimental medicine. 2000;191:2159–2170. doi: 10.1084/jem.191.12.2159. [DOI] [PMC free article] [PubMed] [Google Scholar]
- 7.Obar JJ, Molloy MJ, Jellison ER, Stoklasek TA, Zhang W, Usherwood EJ, Lefrancois L. CD4+ T cell regulation of CD25 expression controls development of short-lived effector CD8+ T cells in primary and secondary responses. Proceedings of the National Academy of Sciences of the United States of America. 2010;107:193–198. doi: 10.1073/pnas.0909945107. [DOI] [PMC free article] [PubMed] [Google Scholar]
- 8.Janssen EM, Lemmens EE, Wolfe T, Christen U, von Herrath MG, Schoenberger SP. CD4+ T cells are required for secondary expansion and memory in CD8+ T lymphocytes. Nature. 2003;421:852–856. doi: 10.1038/nature01441. [DOI] [PubMed] [Google Scholar]
- 9.Sun JC, Williams MA, Bevan MJ. CD4+ T cells are required for the maintenance, not programming, of memory CD8+ T cells after acute infection. Nature immunology. 2004;5:927–933. doi: 10.1038/ni1105. [DOI] [PMC free article] [PubMed] [Google Scholar]
- 10.Ramsburg EA, Publicover JM, Coppock D, Rose JK. Requirement for CD4 T cell help in maintenance of memory CD8 T cell responses is epitope dependent. J Immunol. 2007;178:6350–6358. doi: 10.4049/jimmunol.178.10.6350. [DOI] [PubMed] [Google Scholar]
- 11.Douek DC, Brenchley JM, Betts MR, Ambrozak DR, Hill BJ, Okamoto Y, Casazza JP, Kuruppu J, Kunstman K, Wolinsky S, Grossman Z, Dybul M, Oxenius A, Price DA, Connors M, Koup RA. HIV preferentially infects HIV-specific CD4+ T cells. Nature. 2002;417:95–98. doi: 10.1038/417095a. [DOI] [PubMed] [Google Scholar]
- 12.Yue FY, Kovacs CM, Dimayuga RC, Gu XX, Parks P, Kaul R, Ostrowski MA. Preferential apoptosis of HIV-1-specific CD4+ T cells. J Immunol. 2005;174:2196–2204. doi: 10.4049/jimmunol.174.4.2196. [DOI] [PubMed] [Google Scholar]
- 13.Stacey AR, Norris PJ, Qin L, Haygreen EA, Taylor E, Heitman J, Lebedeva M, DeCamp A, Li D, Grove D, Self SG, Borrow P. Induction of a striking systemic cytokine cascade prior to peak viremia in acute human immunodeficiency virus type 1 infection, in contrast to more modest and delayed responses in acute hepatitis B and C virus infections. Journal of virology. 2009;83:3719–3733. doi: 10.1128/JVI.01844-08. [DOI] [PMC free article] [PubMed] [Google Scholar]
- 14.Oxenius A, Fidler S, Brady M, Dawson SJ, Ruth K, Easterbrook PJ, Weber JN, Phillips RE, Price DA. Variable fate of virus-specific CD4(+) T cells during primary HIV-1 infection. European journal of immunology. 2001;31:3782–3788. doi: 10.1002/1521-4141(200112)31:12<3782::aid-immu3782>3.0.co;2-#. [DOI] [PubMed] [Google Scholar]
- 15.Maenetje P, Riou C, Casazza JP, Ambrozak D, Hill B, Gray G, Koup RA, de Bruyn G, Gray CM. A steady state of CD4+ T cell memory maturation and activation is established during primary subtype C HIV-1 infection. J Immunol. 2010;184:4926–4935. doi: 10.4049/jimmunol.0903771. [DOI] [PubMed] [Google Scholar]
- 16.Fiebig EW, Wright DJ, Rawal BD, Garrett PE, Schumacher RT, Peddada L, Heldebrant C, Smith R, Conrad A, Kleinman SH, Busch MP. Dynamics of HIV viremia and antibody seroconversion in plasma donors: implications for diagnosis and staging of primary HIV infection. AIDS (London, England) 2003;17:1871–1879. doi: 10.1097/00002030-200309050-00005. [DOI] [PubMed] [Google Scholar]
- 17.Goonetilleke N, Moore S, Dally L, Winstone N, Cebere I, Mahmoud A, Pinheiro S, Gillespie G, Brown D, Loach V, Roberts J, Guimaraes-Walker A, Hayes P, Loughran K, Smith C, De Bont J, Verlinde C, Vooijs D, Schmidt C, Boaz M, Gilmour J, Fast P, Dorrell L, Hanke T, McMichael AJ. Induction of multifunctional human immunodeficiency virus type 1 (HIV-1)-specific T cells capable of proliferation in healthy subjects by using a prime-boost regimen of DNA- and modified vaccinia virus Ankara-vectored vaccines expressing HIV-1 Gag coupled to CD8+ T-cell epitopes. Journal of virology. 2006;80:4717–4728. doi: 10.1128/JVI.80.10.4717-4728.2006. [DOI] [PMC free article] [PubMed] [Google Scholar]
- 18.Bates DM, Watts DG. Nonlinear regression analysis and its applications. John Wiles & Sons, Inc.; 1988. p. 365. [Google Scholar]
- 19.Addo MM, Yu XG, Rathod A, Cohen D, Eldridge RL, Strick D, Johnston MN, Corcoran C, Wurcel AG, Fitzpatrick CA, Feeney ME, Rodriguez WR, Basgoz N, Draenert R, Stone DR, Brander C, Goulder PJ, Rosenberg ES, Altfeld M, Walker BD. Comprehensive epitope analysis of human immunodeficiency virus type 1 (HIV-1)-specific T-cell responses directed against the entire expressed HIV-1 genome demonstrate broadly directed responses, but no correlation to viral load. Journal of virology. 2003;77:2081–2092. doi: 10.1128/JVI.77.3.2081-2092.2003. [DOI] [PMC free article] [PubMed] [Google Scholar]
- 20.Turnbull EL, Wong M, Wang S, Wei X, Jones NA, Conrod KE, Aldam D, Turner J, Pellegrino P, Keele BF, Williams I, Shaw GM, Borrow P. Kinetics of expansion of epitope-specific T cell responses during primary HIV-1 infection. J Immunol. 2009;182:7131–7145. doi: 10.4049/jimmunol.0803658. [DOI] [PubMed] [Google Scholar]
- 21.Lichterfeld M, Yu XG, Le Gall S, Altfeld M. Immunodominance of HIV-1-specific CD8(+) T-cell responses in acute HIV-1 infection: at the crossroads of viral and host genetics. Trends in immunology. 2005;26:166–171. doi: 10.1016/j.it.2005.01.003. [DOI] [PubMed] [Google Scholar]
- 22.Duvall MG, Precopio ML, Ambrozak DA, Jaye A, McMichael AJ, Whittle HC, Roederer M, Rowland-Jones SL, Koup RA. Polyfunctional T cell responses are a hallmark of HIV-2 infection. European journal of immunology. 2008;38:350–363. doi: 10.1002/eji.200737768. [DOI] [PMC free article] [PubMed] [Google Scholar]
- 23.Sutherland JS, Young JM, Peterson KL, Sanneh B, Whittle HC, Rowland-Jones SL, Adegbola RA, Jaye A, Ota MO. Polyfunctional CD4(+) and CD8(+) T cell responses to tuberculosis antigens in HIV-1-infected patients before and after anti-retroviral treatment. J Immunol. 2010;184:6537–6544. doi: 10.4049/jimmunol.1000399. [DOI] [PubMed] [Google Scholar]
- 24.Streeck H, Brumme ZL, Anastario M, Cohen KW, Jolin JS, Meier A, Brumme CJ, Rosenberg ES, Alter G, Allen TM, Walker BD, Altfeld M. Antigen load and viral sequence diversification determine the functional profile of HIV-1-specific CD8+ T cells. PLoS medicine. 2008;5:e100. doi: 10.1371/journal.pmed.0050100. [DOI] [PMC free article] [PubMed] [Google Scholar]
- 25.Harari A, Rizzardi GP, Ellefsen K, Ciuffreda D, Champagne P, Bart PA, Kaufmann D, Telenti A, Sahli R, Tambussi G, Kaiser L, Lazzarin A, Perrin L, Pantaleo G. Analysis of HIV-1- and CMV-specific memory CD4 T-cell responses during primary and chronic infection. Blood. 2002;100:1381–1387. doi: 10.1182/blood-2001-11-0080. [DOI] [PubMed] [Google Scholar]
- 26.Jelley-Gibbs DM, Lepak NM, Yen M, Swain SL. Two distinct stages in the transition from naive CD4 T cells to effectors, early antigen-dependent and late cytokine-driven expansion and differentiation. J Immunol. 2000;165:5017–5026. doi: 10.4049/jimmunol.165.9.5017. [DOI] [PubMed] [Google Scholar]
- 27.Wilson JD, Imami N, Watkins A, Gill J, Hay P, Gazzard B, Westby M, Gotch FM. Loss of CD4+ T cell proliferative ability but not loss of human immunodeficiency virus type 1 specificity equates with progression to disease. The Journal of infectious diseases. 2000;182:792–798. doi: 10.1086/315764. [DOI] [PubMed] [Google Scholar]
- 28.McNeil AC, Shupert WL, Iyasere CA, Hallahan CW, Mican JA, Davey RT, Jr., Connors M. High-level HIV-1 viremia suppresses viral antigen-specific CD4(+) T cell proliferation. Proceedings of the National Academy of Sciences of the United States of America. 2001;98:13878–13883. doi: 10.1073/pnas.251539598. [DOI] [PMC free article] [PubMed] [Google Scholar]
- 29.Palmer BE, Boritz E, Blyveis N, Wilson CC. Discordance between frequency of human immunodeficiency virus type 1 (HIV-1)-specific gamma interferon-producing CD4(+) T cells and HIV-1-specific lymphoproliferation in HIV-1-infected subjects with active viral replication. Journal of virology. 2002;76:5925–5936. doi: 10.1128/JVI.76.12.5925-5936.2002. [DOI] [PMC free article] [PubMed] [Google Scholar]
- 30.Han S, Asoyan A, Rabenstein H, Nakano N, Obst R. Role of antigen persistence and dose for CD4+ T-cell exhaustion and recovery. Proceedings of the National Academy of Sciences of the United States of America. 2010;107:20453–20458. doi: 10.1073/pnas.1008437107. [DOI] [PMC free article] [PubMed] [Google Scholar]
- 31.Almeida JR, Sauce D, Price DA, Papagno L, Shin SY, Moris A, Larsen M, Pancino G, Douek DC, Autran B, Saez-Cirion A, Appay V. Antigen sensitivity is a major determinant of CD8+ T-cell polyfunctionality and HIV-suppressive activity. Blood. 2009;113:6351–6360. doi: 10.1182/blood-2009-02-206557. [DOI] [PMC free article] [PubMed] [Google Scholar]
- 32.Palmer BE, Boritz E, Wilson CC. Effects of sustained HIV-1 plasma viremia on HIV-1 Gag-specific CD4+ T cell maturation and function. J Immunol. 2004;172:3337–3347. doi: 10.4049/jimmunol.172.5.3337. [DOI] [PubMed] [Google Scholar]
- 33.Ortiz AM, Klatt NR, Li B, Yi Y, Tabb B, Hao XP, Sternberg L, Lawson B, Carnathan PM, Cramer EM, Engram JC, Little DM, Ryzhova E, Gonzalez-Scarano F, Paiardini M, Ansari AA, Ratcliffe S, Else JG, Brenchley JM, Collman RG, Estes JD, Derdeyn CA, Silvestri G. Depletion of CD4+ T cells abrogates post-peak decline of viremia in SIV-infected rhesus macaques. Journal of Clinical Investigation. 2011;121 doi: 10.1172/JCI46023. [DOI] [PMC free article] [PubMed] [Google Scholar]
- 34.Nascimbeni M, Mizukoshi E, Bosmann M, Major ME, Mihalik K, Rice CM, Feinstone SM, Rehermann B. Kinetics of CD4+ and CD8+ memory T-cell responses during hepatitis C virus rechallenge of previously recovered chimpanzees. Journal of virology. 2003;77:4781–4793. doi: 10.1128/JVI.77.8.4781-4793.2003. [DOI] [PMC free article] [PubMed] [Google Scholar]
- 35.Precopio ML, Sullivan JL, Willard C, Somasundaran M, Luzuriaga K. Differential kinetics and specificity of EBV-specific CD4+ and CD8+ T cells during primary infection. J Immunol. 2003;170:2590–2598. doi: 10.4049/jimmunol.170.5.2590. [DOI] [PubMed] [Google Scholar]
- 36.Tyznik AJ, Bevan MJ. The surprising kinetics of the T cell response to live antigenic cells. J Immunol. 2007;179:4988–4995. doi: 10.4049/jimmunol.179.8.4988. [DOI] [PMC free article] [PubMed] [Google Scholar]
- 37.Brodie SJ, Patterson BK, Lewinsohn DA, Diem K, Spach D, Greenberg PD, Riddell SR, Corey L. HIV-specific cytotoxic T lymphocytes traffic to lymph nodes and localize at sites of HIV replication and cell death. The Journal of clinical investigation. 2000;105:1407–1417. doi: 10.1172/JCI8707. [DOI] [PMC free article] [PubMed] [Google Scholar] [Retracted]
- 38.Altfeld M, van Lunzen J, Frahm N, Yu XG, Schneider C, Eldridge RL, Feeney ME, Meyer-Olson D, Stellbrink HJ, Walker BD. Expansion of pre-existing, lymph node-localized CD8+ T cells during supervised treatment interruptions in chronic HIV-1 infection. The Journal of clinical investigation. 2002;109:837–843. doi: 10.1172/JCI14789. [DOI] [PMC free article] [PubMed] [Google Scholar]
- 39.Connick E, Mattila T, Folkvord JM, Schlichtemeier R, Meditz AL, Ray MG, McCarter MD, Mawhinney S, Hage A, White C, Skinner PJ. CTL fail to accumulate at sites of HIV-1 replication in lymphoid tissue. J Immunol. 2007;178:6975–6983. doi: 10.4049/jimmunol.178.11.6975. [DOI] [PubMed] [Google Scholar]
- 40.Sacha JB, Reynolds MR, Buechler MB, Chung C, Jonas AK, Wallace LT, Weiler AM, Lee W, Piaskowski SM, Soma T, Friedrich TC, Wilson NA, Watkins DI. Differential antigen presentation kinetics of CD8+ T-cell epitopes derived from the same viral protein. Journal of virology. 2008;82:9293–9298. doi: 10.1128/JVI.00749-08. [DOI] [PMC free article] [PubMed] [Google Scholar]
- 41.Probst HC, Tschannen K, Gallimore A, Martinic M, Basler M, Dumrese T, Jones E, van den Broek MF. Immunodominance of an antiviral cytotoxic T cell response is shaped by the kinetics of viral protein expression. J Immunol. 2003;171:5415–5422. doi: 10.4049/jimmunol.171.10.5415. [DOI] [PubMed] [Google Scholar]
Associated Data
This section collects any data citations, data availability statements, or supplementary materials included in this article.