Abstract
Green Fluorescent Protein (GFP) and related fluorescent proteins (FPs) have been widely used to tag proteins, allowing their expression and subcellular localization to be examined in real time in living cells and animals. Similar fluorescent methods are highly desirable to detect and track RNA and other biological molecules in living cells. For this purpose, we have developed a group of RNA aptamers that bind GFP and related proteins, which we term Fluorescent Protein-Binding Aptamers (FPBA). These aptamers bind GFP, YFP and CFP with low nanomolar affinity and binding decreases GFP fluorescence, whereas slightly augmenting YFP and CFP brightness. Aptamer binding results in an increase in the pKa of EGFP, decreasing the 475 nm excited green fluorescence at a given pH. We report the secondary structure of FPBA and the ability to synthesize functional multivalent dendrimers. FPBA expressed in live cells decreased GFP fluorescence in a valency-dependent manner, indicating that the RNA aptamers function within cells. The development of aptamers that bind fluorescent proteins with high affinity and alter their function, markedly expands their use in the study of biological pathways.
INTRODUCTION
Green Fluorescent Protein (GFP) is a natural fluorescing protein produced by the jellyfish Aequorea Victoria (1), and a member of an expanding family of naturally occurring and synthetic fluorescent proteins (FPs) that share a three amino acid fluorophore surrounded by an 11-strand β-barrel cage (2–5). Because these proteins tolerate N- and C-terminal fusion to a broad variety of proteins, as well as circular permutation and splitting, they have been used extensively as fluorescent protein tags (6), genetic sensors (7) and in complementation screens (8). As a fusion protein, FPs have been extensively used to determine protein location and function in live cells and animals (9). The range of tools that provide equivalent capabilities for non-protein biological molecules are quite limited, however, limiting knowledge on their roles in cell function.
RNA aptamers are generated by applying genetic selection directly to a population of RNA molecules through a process termed in vitro selection or SELEX, which emulates Darwinian evolution (10,11). Appropriate target selection and screening yields aptamers that are capable of binding to a wide variety of targets with high affinity and specificity. These structural RNAs often bind their targets with dissociation constants (Kd) in the low nanomolar or picomolar range and are able to discriminate between related proteins that share common structural features (12,13). Many aptamers have been developed as protein antagonists in basic research and therapeutic intervention (14,15). Another area of aptamer utility is to provide tags in molecular detection. For example, an aptamer directed to streptavidin can be used as an affinity tag to purify RNA-binding proteins (16) and an aptamer for malachite green can be used to detect small molecules by fluorescence (17).
In order to combine the selection power of structural RNAs with the real-time detection advantages of genetically encodable fluorophores, we sought to develop genetically encodable, RNA aptamers that bind with high affinity to FPs. Here, we describe the development of a group of RNA aptamers that bind GFP and related FPs with low nanomolar affinity. We have optimized the highest affinity aptamer, AP3, to a short form by deletion, substitution and further SELEX and verified the secondary structure of three stem–loops emerging from a three-way junction. Interestingly, AP3 modulates the fluorescence of GFP and its derivatives in different ways, inhibiting GFP and enhanced green fluorescent protein (EGFP) fluorescence, while enhancing ECFP and EYFP fluorescence. We further show that mono- and multi-valent forms of AP3 can be genetically encoded and function within live cells. By linking these aptamers to those selected for other biological targets, FP-binding aptamers markedly expand the range of biological targets that can be tracked by FPs.
MATERIALS AND METHODS
Proteins and oligonucleotides
For targets used in selections, non-His-tagged GFP was purchased from BD Clontech, His-tagged GFP from Upstate Biotech. To generate recombinant expression plasmids, the coding regions corresponding to Azami-green, GFP, EGFP, EYFP and ECFP were amplified by Phusion High-Fidelity DNA polymerase (BioLabs) and cloned into the pRSET (Invitrogen) and pGST-parallel vectors (18). For binding assays, the His- or glutathione S-transferase (GST)-tagged proteins were produced in transformed BL21 (DE3) pLysS Escherichia coli cells and purified by Profinity IMAC Ni-Charged Resin (Bio-Rad) and Glutathione Sepharose 4B resin (GE Healthcare), respectively.
DNA oligos were synthesized by Integrated DNA Technologies. RNA was in vitro transcribed by MEGAshortscript and MAXIscript Kits (Ambion).
In vitro selection of aptamers
Aptamers for GFP were selected in two stages, both according to protocols described previously (19,20) with the following modifications. In the first stage, an unbiased sequence pool described previously was used to isolate two families of aptamers G3 and G16. In the second stage, the starting material was a new pool based on the G16 core sequence (underlined in pool sequence). This second pool has the following sequence: GGGAGCACGAUUCCAU-N45-GAAUUGGGUGGGGAAAGUCCUGAAAAGAGGGCCACC-N40-UACAAGCUUCUGG ACUCGGU. The DNA template was generated by annealing and bi-directionally extending by the Klenow fragment the following synthetic oligonucleotides. Forward: GTAATACGACTCACTATAGGGAGCACGATTCCAT-N45-GAATTGGGTGGGGAAAGTCC (T7 promoter sequence is underlined); Reverse: ACCGAGTCCAGAAGCTTGTA-N40-GGTGGCCCTCTTTTCAGGACTTTCCCCACCCAATTC. In both stages, the partitioning matrix was alternated between nitrocellulose membrane and Profinity IMAC Ni-Charged Resin (Bio-Rad). The binding buffer was 1× phosphate buffered saline (PBS) (PH 7.2) with 10 mM MgCl2. When the Ni-Charged Resin is used, 0.8 ml Handee Centrifuge columns (PIERCE) were used to hold the beads for binding, washing and elution.
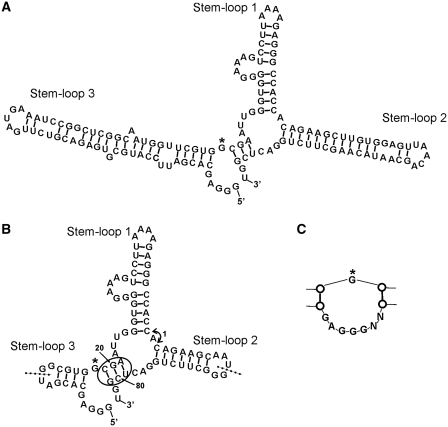
To confirm the secondary structure and optimize Stem–loop 3 of AP3, a circular permutated RNA pool was generated by introducing 5′-/3′-ends to the hairpin loop of Stem–loop 2 and randomizing the intact Stem–loop 3 and flank junction loop (see the sequences 1–25 and 76–83 in Figure 5B for coordinates). A selection was performed according to the procedure described above.
Figure 5.
Confirmed secondary structure of AP3. (A) Schematic diagram of the secondary structure of AP3 (143 nt). Stem–loop 1 was formed by the core sequence from G16. (B) Secondary structure of minimized AP3 (83 nt). Stem–loop 2 and Stem–loop 3 were shortened by truncating from the apex loops of both Stem–loops inward. New random loops were added to the apexes of both minimized stems. The circle indicates site where addition of paired nucleotides between positions 20/21 and 79/80 does not alter binding to GFP, whereas addition of single nucleotide at either site resulted in loss of binding, confirming the stem structure in this region. Insertion of nucleotides between Stem–loop 1 and Stem–loop 2 (arrow 1) also reduced binding to GFP. Dotted lines show other 5′-/3′-ends of fully functional circular permutated aptamers. (C) Re-selection of Stem–loop 3 resulted in reduction of the internal loop (G marked by asterisk in A and B for orientation). Removal of nucleotides within this loop, even a single nucleotide deletion from either the 5′- or 3′-end in the form shown in (A), resulted in loss of function.
Aptamer-binding assays
For nitrocellulose filter-binding assays; 32P-labeled RNA probes were prepared using the MAXIscript T7 in vitro transcription kit (Ambion) and [α-32P]UTP (GE Healthcare). All binding assays were performed in 100 µl volumes in 1x PBS with 5 mM MgCl2 (PH 7.2). A typical binding assay mixture contained 32P-labeled RNA probe (1 × 10⁶ cpm) and different amounts of protein. The binding reaction was incubated at 37°C for 30–60 min before loading on to the Minifold I Slot-Blot System (Whatman). The nitrocellulose membrane (Bio-Rad Laboratories) was pre-wet with 1× binding buffer (see above) and washed with 1000 µl of 1× binding buffer afterwards. The membrane was exposed to a Kodak BioMax MS film for 1–3 h. The properly exposed signals within each slot on the filter were quantified using the ImageJ program.
For electrophoretic mobility shift assays (EMSA); 32P-labeled RNA probes were prepared by in vitro transcription reactions with T7 RNA polymerase and [α-32P]UTP (GE Healthcare). A typical 20 µl binding reaction contained 32P-labeled RNA probe (1 × 10⁵ cpm), different amounts of proteins in 1× PBS with 5 mM MgCl2 (PH 7.2). The binding reaction was incubated at room temperature for 30 min before loading on to pre-run 6% native polyacrylamide gel prepared and run with 0.5× TBE containing 5 mM MgCl2. Gels were run at 180 V for 40 min at 4°C and then dried on a Whatman paper and exposed to phosphoimager screens overnight. The exposed screens were scanned with Typhoon 9400 scanner and analyzed with ImageQuant software (Molecular Dynamics).
Isothermal titration calorimetry (ITC) experiments were carried out at 22°C on a Microcal (Northampton, MA, USA) VP-ITC microcalorimeter. GFP and aptamer was prepared in 1× PBS (pH 7.2). Four micro molar AP3-1 or 2 µM dimeric AP3 was placed in sample cell with a volume of 1.6 ml and binding isotherms were recorded following the 40 injections of 60 µM GFP (5 µl each), while continuously stirring at 329 rpm. Dilution heats were determined by titration of GFP into buffer and subtracted from the raw aptamer titration data. Data were processed and analyzed using a non-linear least squares fit to one site binding model using Origin software (Microcal).
Fluorescence and photo-physical measurements
Fluorescence emission spectra were collected using either a FluoroMax-3 spectrofluorometer (JY Horiba, Edison, NJ, USA) or a QuantaMaster 40 (PTI, Birmingham, NJ, USA). Aptamer and fluorescence proteins were prepared in buffer 1: 1× PBS (pH 7.4) with 5 mM MgCl2 (Figures 3 and 4A and B), or buffer 2: 120 mM KCl, 5 mM NaCl, 1 mM MgCl, 10 mM MES, 10 mM MOPS and 10 mM citrate (pH titration experiments). Fluorescence intensities were measured by exciting at 475 nm for GFP and EGFP, 453 nm for ECFP and 513 nm for EYFP. Absorbance measurements were carried out using a Cary 300 dual beam spectrophotometer (Varian, Palo Alto, CA, USA). Data from the EGFP pH titration experiments were fit to A + B/(1 – 10(nH(pKa-pH))) where nH is the Hill coefficient (21).
Figure 3.
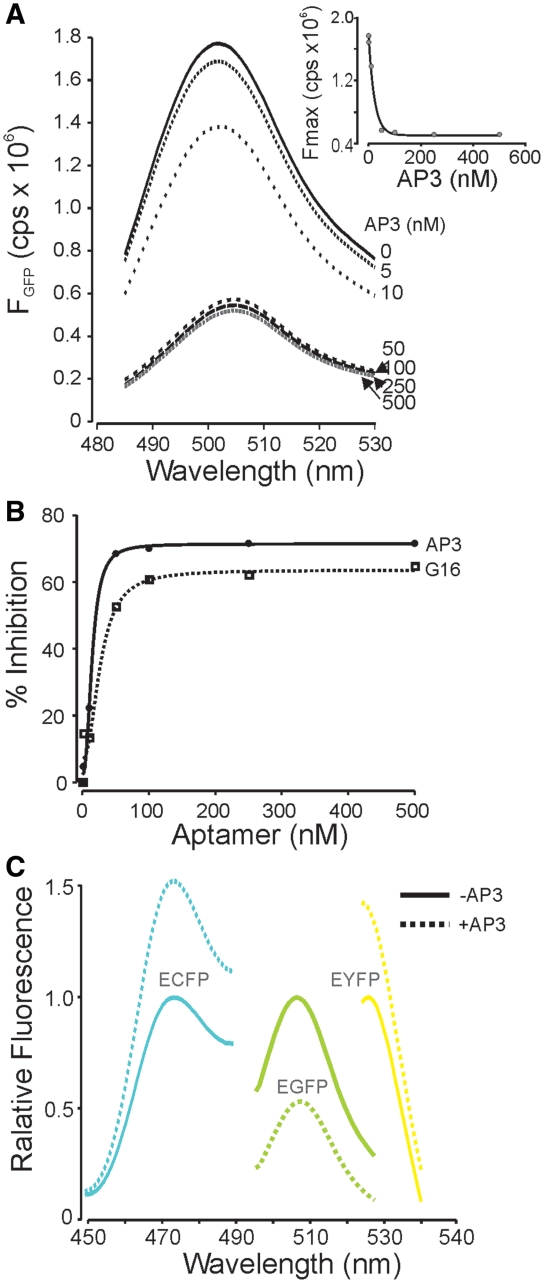
FPBAs alter protein fluorescence. (A) Emission scan (475 nm excitation) of GFP in the presence of increasing concentrations of AP3. Inset shows dose-dependent inhibition of fluorescence at 505 nm; GFP concentration was 25 nM. No aptamers displayed measurable fluorescence and the original unselected aptamer pool did not alter GFP fluorescence (not shown). (B) Inhibition of GFP fluorescence by G16 and AP3 (475/505), showing higher affinity and greater maximum effect of AP3. (C) Fluorescence emission scans of enhanced FPs show the distinct functional effects of AP3. All spectra are normalized to peak fluorescence in the absence of AP3 and reflect 10 nM of FP and 250 nM AP3. Note increase in ECFP and EYFP fluorescence in the presence of AP3.
Figure 4.
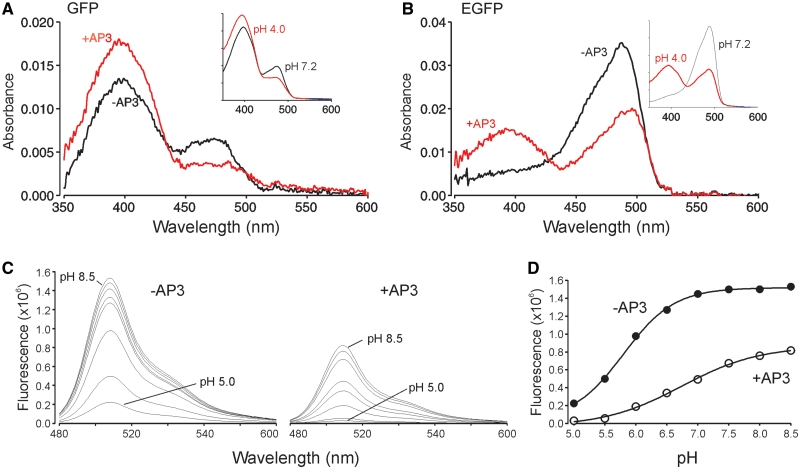
FPBAs alter flurorescent properties. (A) Absorbance spectrum of 200 nM GFP in the presence and absence of 5 µM AP3 at pH 7.4. Insert shows spectra of GFP (no AP3 present) taken at pH 7.2 and 4.0 for comparison. The fluorescence of GFP excited at 475 nm in the presence of AP3 was 30% (Figure 3B) of the GFP without AP3, whereas the pH 4 shift reduced the fluorescence intensity to 47% of the pH 7.2 value. (B) Absorbance spectrum of 400 nM EGFP in the presence and absence of 5 µM AP3 at pH 7.4. Insert shows spectra of EGFP (no AP3 present) taken at pH 7.2 and 4.0 for comparison. The fluorescence of EGFP excited at 475 nm in the presence of AP3 was 45% (Figure 3C) of the EGFP without AP3, whereas the shift to pH 4 reduced the fluorescence intensity by nearly an equal amount to 57% of the pH 7.2 value. (C) pH titration curves of EGFP without and with AP3 bound. (D) pKa of eGFP in the presence and absence of the AP3 aptamer. Respectively, pKa = 5.8 (−AP3) and pKa = 6.7 (+AP3).
Measurements of the EGFP-AP3-1 association rate at pH 7.2 and pH 6.0 were carried out on a KinTek SF-2004 stopped-flow instrument using 100 nM EGFP and varying amounts of AP3-1 in buffer 2. The decreasing fluorescence signal due to AP3-1 binding was well fit by a single exponential. AP3-1 off rates were measured in a wash-out experiment by imaging the increase in fluorescence after a buffer change in NTA-Ni cover slip imaging chambers with His-EGFP bound and previously exposed to ~2 µM AP3-1. The EGFP coated surface was imaged using a Zeiss 510 confocal microscope and 488 nm laser line. Laser power, gain settings and time course parameters were first determined to allow the image series to be taken without any measurable photobleaching. After taking the time zero image, AP3-1 containing buffer was removed and fresh buffer solution (buffer 2) without AP3-1 was added. Images were taken every 30 s for 12 min and the mean pixel value was fit to A(1−exp(−koff t)).
In vivo expression of aptamers
Saccharomyces cerevisiae expressing GFP-tagged SPC42 protein of spindle pole body [MATa, ade2-1, trp1-1, can1-100, leu2-3, 112, his3-11, 15, ura3, Gal+, psi+, ssd1-d2 (cla1), spc42Δ1::LEU2, TRP1::SPC42-GFP] was obtained from Tim Huffaker (Cornell University). High level of GFP aptamer expression in yeast was achieved by homing GFP aptamer containing Tetrahymena thermophila group I intron TtLSU1 into yeast rDNA loci as described previously (22). Briefly, SPC42-GFP yeast cells were first transformed with I-PpoI homing endonuclease expression construct (pCPIPpo) and subsequently with constructs encoding TtLSU1 group I intron containing AP3-1 monomer, heterodimer formed by AP3-1 and AP3-2 and tetramer (two tandem dimers with a ClaI in between) in correct orientation, as well as monomeric AP3-1 in reverse orientation or no aptamer as negative controls. Homed yeast were cured of the plasmids by culturing multiple generations in YPD media and homing was confirmed by PCR analysis of rDNA loci using genomic DNA as template. For analysis of GFP fluorescence; homed yeast were cultured in synthetic defined media and fluorescence images (~10 0.5 µm z-stacks) were taken with Zeiss Axioplan II microscope using FITC/RSGFP filter set (HQ480/40 x, Q505LP, HQ535/50 m) and analyzed with Volocity software (Improvision, MA, USA). Mean fluorescence intensity of spindle pole bodies from each yeast transformant were plotted. SPC42-GFP expression levels were compared with western blot analysis using anti-GFP antibody (Abcam) and anti-yTFIIB antibody (23) as a loading control.
RESULTS
Identification of FP-binding RNA aptamers
The β-barrel structure of GFP appears to have a low surface complexity, which may explain a previously unsuccessful attempt to isolate aptamers with high affinity to GFP (24). Consistent with this conjecture, initial conventional SELEX experiments with nitrocellulose as the partitioning device resulted in the progressive enrichment of membrane-binding sequences, despite repeated negative selections against membrane binding and RNaseH digestion of membrane-binding sequences (25). To overcome this problem, we alternated nitrocellulose membrane-bound GFP selection rounds with selection against His-tagged GFP bound to Ni-charged beads. Negative selection with nitrocellulose membrane or Ni-charged beads was employed at each step. This procedure resulted in strong selection pressure on the RNA pool, which consisted of two 25 nt primers flanking a 50 nt random core (Figure 1A). Following 15 iterations of binding and amplification, the sequenced RNA pool consisted of multiple copies of two highly related families, G3 and G16 (Figure 1A), both of which displayed submicromolar binding affinities in nitrocellulose filter-binding assays (Figure 1B). These species were highly enriched after 15 rounds of SELEX and showed no membrane-binding affinity. However, six other RNA species that bound to both GFP and nitrocellulose membrane, were identified at an earlier stage of SELEX (10 rounds) when G3 and G16 were enriched by >80% (Supplementary Figure S1). These results indicate that negative selection with nitrocellulose membrane eliminates RNAs that bind both membrane and GFP, thus affecting the abundance and enrichment of GFP-binding RNA species.
Figure 1.
Selected evolution of FPBA. (A) Aptamer sequences isolated from the first stage of SELEX. All 36 selected sequences of the 50 nt randomized region of the full length isolates comprised two families of highly related sequences. Varying residues within individual families are underlined. The first aptamer of each family was used in nitrocellulose filter-binding assays in Part B. (B) Radioactive (P32) aptamer binding to GFP immobilized on nitrocellulose demonstrates the higher affinity of G16 relative to the G3 family. (C) Aptamer sequences selected following a second stage of SELEX in which the fixed regions flanking the G16 core were optimized. About 11 other single copy sequences from a total 36 clones were not shown. The flanking sequences shared by all selected molecules are underlined. Note the shorted 3′ sequences of AP2 and AP3. (D) The nitrocellulose filter-binding assay shows the higher affinity of the selected aptamers relative to G16.
G16 aptamer binding appeared to depend on the constant flanking regions, as deletion of these regions diminished activity (data not shown), suggesting that further increases in affinity might be achieved by a second selection process that optimized the fixed regions. A new RNA pool consisting of the core 36 nt binding sequence from G16 and the common core secondary structure shared by families G3 and G16, flanked by randomized regions of 45 nt (5′) and 40 nt (3′), with different constant 5′ and 3′ sequences was synthesized (Figure 1C). A quantity of 100 µg pool RNA containing ~1015 unique sequences was used in the first round and subjected to 12 SELEX rounds using alternating membrane and bead selection steps. As shown in Figure 1D, clones from this selection showed distinctly higher binding affinity than G16, with AP3 demonstrating the highest binding. Sequencing of individual clones again revealed multiple highly related RNAs with the two most abundant clones, AP2 and AP3, found to be shortened within the 3′ random sequence, either due to rare copies of shortened template DNA in the original pool or to PCR errors during the multiple rounds of amplification.
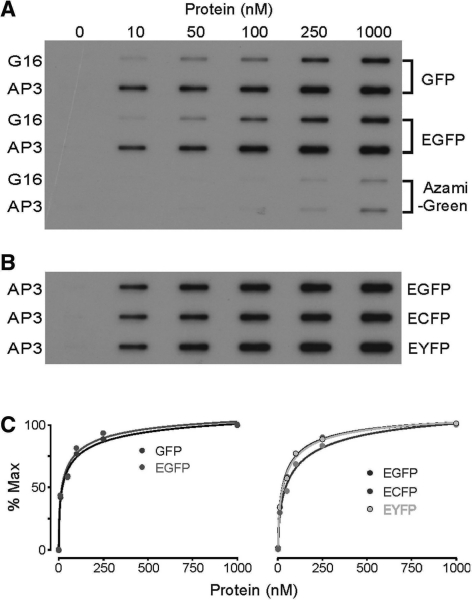
We next compared the binding of G16 and AP3 to GFP and other FPs. Aequorea victoria-derived fluorescent proteins are highly homologous at the level of primary sequence and overall structure, with EGFP differing only by the F64L and S65T amino acid substitutions (26), and yellow and cyan derivatives differing by five and four residues from EGFP, respectively (27,28). As shown in Figure 2A, both aptamers bound GFP and EGFP with roughly equivalent affinity, with AP3 demonstrating an ~5-fold greater affinity for both proteins relative to G16. Moreover, both aptamers bound the coral protein Azami-Green, which shares the overall 11-stranded β-barrel structure but diverges considerably in primary sequence (29), albeit with markedly lower affinity. Importantly, AP3 binds GFP and its derivatives with high affinity (Figure 2A–C); binding of AP3 to this broad range of commonly used FPs markedly increases its potential utility.
Figure 2.
Binding of FBPAs to GFPs and spectrally shifted GFP variants. (A) Comparison of G16 and AP3 binding to FPs show that AP3 binds GFP and EGFP with higher affinity than G16, and that binding to the coral protein Azami-green is of much lower affinity. (B) Filter-binding assay shows similar affinity of AP3 to GFP-related proteins. (C) Hill plot fits of data shown in (A) and (B) show similar affinity of AP3 to GFP-related proteins.
FP-binding aptamers binding alters GFP fluorescence
During the iterative SELEX steps in the development of FP binding aptamers (FPBA), we observed a progressive loss of fluorescence of the immobilized GFP, suggesting an inhibition of GFP fluorescence by aptamer binding. We confirmed this observation using purified G3 and G16 aptamer. In contrast, earlier round aptamers that bound to both GFP and the nitrocellulose membrane had no effect on GFP fluorescence. We next quantitatively examined the effect of AP3, the highest affinity aptamer, on GFP fluorescence. In the presence of a fixed amount of purified GFP protein at pH 7.4, addition of AP3 aptamer decreased fluorescence in a dose dependent manner to ~30% of its original level (Figure 3A). The maximum fluorescence inhibition for GFP was 70.8 and 64.0%, for AP3 and G16, respectively (Figure 3B). Neither the pre-selected aptamer pool nor binding buffer had any effect on GFP fluorescence. The AP3 aptamer also reduced the fluorescence of EGFP by ~55% at pH 7.4 (Figure 3C). However, the functional effect on fluorescence was not equivalent for all GFP derivatives; the AP3 aptamer increased ECFP and EYFP fluorescence (Figure 3C), an effect that was not observed in the pre-selected aptamer pool.
To examine the photophysical mechanism by which aptamer binding alters fluorescence, we first measured the absorbance spectra of GFP and EGFP in the presence and absence of the AP3 aptamer at pH 7.4. Aptamer binding decreased 475 nm, and increased 395 nm, absorbance (Figure 4A and B), an effect that mimics the pH-dependent shift observed in GFP fluorescence associated with chromophore protonation (inset, Figure 4A and B). We reasoned that the simplest explanation for the observed fluorescence inhibition would be a conformational change associated with aptamer binding that resulted in a shift in the relative proportions of protonated (395 nm absorbing) and unprotonated (475 nm absorbing) species of the chromophore at a given pH (30,31). This assumption was verified by measuring the pKa of EGFP in the presence and absence of AP3 (Figure 4C and D). At 475 nm excitation, the pKa of EGFP was 5.8, with a Hill coefficient of 1.0, in the absence of AP3, in agreement with previous reports (32,33). In the presence of AP3, the pKa shifts to 6.7, consistent with an increase in proton accessibility to the hydroxyl group of Tyr-66, the primary chromophore protonation site.
Secondary structure of FPBA
To determine the secondary structure of AP3, we examined the predicted common structure shared by several AP3-related clones from the secondary selection procedure using mfold (34,35). This analysis predicted a general structure of three stem–loops around a central junction loop, as shown in Figure 5A. Stem–loop 1 was formed by the core sequence from G16, and was also predicted in G3. Nucleotide additions, substitutions and mutations were performed to further confirm this secondary structure. As shown in Figure 5B, we minimized Stem–loop 2 and Stem–loop 3 until further inward deletion decreased or eliminated AP3 activity. For example, at least 7 bp within Stem–loop 2 were required to maintain the full function of the aptamer; shortening the stem–loop markedly decreased function. The added loops at the apexes of minimized Stem–loop 2 and Stem–loop 3 could vary in both size and nucleotide sequence. Following minimization of the stem–loop lengths, base pairing was confirmed by selected substitutions that destabilized specific stem–loops. Within the minimized 7 bp of Stem–loop 2, the sequence of the first six pairs (from the end of the stem–loop inward) could be substituted with no loss in function, whereas changes in the C-G pair at the junction loop resulted in a slight decrease in function. As shown (circle in Figure 5B), the addition of paired nucleotides between positions 20/21 and 79/80 in Stem–loop 3 resulted in no loss of function, whereas single nucleotide additions at either of these positions completely eliminated function, confirming the stack structure in this region. The junction loop region was also altered by nucleotide additions; insertions within the central loop retained full function, although the angle between Stem–loops 1 and 2 (double-headed arrow in Figure 5B) was critical, as insertion of a single nucleotide reduced quenching of GFP fluorescence to 50%. Next, we further tested our base pairing model by creating circularly permutated aptamers, introducing 5′-/3′-ends to Stem–loop 2 or Stem–loop 3 (dotted lines in Figure 5B). These circularly permutated aptamers retained full function, further confirming the predicted structure. Finally, the structure of Stem–loop 3 was verified by additional selected evolution. A new RNA pool with 5′- and 3′-ends at the apex of Stem–loop 2 was synthesized by replacing the Stem–loop 3 and the flanking junction loop with 50 randomized nucleotides and SELEX was performed. In total, 22 highly related sequences were selected by this process, each of which consisted of two stacks separated by a variation of the interior loop contained within Stem–loop 3 (Figure 5C).
Optimization and dendrimerization of FPBAs
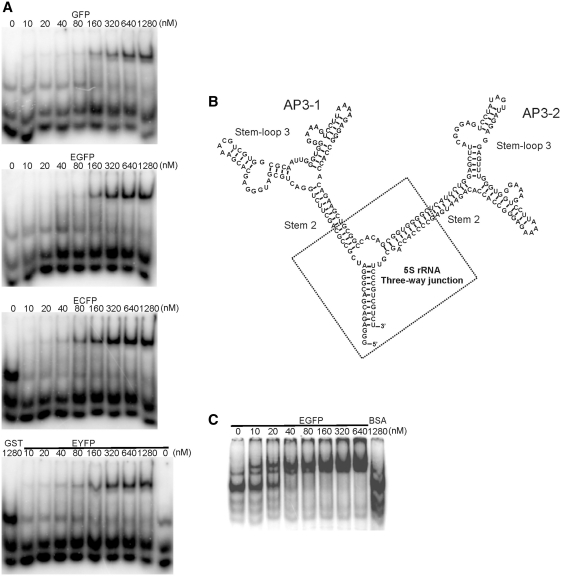
A single nucleotide deletion from either the 5′- or 3′-end of the original AP3 (Figure 5A) resulted in loss of function, indicating the critical nature of the interior loop of Stem–loop 3 (Figure 5C). However, Stem–loop 2 could tolerate nucleotide substitutions and a circularly permutated AP3 made by introducing 5′-/3′-ends to the hairpin loop of Stem–loop 2 was fully functional. Combining the secondary structures of minimized AP3 (Figure 5B) and the sequences from the independent re-selection of Stem–loop 3, we designed two new aptamers containing the optimized Stem–loop 3 and the 5′-/3′-ends at Stem–loop 2 (AP3-1 and AP3-2 respectively). The minimized AP3-1 and AP3-2 aptamers inhibited GFP fluorescence to the same degree as the original AP3 (data not shown). Binding of the optimized short AP3 to GFP derivatives was further confirmed in EMSA, using GST-tagged fluorescent proteins and AP3-1 aptamer (Figure 6A).
Figure 6.
Optimized short AP3 and dimeric AP3. (A) EMSA assay of optimized short AP3. AP3-1 has similar binding affinity to GFP, EGFP, ECFP and EYFP. GST protein is a negative control. (B) The secondary structure of dimeric AP3. AP3-1 and AP3-2 were fused by a H.marisortui 5 s rRNA-type three-way junction. (C) EMSA assay of AP3 dimer with EGFP. Bovine serum albumin is a negative control.
We reasoned that synthesis of multimeric FPBAs would enable their use as a scaffold to enhance fluorescence signals in subcellular tracking studies. To test this concept, we developed a dimeric construct by connecting AP3-1 and AP3-2 at Stem–loop 2, the region that tolerated nucleotide substitution, with a Haloarcula marisortui 5 s rRNA-type three-way junction (Figure 6B). Binding of the dimeric aptamer to EGFP was confirmed in the EMSA assay (Figure 6C).
FPBA-binding affinity deterimination
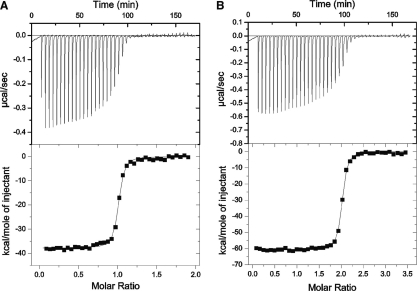
We measured the AP3-1 binding affinity to GFP and EGFP in two ways. First, we used ITC to measure aptamer–GFP-binding affinity. Calorimetric titration was performed by injection of fixed amounts of GFP into a sample cell containing aptamer. As shown in Figure 7A, we measured a Kd of 5.1 nM for AP3-1. Second, from kinetics data using stopped flow (kon) and confocal fluorescence measurements of washout of AP3-1 from immobilized NTA-Ni bound EGFP (koff), we calculated a Kd of ~4.6 nM for AP3-1 (Supplementary Figure S2). Thus the selected aptamers directly interact with low nanomolar affinity with fluorescent proteins. A similar binding affinity was obtained for the dimeric aptamer by ITC (3.2 nM, Figure 7B), however saturation occurred at a molar ratio (GFP/aptamer) of approximately twice that of the monomer, indicating an increased binding capacity of the divalent aptamer. Analysis of the dimeric-GFP calorimetry data using models of two independent sites and sequential-binding sites was consistent with each unit of the dimeric aptamer (AP3-1 or AP3-2) binding independently to a molecule of GFP with the similar binding affinity (~3.2 nM).
Figure 7.
Isothermal titration calorimetry of GFP–aptamer interactions. (A) Titration of GFP into aptamer AP3-1, the solid line in the bottom panel corresponds to ΔH = −37.82 kcal/mol, Kb = 1.98 × 10⁸ M−1, and N = 1. (B) Titration of GFP into dimeric AP3, the solid line in the bottom panel corresponds to ΔH = −56.5 kcal/mol, Kb = 3.16 × 108.M−1, and N = 2. Top panel of (A, B): raw data after baseline correction. Bottom panel of (A, B): integrated data corrected for the heat of dilution of the GFP. The solid line in the bottom panel represents the best fit to one-site binding model. Note the shift in titration of the dimer to a high molar ratio of GFP/aptamer.
In Vivo function of FPBAs
If the interaction between FPs and FPBA can be visually detected in live cells, this molecular pair could be used as a reporting module for a real time biosensor. To determine whether FBPA bind and alter fluorescence in cells, we tested the AP3 aptamer in S. cerevisiae, expressing a GFP-tagged SPC42 subunit of the spindle pole body, as these yeast display a distinct fluorescence pattern with one or two well defined spots per cell, depending on the cell cycle stage (36). To achieve a high level of aptamer sufficient to interact stochiometrically with SPC42 proteins, we employed a previously developed aptamer expression system (22), which utilizes the group I intron homing process to insert an intron-aptamer into the middle of hundreds of rDNA copies (37). This system, composed of a group I intron, TtLSU1 from the ciliate Tetrahymena thermophila (38) and a homing endonuclease, I-PpoI from the slime mold Physarum polycephalum (39), produces high RNA polymerase I transcription without additional promoters. The coding sequence for the optimized short AP3 aptamers were inserted into the TtLSU1 intron as an extension of its P1 stem.
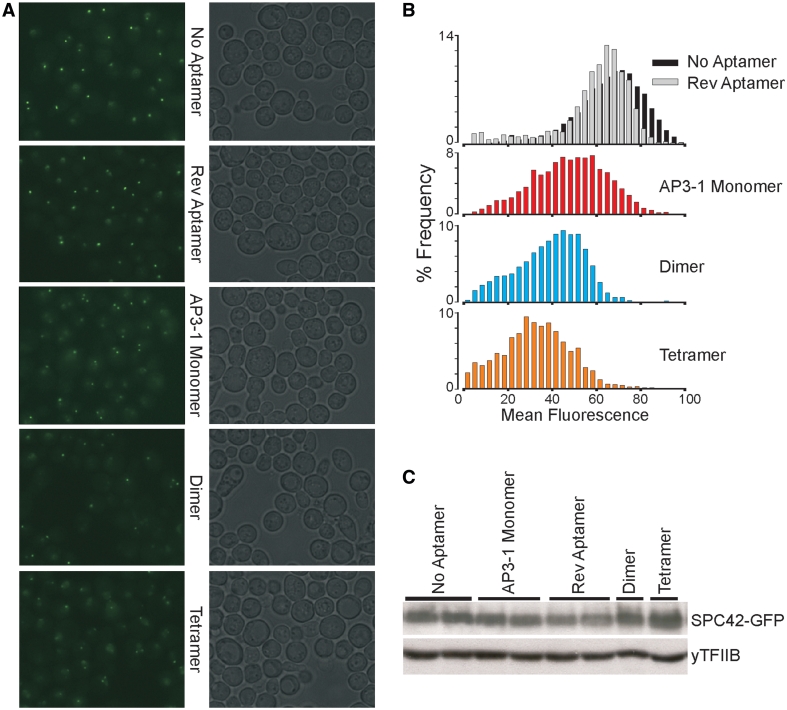
Expression of monomeric, dimeric or tetrameric (two tandem repeats of dimeric) optimized short AP3 aptamer constructs resulted in a decrease in local fluorescence intensity (Figure 8A and B). Dimer spindle pole bodies were observed as the copy number of aptamer coding sequence increased, consistent with the function of multimeric constructs in live cells. The western blot analysis of whole cell extracts from homed yeast strains confirmed that altered expression of GFP and yTFIIB in AP3 yeast does not explain the results (Figure 8C). A slight decrease in SPC42-GFP levels in reverse GFP aptamer expressing yeast may account for the slight decrease in fluorescence when compared with parental cell line. Taken together, these results indicate that FPBA function in living cells.
Figure 8.
AP3 inhibits GFP fluorescence in vivo. (A) Fluorescence microscopy of yeast cells that co-express SPC42-GFP and the optimized short AP3. Each fluorescence image is paired with a differential interference contrast image. Monomeric, dimeric and tetrameric AP3 expressions were tested, with monomeric AP3-1 in reverse orientation or no aptamer as negative controls. Expression of optimized short AP3 decreased the local fluorescence intensity and dimer spindle pole bodies were observed as the copy number of aptamer coding sequence increase. (B) Histogram of the fluorescent signals from experiments shown in (A). Mean fluorescence intensity decreased as the copy number of AP3 coding sequencing increase. (C) Confirming SPC42-GFP expression with western blot analysis. Altered expression of GFP in different strains does not explain the results of (A) and (B).
DISCUSSION
We have identified RNA aptamers that bind to GFP and its derivatives (EGFP, ECFP and EYFP). These FPBAs display high affinity and the most promising and highly selected family, AP3, binds GFP with an apparent Kd of ~5 nM. The ability of this aptamer family to bind tightly to such widely used protein tags should prove useful for developing a variety of applications that allow detection of fluorescently tagged proteins. One potential application of this family of aptamers is to dynamically track cellular molecules by tethering them to FPs through hetero-valent aptamers, where one arm binds the FP and the others a desired target. In this regard, the potential amplification of fluorescent signals by multivalent aptamers provides an important potential advantage in the detection of molecular interactions. Our construction of functional dimeric aptamer (Figure 6B) demonstrates the feasibility of this approach, and highly branched AP3 aptamers that bind multiple ECFP or EYFP molecules and bring these to a particular cellular site based on the binding specificity of a single attached aptamer targeted to a biological molecule of interest could be of broad utility. Such a strategy might compensate for the difficulty of using genetically encoded fluorescent proteins in single molecule studies due to their relatively low extinction coefficient.
The ability of FPBAs to alter the fluorescence properties of the target fluorophores suggests an additional potential application as detectors of the level of specific molecules. AP3 reduced the fluorescence of GFP to ~30% of control, while slightly augmenting ECFP and EYFP fluorescence. These features make the aptamer a potentially useful signaling module for RNA-based molecular detectors, for example, if fluorophore binding can be functionally linked to the binding of a second aptamer selected to a specific target. The 3-fold signal range of the aptamer/GFP fluorescence shift in vitro compares favorably with the range of many commonly used FRET-based sensors (40,41). One limitation of this approach, however, is the requirement of aptamer expression at the level of GFP to achieve the full dynamic range of this interaction. The ability to sustain high aptamer concentrations in the cytosolic compartment of cells remains a significant challenge.
In summary, we have developed RNA aptamers that bind widely used, genetically encoded fluorescent proteins. These FPBA are functional in live cells and can be multiplexed to augment their function. Future experiments will seek to exploit this system to provide an enhanced set of tools to probe molecular interactions in live cells.
SUPPLEMENTARY DATA
Supplementary Data are available at NAR Online: Supplementary Figures 1 and 2.
FUNDING
The National Institutes of Health(grants R21EB006782, DA30329 and P41-EB01976). Funding for open access charge: Dr M. Kotlikoff, Cornell University.
Conflict of interest statement. None declared.
Supplementary Material
ACKNOWLEDGEMENTS
We thank Dr Xingfu Xu and Dr William A. Horne for kindly providing us with MicroCal VP-ITC microcalorimeter and help with analysis of ITC data.
REFERENCES
- 1.Morin JG, Hastings JW. Energy transfer in a bioluminescent system. J. Cell Physiol. 1971;77:313–318. doi: 10.1002/jcp.1040770305. [DOI] [PubMed] [Google Scholar]
- 2.Chalfie M, Tu Y, Euskirchen G, Ward WW, Prasher DC. Green fluorescent protein as a marker for gene expression. Science. 1994;263:802–805. doi: 10.1126/science.8303295. [DOI] [PubMed] [Google Scholar]
- 3.Heim R, Prasher DC, Tsien RY. Wavelength mutations and posttranslational autoxidation of green fluorescent protein. Proc. Natl Acad. Sci. USA. 1994;91:12501–12504. doi: 10.1073/pnas.91.26.12501. [DOI] [PMC free article] [PubMed] [Google Scholar]
- 4.Matz MV, Fradkov AF, Labas YA, Savitsky AP, Zaraisky AG, Markelov ML, Lukyanov SA. Fluorescent proteins from nonbioluminescent Anthozoa species. Nat. Biotechnol. 1999;17:969–973. doi: 10.1038/13657. [DOI] [PubMed] [Google Scholar]
- 5.Shaner NC, Campbell RE, Steinbach PA, Giepmans BN, Palmer AE, Tsien RY. Improved monomeric red, orange and yellow fluorescent proteins derived from Discosoma sp. red fluorescent protein. Nat. Biotechnol. 2004;22:1567–1572. doi: 10.1038/nbt1037. [DOI] [PubMed] [Google Scholar]
- 6.Wang S, Hazelrigg T. Implications for bcd mRNA localization from spatial distribution of exu protein in Drosophila oogenesis. Nature. 1994;369:400–403. doi: 10.1038/369400a0. [DOI] [PubMed] [Google Scholar]
- 7.Baird GS, Zacharias DA, Tsien RY. Circular permutation and receptor insertion within green fluorescent proteins. Proc. Natl Acad. Sci. USA. 1999;96:11241–11246. doi: 10.1073/pnas.96.20.11241. [DOI] [PMC free article] [PubMed] [Google Scholar]
- 8.Zhang S, Ma C, Chalfie M. Combinatorial marking of cells and organelles with reconstituted fluorescent proteins. Cell. 2004;119:137–144. doi: 10.1016/j.cell.2004.09.012. [DOI] [PubMed] [Google Scholar]
- 9.Giepmans BN, Adams SR, Ellisman MH, Tsien RY. The fluorescent toolbox for assessing protein location and function. Science. 2006;312:217–224. doi: 10.1126/science.1124618. [DOI] [PubMed] [Google Scholar]
- 10.Tuerk C, Gold L. Systematic evolution of ligands by exponential enrichment: RNA ligands to bacteriophage T4 DNA polymerase. Science. 1990;249:505–510. doi: 10.1126/science.2200121. [DOI] [PubMed] [Google Scholar]
- 11.Ellington AD, Szostak JW. In vitro selection of RNA molecules that bind specific ligands. Nature. 1990;346:818–822. doi: 10.1038/346818a0. [DOI] [PubMed] [Google Scholar]
- 12.Wilson DS, Szostak JW. In vitro selection of functional nucleic acids. Annu. Rev. Biochem. 1999;68:611–647. doi: 10.1146/annurev.biochem.68.1.611. [DOI] [PubMed] [Google Scholar]
- 13.Gold L. Oligonucleotides as research, diagnostic, and therapeutic agents. J. Biol. Chem. 1995;270:13581–13584. doi: 10.1074/jbc.270.23.13581. [DOI] [PubMed] [Google Scholar]
- 14.Famulok M, Blind M, Mayer G. Intramers as promising new tools in functional proteomics. Chem. Biol. 2001;8:931–939. doi: 10.1016/s1074-5521(01)00070-9. [DOI] [PubMed] [Google Scholar]
- 15.Nimjee SM, Rusconi CP, Sullenger BA. Aptamers: an emerging class of therapeutics. Annu. Rev. Med. 2005;56:555–583. doi: 10.1146/annurev.med.56.062904.144915. [DOI] [PubMed] [Google Scholar]
- 16.Srisawat C, Engelke DR. Streptavidin aptamers: affinity tags for the study of RNAs and ribonucleoproteins. RNA. 2001;7:632–641. doi: 10.1017/s135583820100245x. [DOI] [PMC free article] [PubMed] [Google Scholar]
- 17.Stojanovic MN, Kolpashchikov DM. Modular aptameric sensors. J. Am. Chem. Soc. 2004;126:9266–9270. doi: 10.1021/ja032013t. [DOI] [PubMed] [Google Scholar]
- 18.Sheffield P, Garrard S, Derewenda Z. Overcoming expression and purification problems of RhoGDI using a family of "parallel" expression vectors. Protein Expr. Purif. 1999;15:34–39. doi: 10.1006/prep.1998.1003. [DOI] [PubMed] [Google Scholar]
- 19.Shi H, Hoffman BE, Lis JT. A specific RNA hairpin loop structure binds the RNA recognition motifs of the Drosophila SR protein B52. Mol. Cell Biol. 1997;17:2649–2657. doi: 10.1128/mcb.17.5.2649. [DOI] [PMC free article] [PubMed] [Google Scholar]
- 20.Fan X, Shi H, Adelman K, Lis JT. Probing TBP interactions in transcription initiation and reinitiation with RNA aptamers that act in distinct modes. Proc. Natl Acad. Sci. USA. 2004;101:6934–6939. doi: 10.1073/pnas.0401523101. [DOI] [PMC free article] [PubMed] [Google Scholar]
- 21.Kneen M, Farinas J, Li Y, Verkman AS. Green fluorescent protein as a noninvasive intracellular pH indicator. Biophys. J. 1998;74:1591–1599. doi: 10.1016/S0006-3495(98)77870-1. [DOI] [PMC free article] [PubMed] [Google Scholar]
- 22.Wang S, Zhao X, Suran R, Vogt VM, Lis JT, Shi H. Knocking down gene function with an RNA aptamer expressed as part of an intron. Nucleic Acids Res. 2010;38:e154. doi: 10.1093/nar/gkq529. [DOI] [PMC free article] [PubMed] [Google Scholar]
- 23.Sevilimedu A, Shi H, Lis JT. TFIIB aptamers inhibit transcription by perturbing PIC formation at distinct stages. Nucleic Acids Res. 2008;36:3118–3127. doi: 10.1093/nar/gkn163. [DOI] [PMC free article] [PubMed] [Google Scholar]
- 24.Stanlis KK, McIntosh JR. Single-strand DNA aptamers as probes for protein localization in cells. J. Histochem. Cytochem. 2003;51:797–808. doi: 10.1177/002215540305100611. [DOI] [PubMed] [Google Scholar]
- 25.Shi H, Fan X, Ni Z, Lis JT. Evolutionary dynamics and population control during in vitro selection and amplification with multiple targets. RNA. 2002;8:1461–1470. doi: 10.1017/s1355838202029941. [DOI] [PMC free article] [PubMed] [Google Scholar]
- 26.Cormack BP, Valdivia RH, Falkow S. FACS-optimized mutants of the green fluorescent protein (GFP) Gene. 1996;173:33–38. doi: 10.1016/0378-1119(95)00685-0. [DOI] [PubMed] [Google Scholar]
- 27.Ormo M, Cubitt AB, Kallio K, Gross LA, Tsien RY, Remington SJ. Crystal structure of the Aequorea victoria green fluorescent protein. Science. 1996;273:1392–1395. doi: 10.1126/science.273.5280.1392. [DOI] [PubMed] [Google Scholar]
- 28.Heim R, Tsien RY. Engineering green fluorescent protein for improved brightness, longer wavelengths and fluorescence resonance energy transfer. Curr. Biol. 1996;6:178–182. doi: 10.1016/s0960-9822(02)00450-5. [DOI] [PubMed] [Google Scholar]
- 29.Karasawa S, Araki T, Yamamoto-Hino M, Miyawaki A. A green-emitting fluorescent protein from Galaxeidae coral and its monomeric version for use in fluorescent labeling. J. Biol. Chem. 2003;278:34167–34171. doi: 10.1074/jbc.M304063200. [DOI] [PubMed] [Google Scholar]
- 30.Patterson GH, Knobel SM, Sharif WD, Kain SR, Piston DW. Use of the green fluorescent protein and its mutants in quantitative fluorescence microscopy. Biophys. J. 1997;73:2782–2790. doi: 10.1016/S0006-3495(97)78307-3. [DOI] [PMC free article] [PubMed] [Google Scholar]
- 31.Wang Q, Shui B, Kotlikoff MI, Sondermann H. Structural basis for calcium sensing by GCaMP2. Structure. 2008;16:1817–1827. doi: 10.1016/j.str.2008.10.008. [DOI] [PMC free article] [PubMed] [Google Scholar]
- 32.Chattoraj M, King BA, Bublitz GU, Boxer SG. Ultra-fast excited state dynamics in green fluorescent protein: multiple states and proton transfer. Proc. Natl Acad. Sci. USA. 1996;93:8362–8367. doi: 10.1073/pnas.93.16.8362. [DOI] [PMC free article] [PubMed] [Google Scholar]
- 33.Haupts U, Maiti S, Schwille P, Webb WW. Dynamics of fluorescence fluctuations in green fluorescent protein observed by fluorescence correlation spectroscopy. Proc. Natl Acad. Sci. USA. 1998;95:13573–13578. doi: 10.1073/pnas.95.23.13573. [DOI] [PMC free article] [PubMed] [Google Scholar]
- 34.Mathews DH, Sabina J, Zuker M, Turner DH. Expanded sequence dependence of thermodynamic parameters improves prediction of RNA secondary structure. J. Mol. Biol. 1999;288:911–940. doi: 10.1006/jmbi.1999.2700. [DOI] [PubMed] [Google Scholar]
- 35.Zuker M. Mfold web server for nucleic acid folding and hybridization prediction. Nucleic Acids Res. 2003;31:3406–3415. doi: 10.1093/nar/gkg595. [DOI] [PMC free article] [PubMed] [Google Scholar]
- 36.Donaldson AD, Kilmartin JV. Spc42p: a phosphorylated component of the S. cerevisiae spindle pole body (SPD) with an essential function during SPB duplication. J. Cell Biol. 1996;132:887–901. doi: 10.1083/jcb.132.5.887. [DOI] [PMC free article] [PubMed] [Google Scholar]
- 37.Lin J, Vogt VM. I-PpoI, the endonuclease encoded by the group I intron PpLSU3, is expressed from an RNA polymerase I transcript. Mol. Cell Biol. 1998;18:5809–5817. doi: 10.1128/mcb.18.10.5809. [DOI] [PMC free article] [PubMed] [Google Scholar]
- 38.Brehm SL, Cech TR. Fate of an intervening sequence ribonucleic acid: excision and cyclization of the Tetrahymena ribosomal ribonucleic acid intervening sequence in vivo. Biochemistry. 1983;22:2390–2397. doi: 10.1021/bi00279a014. [DOI] [PubMed] [Google Scholar]
- 39.Ellison EL, Vogt VM. Interaction of the intron-encoded mobility endonuclease I-PpoI with its target site. Mol. Cell Biol. 1993;13:7531–7539. doi: 10.1128/mcb.13.12.7531. [DOI] [PMC free article] [PubMed] [Google Scholar]
- 40.Pollok BA, Heim R. Using GFP in FRET-based applications. Trends Cell Biol. 1999;9:57–60. doi: 10.1016/s0962-8924(98)01434-2. [DOI] [PubMed] [Google Scholar]
- 41.Fehr M, Frommer WB, Lalonde S. Visualization of maltose uptake in living yeast cells by fluorescent nanosensors. Proc. Natl Acad. Sci. USA. 2002;99:9846–9851. doi: 10.1073/pnas.142089199. [DOI] [PMC free article] [PubMed] [Google Scholar]
Associated Data
This section collects any data citations, data availability statements, or supplementary materials included in this article.


