


Abstract
Simple sequence repeats (SSRs) are indel mutational hotspots in genomes. In prokaryotes, SSR loci can cause phase variation, a microbial survival strategy that relies on stochastic, reversible on–off switching of gene activity. By analyzing multiple strains of 42 fully sequenced prokaryotic species, we measure the relative variability and density distribution of SSRs in coding regions. We demonstrate that repeat type strongly influences indel mutation rates, and that the most mutable types are most strongly avoided across genomes. We thoroughly characterize SSR density and variability as a function of N→C position along protein sequences. Using codon-shuffling algorithms that preserve amino acid sequence, we assess evolutionary pressures on SSRs. We find that coding sequences suppress repeats in the middle of proteins, and enrich repeats near termini, yielding U-shaped SSR density curves. We show that for many species this characteristic shape can be attributed to purely biophysical constraints of protein structure. In multiple cases, however, particularly in certain pathogenic bacteria, we observe over enrichment of SSRs near protein N-termini significantly beyond expectation based on structural constraints. This increases the probability that frameshifts result in non-functional proteins, revealing that these species may evolutionarily tune SSR positions in coding regions to facilitate phase variation.
INTRODUCTION
Simple sequence repeats (SSRs), or microsatellites, are known to increase the probability of slipped-strand mutation during DNA replication, mRNA transcription and protein translation (1,2). In coding regions, these mutational events result in small indels in DNA that change the SSR length and can cause a change in amino acid sequence and/or a frameshift mutation (3). In promoter regions, SSR length variation can affect promoter activity and regulation (4,5). Although SSR-associated indels in different genomic regions have different influences on phenotypes, they share a common feature: reversibility. Unlike point mutations, which are practically irreversible at typical mutation rates, the expansion/contraction of SSRs (6,7) provides one of the simplest and most prevalent reversible stochastic switching mechanisms in microorganisms, commonly known as ‘phase variation’. SSRs are also critical in repeat expansion diseases, such as Huntington's disease (8) and in rapidly evolving traits (9,10).
SSR motifs located in promoter and coding regions have been implicated in phase variation phenomena for many prokaryotic species (11–13). In coding regions, the small indels generated by SSRs can cause frameshifts that result in truncated or elongated proteins with disrupted protein function. Although frameshift mutations are often regarded as deleterious, under fluctuating selection they can be advantageous (14,15). Many examples of phase variation involve frameshift mutations affecting membrane proteins such as pili (16), receptors (17) and transporters (18), supporting the idea that these SSRs facilitate adaptation to external environmental fluctuations (19). Phase variation mechanisms also influence the motility of bacteria, including switching from motile to non-motile behavior (20) and switching from swarming to non-swarming (21). Phase variable genes that confer adaptive advantage in fluctuating conditions are known as contingency loci (12), and several theoretical works have addressed the advantages of stochastic switching in fluctuating environments (22–27).
Previous studies of SSRs have assessed the frequency statistics of SSRs of different lengths and types in different genomes, by comparison with SSR statistics expected for different null models, ranging from Markovian models based on nucleotide composition and correlations, to synonymous codon shuffling models, which consider codon usage biases for each gene (28–30). These studies showed that long SSRs (∼10 bp or longer for monomeric and dimeric repeats) are generally selected against in most genomes, presumably due to their high mutability; while exceptional cases of SSR enrichment could be found for certain species and certain SSR lengths. It was also shown that the occurrence of monomeric SSRs is higher in N-terminal regions of protein coding genes (28,31).
While previous works characterized facets of the distribution of SSRs in genomes, they have not addressed critical components of their evolution: the genome-wide variability of SSR loci and the effects of selection. The higher mutability of SSRs is for the most part demonstrated by laboratory studies that measured variability for a relatively small number of SSR loci in a limited number of bacterial species. The reliance on length distributions as the main genomic measure of SSRs in many previous studies largely precludes drawing conclusions regarding the effect of selection on SSRs. The positional biases of SSRs observed in (31) have not been investigated with regards to several biologically relevant factors. For example, whether they are due to biophysical constraints on protein coding sequences, or other structural constraints on DNA sequences, has not been addressed, hence the origin and role of these biases remains poorly understood.
In this study, we utilize intraspecies sequence comparison to measure SSR variability in coding regions. We show that SSR-associated indel variation depends on the types, lengths and the N→C relative position of SSRs. We also find that SSRs are suppressed in a majority but not in all species, with multiple species specifically enhancing the frequencies of SSRs. In each genome, we measure the density of SSRs as a function of N→C relative position, which we call the SSR density curve. By constructing synonymous codon-shuffled sequences that preserve the amino acid sequence, we isolate the contribution of protein primary sequence to the SSR density, which allows us to investigate additional evolutionary mechanisms that affect the positioning of SSRs within genes. We show that while the biophysical constraints of protein structure can account for certain trends we observe—specifically the symmetrical U-shaped SSR density curves—they do not fully explain the data. In multiple species, strongly asymmetrical curves are observed, often with a pronounced enhancement of repeats near the N-terminal. We argue this asymmetry may be a signature of enhanced phase variation in certain genomes.
MATERIALS AND METHODS
Homolog clusters and multiple sequence alignment
All prokaryotic coding sequence files were downloaded from the NCBI genome database. We chose species having at least four fully-sequenced strains. Analysis was performed using customized Perl scripts for sequence analysis and Matlab scripts for numerical analysis. Within each species, homologs of each gene were found by blasting each coding sequence in each strain against all coding sequences in every other strain. Mutually highest scoring sequences, that had an E-value <10−5, were defined as homologs. We then constructed a homolog network in which genes were nodes and homologs were indicated by edges between nodes. We identified the maximal linked clusters, which we called homolog clusters. By construction, homolog clusters are equivalence relations and every gene belongs to a unique homolog cluster. Homolog clusters that contain only a single sequence were ignored in the analysis. Genes in homolog clusters were aligned by the multiple sequence alignment algorithm MUSCLE (32).
Identifying SSRs and SSR loci within homolog clusters
We first identified SSRs for each coding sequence in each homolog cluster. Across all sequences contained in a cluster, we identified all instances of sequence motifs composed of consecutive k-mer repeats for k = 1, 2, … 10. Only sequence motifs longer than or equal to a cutoff length were defined to be SSRs. The cutoff length for k = 1 (monomeric SSRs) was 6 bp, and for k ≥ 2 we used 3*k (bp) as the cutoff. This initial recognition step identifies only perfect repeat sequences.
Within the cluster's multiple sequence alignment, we defined each region to be an SSR locus if the region contained at least one SSR. If two SSRs overlap at least 2 bp in the alignment, they were assigned to the same SSR locus. The total region of an SSR locus was defined by the union of all of its overlapping SSRs. Each SSR locus was identified by type according to its assigned SSRs. SSR types that are circular permutations of the same repeat motif were considered the same type. The smallest possible repeat motif was assigned as the repeat unit (e.g. ATATATATATAT was considered a dimeric rather than tetrameric repeat). In principle, our definition allows nested SSR loci. For example, a single sequence (AAAAAATTTT)x3 will be counted as four SSR loci: three polyA SSRs each with length 6, and one 10-mer SSR with length 30. However, after manual inspection we found that these cases are so rare they have no effect on any results reported here.
At each SSR locus, we tested each aligned sequence for presence or absence of the SSR. If the SSR was absent, we checked whether the SSR was a degenerated SSR. To determine this, we compared the flanking sequence of the SSR locus (12-bp upstream and downstream, if the sequences exist) as follows: for a given sequence not containing the SSR, if its flanking sequence had >70% average identity to the aligned sequences that contained the SSR, we defined the sequence as a degenerated SSR. At each SSR locus, only those sequences containing SSRs or degenerated SSRs were included in the pairwise calculation of SSR variability (πI). This final recognition of SSRs based on homology with perfect SSRs allows imperfect SSRs to be detected and used for our statistical measures.
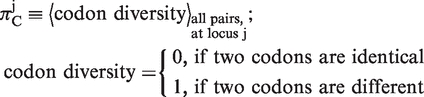
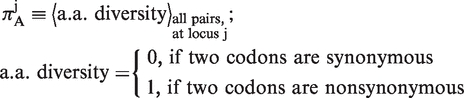
Calculating variability indices πC, πA and πI
To calculate πC and πA, we first translated the coding sequence into amino acid sequence for each homologous CDS, and used the multiple sequence alignment algorithm MUSCLE (32) to align amino acid sequences. At each aligned codon position j, we used the following formulas to calculate , which measures variability in both synonymous and non-synonymous substitutions, and
  , which measures solely non-synonymous substitutions:
 |
 |
By averaging values of  and
and  over all aligned codon positions, we obtained πC and πA, respectively.
To calculate πI at each SSR locus k, we identified all homologous sequences that contained an SSR or a degenerated SSR, as described above. For each sequence at locus k, we found the total length of all indels within the SSR locus, and obtain  by averaging the indel diversity over all pairs of sequences:
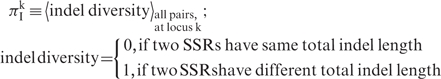 |
Finally, we averaged  over all SSR loci to obtain πI.
Synonymous codon shuffling of coding sequences
We performed synonymous codon shufflings for each species, and re-calculated the SSR statistics based on the shuffled sequences. Two synonymous shuffling methods were used: (i) global shuffling—for each genome, we used the global codon bias to reconstruct the total coding sequence preserving amino acid identities but drawing synonymous codons randomly from the genome's codon-biased statistics; (ii) local shuffling—for each gene's coding sequence, we use the gene's codon bias to reconstruct a synonymous coding sequence.
The original and shuffled SSR density of a given species were define by following formula:
where  is number of SSRs found in gene k of strain j; and
  is the length of the ORF of gene k in strain j. Similarly, for SSR densities conditioned on either type or N→C position, we used the same formula, with
  indicating the number of SSRs of the given type or position. Both shuffling schemes were performed five times for all coding sequences in all genomes. The results were averaged, and error bars shown in figures were calculated using the standard error over realizations. We provide a flow chart to explain the shuffling method in Supplementary Figure S5.
RESULTS
Identifying SSRs and associated indels
To infer variability of SSRs in prokaryotic protein coding sequences (CDS), we analyzed 42 species having four or more fully sequenced and annotated strains. SSRs were defined for monomeric, dimeric, trimeric, all the way to k-meric (with k = 10) sequence repeats with given minimal length cutoffs (see ‘Materials and Methods’ section). For each species, homologous coding sequences among different strains were identified and multiple sequence alignment was used to align homologs. SSRs that aligned across sequences were defined as homologous SSRs, and the locations of SSRs were identified as SSR loci (see ‘Materials and Methods’ section). For each SSR locus, we could observe variation in SSR length due to point mutations or indels. We computationally recorded indels associated with each SSR locus. For each species, we found thousands of SSR loci located in coding sequences; the percent of SSRs with an associated indel, which depended on the divergence between strains, varied across species from 0.1 to 7%, with an average of 1.6% (Supplementary Table S1).
Variability of SSR-associated indels and intraspecies divergence
To measure the variability of SSR-associated indels, we used standard population genetics quantities, slightly modified to work with SSRs and indels in multiple sequence comparisons. The variability at a locus, ranging from 0 to 1, was defined as the probability that two individuals differ at the locus. At each aligned amino acid position, we measured variability separately at the level of codons and at the level of amino acids. Averaging over all aligned positions, we obtained two different variability measures: the codon variability πC and the amino acid variability πA (see ‘Materials and Methods’ section). At each SSR locus, we measured an indel-associated variability; averaging over all SSR loci, we obtained the indel variability index, πI (see ‘Materials and Methods’ section).
Since variability increases on average with genetic distance, the three variability indices (see Table 1) are correlated, which is seen in the log-log plots in Figure 1. Across species, πC and πA exhibit strong correlation since they are closely-related measures of overall divergence. It is likewise not surprising to see the index πI positively correlates with both πC and πA, since the latter two measure the overall divergence time separating the strains within each species: the longer the divergence time, the more indels can be generated. More interestingly, πI is almost exclusively less than πA in all species, implying that indel evolution at typical SSR loci is slower than non-synonymous codon substitution. Two factors explain this result: (i) short SSRs are not particularly mutable yet they constitute the majority of SSRs, (ii) indel mutations are more deleterious than most of the non-synonymous mutations, and fewer survive over time (see ‘Discussion’ section). We will see in the next section that for long SSRs, the variability index of SSR-associated indels do greatly exceed πA.
Table 1.
List of species names and abbreviations, and the three variability indices, πC, πA and πI
| Abbreviation | Species name |  |
 |
 |
|---|---|---|---|---|
| Ab | Acinetobacter baumannii | 0.0189 | 0.0610 | 0.0074 |
| Ban | Bacillus anthracis | 0.0077 | 0.0186 | 0.0063 |
| Bc | Bacillus cereus | 0.0762 | 0.2053 | 0.0084 |
| Bl | Bifidobacterium longum | 0.0451 | 0.1062 | 0.0080 |
| Bap | Buchnera aphidicola | 0.2734 | 0.4446 | 0.0277 |
| Bcn | Burkhoderia cenocepacia | 0.0254 | 0.0795 | 0.0045 |
| Bm | Burkhoderia mallei | 0.0117 | 0.0143 | 0.0049 |
| Bp | Burkhoderia pseudomallei | 0.0248 | 0.0364 | 0.0102 |
| Cj | Campylobacter jejuni | 0.0397 | 0.0914 | 0.0086 |
| CSm | Candidatus Sulcia muelleri | 0.1794 | 0.2692 | 0.0468 |
| Ct | Chlamydia trachomatis | 0.0082 | 0.0155 | 0.0033 |
| Cpn | Chlamydophia pneumoniae | 0.0056 | 0.0067 | 0.0009 |
| Cbo | Clostridium botulinum | 0.0832 | 0.1615 | 0.0073 |
| Cbu | Coxiella burnetii | 0.0136 | 0.0180 | 0.0094 |
| CP | Cynothece PCC | 0.2024 | 0.4047 | 0.0098 |
| Ec | Escherichia coli | 0.0403 | 0.0951 | 0.0119 |
| Ft | Francisella tularensis | 0.0150 | 0.0265 | 0.0078 |
| Hi | Haemophilus influenzae | 0.0254 | 0.0796 | 0.0126 |
| Hp | Helicobacter pylori | 0.0640 | 0.1442 | 0.0169 |
| Ll | Lactococcus lactis | 0.0686 | 0.2302 | 0.0084 |
| Lp | Legionella pneumophia | 0.0278 | 0.0797 | 0.0036 |
| Lm | Listeria monocytogenes | 0.0247 | 0.1188 | 0.0032 |
| Mm | Methanococcus maripaludis | 0.0906 | 0.2786 | 0.0057 |
| Mt | Mycobacterium tuberculosis | 0.0056 | 0.0069 | 0.0015 |
| Nm | Neisseria meningitidis | 0.0294 | 0.0784 | 0.0085 |
| Pm | Prochlorococcus marinus | 0.1781 | 0.3567 | 0.0131 |
| Pa | Pseudomonas aeruginosa | 0.0305 | 0.0984 | 0.0041 |
| Pp | Pseudomonas putida | 0.0770 | 0.2836 | 0.0045 |
| Rs | Rhodobacter sphaeroides | 0.0621 | 0.1806 | 0.0069 |
| Rp | Rhodopseudomonas palustris | 0.1754 | 0.3657 | 0.0222 |
| Se | Salmonella entericia | 0.0299 | 0.0752 | 0.0048 |
| Sb | Shewanella baltica | 0.0194 | 0.0849 | 0.0034 |
| Sa | Staphylococcus aureus | 0.0173 | 0.0384 | 0.0049 |
| Spn | Streptococcus pneumoniae | 0.0270 | 0.0560 | 0.0088 |
| Spy | Streptococcus pyogenes | 0.0253 | 0.0502 | 0.0075 |
| Ss | Streptococcus suis | 0.0051 | 0.0069 | 0.0019 |
| Si | Sulfolobus islandicus | 0.0243 | 0.0482 | 0.0073 |
| Vc | Vibrio cholerae | 0.0035 | 0.0123 | 0.0012 |
| Xc | Xanthomonas campestris | 0.0552 | 0.1724 | 0.0060 |
| Xf | Xylella fastidiosa | 0.0331 | 0.0689 | 0.0129 |
| Ype | Yersinia pestis | 0.0035 | 0.0044 | 0.0038 |
| Yps | Yersinia pseudotuberculosis | 0.0097 | 0.0224 | 0.0042 |
Figure 1.

Pairwise comparison of variability indices of πC, πA and πI. Each blue dot represents one species (see Table 1 for values). Black dashed line indicates equality of indices. Red lines indicate the regression line in the logarithmic scale. Slopes of regression lines on log–log plots: 0.86 for πC–πA, 0.52 for πA–πI, and 0.38 for πC–πI.
SSR-associated indel variability increases dramatically with SSR length
To understand the dependence of variability on SSR length, across species and SSR types, we group SSR loci by their sequence types and lengths, and obtain πI (type, length) for each group. In Figure 2A and B, we see that in general πI (type, length) of monomeric, dimeric and trimeric repeats all increase dramatically as the length of SSRs increases. The increasing trend is strongly non-linear, i.e. increasing several nucleotides (from 6 to 10 bp) correlates with order-of-magnitude changes of variability for the loci (note the y-axis is in logarithmic scale). The blue dots (single species values) exhibit large variation at each length bin due to different divergence times within each species. The red dots (average over species) show the general non-linear trend; note that if a length class is not observed in a given species, its value of πI, which is zero, cannot be shown on the log scale, but contributes to the average.
Figure 2.

Dependence of SSR variability on SSR length. (top row) πI for four types of monomeric SSRs of different length groups. (bottom row) πI for monomeric, dimeric, trimeric and tetrameric SSRs of different length groups. Each blue dot represents data from one species, and each red dot is average value of all species within this bin. At each SSR locus, we averaged the length of all of its assigned SSRs (see ‘Materials and Methods’ section). The k-th length bin contains all loci whose average SSR length is between k and k+1.
The non-linear variability we have shown here, across species and SSR types, demonstrates that the dramatic increase of SSR mutability with length, previously observed in different laboratory measurements of SSR variability at specific loci [see e.g. (17,33)], is a very general phenomenon in prokaryotes.
SSRs-associated indel variability depends on SSR type and SSR location
We tested for differences in πI depending on SSR sequence type and location in the coding region. To measure the variability of different SSR types, we calculated πI conditional on the type, which we denoted by  . To allow comparison across species, we accounted for differences in divergence times of strains by calculating the regression value of πI on πA, which we call πI,reg (Figure 1B). For each species we normalized
  by
by  , and plotted
  for all monomeric and dimeric SSR types in Figure 3A. We observed a general trend across all species such that
  ,
, >
>  ,
,  >
>  , in full agreement with experimental studies (6,34) (see ‘Discussion’ section).
Figure 3.

Dependence of SSR variability on SSR motif type. (A) Each square indicates the value of  for each species. Types with fewer than five SSR loci are marked as gray (N.A.= Not Applicable due to insufficient data). (B) Cumulative statistics for each SSR type. Each blue dot represents data from one species, and each red dot is the average value of overall species. See Table 1 for prokaryotic species names. SSR motif type labels are defined in the 5′→3′ direction.
Since both strands of DNA have similar probability to generate indels during slipped-strand mutation, reverse-complementary sequence motifs of SSRs are expected to have similar indel mutation rates. Here, we see in Figure 3B that  and
and  have similarly high values, and for
  and
and  have similarly lower values. Data of
  from other complementary motifs (marked by red bars in Figure 3) are generally consistent with the symmetric model for slipped-strand mutation.
We also investigated whether indel variation at SSR loci changes as a function of position along the N→C terminal direction. We divided all coding sequences into 10 bins and calculated average πI for each bin. In Figure 4, we see that although the N-to-C-dependence of πI varies among different species, many species exhibit a U-shaped curve, having higher πI in both N and C termini, particularly in α-proteobacteria, ε-proteobacteria, Cyanobacteria, Archaea and most of the Firmicutes. These SSR-associated indels include inframe and non-inframe indels. While some frameshift mutations are rescued by a second downstream indel, we do observe cases in which non-inframe indels result in an alternative stop in the ORF which may allow novel C-termini of proteins to evolve by frameshifts (35). More importantly, we stress that since πI is a per-locus quantity, hence not affected by the overall density of SSRs at a given position, the higher values of πI at N- and C-termini directly reflect the tolerance of these regions to indels (see ‘Discussion’ section). Finally, we analyzed the numbers of inframe/non-inframe indels for the 42 species. We found that in most species the overall ratio of inframe : non-inframe indel events is nearly 1 : 1; in the N-terminal bin this ratio is also nearly 1 : 1.
Figure 4.

Positional dependence of variability indices πC, πA and πI for each species. Position from N→C terminals of genes was divided into 10 equally sized bins (x-axes), and variability indices were averaged across genes within each bin. The three variability indices πC (black), πA (light blue) and πI (magenta) are indicated in logarithmic scale on the y-axes. Color square labels above each plot indicate the species taxonomic classification. Missing points for the pI curves of Cpn and Ss indicate lack of variable SSR loci due to the high degree of similarity among the sequenced strains.
Inferring evolutionary pressure on SSRs via synonymous codon-shuffled sequences
Previous studies have suggested that since SSRs are indel-mutational hotspots, they are avoided in genomes. This has been observed in different studies using different null models to generate expected SSR frequencies (29,36,37). Evolution of SSRs in coding sequences is further subject to constraints on the amino acid sequence. Coding sequences still have many degrees of freedom to evolve, e.g. choosing among synonymous codons, and indeed it has been shown that adjacent codon pairs are correlated in a way that reduces homopolymeric nucleotides (38). Furthermore, sequences are also free to evolve by amino acid replacement mutations that do not disrupt protein stability and function.
To assess the effect of amino acid sequence, GC content and codon usage bias on the presence of SSRs, we used a sequence shuffling methodology that has previously been applied to study sequence evolution in viruses (39). We constructed two different types of shuffled sequences. In the first model, we scanned each coding sequence and obtained its codon usage statistics within each gene. A gene-specific codon pool was used for random sampling to assemble a locally shuffled CDS that encoded the same amino acid sequences with the same codon usage bias as the original CDS. In the second model, we scanned the entire genome, and obtained the global codon usage preferences, which we used to assemble the globally shuffled CDS, which encoded the same amino acid sequences using the global codon usage bias in each genome.
By constructing shuffled sequences that preserve the primary protein sequence, and measuring their SSR statistics for multiple trials, we obtained the expected SSR frequency and its variance. The deviation from each null model (global or local shuffling) is measured by the ratio
where R > 1 implies enrichment of SSRs and R < 1 implies avoidance of SSRs. Note that the reconstructed sequences we generated above preserve GC content and codon usage bias of coding sequences, thus any significant deviations of R > or <1 require further evolutionary explanation beyond these well-known effects.
Dependence on SSR type
We found that the evolutionary pressure on SSRs is both type- and species-specific (Figure 5 and Supplementary Figure S1). Some types exhibit a clear signature of SSR avoidance: for example, the R-values of polyC and polyG SSRs, denoted as R(C) and R(G), indicate that these types of SSRs are generally avoided, in comparison with polyA and polyT SSRs (Figure 5B). This trend agrees with the result in Figure 3, which showed that polyG and polyC repeats are generally more mutagenic than polyA or polyT. By comparing all 42 species, we found in general, Avoidance (G,C) > Avoidance(A,T) ≈ Avoidance (dimeric repeats). This agrees with previous sequence analysis which found that polyC, polyG SSRs are more avoided than polyA, polyT SSRs (29,38). Yet, we have shown that this trend is not universal since clear counter-examples exist. For example, in Buchnera aphidicola, Candidatus Sulcia muelleri and two Yersinia species, polyC, polyG SSRs are less avoided (or more enriched) than polyA, polyT SSRs.
Figure 5.

Observed versus expected SSR frequency statistics for different species and motif types. (A) Ratio of observed versus expected SSR frequency estimated by local synonymous codon shuffling. Each square represents the value of the ratio for a given SSR type and species. Over- and under-represented types are shown in yellow and blue shades, respectively. (B) Cumulative statistics for each SSR type. See Table 1 for prokaryotic species names.
Another clear example of avoidance is seen in the R-values of the reverse-complementary pair AGG/CCT, which are generally lower than unity across species. This is likely due to AGGAGG being the bacterial translation initiation site. However, there are also SSR types that have higher expectation than the null model, e.g. the ACC/GGT and the AGC/GCT reverse-complementary pairs are both significantly enriched. Thus, we find global trends of SSR type avoidance or enrichment, yet we can identify species-specific exceptions to each trend.
Dependence on N→C position
The density of SSRs is shown as a function of N→C position for each prokaryotic species in Figure 6. Surprisingly, among 42 genomes, 11 of them have unambiguously higher SSR density observed (blue) compared with the expected SSR density (red and green; error bars indicate standard error over shufflings), while 18 genomes exhibit clear avoidance of SSRs. Some of the enrichment/avoidance correlates with taxonomy. Among four β-proteobacteria species, all enrich for SSRs in general, while among the nine Firmicute species, all avoid SSRs in general (see also Figure 5A totals). Interestingly, there are closely related species exhibiting completely opposite trends of enriching/avoiding SSRs, for example Escherichia coli (Ec) avoids while Salmonella enterica (Se) enriches for SSRs.
Figure 6.

Positional dependence of SSR density. For each plot, the x-axis represents binned positions from N→C termini (as in Figure 4), and the y-axis indicates the SSR density (# SSRs/kb). Blue curves: original SSR density. Green curves: SSR density in global synonymous codon shufflings. Red curves: SSR density in local synonymous codon shufflings. Error bars represent the standard error of the estimated SSR density observed in the shuffled sequences.
The shapes of the SSR density curves for the original and shuffled data yield several insights. In 41 out of 42 cases examined, the shuffled SSR density is U-shaped, and nearly symmetric in many of the species, i.e. the density of SSRs is significantly higher at the N- and C-termini than in the middle of the sequence, and also similar in magnitude at the N- and C-terminals. This behavior is expected based on purely biophysical considerations of protein structure (see ‘Discussion’ section below). In marked contrast, the original SSR density (Figure 6, blue curves), is often significantly asymmetric, and in many cases exhibits a relative enrichment of SSRs at the N-terminal versus the C-terminal (see Supplementary Data for further analysis). Several species exhibit pronounced N-biased asymmetry, the most significant of which are Neisseria meningitidis, Yersinia pestis, Francisella tularensis, Shewanella baltica, Helicobacter pylori and Streptococcus suis (see Supplementary Figure S2B for others). Many species exhibit no asymmetry, while several examples of reversed asymmetry are observed, in which the C-termini rather than N-termini are enriched in repeats (see Burkhoderia).
Effect of SSR cutoff length on SSR density statistics
Due to the much lower frequency of longer SSRs in genomes (30), the statistics of SSRs are dominated by shorter SSRs. For this reason, the patterns of avoidance and enrichment of SSRs may reflect pressures on shorter SSRs, and it is necessary to test whether the trends we observed depend strongly on the cutoffs used to define SSRs. However, changing these cutoffs severely reduces the available data, since small changes in cutoffs can yield order-of-magnitude changes in overall SSR numbers. We tested more stringent SSR cutoffs, which eliminated 90% of the shorter SSRs, yet maintained sufficient SSR numbers to allow meaningful analyses. Cutoffs and results are reported in Supplementary Materials, Supplementary Figures S3 and S4. Our reanalysis confirms that longer SSRs are avoided more strongly than shorter SSRs, yet a number of species still exhibit overall enrichment of repeats. The type-specific trends we reported above are largely robust to changes of the cutoffs. Likewise, the N → C distributions and in particular the N-terminal enrichment of repeats in certain species are robust features of SSRs that are largely insensitive to the choice of SSR cutoffs (Supplementary Figures S3 and S4).
DISCUSSION
SSRs are known to be highly-mutable sequence motifs from both epidemic and laboratory studies. Certain bacterial contingency genes are enriched for SSRs, enabling stochastic switching between different alleles reversibly and at high frequency. In this paper, we analyzed 42 prokaryotic species across various taxa, focusing on SSR-associated indel variability and density distribution in coding regions. We discuss the global picture of SSR evolution that emerges from the data.
SSR length variation is due to two mutational processes: (i) point mutations in the SSR motif that do not alter the open reading frame and (ii) slipped-strand mutations that create indels at SSR loci, which may cause frameshifts. We found that the point mutation rate (per base pair) at SSR loci had no dependence on SSR length (data not shown), and could be regarded as background sequence evolution that sporadically creates, destroys, or modifies SSRs. In contrast, the slipped-strand mutational process is a more specific feature of SSRs and its reversible nature provides intriguing evolutionary possibilities. First, frameshift mutations caused by SSRs can affect large parts of the protein sequence, while point mutations only affect single codons. Second, the rate of slipped-strand mutation at SSRs dramatically increases with the length, a feature that is observed in pathogens’ phase-variable genes.
SSR variability and SSR density measures
We use two complementary measures to study SSR evolution: the SSR variability, which assesses sequence dynamics at SSR loci, and the SSR density—the observed number and distribution of SSRs in coding regions—which results from the evolutionary processes that govern the creation, destruction, and maintenance of SSRs.
To measure variation in coding regions, we used three quantities that are analogous to standard measures in population genetics, which describe (i) nucleotide variability of codons (πC), (ii) amino acid variability of codons (πA) and (iii) SSR-associated indel variability (πI). These three indices measure the composite effects of mutation, drift, and selection processes. Higher variability at a locus could be due to higher mutation rate, lower selective pressure, or a combination of effects. However, by pooling data over many loci and studying the global dependence of variability as a function of other factors (such as SSR location or SSR length), we are able to make general inferences about the importance of different evolutionary forces.
To study SSR density distributions, we used synonymous codon shufflings. By either globally shuffling synonymous codons (Supplementary Figure S1), or doing so locally within each gene (Figure 5), we maintained protein primary sequences while providing null models to detect enrichment/avoidance of repeats. We found the observed:expected ratio of SSR densities is globally higher in 11 species (all belonging to α- β- γ- and ε- proteobacteria) and globally lower in 18 species (including all 9 Firmicute species analyzed). This reveals strong taxon-dependence for SSR enrichment/avoidance. In most cases, we find that the local and global synonymous shufflings yield very similar results, indicating that the difference between genome-wide codon usage and within-gene codon usage is not a critical factor in SSR evolution (though it may alter the ability to detect certain SSR types, discussed below).
Dependence of variability and density on type and length
We observed a dramatic length-dependence of SSR variability (Figure 2), which was qualitatively consistent with previous experimental studies showing that SSR mutability increases nonlinearly with length (7,17). Quantitatively, our cross-species genome-wide data enabled us to compare the indel-mutability of SSRs of different sequence types (e.g. poly A/T versus poly C/G).
To see this, we compare the average variability among monomeric SSRs (Figure 2A, red dots) in the 9 bp length-bins for different SSR types. The average variabilities are 0.048 (polyA), 0.026 (polyT), 0.15 (polyC) and 0.21 (polyG). Clearly, polyC/G is an order of magnitude higher than poly A/T SSRs. Similarly, in Figure 2B, the average variability in 9 bp length-bins are 0.08 (all monomeric SSRs), 0.006 (all dimeric SSRs) and 0.008 (all trimeric SSRs). While we can compare variability between different classes of SSRs, we cannot directly measure relative mutability since selective pressures may differ between repeat classes. However, it is reasonable to assume that for dimeric and trimeric SSRs, the probability that an indel causes a frameshift is no greater than for monomeric SSRs; their mutational load is likely less than or equal to monomeric SSRs. Thus, among SSR motifs with similar lengths, the most mutagenic are monomeric repeats with the C/G type.
SSR frequency statistics (Figure 5B) show that polyC/G SSRs are generally more avoided (represented by light blue) while polyA/T and other dimeric SSRs have a nearer to average frequency (represented by black). The avoidance of monomeric repeat types thus reflects their mutability. We note that an additional factor that may contribute to the relative instability of C/G-containing SSRs is the known point-mutational bias toward AT that has been observed across taxa (40). Additionally, monomeric SSRs are across species more avoided than dimeric and trimeric SSRs (see Figure 5B, right panel), which is consistent with our inference that monomeric SSRs are the most mutagenic.
Several pathogenic bacteria are known to favor specific types of SSRs in their phase variable loci. Two of the best-studied examples are H. influenzae and N. meningitidis, both of which are known to use many tetrameric SSRs. In Figure 5, we see a clear signal of tetrameric SSR enrichment in N. meningitidis; this figure uses the local shuffling as its null model. In H. influenzae, our analysis detects the enrichment of tetrameric SSRs using the global shuffling (see Supplementary Figure S1). Comparison of Figure 5 and Supplementary Figure S1, as well as comparison of the red and green curves in Figure 6, shows that in most cases there is little difference between the two types of shufflings.
Biophysical and evolutionary constraints on indel variability
We observed that N-terminal and C-terminal SSR loci have higher per-locus variability of πI (Figure 4, magenta curves) across taxa: species in Enterobacteria, Cynobacteria, and Archaea all exhibit this trend. Higher SSR variability at the termini suggests that the selective pressure against indels is weaker at protein termini. In contrast, the πA curves (Figure 4, light blue), which represent the overall amino acid conservation of coding regions, exhibit only very mild differences between termini and the middle of proteins. We asked whether the different behaviors of πA and πI could be attributed to purely biophysical effects.
To explain the πA curves, we observe that the protein stability cost of a substitution depends strongly on the 3D interactions at the given position with the contacting residues and the solvent. Amino acid conservation at different positions in protein structures is almost entirely accounted for by the overall burial of the residue within the molecular structure (41). Position along the protein sequence, however, is a poor predictor of solvent exposure, with the exception of the protein termini which are typically not buried within the hydrophobic core (42). When we average over proteins, we thus expect very little difference in conservation as a function of position, with possible slight differences at the protein ends. This is precisely what is seen in the πA curves in Figure 4.
The πI curves include both inframe and non-inframe SSR-associated indels. The two types of indels occur at approximately a 1:1 ratio in most species. For inframe indels, although they do not cause a frameshift in the protein sequence, they can significantly disrupt protein structure (43,44). This is particularly pronounced within protein secondary structures, where an indel is expected to be on average more destabilizing than within loops or disordered regions. Measurement of stability changes in engineered mutants confirm this prediction (45), and extensive bioinformatic analyses of protein structures show that indels within secondary structure motifs are strongly suppressed relative to other parts of proteins (46–48). Because protein termini are typically less ordered than others part of the protein (49,50), we expect them to be significantly more tolerant of indels than the rest of the protein. This is precisely what is seen in the πI curves.
For frame-shifting indels, protein biophysical constraints are not relevant. However, frameshift mutations are generally deleterious, except in the following cases: (i) in fluctuating environments, stochastic switching may facilitate population adaptation, and N-terminal frameshifts are a simple mechanism to achieve such phase variation; (ii) C-terminal frameshifts are under reduced evolutionary pressure since most of the coding region is unaffected. Therefore, in these special cases, πI curves could also be elevated at both termini, which is again consistent with what we observed in Figure 4.
Evolutionary pressures shaping the SSR density
Determinants of the primary sequence signal
As seen above, the N→C dependence of indel variability (Figure 4) could be explained by known biophysical constraints of protein structure. How do these influence the SSR density in coding regions? To analyze SSR density, we constructed randomly-shuffled sequences that preserved the primary amino acid sequence (Figure 6). Below, we will refer to the SSR density curves of the shuffled sequences as the primary sequence signal, and of the original sequences as the original signal.
We found that the primary sequence signal is typically a U-shaped curve (Figure 6, red and green curves). The primary sequence signal reflects how permissive the local amino acid sequence is of synonymous codon arrangements that include SSRs. Two evolutionary mechanisms stand out as plausible explanations of this U-shape:
Constraints on SSR expansion: Since protein structural constraints allow a larger fraction of indels at the termini, SSR expansions will occurs more frequently there than in the middle of proteins (51). Because expansions at SSRs typically duplicate the SSR repeat unit, they tend to introduce duplicates of the same codon. This causes the amino acid sequence to allow more SSR-containing codon arrangements at the termini, leading to a U-shaped primary sequence signal.
Selection on indel mutational load: To reduce the deleterious mutational cost of indels in protein coding regions, selection could reduce the density of SSRs. The reduction would be greater in regions where indels are most costly, namely in the middle of proteins, and lesser in the protein termini. The mechanism is indirect because selection acts on indels rather than on SSRs directly.
While a combination of these two mechanisms could be responsible for shaping the primary sequence signal, constraints on SSR expansion relies solely on drift, and is thus somewhat more general than selection on mutational load, which relies on indirect selection. The possibility remains that some other feature at protein termini is promoted by repeats, and is under direct selection.
In addition to its U-shape, the primary sequence signal was nearly symmetric in many species (Figure 6 and Supplementary Figure 2); see e.g. B. mallei (Bm) and X. campestris (Xc). Slightly asymmetric curves were also often observed with an N-terminal bias (i.e. the curve is slightly higher at the N-terminal than at the C-terminal); see e.g. L. pneumophila (Lp), Streptococcal species (Spy, Spn and Ss) and V. cholera (Vc). We also observed six species for which the asymmetry had a C-terminal bias (Rs, Si, Bcn, Bap, Xf and Mm). These asymmetries in the primary sequence signal may be explained by differences in the secondary structure content and overall compactness of the N- and C-termini of proteins. Recent bioinformatics analyses using a large collection of non-redundant protein structures showed that protein C-termini are more likely to be helical (52,53) and are also more compact than N-termini (53). This is consistent with our finding that the majority of species’ primary sequence signals have an N-terminal bias. We note, however, that the complement of protein structures used by each species differs from that of non-redundant protein structure libraries, and could account for the different biases observed.
Uniform deviations between original and primary sequence signals
While protein biophysical constraints largely explain the U-shaped primary sequence signal, the original signal (blue curves in Figure 6) often deviates significantly from it. The most common deviations are uniform SSR enrichment or avoidance, i.e. where a uniform shift of the primary sequence signal up or down would superimpose with the original SSR density. Approximately one-fourth of species uniformly enrich and half of species uniformly avoid SSRs relative to the primary sequence signal.
Selection to reduce indel mutational load, discussed above, is a possible explanation of SSR avoidance. Selection to increase indel mutational load seems a less plausible explanation for species exhibiting uniform enrichment for SSRs. In this regard, we argue that uniform deviations (in either direction) can also be explained based on mutational drift. Since expansions at SSRs typically duplicate the SSR repeat unit, they tend to introduce duplicates of the same codon, leading to a positive difference between the original and primary sequence signals. The magnitude of the difference depends on the relative rate of SSR expansion to the point mutation rate. It has been suggested that SSRs may also have elevated point mutation rates (54,55). In that case, the synonymous codon arrangements that contain SSRs will be less point-mutationally stable than the arrangements that do not. In this regime, SSRs are ‘self-destructing’, with the result that the original SSR density would be lower than the primary sequence signal. Under the mutational drift explanation, the sign and magnitude of uniform deviations would be determined by the rates of point mutations at SSR and non-SSR loci, as well as the rates of SSR expansion and contractions.
Non-uniform deviations in the observed SSR signal
Interestingly, a notable fraction (approximately one-fourth) of species have SSR density curves that differ markedly in shape from their primary sequence signal. The Burkholderia species exhibit relatively flat SSR density with slight enrichment at the C terminal. Several particularly interesting cases involve species that have a nearly symmetric protein signal, but exhibit a large N-terminal bias in their observed SSR density curves. The most pronounced examples of this phenomenon are N. meningitidis, Y. pestis, F. tularensis, S. baltica, H. pylori and S. suis (Figure 6 and Supplementary Figure S2).
The shifting of the observed signal toward one or the other of the termini is not easily reconciled with purely biophysical explanations. However, this shifting is likely to affect the mutational load of SSRs. By increasing the relative abundance of SSRs in the N-terminal versus the C-terminal, genomes increase the probability that indels cause (reversible) molecular null mutations. The N-biased SSR density curves are often indicative of pathogenic species, which lends further support to the hypothesis that this bias is due to phase variable genes, such as contingency loci in bacteria. These have often been studied for dramatic examples of SSR-mediated stochastic switches, involving very long SSRs, e.g. in H. influenza and N. meningitidis, which contain proteins with long tetrameric repeats of lengths in the range 40–100 bp or longer (12). Since the majority of SSRs in our analysis are significantly shorter (in the range 6–15 bp), our results suggest that stochastic switching may occur in more genes than previously suspected (albeit at much lower rates than in the best-studied phase variable genes). Our results are consistent with a previous study that found N-biased enrichment of monomeric repeats in data pooled across 81 bacterial genomes, and suggested the role of phase variation in establishing this bias (28). In a few cases (e.g. the Bukhenera and Archaeal species) we also observed the opposite trend: asymmetry that enriches SSRs in the C terminal. This would shift the spectrum of mutational effects away from frameshift nulls, and potentially toward extension of coding regions, which can provide novel sequences for adaptation (35).
G/C content and additional structural constraints
Two additional factors could influence repeat distributions: G/C content and DNA and RNA structural constraints. Repetitive DNA promotes formation of small DNA stem loops whose stability depends on intracellular solvent properties, which may vary between bacterial species and across ecological environments. Hence tuning the overall density of repeats in genomes may be useful for DNA structural reasons. Two observations are at odds with this possibility: (i) bacteria from markedly different niches, e.g. S. enterica (intestinal) and Cyanothece PCC (marine), can have SSR density curves that are very similar in both shape and magnitude; and (ii) ∼25% of species have nearly overlapping original and primary sequence signals while the overall density of repeats varies significantly among these species. Another possibility involves the G/C content of genomes, which is known to vary greatly between species. For example, the β-proteobacteria, which consistently enrich for SSRs, are among the most G/C rich species, while the Firmicutes, which consistently avoid SSRs, are among the most G/C poor. While this correlation is evident, the γ-proteobacteria that exhibit no consistent trends of SSR enrichment or avoidance, provide counter-examples of high G/C and SSR avoidance (low R), or low G/C and SSR enrichment (high R). G/C content exhibited no meaningful dependence on R (data not shown). G/C content may correlate with certain mutational behaviors, which might be relevant to the observed trends, but alone it does not provide a mechanistic explanation of the data. Finally, RNA structural constraints remain unexplored as far as their influence on the evolution of SSR density in genomes.
CONCLUSION
By analyzing SSR density and variability in prokaryotic coding regions, our study shows that evolutionary processes tune both the genomic distribution of SSR types and their positional distribution within genes. Across species and genomes, we measured the variability of repeats and observed strong dependence on their types, lengths and positions. We showed that the U-shape of SSR distributions is largely explained by biophysical constraints on protein structures. However, we identified several species, including certain pathogens that exhibit N-terminal bias beyond expectation in the SSR distributions. Such species may evolutionarily alter the distribution of repeats to facilitate phase variation. Genome-wide measurements of phase variation in the identified species may therefore be particularly fruitful in uncovering new pathways relevant to bacterial pathogenesis.
SUPPLEMENTARY DATA
Supplementary Data are available at NAR Online: Supplementary Figures S1–S5, Supplementary Table S1 and Supplementary Methods.
FUNDING
Burroughs Wellcome Fund and National Institutes of Health (grant R01-GM-097356 to E.K.). Funding for open access charge: National Institutes of Health (grant R01-GM-097356).
Conflict of interest statement. None declared.
Supplementary Material
ACKNOWLEDGEMENTS
The authors would like to thank Eugene Shakhnovich and Eugene Koonin for stimulating discussions and suggestions regarding biophysical constraints. The authors thank Pranidhi Sood and Benjamin Greenbaum for their valuable comments on the manuscript.
REFERENCES
- 1.van Belkum A, Scherer S, van Alphen L, Verbrugh H. Short-sequence DNA repeats in prokaryotic genomes. Microbiol. Mol. Biol. Rev. 1998;62:275–293. doi: 10.1128/mmbr.62.2.275-293.1998. [DOI] [PMC free article] [PubMed] [Google Scholar]
- 2.Treangen TJ, Abraham AL, Touchon M, Rocha EP. Genesis, effects and fates of repeats in prokaryotic genomes. FEMS Microbiol. Rev. 2009;33:539–571. doi: 10.1111/j.1574-6976.2009.00169.x. [DOI] [PubMed] [Google Scholar]
- 3.Li Y-C, Korol AB, Fahima T, Nevo E. Microsatellites within genes: structure, function, and evolution. Mol. Biol. Evol. 2004;21:991–1007. doi: 10.1093/molbev/msh073. [DOI] [PubMed] [Google Scholar]
- 4.Vinces MD, Legendre M, Caldara M, Hagihara M, Verstrepen KJ. Unstable tandem repeats in promoters confer transcriptional evolvability. Science. 2009;324:1213–1216. doi: 10.1126/science.1170097. [DOI] [PMC free article] [PubMed] [Google Scholar]
- 5.Martin P, Makepeace K, Hill SA, Hood DW, Moxon R. Microsatellite instability regulates transcription factor binding and gene expression. Proc. Natl Acad. Sci. USA. 2005;102:3800–3804. doi: 10.1073/pnas.0406805102. [DOI] [PMC free article] [PubMed] [Google Scholar]
- 6.Sagher D, Hsu A, Strauss B. Stabilization of the intermediate in frameshift mutation. Mutat. Res. 1999;423:73–77. doi: 10.1016/s0027-5107(98)00227-9. [DOI] [PubMed] [Google Scholar]
- 7.Kroutil LC, Register K, Bebenek K, Kunkel TA. Exonucleolytic proofreading during replication of repetitive DNA. Biochemistry. 1996;35:1046–1053. doi: 10.1021/bi952178h. [DOI] [PubMed] [Google Scholar]
- 8.La Spada AR, Taylor JP. Repeat expansion disease: progress and puzzles in disease pathogenesis. Nat. Rev. Genet. 2010;11:247–258. doi: 10.1038/nrg2748. [DOI] [PMC free article] [PubMed] [Google Scholar]
- 9.Fondon JW, Garner HR. Molecular origins of rapid and continuous morphological evolution. Proc. Natl Acad. Sci. USA. 2004;101:18058–18063. doi: 10.1073/pnas.0408118101. [DOI] [PMC free article] [PubMed] [Google Scholar]
- 10.Hammock EAD, Young LJ. Microsatellite instability generates diversity in brain and sociobehavioral traits. Science. 2005;308:1630–1634. doi: 10.1126/science.1111427. [DOI] [PubMed] [Google Scholar]
- 11.Bayliss CD. Determinants of phase variation rate and the fitness implications of differing rates for bacterial pathogens and commensals. FEMS Microbiol. Rev. 2009;33:504–520. doi: 10.1111/j.1574-6976.2009.00162.x. [DOI] [PubMed] [Google Scholar]
- 12.Moxon R, Bayliss C, Hood D. Bacterial contingency loci: the role of simple sequence DNA repeats in bacterial adaptation. Annu. Rev. Genet. 2006;40:307–333. doi: 10.1146/annurev.genet.40.110405.090442. [DOI] [PubMed] [Google Scholar]
- 13.van der Woude MW, Bäumler AJ. Phase and antigenic variation in bacteria. Clin Microbiol. Rev. 2004;17:581–611. doi: 10.1128/CMR.17.3.581-611.2004. table of contents. [DOI] [PMC free article] [PubMed] [Google Scholar]
- 14.Koch AL. Catastrophe and what to do about it if you are a bacterium: the importance of frameshift mutants. Crit. Rev. Microbiol. 2004;30:1–6. doi: 10.1080/10408410490266401. [DOI] [PubMed] [Google Scholar]
- 15.Kashi Y, King DG. Simple sequence repeats as advantageous mutators in evolution. Trends Genet. 2006;22:253–259. doi: 10.1016/j.tig.2006.03.005. [DOI] [PubMed] [Google Scholar]
- 16.Jonsson AB, Nyberg G, Normark S. Phase variation of gonococcal pili by frameshift mutation in pilC, a novel gene for pilus assembly. EMBO J. 1991;10:477–488. doi: 10.1002/j.1460-2075.1991.tb07970.x. [DOI] [PMC free article] [PubMed] [Google Scholar]
- 17.Richardson AR, Yu Z, Popovic T, Stojiljkovic I. Mutator clones of Neisseria meningitidis in epidemic serogroup A disease. Proc. Natl Acad. Sci. USA. 2002;99:6103–6107. doi: 10.1073/pnas.092568699. [DOI] [PMC free article] [PubMed] [Google Scholar]
- 18.Theiss P, Wise KS. Localized frameshift mutation generates selective, high-frequency phase variation of a surface lipoprotein encoded by a mycoplasma ABC transporter operon. J. Bacteriol. 1997;179:4013–4022. doi: 10.1128/jb.179.12.4013-4022.1997. [DOI] [PMC free article] [PubMed] [Google Scholar]
- 19.Rando OJ, Verstrepen KJ. Timescales of genetic and epigenetic inheritance. Cell. 2007;128:655–668. doi: 10.1016/j.cell.2007.01.023. [DOI] [PubMed] [Google Scholar]
- 20.Park SF, Purdy D, Leach S. Localized reversible frameshift mutation in the flhA gene confers phase variability to flagellin gene expression in Campylobacter coli. J. Bacteriol. 2000;182:207–210. doi: 10.1128/jb.182.1.207-210.2000. [DOI] [PMC free article] [PubMed] [Google Scholar]
- 21.Kearns DB, Chu F, Rudner R, Losick R. Genes governing swarming in Bacillus subtilis and evidence for a phase variation mechanism controlling surface motility. Mol. Microbiol. 2004;52:357–369. doi: 10.1111/j.1365-2958.2004.03996.x. [DOI] [PubMed] [Google Scholar]
- 22.Wolf DM, Vazirani VV, Arkin AP. Diversity in times of adversity: probabilistic strategies in microbial survival games. J. Theor. Biol. 2005;234:227–253. doi: 10.1016/j.jtbi.2004.11.020. [DOI] [PubMed] [Google Scholar]
- 23.Thattai M, van Oudenaarden A. Stochastic gene expression in fluctuating environments. Genetics. 2004;167:523–530. doi: 10.1534/genetics.167.1.523. [DOI] [PMC free article] [PubMed] [Google Scholar]
- 24.Lachmann M, Jablonka E. The inheritance of phenotypes: An adaptation to fluctuating environments. J. Theor. Biol. 1996;181:1–9. doi: 10.1006/jtbi.1996.0109. [DOI] [PubMed] [Google Scholar]
- 25.Kussell E, Leibler S. Phenotypic diversity, population growth, and information in fluctuating environments. Science. 2005;309:2075–2078. doi: 10.1126/science.1114383. [DOI] [PubMed] [Google Scholar]
- 26.Kussell E, Kishony R, Balaban NQ, Leibler S. Bacterial persistence: a model of survival in changing environments. Genetics. 2005;169:1807–1814. doi: 10.1534/genetics.104.035352. [DOI] [PMC free article] [PubMed] [Google Scholar]
- 27.Haccou P, Iwasa Y. Optimal mixed strategies In stochastic environments. Theor. Popul. Biol. 1995;47:212–243. [Google Scholar]
- 28.Orsi RH, Bowen BM, Wiedmann M. Homopolymeric tracts represent a general regulatory mechanism in prokaryotes. BMC Genomics. 2010;11:102. doi: 10.1186/1471-2164-11-102. [DOI] [PMC free article] [PubMed] [Google Scholar]
- 29.Ackermann M, Chao L. DNA sequences shaped by selection for stability. PLoS Genet. 2006;2:e22. doi: 10.1371/journal.pgen.0020022. [DOI] [PMC free article] [PubMed] [Google Scholar]
- 30.Mrazek J, Guo X, Shah A. Simple sequence repeats in prokaryotic genomes. Proc. Natl Acad. Sci. USA. 2007;104:8472–8477. doi: 10.1073/pnas.0702412104. [DOI] [PMC free article] [PubMed] [Google Scholar]
- 31.van Passel MW, Ochman H. Selection on the genic location of disruptive elements. Trends Genet. 2007;23:601–604. doi: 10.1016/j.tig.2007.08.017. [DOI] [PubMed] [Google Scholar]
- 32.Edgar RC. MUSCLE: multiple sequence alignment with high accuracy and high throughput. Nucleic Acids Res. 2004;32:1792–1797. doi: 10.1093/nar/gkh340. [DOI] [PMC free article] [PubMed] [Google Scholar]
- 33.Kelkar YD, Strubczewski N, Hile SE, Chiaromonte F, Eckert KA, Makova KD. What is a microsatellite: A computational and experimental definition based upon repeat mutational behavior at A/T and GT/AC repeats. Genome Biol. Evol. 2010;2:620–635. doi: 10.1093/gbe/evq046. [DOI] [PMC free article] [PubMed] [Google Scholar]
- 34.Gragg H, Harfe BD, Jinks-Robertson S. Base composition of mononucleotide runs affects DNA polymerase slippage and removal of frameshift intermediates by mismatch repair in Saccharomyces cerevisiae. Mol. Cell. Biol. 2002;22:8756–8762. doi: 10.1128/MCB.22.24.8756-8762.2002. [DOI] [PMC free article] [PubMed] [Google Scholar]
- 35.Vakhrusheva AA, Kazanov MD, Mironov AA, Bazykin GA. Evolution of prokaryotic genes by shift of stop codons. J. Mol. Evol. 2011;72:138–146. doi: 10.1007/s00239-010-9408-1. [DOI] [PubMed] [Google Scholar]
- 36.Field D, Wills C. Abundant microsatellite polymorphism in Saccharomyces cerevisiae, and the different distributions of microsatellites in eight prokaryotes and S. cerevisiae, result from strong mutation pressures and a variety of selective forces. Proc. Natl Acad. Sci. USA. 1998;95:1647–1652. doi: 10.1073/pnas.95.4.1647. [DOI] [PMC free article] [PubMed] [Google Scholar]
- 37.Itzkovitz S, Hodis E, Segal E. Overlapping codes within protein-coding sequences. Genome Res. 2010;20:1582–1589. doi: 10.1101/gr.105072.110. [DOI] [PMC free article] [PubMed] [Google Scholar]
- 38.Gu T, Tan S, Gou X, Araki H, Tian D. Avoidance of long mononucleotide repeats in codon pair usage. Genetics. 2010;186:1077–1084. doi: 10.1534/genetics.110.121137. [DOI] [PMC free article] [PubMed] [Google Scholar]
- 39.Greenbaum B, Levine A, Bhanot G, Rabadan R, Levine A, Bhanot G, Rabadan R. Patterns of evolution and host gene mimicry in influenza and other RNA viruses. PLoS Pathogens. 2008;4:e1000079. doi: 10.1371/journal.ppat.1000079. [DOI] [PMC free article] [PubMed] [Google Scholar]
- 40.Hershberg R, Petrov DA. Evidence that mutation is universally biased towards AT in bacteria. PLoS Genet. 2010;6:e1001115. doi: 10.1371/journal.pgen.1001115. [DOI] [PMC free article] [PubMed] [Google Scholar]
- 41.Mirny LA, Shakhnovich EI. Universally conserved positions in protein folds: reading evolutionary signals about stability, folding kinetics and function. J. Mol. Biol. 1999;291:177–196. doi: 10.1006/jmbi.1999.2911. [DOI] [PubMed] [Google Scholar]
- 42.Jacob E, Unger R. A tale of two tails: why are terminal residues of proteins exposed? Bioinformatics. 2006;23:e225–e230. doi: 10.1093/bioinformatics/btl318. [DOI] [PubMed] [Google Scholar]
- 43.Heinz DW, Baase WA, Zhang X-J, Blaber M, Dahlquist FW, Matthews BW. Accommodation of amino acid insertions in an alpha-helix of T4 lysozyme. J. Mol. Biol. 1994;236:869–886. doi: 10.1006/jmbi.1994.1195. [DOI] [PubMed] [Google Scholar]
- 44.Vetter IR, Baase WA, Heinz DW, Xiong J-P, Snow S, Matthews BW. Protein structural plasticity exemplified by insertion and deletion mutants in T4 lysozyme. Protein Sci. 1996;5:2399–2415. doi: 10.1002/pro.5560051203. [DOI] [PMC free article] [PubMed] [Google Scholar]
- 45.Sondek J, Shortle D. Accomodation of single amino-acid insertions by the native-state of staphylococcal nuclease. Prot. Struct. Funct. Bioinformatics. 1990;7:299–305. doi: 10.1002/prot.340070402. [DOI] [PubMed] [Google Scholar]
- 46.de la Chaux N, Messer PW, Arndt PF. DNA indels in coding regions reveal selective constraints on protein evolution in the human lineage. BMC Evol. Biol. 2007;7:191–202. doi: 10.1186/1471-2148-7-191. [DOI] [PMC free article] [PubMed] [Google Scholar]
- 47.Kim R, Guo J. Systematic analysis of short internal indels and their impact on protein folding. BMC Struct. Biol. 2010;10:24–34. doi: 10.1186/1472-6807-10-24. [DOI] [PMC free article] [PubMed] [Google Scholar]
- 48.Pascarella S, Argos P. Analysis of insertions/deletions in protein structures. J. Mol. Biol. 1992;224:461–471. doi: 10.1016/0022-2836(92)91008-d. [DOI] [PubMed] [Google Scholar]
- 49.Christopher JA, Baldwin TO. Implications of N and C-terminal proximity for protein folding. J. Mol. Biol. 1996;257:175–187. doi: 10.1006/jmbi.1996.0154. [DOI] [PubMed] [Google Scholar]
- 50.Thornton JM, Sibanda BL. Amino and carboxy-terminal regions in globular proteins. J. Mol. Biol. 1983;167:443–460. doi: 10.1016/s0022-2836(83)80344-1. [DOI] [PubMed] [Google Scholar]
- 51.Kimura M, Ohta T. On some principles governing molecular evolution. Proc. Natl Acad. Sci. USA. 1974;71:2848–2852. doi: 10.1073/pnas.71.7.2848. [DOI] [PMC free article] [PubMed] [Google Scholar]
- 52.Krishna MM, Englander SW. The N-terminal to C-terminal motif in protein folding and function. Proc. Natl Acad. Sci. USA. 2004;102:1053–1058. doi: 10.1073/pnas.0409114102. [DOI] [PMC free article] [PubMed] [Google Scholar]
- 53.Laio A, Micheletti C. Are structural biases at protein termini a signature of vectorial folding? Proteins. 2006;62:17–23. doi: 10.1002/prot.20712. [DOI] [PubMed] [Google Scholar]
- 54.McDonald MJ, Wang W-C, Huang H-D, Leu J-Y. Clusters of nucleotide substitutions and insertion/deletion mutations are associated with repeat sequences. PLoS Biol. 2011;9:e1000622. doi: 10.1371/journal.pbio.1000622. [DOI] [PMC free article] [PubMed] [Google Scholar]
- 55.Tian D, Wang Q, Zhang P, Araki H, Yang S, Kreitman M, Nagylaki T, Hudson R, Bergelson J, Chen J-Q. Single-nucleotide mutation rate increases close to insertions/deletions in eukaryotes. Nature. 2008;455:105–109. doi: 10.1038/nature07175. [DOI] [PubMed] [Google Scholar]
Associated Data
This section collects any data citations, data availability statements, or supplementary materials included in this article.