Abstract
Growing evidence suggests that epigenetic profile changes occurring during fetal development in response to in utero environment variations could be one of the mechanisms involved in the early determinants of adult chronic diseases. In this study, we tested whether maternal glycemic status is associated with the adiponectin gene (ADIPOQ) DNA methylation profile in placenta tissue, in maternal circulating blood cells, and in cord blood cells. We found that lower DNA methylation levels in the promoter of ADIPOQ on the fetal side of the placenta were correlated with higher maternal glucose levels during the second trimester of pregnancy (2-h glucose after the oral glucose tolerance test; rs ≤ −0.21, P < 0.05). Lower DNA methylation levels on the maternal side of the placenta were associated with higher insulin resistance index (homeostasis model assessment of insulin resistance) during the second and third trimesters of pregnancy (rs ≤ −0.27, P < 0.05). Finally, lower DNA methylation levels were associated with higher maternal circulating adiponectin levels throughout pregnancy (rs ≤ −0.26, P < 0.05). In conclusion, the ADIPOQ DNA methylation profile was associated with maternal glucose status and with maternal circulating adiponectin concentration. Because adiponectin is suspected to have insulin-sensitizing proprieties, these epigenetic adaptations have the potential to induce sustained glucose metabolism changes in the mother and offspring later in life.
With a prevalence ranging from 6.5 to 18%, gestational diabetes mellitus (GDM) is responsible for most cases of hyperglycemia during pregnancy, and its occurrence is set to grow rapidly in response to the worldwide epidemic of obesity (1). In accordance with the fetal programming (Barker) hypothesis, maternal hyperglycemia has been associated with an increased long-term risk of overweight and type 2 diabetes in offspring in many studies (2). Maternal hyperglycemia during pregnancy is consequently a major public health concern. The development of obesity-related metabolic perturbations may start very early in life, as indicated by recent studies where glucose metabolism impairment was observed in the offspring of mothers with GDM as young as 3 years of age (3–5). Of interest, exposure to an adverse fetal environment will potentially have transgenerational effects, suggesting that an initial exposure to an adverse fetal environment may have health consequences on multiple generations (6–9). Accordingly, it is expected that the increasing prevalence of GDM will result in a worsening of the prevalence of obesity and its related disorders, feeding a vicious circle.
Exact mechanisms involved in fetal programming remain to be discovered, including the possible transgenerational effect. Epigenetic phenomena have been repeatedly proposed as molecular mechanisms that could explain how a detrimental fetal environment can be associated with obesity and type 2 diabetes years after exposure, but only a few studies have addressed this hypothesis directly. Epigenetics refers to the heritable, but also reversible, regulation of DNA transcription (10), a mechanism independent of the DNA sequence. Epigenetic marks are subject to reprogramming in response to both stochastic and environmental stimuli, such as the in utero environment (11–13). The DNA methylation occurring at position 5′ of the cytosine pyrimidine ring is the more stable and best-understood epigenetic system (14). Cytosine methylation is frequently observed at CpG dinucleotide loci. A high level of methylation is associated with a lower transcription of the target genes (15,16).
The placenta plays a critical role in embryo and fetus growth and is responsive to environmental changes. It is metabolically very active and is central in the nutrient and waste exchange between the fetus and the mother. Therefore, the placenta is a unique tissue with which to study the molecular impacts of GDM (17). A few studies suggest that epigenetic gene transcription regulation contributes to explain the long-term influence of GDM on childhood health (18,19). Very recently, the level of DNA methylation of a number of epivariants has been shown to be altered in the placenta of newborns of low birth weight (20,21). These results suggest that the DNA methylation profile of human term placenta reflects the fetal growth and development with a potential impact on the newborn’s health (20,21). Accordingly, DNA methylation changes in the placenta also will likely influence the chromatin structure and thus the transcription of key energy metabolism and type 2 diabetes expression genes such as adiponectin.
Adiponectin is the most abundant circulating hormone secreted by the adipocytes, with putative insulin-sensitizing, anti-inflammatory, and antiatherosclerotic properties (22). In a normal pregnancy, the maternal adiponectin circulating concentration increases in the first half of the pregnancy and then decreases proportionally to weight gain and physiological insulin resistance worsening (22). Newborn adiponectin concentrations are higher than maternal circulating levels during pregnancy (22). Overall, it suggests that adiponectin, in addition to potentially linking excess adiposity to the risk of insulin resistance and type 2 diabetes, has a potential role in pregnancy and fetal growth (22).
In the current study, we tested whether cytosines located at ADIPOQ gene proximal promoter CpG islands harbor DNA methylation changes in placental tissues, maternal circulating blood cells, and cord blood cells are associated with maternal glucose levels during pregnancy.
RESEARCH DESIGN AND METHODS
Ninety-eight women with a singleton pregnancy were recruited during their first trimester of pregnancy in the Saguenay area from a founder population of French-Canadian origin (self-reported and confirmed by last name and first language). They were all followed until delivery with three visits (at the end of each trimester of pregnancy) at the research center, and samples were collected at each visit and at delivery. Women aged >40 years, with pre-GDM or other disorders (polycystic ovarian syndrome, uncontrolled thyroid disorders, and renal insufficiency) known to affect glucose metabolism, as well as those with a positive history of alcohol and/or drug abuse during the current pregnancy, were excluded. The Chicoutimi Hospital Ethics Committee approved the project. All women provided written informed consent before their inclusion in the study, in accordance with the Declaration of Helsinki.
BMI was measured according to the standardized procedures of the Airlie conference (23). Blood samples were collected after a 12-h fast. Blood glucose and insulin measurements were made on fresh serum samples at the Chicoutimi Hospital Clinical Laboratory. Glucose was evaluated using a Beckman analyzer (model CX7; Beckman, Fullerton, CA), and insulin measurements were performed using a radioimmunoassay method (Advia Centaur; Simmens). The homeostasis model assessment of insulin resistance (HOMA-IR) was calculated using the following equation (24): HOMA-IR = fasting glucose (mmol/L) × fasting insulin (mU/L)/22.5. Serum adiponectin levels were measured using an enzyme-linked immunosorbent assay, as recommended by the manufacturer (B-Bridge International). Glucose tolerance was assessed using a 75-g oral glucose tolerance test (OGTT) performed at 24–28 weeks’ gestation. Women with a 2-h post-OGTT glucose level ≥7.8 mmol/L were classified as having impaired glucose tolerance (IGT) and were treated with diet only (n = 17) or with diet and insulin treatment (n = 14). Two mothers with IGT did not receive any treatment.
The set of data collected is almost complete. Values may be missing because a few women missed the third visit at the research center or no plasma/serum samples were left for specific biomarker analyses. The tables and figures report the number of samples analyzed for each phenotype.
Placenta tissue sampling.
Placenta tissue was sampled in the minutes following delivery (on average <15 min) by well-trained clinicians (MD) and kept in RNALater (Qiagen, Valencia, CA) at −80°C until nucleic acid extraction. Tissue biopsies were collected from both fetal and maternal sides. The former consisted of the intervillous tissues and chorionic villi, and the latter consisted mainly of fetal villous tissue but also contained tissue of maternal origin in the deciduas basalis (basal plate). Analyses were performed on both sides independently.
ADIPOQ DNA methylation and mRNA level measurements.
DNA and RNA were purified from placenta biopsies using the All Prep DNA/RNA/Protein Mini Kit (Qiagen). DNA was purified from whole-blood and cord-blood samples with the Gentra Puregen Cell Kit (Qiagen). RNA quality was assessed with Agilent 2100 Bioanalyzer RNA Nano Chips (Agilent Technology). On average, the RNA showed good integrity (mean RNA integrity 7.99 ± 0.77).
DNA methylation levels at CpG sites were assessed using pyrosequencing (Pyromark Q24; Qiagen-Biotage). In brief, methylated cytosines are protected against a C→T transition following sodium bisulfite treatment (EpiTect Bisulfite Kit; Qiagen). Pyrosequencing is a quantitative sequencing method allowing the quantification (%) of cytosine methylation levels at each CpG site of a given genomic region. PCR primers were selected using the PyroMark Assay Design (version 2.0.1.15; Qiagen). The PCR and pyrosequencing primers for all three CpG islands tested within the ADIPOQ gene locus were AdipoA3F: 5′-GGATTTTTATTTAGGAGAGTTGTTTT-3′, AdipoA3R: 5′-ACCCTAAACCTCCCCTTTCTACC-3′ (161 bp), and AdipoA3Seq: 5′-ATTTTTATTTAGGAGAGTTGTTTTT-3′ (9 CpGs); AdipoC1F: 5′-GGTGGTAGGAGGTGATAGTTTAA-3′, AdipoC1R: 5′-ACTCCCCACCTCAAATAATCCAC-3′ (199 bp), and AdipoC1Seq: 5′-GAAATGTTTTTTTGGTTAGG-3′ (4 CpGs); and AdipoE2F: 5′-TGGTGAGTGGGATGTTTTGTTTTA-3′, AdipoE2R: 5′-ACACACACCTCCACCTAT-3′ (180 bp), and AdipoE2Seq: 5′-CACACACCTCCACCTATA-3′ (4 CpGs). One of 98 DNA samples (from the mother’s side) did not amplify and therefore was not analyzed.
cDNA was generated from total RNA using a random primer hexamer provided with the High Capacity cDNA Archive Kit (Applied Biosystems, Foster City, CA). Equal amounts of cDNA were run in duplicate and amplified in a 20-μL reaction containing 10 μL of 2 × Universal PCR Master Mix (Applied Biosystems). Primers and Taqman probes were obtained from Applied Biosystems (ADIPOQ: Hs00605917_m1; Applied Biosystems). The YWHAZ housekeeping gene (endogenous control; YWHAZ: Hs00237047_m1) (25,26) was amplified in parallel. ADIPOQ and YWHAZ amplifications were performed using an Applied Biosystems 7500 Real Time PCR System, as recommended by the manufacturer (Applied Biosystems). ADIPOQ polymorphisms were genotyped using primers and Taqman probes (assay nos. C_33187774_10 [rs17300539], C_33187743_10 [rs17366743], and C_1486294_10 [rs6773957] and a custom assay for rs822387 [PCR primers: forward 5′-CCTTTGTCCATTTTCTAATTGAATTTTTTTTTACCATTT-3′ and reverse 5′-GGAATGTATTTGCAAACCATATTTGAGACA-3′; TaqMan probes: 5′-AGATTTGGATCTGGATTGT-3′ and 5′-AGATTTGGATCTAGATTGT-3′]) (Applied Biosystems), as presented elsewhere (27). Genotypes were determined using a 7500 Fast Real Time PCR System and analyzed using 7500 software (version 2.0.1; Applied Biosystems). The genotype call rate was 100% for each polymorphism analyzed.
Statistical analyses.
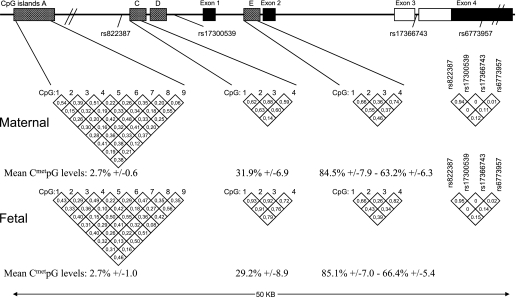
Mean locus DNA methylation levels from fetal and maternal sides were computed among the cytosines showing within correlation (r2) levels >0.6 (Fig. 1). The computed mean values were used for correlation analyses.
FIG. 1.
Adiponectin (ADIPOQ) gene locus (chromosome 3q27). Numbers in the diamond shapes report Spearman correlation coefficients between CpG sites or linkage disequilibrium values (r2) between ADIPOQ SNPs, as computed with Haploview 4.0.
Spearman rank correlation coefficients were used to test associations between the DNA methylation level and the main variables of interest (maternal fasting glucose and insulin, HOMA-IR, glycemic results at OGTT, and adiponectin circulating levels). Correlations between 2-h glucose or adiponectin circulating levels and possible confounders (age, BMI, weight change over pregnancy, insulin levels, HOMA-IR, and time between birth and placenta sampling) also were tested. Accordingly, the potential confounders (those with significant effects in the correlation models) were added to the statistical models, when appropriate. A t test was used to assess the statistical differences in mean DNA methylation between normoglycemic and groups with IGT. Results were considered statistically significant when P values were <0.05 (two sided). Statistical analyses were performed using SAS software (version 9.1.3).
RESULTS
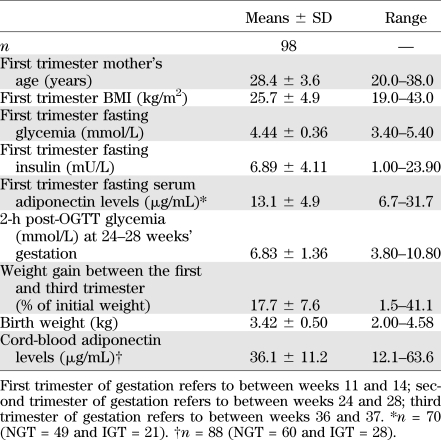
Maternal and offspring characteristics including glucose-related metabolic markers are presented in Table 1. On average, women were slightly overweight at the first trimester of pregnancy and were generally metabolically healthy, all having a normal fasting glucose concentrations. Thirty-one women were classified as having IGT, and 67 were normoglycemic according to the World Health Organization guidelines (28). Only two women fulfilled the American Diabetes Association criteria for GDM diagnosis (29). As expected, higher adiponectinemia in cord blood was associated with a higher birth weight (rs = 0.26, P = 0.02) (30).
TABLE 1.
Maternal and offspring characteristics
DNA methylation analyses and genomic context.
A total of 17 CpGs located within three ADIPOQ locus CpG islands were epigenotyped. CpG islands and the results are illustrated in Fig. 1. The most upstream CpG island (A3) investigated is located roughly 20 kb from the first exon. The nine CpGs tested at this locus demonstrated very low levels of methylation (mean DNA methylation = 2.7%), and thus the results were not analyzed. The second CpG island (C1) is located within the proximal promoter region (4 kb upstream the first exon). The four CpGs investigated within the C1 locus showed average methylation levels ~30% (C1_mean). Finally, the third CpG island (E2) is located between the first and second exons. Mean DNA methylation levels were, on average, between 85% (CpGs 1 and 2; E2_mean1) and 63% (CpGs 3 and 4; E2_mean2), depending on their location within the island. Although mean DNA methylation levels between both placenta sides were similar, the cytosine methylation level correlations between both placenta sides were found to be generally weak and not significant for most of the 17 CpGs tested (C1_mean: rs < 0.19, P = 0.07; E2_mean1: rs < 0.09, P = 0.37; and E2_mean2: rs < 0.10, P = 0.32).
Nevertheless, DNA methylation levels generally were found to be well correlated between CpG sites within the C1 and E2 CpG islands. They were analyzed together when the correlation coefficient was ≥0.60, resulting in three separate means (C1_mean, E2_mean1, and E2_mean2; as illustrated in Fig. 1).
DNA methylation levels at these 17 loci also were measured in DNA extracted from circulating blood cells (maternal and cord blood). Again, cytosines within the A3 island were found to be unmethylated, whereas cytosines in both C1 and E2 loci were fully methylated (tested in 10 samples each; data not shown).
Correlations between maternal glucose levels and DNA methylation levels in placental tissues.
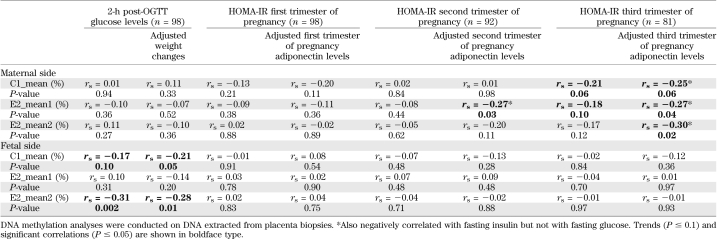
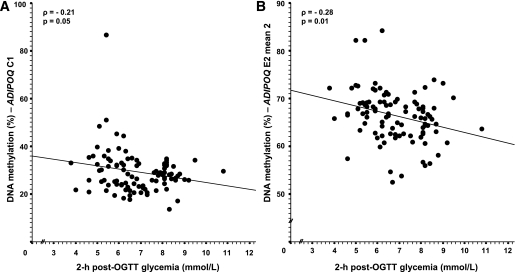
A higher level of maternal glucose at 2 h post-OGTT was associated with lower mean DNA methylation levels at the C1 (CpG 1–4) and E2 (CpGs 3 and 4) CpG islands on the fetal side of the placenta (Table 2 and Fig. 2). Adjusting the statistical models for weight gain over pregnancy as a potential confounder did not affect the relationship significantly (Table 2). Results remained unchanged after further adjustment for HOMA-IR (results not shown). Mean DNA methtylation differences in the fetal side of the placenta between women who were normoglycemic (normal glucose tolerance [NGT]) and those who had IGT also were analyzed. We found that E2_mean2 DNA methylation levels were slightly lower in the group with IGT compared with women with NGT (67.03 ± 0.65% vs. 64.92 ± 0.96%), but the comparison did not reach statistical significance (P = 0.07).
TABLE 2.
Spearman correlation coefficient between placenta ADIPOQ DNA methylation levels and 2-h post-OGTT glucose concentrations and HOMA-IR throughout pregnancy
FIG. 2.
Spearman correlation between placental ADIPOQ gene promoter DNA methylation and 2-h post-OGTT glucose levels. Adjusted for weight gain between the first and third trimester (n = 98).
A higher maternal insulin resistance at the second and third trimesters reflected by an increased HOMA-IR value was associated with lower DNA methylation levels (mainly at the E2 CpG island) on the maternal side of the placental tissue (Table 2). Adjustment for the corresponding trimester circulating adiponectin concentration substantially improved the relationship (Table 2). Correlations remained significant after excluding the women taking insulin as a treatment for their GDM.
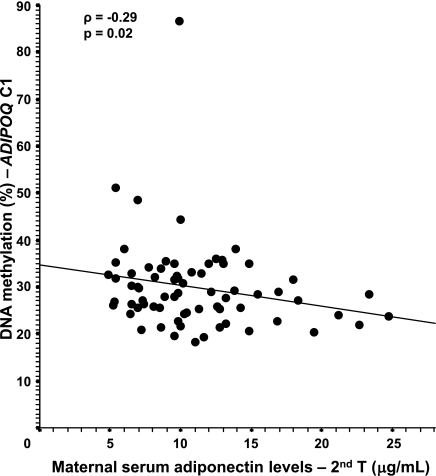
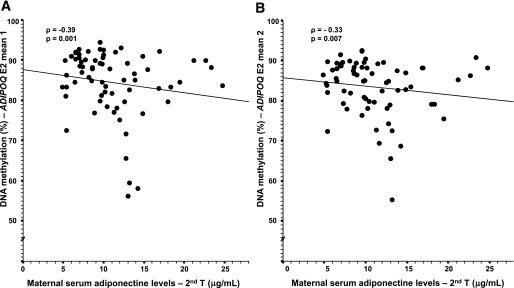
The level of DNA methylation on the fetal side at the C1 island (which was associated with the maternal 2-h glucose level) also was associated with maternal adiponectin levels from the second trimester to postpartum (Table 3 and Fig. 3). On the maternal side of the placenta, a higher level of DNA methylation at the E2 island was associated with a lower maternal adiponectin levels throughout pregnancy and postdelivery (Table 3 and Fig. 4); the strength of association was enhanced by adjustment for maternal BMI and insulin resistance levels (HOMA-IR). The results remained unchanged after further adjustment for weight gain over pregnancy and 2-h post-OGTT glucose levels (results not shown).
TABLE 3.
Spearman correlation coefficient between placenta ADIPOQ DNA methylation levels and adiponectin concentrations through the pregnancy, at delivery, and in cord blood
FIG. 3.
Spearman correlation between the fetal side of the placenta ADIPOQ gene promoter DNA methylation and maternal serum levels. Adjusted for the mother’s BMI at the first trimester and HOMA-IR at the second trimester. The results remained unchanged after the removal of the single outlier (n = 70).
FIG. 4.
Spearman correlation between the maternal side of the placenta ADIPOQ gene promoter DNA methylation and maternal serum levels. Adjusted for the mother’s BMI at the first trimester and HOMA-IR at the second trimester. The results remained unchanged after the removal of the single outlier (n = 70).
ADIPOQ transcriptomic and genetic analyses.
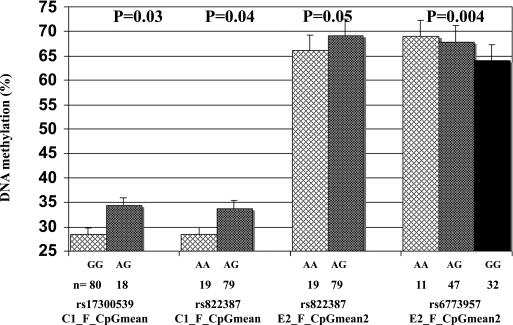
Four ADIPOQ single nucleotide polymorphisms (SNPs) were genotyped. SNPs were selected based on previous literature and were associated with adiponectin levels (rs17300539, rs822387, and rs6773957) or glycemic regulation (rs17366743) in other populations. Located in the promoter region, rs17300539 and rs822387 (linkage disequilibrium: r2 = 0.95) were associated with DNA methylation levels at the C1 island on the fetal side (P = 0.03 and P = 0.04, respectively) (Fig. 5). SNPs rs822387 (promoter) and rs6773957 (located at 3′ untranslated region) were associated with DNA methylation at the E2 island on the fetal side (P = 0.05 and P = 0.004, respectively) (Fig. 5). No significant association was found between adiponectin circulating concentrations during pregnancy and these three polymorphisms. Placenta ADIPOQ expression also was assessed, but its transcripts were undetectable in both placenta sides.
FIG. 5.
Fetal side of the placenta DNA methylation levels according to ADIPOQ genotypes.
DISCUSSION
The intrauterine life is a critical period suspected to impact the long-term programming of the energy homeostasis regulation and consequently plays an important role in determining children’s susceptibility to obesity and type 2 diabetes (31,32). However, the molecular mechanisms linking fetal life and the long-term increased risk to develop obesity and type 2 diabetes are poorly understood. Epigenetic changes such as DNA methylation could be one of the implicated molecular mechanisms. Previously, we showed that DNA methylation levels in the leptin gene promoter region were correlated with 2-h post-OGTT glycemia in placenta exposed to IGT during pregnancy (33). In the current study, we found that placental ADIPOQ gene DNA methylation levels were associated with maternal glucose metabolism and that this relationship existed throughout the maternal glycemic range (both NGT and IGT).
Of interest, DNA methylation levels on the fetal side of the placenta were associated specifically to the maternal glycemic levels in response to an oral glucose challenge and not to the insulin concentration (or HOMA-IR), suggesting that glucose, per se, could influence the epigenetic profile. This observation is biologically plausible knowing that glucose crosses the placenta, whereas insulin does not. Moreover, the association is observed with glucose levels at the 2-h post-OGTT, arguing for the importance of testing glycemic levels in response to glucose intake for diagnosis and treatment of GDM. GDM is a complex trait, and although cutoff values must be reached for its diagnosis, it is clear that the development and growth of the fetus are influenced by glucose levels throughout the full range of physiologic and pathophysiologic levels, with no lower threshold value (34). Moreover, it was demonstrated that high maternal glucose concentrations lying below the American Diabetes Association cutoff for GDM is associated with excess adiposity in childhood (35), suggesting that a slight increase of glycemia could be associated with detrimental long-term health effects for the offspring and should be prevented when possible. In the current study, we have shown that even intermediate glucose intolerance is correlated with the ADIPOQ DNA methylation profile. This evidence supports the use of more inclusive GDM cutoff values, such as the ones suggested by the International Association of Diabetes and Pregnancy Study Groups to reduce as much as possible hyperglycemia deleterious effects on newborns’ health (34).
It also has been suggested that adiponectin downregulates its own production via a regulatory feedback loop (36). However, adiponectin does not pass through the placental barrier (22) (similarly to insulin), so it is unlikely that maternal adiponectin levels influence DNA methylation on the fetal side. However, it is likely that the association between fetal-side DNA methylation levels and maternal adiponectin levels reflect some common factors associated with both. Many factors influencing the ADIPOQ gene DNA methylation profile remain to be identified because our model only partially explains (rs = −0.28) its interindividual variability. Research to identify those factors should be undertaken.
With regards to the maternal side of the placenta, a higher maternal insulin resistance was associated with lower DNA methylation levels at the ADIPOQ locus, and this association was strengthened after adjusting for circulating adiponectin concentrations. Our results suggest that insulin resistance is correlated with ADIPOQ DNA methylation levels in maternal tissues. Moreover, we showed that DNA methylation at the ADIPOQ gene locus was correlated with circulating adiponectin concentrations at each trimester of pregnancy and postdelivery, which strongly suggests that these epigenetic marks are biologically functional. The correlation between DNA methylation and maternal circulating adiponectin levels also is strengthened by adjustment for HOMA-IR, suggesting that the regulation of the adiponectin expression is influenced by the level of insulin resistance. Because we and others (37,38) showed that the placenta itself does not express adiponectin, our results suggest that placental DNA methylation changes on the maternal side are surrogate measures of the changes taking place in the maternal adipose tissue. However, we cannot exclude that the ADIPOQ gene may have been expressed at some point in the placenta during the pregnancy, because the C1 and E2 CpGs islands were not fully methylated, contrary to what was observed in cord and mother circulating blood cells (known not to express ADIPOQ). This could explain the controversial results published to date about the potential adiponectin production by the placenta (37–39). Nevertheless, our results suggest that the placenta is useful for the study of epigenetic adaptations to the fetal milieu as already suggested (17), even for genes with very low (or absent) expression such as adiponectin.
We confirmed that a higher adiponectinemia in cord blood is associated with a higher birth weight, in line with previous observations (30); this is in contrast to the inverse association between the adiposity status and adiponectin levels in adults. It has been suggested that the number of small healthy adipocytes and a favorable ratio of subcutaneous to visceral fat at birth could explain the positive relationship (30). This is consistent with the Perdersen hypothesis (40,41): maternal glucose crossing the placental barrier stimulates fetal insulin production, leading to growth of the baby, including adipose tissue differentiation and expansion and, by consequence, higher adiponectin levels in cord blood at birth. Nevertheless, there also is data showing that newborns from mothers with GDM have lower adiponectin levels (42), suggesting that the adipose tissue already could be affected by adverse events occurring in utero. In our sample, only two women were classified as having GDM; therefore, we could not confirm this observation and test whether GDM was associated with a different DNA methylation pattern.
Although it has been suggested that epigenetic marks can be short-lived and rapidly reversed, it is well accepted that they are mitotically stable and relatively enduring, with only marginal changes over time, producing long-term changes to gene expression (11,13,43–45). Therefore, we propose that the initial ADIPOQ gene DNA methylation profile of an individual, partially determined by the fetal milieu, will contribute to limiting or worsening the switch from a positive correlation with weight at birth to a negative one later in life in response to aging and environmental and metabolic factors. This could be associated with an increased risk or not of developing obesity and type 2 diabetes.
Strengths and limitations.
Among the strengths of our study, the longitudinal follow-up starting at the first trimester with standardized testing for glucose regulation allowed us to correctly identify women with de novo IGT during pregnancy and avoided misclassifications (46). The technologies used for genotyping and measures of DNA methylation levels are well validated and reliable. Our sample size was fairly large compared with other studies looking at epigenetic mechanisms and allowed us to take into account possible confounding factors. Nevertheless, our study also has limitations. We interpreted the association between maternal adiponectin levels and placental DNA methylation at the ADIPOQ locus as being a reflection of maternal adipose tissue (as the only human tissue known to produce and secrete adiponectin). Unfortunately, adipose tissue was not available to confirm these associations. This study was conducted in a homogeneous population from European descent, which is a strength in genetics and epigenetics studies, but our findings might not be applicable to other populations.
Conclusions.
It is expected that the number of women affected by hyperglycemic disorders in pregnancy will increase in association with the growing prevalence of obesity. We also know that in utero exposure to hyperglycemia increases the risk of obesity and insulin resistance in offspring, feeding forward the vicious circle. Our results suggest that epigenetic changes around ADIPOQ could be one of the mechanisms involved in fetal programming of metabolic disorders of adult life. Investigations concerning other genes in energy balance, glycemic regulation, and insulin resistance pathways, including functional studies, will be essential to confirm our findings. Identification of molecular mechanisms and genes involved in the fetal programming of energy metabolism will improve our understanding of the pathophysiological processes involved in metabolic disorders and, hopefully, help to limit the vicious cycle contributing to the actual obesity/diabetes epidemic.
Supplementary Material
ACKNOWLEDGMENTS
M.-F.H. is supported by a Canadian Diabetes Association Clinical Scientist Award.
No potential conflicts of interest relevant to this article were reported.
L.B. conceived the study design, performed the data analysis and interpretation, and wrote the manuscript. M.-F.H., J.S.-P., and P.P. participated in the conception of the study design and revised the manuscript. S.-P.G. performed the data collection and revised the manuscript. D.B. participated in the conception of the study design and data analysis and interpretation and revised the manuscript. L.B. and M.-F.H. are junior research scholars from the Fonds de la Recherche en Santé du Québec. L.B. is the guarantor of this work and, as such, had full access to all the data in the study and takes responsibility for the integrity of the data and the accuracy of the data analysis.
The authors acknowledge the contribution of Sébastien Claveau, MSc, ECOGENE-21 Laboratory; Nadia Mior, ECOGENE-21 Laboratory; Johannie Munger, Université de Sherbrooke; Jeanine Landry, RN, ECOGENE-21 Clinical Research Center; and Chantale Aubut, RN, ECOGENE-21 Clinical Research Center for their dedicated work in this study. The authors also express their gratitude to Céline Bélanger, Chicoutimi Hospital, for her thoughtful revision of the manuscript.
Footnotes
See accompanying commentary, p. 981.
REFERENCES
- 1.Berger H, Crane J, Farine D, et al. Maternal-Fetal Medicine Committee. Executive and Council for the Society of Obstetricians and Gynaecologists of Canada Screening for gestational diabetes mellitus. J Obstet Gynaecol Can 2002;24:894–912 [DOI] [PubMed] [Google Scholar]
- 2.Clausen TD, Mathiesen ER, Hansen T, et al. Overweight and the metabolic syndrome in adult offspring of women with diet-treated gestational diabetes mellitus or type 1 diabetes. J Clin Endocrinol Metab 2009;94:2464–2470 [DOI] [PubMed] [Google Scholar]
- 3.Krishnaveni GV, Hill JC, Leary SD, et al. Anthropometry, glucose tolerance, and insulin concentrations in Indian children: relationships to maternal glucose and insulin concentrations during pregnancy. Diabetes Care 2005;28:2919–2925 [DOI] [PubMed] [Google Scholar]
- 4.Wright CS, Rifas-Shiman SL, Rich-Edwards JW, Taveras EM, Gillman MW, Oken E. Intrauterine exposure to gestational diabetes, child adiposity, and blood pressure. Am J Hypertens 2009;22:215–220 [DOI] [PMC free article] [PubMed] [Google Scholar]
- 5.Bunt JC, Tataranni PA, Salbe AD. Intrauterine exposure to diabetes is a determinant of hemoglobin A(1)c and systolic blood pressure in pima Indian children. J Clin Endocrinol Metab 2005;90:3225–3229 [DOI] [PMC free article] [PubMed] [Google Scholar]
- 6.Drake AJ, Walker BR. The intergenerational effects of fetal programming: non-genomic mechanisms for the inheritance of low birth weight and cardiovascular risk. J Endocrinol 2004;180:1–16 [DOI] [PubMed] [Google Scholar]
- 7.Hass BS, Hart RW, Lu MH, Lyn-Cook BD. Effects of caloric restriction in animals on cellular function, oncogene expression, and DNA methylation in vitro. Mutat Res 1993;295:281–289 [DOI] [PubMed] [Google Scholar]
- 8.Margetts BM, Mohd Yusof S, Al Dallal Z, Jackson AA. Persistence of lower birth weight in second generation South Asian babies born in the United Kingdom. J Epidemiol Community Health 2002;56:684–687 [DOI] [PMC free article] [PubMed] [Google Scholar]
- 9.Pinto ML, Shetty PS. Influence of exercise-induced maternal stress on fetal outcome in Wistar rats: inter-generational effects. Br J Nutr 1995;73:645–653 [DOI] [PubMed] [Google Scholar]
- 10.Henikoff S, Matzke MA. Exploring and explaining epigenetic effects. Trends Genet 1997;13:293–295 [DOI] [PubMed] [Google Scholar]
- 11.Heijmans BT, Tobi EW, Stein AD, et al. Persistent epigenetic differences associated with prenatal exposure to famine in humans. Proc Natl Acad Sci USA 2008;105:17046–17049 [DOI] [PMC free article] [PubMed] [Google Scholar]
- 12.Jaenisch R, Bird A. Epigenetic regulation of gene expression: how the genome integrates intrinsic and environmental signals. Nat Genet 2003;33(Suppl.):245–254 [DOI] [PubMed] [Google Scholar]
- 13.Tobi EW, Lumey LH, Talens RP, et al. DNA Methylation differences after exposure to prenatal famine are common and timing- and sex-specific. Hum Mol Genet 2009;18:4046–4053 [DOI] [PMC free article] [PubMed] [Google Scholar]
- 14.Bird A. DNA methylation patterns and epigenetic memory. Genes Dev 2002;16:6–21 [DOI] [PubMed] [Google Scholar]
- 15.Jones L, Hamilton AJ, Voinnet O, Thomas CL, Maule AJ, Baulcombe DC. RNA-DNA interactions and DNA methylation in post-transcriptional gene silencing. Plant Cell 1999;11:2291–2301 [DOI] [PMC free article] [PubMed] [Google Scholar]
- 16.Klose RJ, Bird AP. Genomic DNA methylation: the mark and its mediators. Trends Biochem Sci 2006;31:89–97 [DOI] [PubMed] [Google Scholar]
- 17.Maccani MA, Marsit CJ. Epigenetics in the placenta. Am J Reprod Immunol 2009;62:78–89 [DOI] [PMC free article] [PubMed] [Google Scholar]
- 18.Constância M, Kelsey G, Reik W. Resourceful imprinting. Nature 2004;432:53–57 [DOI] [PubMed] [Google Scholar]
- 19.Jansson T, Powell TL. Role of the placenta in fetal programming: underlying mechanisms and potential interventional approaches. Clin Sci (Lond) 2007;113:1–13 [DOI] [PubMed] [Google Scholar]
- 20.Banister CE, Koestler DC, Maccani MA, Padbury JF, Houseman EA, Marsit CJ. Infant growth restriction is associated with distinct patterns of DNA methylation in human placentas. Epigenetics 2011;6:920–927 [DOI] [PMC free article] [PubMed] [Google Scholar]
- 21.Filiberto AC, Maccani MA, Koestler D, et al. Birthweight is associated with DNA promoter methylation of the glucocorticoid receptor in human placenta. Epigenetics 2011;6:566–572 [DOI] [PMC free article] [PubMed] [Google Scholar]
- 22.Brochu-Gaudreau K, Rehfeldt C, Blouin R, Bordignon V, Murphy BD, Palin MF. Adiponectin action from head to toe. Endocrine 2010;37:11–32 [DOI] [PubMed] [Google Scholar]
- 23.Lohman TG, Roche AF, Martorell R. Anthropometric Standardization Reference Manual. Champaign, IL, Human Kinetics Books, 1988, p. 55–80 [Google Scholar]
- 24.Bonora E, Targher G, Alberiche M, et al. Homeostasis model assessment closely mirrors the glucose clamp technique in the assessment of insulin sensitivity: studies in subjects with various degrees of glucose tolerance and insulin sensitivity. Diabetes Care 2000;23:57–63 [DOI] [PubMed] [Google Scholar]
- 25.Meller M, Vadachkoria S, Luthy DA, Williams MA. Evaluation of housekeeping genes in placental comparative expression studies. Placenta 2005;26:601–607 [DOI] [PubMed] [Google Scholar]
- 26.Murthi P, Fitzpatrick E, Borg AJ, Donath S, Brennecke SP, Kalionis B. GAPDH, 18S rRNA and YWHAZ are suitable endogenous reference genes for relative gene expression studies in placental tissues from human idiopathic fetal growth restriction. Placenta 2008;29:798–801 [DOI] [PubMed] [Google Scholar]
- 27.Bouchard L, Tchernof A, Deshaies Y, et al. ZFP36: a promising candidate gene for obesity-related metabolic complications identified by converging genomics. Obes Surg 2007;17:372–382 [DOI] [PubMed] [Google Scholar]
- 28.World Health Organization Definition, Diagnosis and Classification of Diabetes Mellitus and Its Complications: Report of a WHO Consultation. Part 1: Diagnosis and Classification of Diabetes Mellitus. Geneva, World Health Org, 1999 [Google Scholar]
- 29.American Diabetes Association Diagnosis and classification of diabetes mellitus. Diabetes Care 2009;32(Suppl. 1):S62–S67 [DOI] [PMC free article] [PubMed] [Google Scholar]
- 30.Mantzoros CS, Rifas-Shiman SL, Williams CJ, Fargnoli JL, Kelesidis T, Gillman MW. Cord blood leptin and adiponectin as predictors of adiposity in children at 3 years of age: a prospective cohort study. Pediatrics 2009;123:682–689 [DOI] [PMC free article] [PubMed] [Google Scholar]
- 31.Hales CN, Barker DJ. Type 2 (non-insulin-dependent) diabetes mellitus: the thrifty phenotype hypothesis. Diabetologia 1992;35:595–601 [DOI] [PubMed] [Google Scholar]
- 32.Barker DJ, Hales CN, Fall CH, Osmond C, Phipps K, Clark PM. Type 2 (non-insulin-dependent) diabetes mellitus, hypertension and hyperlipidaemia (syndrome X): relation to reduced fetal growth. Diabetologia 1993;36:62–67 [DOI] [PubMed] [Google Scholar]
- 33.Bouchard L, Thibault S, Guay SP, et al. Leptin gene epigenetic adaptation to impaired glucose metabolism during pregnancy. Diabetes Care 2010;33:2436–2441 [DOI] [PMC free article] [PubMed] [Google Scholar]
- 34.Metzger BE, Gabbe SG, Persson B, et al. International Association of Diabetes and Pregnancy Study Groups Consensus Panel International association of diabetes and pregnancy study groups recommendations on the diagnosis and classification of hyperglycemia in pregnancy. Diabetes Care 2010;33:676–682 [DOI] [PMC free article] [PubMed] [Google Scholar]
- 35.Deierlein AL, Siega-Riz AM, Chantala K, Herring AH. The association between maternal glucose concentration and child BMI at age 3 years. Diabetes Care 2011;34:480–484 [DOI] [PMC free article] [PubMed] [Google Scholar]
- 36.Bauche IB, Ait El Mkadem S, Rezsohazy R, et al. Adiponectin downregulates its own production and the expression of its AdipoR2 receptor in transgenic mice. Biochem Biophys Res Commun 2006;345:1414–1424 [DOI] [PubMed] [Google Scholar]
- 37.Chen J, Tan B, Karteris E, et al. Secretion of adiponectin by human placenta: differential modulation of adiponectin and its receptors by cytokines. Diabetologia 2006;49:1292–1302 [DOI] [PubMed] [Google Scholar]
- 38.Mazaki-Tovi S, Kanety H, Pariente C, et al. Determining the source of fetal adiponectin. J Reprod Med 2007;52:774–778 [PubMed] [Google Scholar]
- 39.Meller M, Qiu C, Vadachkoria S, Abetew DF, Luthy DA, Williams MA. Changes in placental adipocytokine gene expression associated with gestational diabetes mellitus. Physiol Res 2006;55:501–512 [DOI] [PubMed] [Google Scholar]
- 40.Pedersen J. Weight and length at birth of infants of diabetic mothers. Acta Endocrinol (Copenh) 1954;16:330–342 [DOI] [PubMed] [Google Scholar]
- 41.Pedersen J, Bojsen-Møller B, Poulsen H. Blood sugar in newborn infants of diabetic mothers. Acta Endocrinol (Copenh) 1954;15:33–52 [DOI] [PubMed] [Google Scholar]
- 42.Cortelazzi D, Corbetta S, Ronzoni S, et al. Maternal and foetal resistin and adiponectin concentrations in normal and complicated pregnancies. Clin Endocrinol (Oxf) 2007;66:447–453 [DOI] [PubMed] [Google Scholar]
- 43.Kangaspeska S, Stride B, Métivier R, et al. Transient cyclical methylation of promoter DNA. Nature 2008;452:112–115 [DOI] [PubMed] [Google Scholar]
- 44.Wong CC, Caspi A, Williams B, et al. A longitudinal study of epigenetic variation in twins. Epigenetics 2010;5:516–526 [DOI] [PMC free article] [PubMed] [Google Scholar]
- 45.Petronis A. Epigenetics as a unifying principle in the aetiology of complex traits and diseases. Nature 2010;465:721–727 [DOI] [PubMed] [Google Scholar]
- 46.Allen VM, Armson BA, Wilson RD, et al. Society of Obstetricians and Gynecologists of Canada Teratogenicity associated with pre-existing and gestational diabetes. J Obstet Gynaecol Can 2007;29:927–944 [DOI] [PubMed] [Google Scholar]
Associated Data
This section collects any data citations, data availability statements, or supplementary materials included in this article.


