

Abstract
Single-molecule force spectroscopy is used to probe the kinetics of receptor-ligand bonds by applying mechanical forces to an intermediate media on which the molecules reside. When this intermediate media is a live cell, the viscoelastic properties can affect the calculation of rate constants. We theoretically investigate the effect of media viscoelasticity on the common assumption that the bond force is equal to the instantaneous applied force. Dynamic force spectroscopy is simulated between two cells of varying micromechanical properties adhered by a single bond with a constant kinetic off-rate. We show that cell and microvilli deformation, and hydrodynamic drag contribute to bond forces that can be 28–90% lower than the applied force for loading rates of 103–107 pN/s, resulting in longer bond lifetimes. These longer bond lifetimes are not caused by changes in bond kinetics; rather, they are due to the mechanical response of the intermediate media on which the bonds reside. Under the assumption that the instantaneous bond force is equal to the applied force—thereby ignoring viscoelasticity—leads to 14–39% error in the determination of off-rates. We present an approach that incorporates viscoelastic properties in calculating the instantaneous bond force and kinetic dissociation parameter of the intermolecular bond.
Introduction
Single-molecule force spectroscopy experiments are commonly used to probe receptor-ligand bond kinetics by applying an external load and measuring the response (1). In these experiments, a force is applied to a molecule that is attached to a media that can be mechanically manipulated until bond rupture is observed (2). Known as off-rates, the force-dependent kinetics of this process can be determined by measuring rupture forces under a range of externally applied constant loading rates, an approach popularized by dynamic force spectroscopy (DFS) experiments (3,4). Dissociation force measurements have been made using AFM (5), a biomembrane force probe (BFP) (6), or a microcantilever (7). Substantial discrepancies exist between the force dependence of off-rates derived from these techniques even for the same interactions (5,8). For example, for the P-selectin:P-selectin glycoprotein ligand-1 (PSGL-1) pair, the derived unstressed dissociation rates vary from 0.02 s−1 to 48.7 s−1 when the loading rate is varied 101–105 pN/s (9).
It is difficult to identify the causes for the discrepancies because different laboratories obtained their results using different reagents and techniques. In the literature, (2,10–14) this is attributed to the differences in the length of interacting molecules, the variations in length and elasticity of linker molecules, and the distinctive schemes of molecular immobilization onto a sharp or round surface. Generally, the media used are relatively stiff materials, such as AFM tips or polystyrene beads. The use of DFS to determine kinetic off-rates was initially implemented using solid beads coated with adhesion molecules that were immersed in a fluid media (3). To make analysis of the rupture force data tractable and extract the kinetic off-rate, it is assumed that the force on a single molecular bond is instantaneously equal to the externally applied force (15–17), in part because direct measurement of the bond force as a function of time is difficult. It is relatively easy to determine the externally applied force through instrument calibration.
A general model of the DFS process is presented in Fig. 1. It illustrates two spherical cells (radius = R) suspended in a Newtonian fluid of density ρ and viscosity μ, adhered by a single molecular bond that is modeled as a linear spring (spring constant = σ, Fb(t) = σ(t)). When the cells are leukocytes (white blood cells), the bond is formed between adhesion molecules residing on microvilli, which are microscopic cellular membrane protrusions that increase the surface area of cells (18). An equal and opposite force F(t) = Rft, where Rf is the dynamic loading rate, is applied on the surface of each cell along the line connecting their centers causing bond stretching and eventually bond rupture. Applying Newton's second law to the free body diagram of the forces on a cell (sphere) gives
| (1) |
where M is the mass of the cell that is assumed fixed on the timescale of a force spectroscopy experiment, and other forces arise from the viscous stresses of the suspending fluid, contact forces, and any other force in the particular experimental setup that act on the cell (sphere). If one neglects the inertia of the cell (sphere), which is appropriate at this length scale, and the other forces present in the experimental system, the equation of motion reduces to
| (2) |
which leads to the assumption that the bond and applied forces are instantaneously equal. It is apparent that neglecting other system forces and assuming the bond force is instantaneously equal to the applied force is dependent on the experimental conditions.
Figure 1.
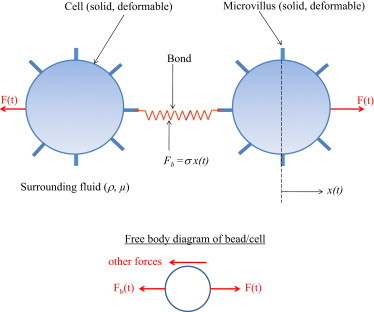
Schematic of two PMN cells detachment simulation (not drawn to scale) through binding between PSGL-1 (receptor) and L-selectin (ligand) molecules concentrated on the tip of PMN microvillus.
Recently, the practice of live cell experimentation (19–21) has been employed to test the hypothesis that the measured kinetic off-rate is different when the bond is formed on live cells rather than on solid beads. Force spectroscopy on live cells moves experimentation closer to physiological conditions. However, live cell experimentation introduces conditions that could cause deviations from the instantaneous load assumption described above (22). Notable, an external force can lead to the deformation of live cells. This deformation requires the use of a viscoelastic constitutive model to describe the cell. The degree of cell deformability is determined by various factors including lipid compositions, transmembrane proteins, interplay between lipids and proteins, pulling or protruding force by the cytoskeleton (and associated motors), and scaffolding effects by cytosolic coat proteins (23).
Comparison of simulation (24) with experiments (25) has shown that microvilli deformation leads to increased bond stability and longer bond lifetimes, as well as relatively smoother and slower rolling of polymorphonuclear leukocytes (PMNs) on P-selectin coated substrate. Evans et al. (26) and Heinrich et al. (27) performed experiments using a BFP to show two distinct regimes in the force-induced dissociation of P-selectin-PSGL-1 bond. In the first regime, the force increases linearly with time, indicating an initial linear-elastic deformation of the cell (26). The transition to the second regime is marked by an abrupt decrease in the rate at which the force increases. In the second regime, the force increases rather slowly and approaches a plateau.
This behavior indicates membrane separation from the interior cytoskeleton and the onset of tether flow (26,27). King et al. (28) used DFS-derived kinetics of P-selectin-PSGL-1 bonds (26,27) to reproduce the tethering behavior of PMN rolling on P-selectin under flow and concluded that “…omission of the cell-interfacial elasticity, viscous tether extrusion, dissociation of PSGL-1 from the cytoskeleton, multiple bonding, and cell compression have all contributed to the inaccurate P-selectin:PSGL-1 dissociation kinetic rate constants….” Hence, in this study we examine how the viscoelasticity of the cell body, in conjunction with the properties of the microvillus, affects estimation of kinetic dissociation parameter of the intermolecular bond.
In this study, we also examine whether the analysis developed to obtain kinetic off-rates from experiments employing stiff materials (bead, AFM) can be extended to experiments involving viscoelastic materials (live cells). Simple models of systems that contain both elastic and viscous components have been used to demonstrate a time lag in the applied force and the force in the spring (consider analysis of an overdamped system). We model force spectroscopy experiments of four different micromechanical cell models of increasing elasticity in the presence of viscous stress, and analyze force-rupture data. We demonstrate that for undeformable cells the assumption that the bond and applied forces are instantaneously equal yields reasonably accurate estimations of the unstressed kinetic off-rate, but for deformable cells, the assumption breaks down due to a rate-dependent viscoelastic time lag in the transmission of the applied force through the cell to the bond (22).
Computational Method
Our model parameters are chosen to relate the conceptual model in Fig. 1 to a realistic DFS experiment using live cells. Relevant loading rates in the range of (103–107 pN/s) used in DFS experiments are considered (10,29). We consider two PMNs adhered by a single L-selectin-PSGL-1 bond (30,31). We consider four cell-microvilli mechanical models: a), solid cell with solid microvilli; b), solid cell with deformable microvilli; c), deformable cell with solid microvilli; and d), deformable cell with deformable microvilli. These models were chosen to isolate the effects of cell and microvillus viscoelasticity alone and study their effects in combination. Cell deformation in a suspended viscous media has been observed (32), while microvillus viscoelasticity has been determined by Shao et al. (18), hence Model d may be the most relevant. Each cell-microvilli mechanical model generates a unique time varying bond stretch, x(t). Knowing bond stretch for a given cell-microvilli mechanical model, we simulate bond rupture using the Monte Carlo technique (33). The details of these models are given in the Supporting Material. We simulated adhesion and detachment of two PMN cells using the parameter values listed in Table 1 unless stated otherwise.
Table 1.
Parameter values used in the model
| Parameter | Definition | Value |
|---|---|---|
| R | PMN radius | 3.75 μm |
| Lmv | Length of microvillus | 0.35 μm |
| λ | Receptor-ligand bond length | 0.07 μm |
| Unstressed on-rate | 3 s−1 | |
| Unstressed off-rate | 3 s−1 | |
| σ | Spring constant | 4 dyn/cm |
| σts | Transition state spring constant | 3.96 dyn/cm |
| Eh | Membrane stiffness | 3.0 dyn/cm |
| σm | Microvillus spring constant | 43 pN/μm |
| μm | Effective viscosity of tether | 11 pN.s/μm |
| μ | Fluid viscosity | 0.8 cP |
| ρ | Fluid density | 1 g/cc |
| T | Temperature | 310 K |
Determination of unstressed off-rate
To extract the Dembo model parameters, we utilize a method described by Evans and Ritchie (34) and used by others (7) in the context of extracting model parameters. We briefly describe their methodology. From reliability theory (35), the probability p(t,f) of a single bond dissociating in the interval (t, t + dt) as a function of force is
| (3) |
One may recast the above equation in terms of the force, f∗, or the time, t∗, corresponding to the peak value in the probability distribution by setting ∂p/∂f = 0 and ∂p/∂t = 0, respectively. This gives
| (4a) |
| (4b) |
where Eq. 4a assumes the bond force is the applied force, Rft and Eq. 4b is for a general force. If the Dembo model is substituted into Eqs. 4a and 4b, then after some rearrangement we obtain
| (5a) |
| (5b) |
respectively. Thus, using the Levenberg-Marquardt nonlinear least-squares fitting program (36), the Dembo model parameters that best fit all the simulation data for f∗ versus Rf and x(t∗) versus
to Eqs. 5a and 5b, respectively, can be found. Note that Eqs. 5a and 5b are founded on Assumptions 1 and 2, respectively.
Knowing x(t∗) for a given cell-microvilli mechanical model, we simulate bond rupture using the Monte Carlo technique (33) and generate bond rupture-force data sets (N = 105) for prescribed values of unstressed off-rate () and bond spring constant (σ) of 3 s−1 and 4 dyn/cm, respectively. We analyze these data sets to extract the Dembo model parameters (, σ) using one of two assumptions: 1), the instantaneous bond force is equal to the applied force; and 2), the instantaneous bond force is given by the bond stretch times the bond spring constant (Fb = σ x(t)).
Results and Discussion
Intermolecular bond force for various cell and microvillus models
Fig. 2 shows time variation of applied force and intermolecular bond force obtained from cell and microvilli models a–d at Rf = 106 pN/s. The applied load shown as the solid line increases linearly with time simply because f = Rft. When both cell and microvilli are modeled as solid materials (Model a), there is a short lag time, after which the intermolecular bond force increases nearly linearly with time as shown by dashed lines in Fig. 2. The intermolecular bond force increases nonlinearly for all the deformable cell models considered in this work. The nonlinearity in intermolecular bond force with time is highly pronounced, especially in the microvilli extension regime. However, once the microvilli deformation crosses from the extension regime to the tether regime there is an abrupt change in rate of change of the intermolecular bond force, after which it increases nearly linearly with time as shown by the dashed dot lines in Fig. 2 (Model b).
Figure 2.
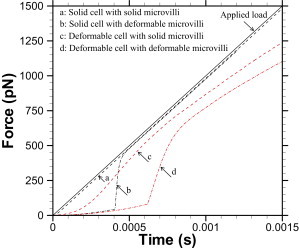
Time variation of applied force (solid line), intermolecular bond force with solid microvillus (dashed line), and intermolecular bond force with deformable microvillus (dashed-dot line) obtained from micromechanical model simulation at Rf = 106 pN/s. (Red) Data obtained from a three-dimensional immersed boundary method simulation of deformable cell for the model parameters listed in Table 1.
Microvilli deformation leads to increased bond stability and longer bond lifetimes. This is in agreement with the findings reported in Caputo and Hammer (24) and Park et al. (25), where it has been shown that microvilli deformation leads to relatively smoother and slower rolling of PMN on P-selectin-coated substrate. The intermolecular bond force obtained from three-dimensional immersed boundary method simulations (37) at the same loading rate of a deformable cell with solid microvilli is shown as dashed red lines, while that of a deformable cell with deformable microvilli is shown as dashed-dot red lines in Fig. 2. For cell-microvillus Models b–d, the intermolecular bond force is modulated due to media viscoelasticity, whereas for cell-microvillus Model a, it is caused solely due to viscous drag. It is apparent that the media viscoelasticity has a greater effect on the intermolecular bond force modulation than the viscous drag alone (22).
Irrespective of the cell and microvilli model used, the intermolecular bond force is lower than the applied load when cellular deformation in the presence of viscous media is considered. The difference in applied load and the intermolecular bond force is the lowest when both cell and microvilli are modeled as solid materials, whereas it is the largest when both cell and microvilli are modeled as deformable. Similar sets of results (see Fig. S1 in the Supporting Material) are obtained for Rf = 103–107 pN/s. However, it is found that for a given cell and microvilli type, the difference in the applied load and the intermolecular bond force decreases as Rf decreases. This is attributed to the fact that decreasing loading rates causes the time constants for viscoelasticity to decrease, resulting in nearly instantaneous force equilibrium. In any case, the bond could break at any point along the intermolecular bond force versus timepath for a given model for cell and microvillus, as shown in Fig. 2.
Using the model proposed by Shao et al. (18) to model the microvillus mechanics, we see an abrupt change in the time rate of change of the intermolecular bond force (Fig. 2) when the microvillus transitions from extension regime to tether regime (26). We performed numerical refinement studies on cell Model b (solid cell with viscoelastic microvillus) and cell Model d (deformable cell with viscoelastic microvillus) at Rf = 106 pN/s and found that the difference in the calculated intermolecular bond force was <4% for all times and hence considered the results numerically converged (see Fig. S2).
Evans et al. (26) and Heinrich et al. (27) conducted single-molecule experiments using a BFP in which the PMN was displaced at a constant velocity (2–150 μm/s) and the instantaneous force on the probe that was fixed at one end was measured. The elastic probe is connected to a functionalized bead that is brought in contact with the PMN. The force applied to the PMN is adjusted through a feedback control loop to maintain the desired velocity constant. It is interesting to note that the measured BFP force is always less than the force required to stretch the BFP at the constant displacement velocity, t, as seen in Fig. 5 B of Evans et al. (26). In our results, the bond force is always less than the applied force. These measurements show the microvillus force varying linearly in the extension regime at a loading rate of 103 pN/s. In our simulations at the same loading rate (see Fig. S1), the bond force varies linearly in the extension regime for all cell models, save Model d. Further, note that in the extension regime, Model b shows a linear response at loading rate 103 pN/s but a nonlinear response at loading rate 106 pN/s in the extension regime.
Figure 5.
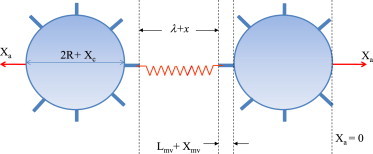
Schematic showing various stretch contributions to total displacement of the point of force application Xa.
In Fig. 3 we show the rupture force histograms corresponding to the loading histories in Fig. 2. The model data from Monte Carlo simulations are presented from two perspectives: when the bond ruptures the rupture force is given by the instantaneous applied force (Fig. 3 a), and when the rupture force is determined by the intermolecular bond force (Fig. 3 b). Although the same loading rate is applied to model cells attached by the same slip-bond model, the peak value of the probability distribution increases (approximately doubles) when cell/microvillus deformability is introduced, as seen in Fig. 3 a. When the rupture force is determined by the intermolecular bond stretch, there is less variation in the peak value of the probability distribution at the same loading rate when cell/microvillus deformability is introduced.
Figure 3.
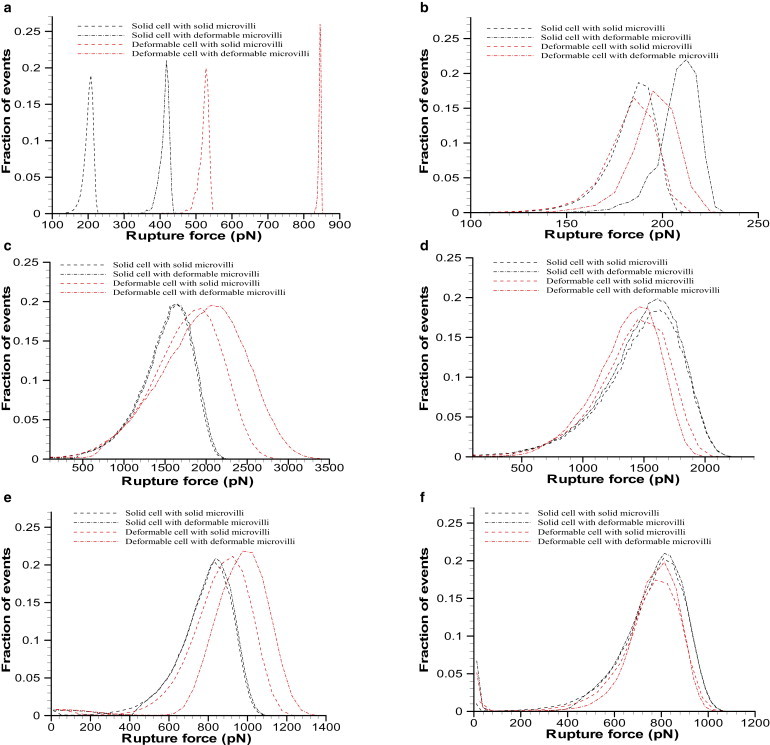
Rupture force histograms using the Dembo (a and b), Bell (c and d), and two-pathway (e and f) models obtained at Rf = 106 pN/s for the legend corresponding to Fig. 2. The histograms obtained based on the applied and intermolecular bond forces are shown in panels a, c, and e, and b, d, and f, respectively.
Note that the bonds do not follow the same force history as shown in Fig. 2, so the probability distributions are not expected to be exactly the same. A similar set of conclusions is drawn from rupture force histograms obtained using the Bell model and the two-pathway bond model with the same loading histories shown in Fig. 3. That is, under Assumption 1, the peak in the histograms shifts right toward larger rupture forces when cell/microvillus deformability is introduced; and under Assumption 2, the shift in the histograms is smaller when cell/microvillus deformability is introduced.
Rupture force histograms
We show the rupture force histograms obtained from the simulation of micromechanical Models a–d for loading rates in the range of 103–107 pN/s in Fig. S3. Similar to Fig. 3, we show the histograms when the rupture force is given by the instantaneous applied force, and when the rupture force is determined by the intermolecular bond force. Under both Assumptions 1 and 2 the rupture force and bond histograms for a given micromechanical model exhibit typical single peaks and shift rightward toward larger forces, as the loading rate is increased, similar to histograms reported experimentally (2). At a given loading rate, as viscoelasticity is introduced through cell Models a–d we see that under Assumption 1 the peak in the histogram shifts right toward large rupture forces. Under Assumption 2, as we introduce viscoelasticity through Models a–d, the difference/shift in the histogram peaks is smaller. Again, although we are modeling bonds of the exact same kinetics, we do not expect the rupture histograms to be exactly the same because of the different bond-loading histories.
Bond strength (f∗), the force that produces the most frequent failure in repeated tests of rupture, is given by the peak in the rupture force histograms. The bond strength (f∗) (also called the “most probable rupture force”) corresponding to Fig. S3 under Assumption 1 is plotted as a function of log10(loading rate) in Fig. 4 a. It is seen that bond strength increases with the loading rate similar to that reported experimentally (6). Fig. 4 b shows most probable rupture force (f∗) corresponding to the histograms shown in Fig. S3 under Assumption 2. It is observed that f∗ increases with the loading rate and tends to asymptote at higher loading rates. Furthermore, as we introduce deformability, be that of cell or microvillus alone or both cell and microvillus, f∗ slightly increases at a given loading rate. Note that at a given Rf the governing equation relating Dembo model parameters (kr0,σ) is exponentially dependent on the f∗ term, making it very sensitive with f∗ in estimation of Dembo model parameters.
Figure 4.
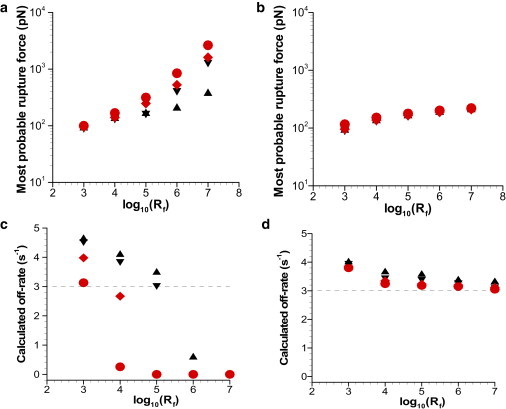
Most probable force based on the (a) applied force and (b) intermolecular bond force for solid cell with solid microvillus (up-triangle), solid cell with deformable microvillus (down-triangle), deformable cell with solid microvillus (diamonds), and deformable cell with deformable microvillus (circle) for the model parameters listed in Table 1. (c and d) Corresponding calculated off-rates.
Determination of unstressed off-rates
The calculated average bond lifetimes at Rf = 106 pN/s for cell-microvilli Models a, b, c, and d are 2.01 × 10⁻⁴ s, 4.17 × 10⁻⁴ s, 5.22 × 10⁻⁴ s, and 8.44 × 10⁻⁴ s, respectively. Note that cell-microvilli deformation increases the average bond lifetimes. As a first step we assume that ψ(σ) is known to extract the off-rate, , directly from Eq. 9 at a given loading rate. Fig. 4, c and d, shows the corresponding extracted as a function of Rf, obtained under Assumptions 1 and 2, respectively, along with the prescribed value of unstressed off-rate ( = 3 s−1) shown as dotted lines. It is seen that the extracted decreases as the loading rate increases for all the cell-microvilli models. Further, the off-rate extracted using Assumption 1 is much lower than the prescribed off-rate. On the other hand, the off-rate extracted using the proposed Assumption 2 approaches the prescribed off-rate as the loading rate increases.
One interpretation of the loading rate sensitivity analysis is that if one were to ignore viscoelasticity in analyzing experimental data by using Assumption 1, the off-rate obtained would be most accurate for the lower loading rates. Note that loading rates <103 pN/s are generally not used, because at low loading rates the peaks in the rupture force histograms cannot be easily resolved (34). Our simulation data show a widening of the rupture force histograms at 103 pN/s, whereas sharp distinct peaks or maximums are seen at the higher loading rates (see Fig. S3), similar to the observed trend in the experimental data. Next, using the Levenberg-Marquardt algorithm (36), our extracted values of σ obtained from the data using both the aforementioned assumptions are within 0.03% of the prescribed value in the simulation. However, as cellular deformability is increased from cell-microvilli Model a through cell-microvilli Model d, the extracted decreases from 2.55 to 1.85 s−1 using Assumption 1, and from 3.66 to 3.24 s−1 using Assumption 2 (see Table 2). This shows that as we introduce viscoelasticity, the deviation in the extracted under Assumption 1 increases. When the force modulation seen in Fig. 2 due to cell-microvilli viscoelasticity is accounted for under Assumption 2, the extracted unstressed off-rate approaches the unstressed off-rate prescribed in the simulation. The accuracy is different for each cell-microvilli type modeled because the bond undergoes different force histories due to differing viscoelastic response in each case, as illustrated in Fig. 2.
Table 2.
Dembo model parameters from Levenberg-Marquardt algorithm
| Model |
Fb = Rft (Assumption 1) |
Fb = σx (Assumption 2) |
||||||
|---|---|---|---|---|---|---|---|---|
| k0r s−1 | % Error | σ Dyn/cm | % Error | k0r s−1 | % Error | σ Dyn/cm | % Error | |
| a | 2.556 | 14.8 | 4.00028 | 0.0070 | 3.658 | 21.9 | 3.99987 | 0.0033 |
| b | 2.288 | 23.7 | 4.00089 | 0.0223 | 3.539 | 17.9 | 3.99932 | 0.0170 |
| c | 2.132 | 28.9 | 4.00039 | 0.0098 | 3.349 | 11.6 | 3.99969 | 0.0078 |
| d | 1.845 | 38.5 | 4.00107 | 0.0268 | 3.237 | 7.9 | 3.99923 | 0.0193 |
Simulated parameters: k0r = 3 s−1 and σ = 4 dyn/cm. The deviation in the extracted k0r under Assumption 1 increases, whereas under Assumption 2, the extracted unstressed off-rate approaches the unstressed off-rate prescribed in the simulation. See text for description of Models a–d.
Using our model data, we demonstrate that the effects of viscoelasticity in calculating the unstressed kinetic off-rate can be both evaluated and addressed by tracking displacements. Experimental techniques such as AFM (5), BFP (6), or a microcantilever (7) can measure positions/displacements with 1–5 nM precision. Fig. 5 shows a schematic of the system being modeled, with initial cell diameter 2R, initial microvillus length Lmv, and initial bond-length, λ. Note that this relation depends on the experimental setup and constraints. As force is applied to the cell system along the line connecting the cell centers, the displacement of the point of force application, Xa, is equal to the sum of the stretch in the cell Xc, microvillus Xmv, and bond x. When the cell and microvillus are undeformable, then Xa = x is the bond stretch. Fig. 6, a–c, shows the effect of introducing deformation, cell Models b–d on the displacement at the point of force application. For the model parameters used, we see that when the microvillus is deformable (Models b and d), its stretch accounts for most of the displacement Xa. When the cell is deformable, and the microvillus is undeformable, the cell and bond stretch are nearly equal contributors to the displacement Xa.
Figure 6.
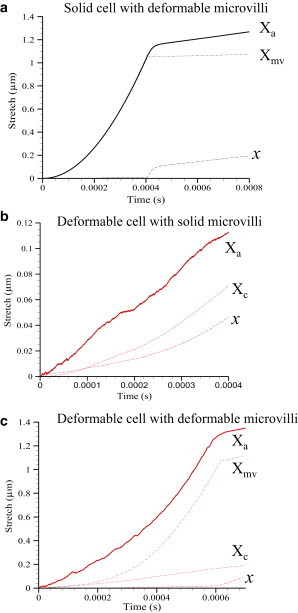
Transient history of Xa, Xc, Xmv, and x with time for (a) cell Model b; (b) cell Model c; and (c) cell Model d. Note that Xa = x + Xmv + Xc.
Our analysis of the model data showed that the bond spring constant can be obtained with accuracy under Assumption 1 or 2 using the Levenberg-Marquardt algorithm (see Table 2). Knowing the bond spring constant, either from independent measurements or Levenberg-Marquardt analysis, one can assess whether the bond force is equal to the applied force by multiplying the displacement Xa at the point of force application by the bond spring constant. If viscoelastic effects are small, the applied force and the resulting displacement would be related by Rft ≈ σXa. The previous statement restates the assumption that the bond force is instantaneously equal to the applied force in terms of the spring constant and displacement. Fig. 7 shows the instantaneous applied force, Rft, and the bond spring constant force multiplied by the displacement, Xa, for the four micromechanical cell Models a–d.
Figure 7.
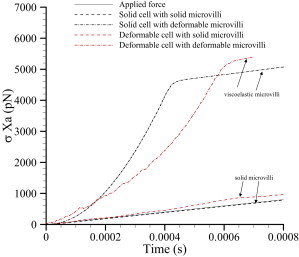
Transient history of applied force Rft and the bond spring constant times the displacement Xa for the four micromechanical cell models (Models a–d; see text).
The analysis indicates that the difference between the instantaneous applied force and the bond force is due to microvillus extension. Note that for the undeformable cell and undeformable microvillus, cell Model a, there is little difference between Rft and σXa. However, the viscoelasticity arising from the microvilli deformation is found to be very large compared to that due to cellular deformation alone. This figure provides data that can be obtained in an experiment to indicate the validity of the assumption that the bond force is equal to the instantaneous applied force. The better the agreement between spring constant multiplied by the instantaneous displacement and the instantaneous force, the more confidence one can have in Assumption 1. This Assumption can be replaced with the Assumption 2 if the stretch (displacement) of the ends of the bonds can be tracked. We showed that in the case of significant microvillus stretch, accurate estimates of the unstressed off-rate are obtained when the bond force is given by the bond spring constant multiplied by the bond stretch (and presumably the other stretch-dependent model).
Conclusion
Molecular forces may not be instantaneously equal to the applied force as is often assumed, when a time-varying force is applied to molecules through an intermediate media that is viscoelastic. This assumption can lead to inaccurate estimation of bond kinetics. We introduced an analysis for the situation when the surface molecules reside on a viscoelastic material, such as a live cell, or when other system forces are present. Under these conditions the instantaneous bond force can be estimated using the instantaneous bond length with an appropriate molecular spring model to obtain molecular properties. This analysis can account for the effects of other system forces such as viscous stress and contact force on the transmission of the applied force to the molecular bond, and results in a smaller error in the extracted unstressed off-rates.
The analysis relies on measuring intermolecular bond length as a function of time. Therefore, implementation of this analysis to experimental measurements would require spatial and temporal resolution of bond-length versus time, similar to the methodology used in Evans et al. (26) to measure the BFP force response. Our results show that when the surface molecules reside on beads, the method of analysis that assumes the bond force is given by the instantaneous applied force can be accurately used to extract the unstressed off-rate. The applicability of the assumption that bond force is equal to applied force decreases as viscoelastic effects increase due to cellular deformability and fluid viscosity. One should expect viscoelastic effects to increase as the loading rate increases. We showed that viscoelasticity due to cellular deformation and suspension viscosity results in intramolecular bond forces that are instantaneously lower than the applied force, and noted that it has been observed that instantaneous microvillus force was less than the instantaneous applied force in Evans et al. (26).
The theoretical methods used to analyze bond behavior in force-spectroscopy experiments are based on the assumption that the bond force is instantaneously equal to the applied force. A viewpoint that bond force is always equal to applied force can lead one to attribute all observed bond behavior solely to bond properties, when it is possible that other system forces may contribute to the observed bond dynamics. Increasing the deformability of the cell structure at a fixed suspension viscosity leads to increased bond stability and longer bond lifetimes, in agreement with the findings reported in Keten and Bueler (38) even though bond kinetics remained fixed.
Finally, it may be possible to extend this analysis from the cell scale to the tissue scale. In such a tissue-scale model, each cell and a microvillus could be treated as a Kelvin-Voigt element to characterize viscoelastic effects due to cellular deformation on the bond rupture force. A collection of Kelvin-Voigt elements arranged in series and in parallel (39) could lead to characterization of viscoelastic properties at the tissue scale.
Acknowledgments
The authors acknowledge support from the National Institute of Allergy and Infectious Disease (RO1 AI063366) and computational resources from Pittsburgh Supercomputing Center (under DAC allocation MCB100052). Computational resources from the High Performance Computing Facility at the University of Maryland Baltimore Country were supported by the U.S. National Science Foundation through the MRI program (grant No. CNS-0821258) and the Scientific Computing Research Environments in the Mathematical Sciences program (grant No. DMS-0821311).
Footnotes
This is an Open Access article distributed under the terms of the Creative Commons-Attribution Noncommercial License (http://creativecommons.org/licenses/by-nc/2.0/), which permits unrestricted noncommercial use, distribution, and reproduction in any medium, provided the original work is properly cited.
Supporting Material
References
- 1.Kühner F., Costa L.T., Gaub H.E. LexA-DNA bond strength by single molecule force spectroscopy. Biophys. J. 2004;87:2683–2690. doi: 10.1529/biophysj.104.048868. [DOI] [PMC free article] [PubMed] [Google Scholar]
- 2.Marshall B.T., Sarangapani K.K., Zhu C. Force history dependence of receptor-ligand dissociation. Biophys. J. 2005;88:1458–1466. doi: 10.1529/biophysj.104.050567. [DOI] [PMC free article] [PubMed] [Google Scholar]
- 3.Simson D.A., Strigl M., Merkel R. Statistical breakage of single protein A-IgG bonds reveals crossover from spontaneous to force-induced bond dissociation. Phys. Rev. Lett. 1999;83:652–655. [Google Scholar]
- 4.Evans E.A., Williams P. Dynamic force spectroscopy. I. Single bonds. In: Flyvberg H., Julicher F., Ormos P., David F., editors. Physics of Bio-Molecules and Cells. EDP Science, Springer-Verlag; Paris: 2002. pp. 145–185. [Google Scholar]
- 5.Zhang X., Bogorin D.F., Moy V.T. Molecular basis of the dynamic strength of the sialyl Lewis x-selectin interaction. ChemPhysChem. 2004;5:175–182. doi: 10.1002/cphc.200300813. [DOI] [PubMed] [Google Scholar]
- 6.Evans E.A., Leung A., Simon S. Chemically distinct transition states govern rapid dissociation of single L-selectin bonds under force. Proc. Natl. Acad. Sci. USA. 2001;98:3784–3789. doi: 10.1073/pnas.061324998. [DOI] [PMC free article] [PubMed] [Google Scholar]
- 7.Tees D.F., Waugh R.E., Hammer D.A. A microcantilever device to assess the effect of force on the lifetime of selectin-carbohydrate bonds. Biophys. J. 2001;80:668–682. doi: 10.1016/S0006-3495(01)76047-X. [DOI] [PMC free article] [PubMed] [Google Scholar]
- 8.Yago T., Wu J., McEver R.P. Catch bonds govern adhesion through L-selectin at threshold shear. J. Cell Biol. 2004;166:913–923. doi: 10.1083/jcb.200403144. [DOI] [PMC free article] [PubMed] [Google Scholar]
- 9.Zhang Y., Sun G., Long M. Low spring constant regulates P-selectin-PSGL-1 bond rupture. Biophys. J. 2008;95:5439–5448. doi: 10.1529/biophysj.108.137141. [DOI] [PMC free article] [PubMed] [Google Scholar]
- 10.Evans E., Leung A., Zhu C. Mechanical switching and coupling between two dissociation pathways in a P-selectin adhesion bond. Proc. Natl. Acad. Sci. USA. 2004;101:11281–11286. doi: 10.1073/pnas.0401870101. [DOI] [PMC free article] [PubMed] [Google Scholar]
- 11.Fritz J., Katopodis A.G., Anselmetti D. Force-mediated kinetics of single P-selectin/ligand complexes observed by atomic force microscopy. Proc. Natl. Acad. Sci. USA. 1998;95:12283–12288. doi: 10.1073/pnas.95.21.12283. [DOI] [PMC free article] [PubMed] [Google Scholar]
- 12.Hanley W., McCarty O., Konstantopoulos K. Single molecule characterization of P-selectin/ligand binding. J. Biol. Chem. 2003;278:10556–10561. doi: 10.1074/jbc.M213233200. [DOI] [PubMed] [Google Scholar]
- 13.Lu S.Q., Ye Z.Y., Long M. Quantifying the effects of contact duration, loading rate, and approach velocity on P-selectin-PSGL-1 interactions using AFM. Polymer (Guildf.) 2006;47:2539–2547. [Google Scholar]
- 14.Rinko L.J., Lawrence M.B., Guilford W.H. The molecular mechanics of P- and L-selectin lectin domains binding to PSGL-1. Biophys. J. 2004;86:544–554. doi: 10.1016/S0006-3495(04)74133-8. [DOI] [PMC free article] [PubMed] [Google Scholar]
- 15.Dudko O.K., Hummer G., Szabo A. Intrinsic rates and activation free energies from single-molecule pulling experiments. Phys. Rev. Lett. 2006;96:108101. doi: 10.1103/PhysRevLett.96.108101. [DOI] [PubMed] [Google Scholar]
- 16.Hanke F., Kreuzer H.J. Breaking bonds in the atomic force microscope: theory and analysis. Phys. Rev. E. 2006;74:031909. doi: 10.1103/PhysRevE.74.031909. [DOI] [PubMed] [Google Scholar]
- 17.Getfert S., Reimann P. Optimal evaluation of single-molecule force spectroscopy experiments. Phys. Rev. E. 2007;76:052901. doi: 10.1103/PhysRevE.76.052901. [DOI] [PubMed] [Google Scholar]
- 18.Shao J.Y., Ting-Beall H.P., Hochmuth R.M. Static and dynamic lengths of neutrophil microvilli. Proc. Natl. Acad. Sci. USA. 1998;95:6797–6802. doi: 10.1073/pnas.95.12.6797. [DOI] [PMC free article] [PubMed] [Google Scholar]
- 19.Correia J.J., Detrich H.W. III, editors. Vol. 89. Academic Press; Burlington, MA: 2008. pp. 411–432. (Biophysical Tools for Biologists, Volume Two: In Vivo Techniques. Methods in Cell Biology Series). [Google Scholar]
- 20.Dulebo A., Preiner J., Hinterdorfer P. Second harmonic atomic force microscopy imaging of live and fixed mammalian cells. Ultramicroscopy. 2009;109:1056–1060. doi: 10.1016/j.ultramic.2009.03.020. [DOI] [PubMed] [Google Scholar]
- 21.Francius G., Alsteens D., Dufrêne Y.F. Stretching polysaccharides on live cells using single molecule force spectroscopy. Nat. Protoc. 2009;4:939–946. doi: 10.1038/nprot.2009.65. [DOI] [PubMed] [Google Scholar]
- 22.Gupta V.K., Eggleton C.D. Effect of cell and microvillus mechanics on the transmission of applied loads to single bonds in dynamic force spectroscopy. Phys. Rev. E. 2011;84:011912. doi: 10.1103/PhysRevE.84.011912. [DOI] [PubMed] [Google Scholar]
- 23.Itoh T., Takenawa T. Mechanisms of membrane deformation by lipid-binding domains. Prog. Lipid Res. 2009;48:298–305. doi: 10.1016/j.plipres.2009.05.002. [DOI] [PubMed] [Google Scholar]
- 24.Caputo K.E., Hammer D.A. Effect of microvillus deformability on leukocyte adhesion explored using adhesive dynamics simulations. Biophys. J. 2005;89:187–200. doi: 10.1529/biophysj.104.054171. [DOI] [PMC free article] [PubMed] [Google Scholar]
- 25.Park E.Y., Smith M.J., Lawrence M.B. Comparison of PSGL-1 microbead and neutrophil rolling: microvillus elongation stabilizes P-selectin bond clusters. Biophys. J. 2002;82:1835–1847. doi: 10.1016/S0006-3495(02)75534-3. [DOI] [PMC free article] [PubMed] [Google Scholar]
- 26.Evans E., Heinrich V., Kinoshita K. Nano- to microscale dynamics of P-selectin detachment from leukocyte interfaces. I. Membrane separation from the cytoskeleton. Biophys. J. 2005;88:2288–2298. doi: 10.1529/biophysj.104.051698. [DOI] [PMC free article] [PubMed] [Google Scholar]
- 27.Heinrich V., Leung A., Evans E. Nano- to microscale dynamics of P-selectin detachment from leukocyte interfaces. II. Tether flow terminated by P-selectin dissociation from PSGL-1. Biophys. J. 2005;88:2299–2308. doi: 10.1529/biophysj.104.051706. [DOI] [PMC free article] [PubMed] [Google Scholar]
- 28.King M.R., Heinrich V., Hammer D.A. Nano-to-micro scale dynamics of P-selectin detachment from leukocyte interfaces. III. Numerical simulation of tethering under flow. Biophys. J. 2005;88:1676–1683. doi: 10.1529/biophysj.104.051805. [DOI] [PMC free article] [PubMed] [Google Scholar]
- 29.Merkel R., Nassoy P., Evans E. Energy landscapes of receptor-ligand bonds explored with dynamic force spectroscopy. Nature. 1999;397:50–53. doi: 10.1038/16219. [DOI] [PubMed] [Google Scholar]
- 30.McEver R.P., Moore K.L., Cummings R.D. Leukocyte trafficking mediated by selectin-carbohydrate interactions. J. Biol. Chem. 1995;270:11025–11028. doi: 10.1074/jbc.270.19.11025. [DOI] [PubMed] [Google Scholar]
- 31.Neelamegham S., Taylor A.D., Simon S.I. Shear and time-dependent changes in Mac-1, LFA-1, and ICAM-3 binding regulate neutrophil homotypic adhesion. J. Immunol. 2000;164:3798–3805. doi: 10.4049/jimmunol.164.7.3798. [DOI] [PubMed] [Google Scholar]
- 32.Jadhav S., Eggleton C.D., Konstantopoulos K. A 3-D computational model predicts that cell deformation affects selectin-mediated leukocyte rolling. Biophys. J. 2005;88:96–104. doi: 10.1529/biophysj.104.051029. [DOI] [PMC free article] [PubMed] [Google Scholar]
- 33.Hammer D.A., Apte S.M. Simulation of cell rolling and adhesion on surfaces in shear flow: general results and analysis of selectin-mediated neutrophil adhesion. Biophys. J. 1992;63:35–57. doi: 10.1016/S0006-3495(92)81577-1. [DOI] [PMC free article] [PubMed] [Google Scholar]
- 34.Evans E., Ritchie K. Dynamic strength of molecular adhesion bonds. Biophys. J. 1997;72:1541–1555. doi: 10.1016/S0006-3495(97)78802-7. [DOI] [PMC free article] [PubMed] [Google Scholar]
- 35.Beckmann P. Harcourt, Brace & World; New York: 1967. Probability in Communication Engineering. [Google Scholar]
- 36.Press W.H., Teukolsky S.A., Flanery B.P. Cambridge University Press; New York: 1997. Numerical Recipes in C. [Google Scholar]
- 37.Gupta V.K., Sraj I.A., Eggleton C.D. Multi-scale simulation of L-selectin-PSGL-1-dependent homotypic leukocyte binding and rupture. Biomech. Model. Mechanobiol. 2010;9:613–627. doi: 10.1007/s10237-010-0201-2. [DOI] [PubMed] [Google Scholar]
- 38.Keten S., Buehler M.J. Geometric confinement governs the rupture strength of H-bond assemblies at a critical length scale. Nano Lett. 2008;8:743–748. doi: 10.1021/nl0731670. [DOI] [PubMed] [Google Scholar]
- 39.Gautieri A., Vesentini S., Buehler M.J. Viscoelastic properties of model segments of collagen molecules. Matrix Biol. 2012;31:141–149. doi: 10.1016/j.matbio.2011.11.005. [DOI] [PubMed] [Google Scholar]
- 40.Dembo M., Torney D.C., Hammer D. The reaction-limited kinetics of membrane-to-surface adhesion and detachment. Proc. R. Soc. Lond. B Biol. Sci. 1988;234:55–83. doi: 10.1098/rspb.1988.0038. [DOI] [PubMed] [Google Scholar]
- 41.Bell G.I. Models for the specific adhesion of cells to cells. Science. 1978;200:618–627. doi: 10.1126/science.347575. [DOI] [PubMed] [Google Scholar]
- 42.Chang K.-C., Tees D.F.J., Hammer D.A. The state diagram for cell adhesion under flow: leukocyte rolling and firm adhesion. Proc. Natl. Acad. Sci. USA. 2000;97:11262–11267. doi: 10.1073/pnas.200240897. [DOI] [PMC free article] [PubMed] [Google Scholar]
- 43.Caputo K.E., Lee D., Hammer D.A. Adhesive dynamics simulations of the shear threshold effect for leukocytes. Biophys. J. 2007;92:787–797. doi: 10.1529/biophysj.106.082321. [DOI] [PMC free article] [PubMed] [Google Scholar]
- 44.Eggleton C.D., Popel A.S. Large deformation of red blood cell ghosts in a simple shear flow. Phys. Fluids. 1998;10:1834–1845. doi: 10.1063/1.869703. [DOI] [PMC free article] [PubMed] [Google Scholar]
- 45.Dembo M. Vol. 24 of series: Lectures on Mathematics in the Life Sciences, Some Mathematical Problems in Biology. American Mathematical Society; Providence, RI: 1994. On peeling an adherent cell from a surface; pp. 51–77. [Google Scholar]
Associated Data
This section collects any data citations, data availability statements, or supplementary materials included in this article.