CONSPECTUS
Proteins, enzymes, and other biological molecules undergo structural dynamics as an intrinsic part of their biological functions. While many biological processes occur on the millisecond, second, and even longer time scales, the fundamental structural dynamics that eventually give rise to such processes occur on much faster time scales. Many decades ago, chemical kineticists focused on the inverse of the reaction rate constant as the important time scale for a chemical reaction. However, through transition state theory and a vast amount of experimental evidence, we now know that the key events in a chemical reaction can involve structural fluctuations that take a system of reactants to its transitions state, the crossing of a barrier, and the eventual relaxation to product states. Such dynamics occur on very fast time scales.
Today researchers would like to investigate the fast structural fluctuations of biological molecules to gain an understanding of how biological processes proceed from simple structural changes in biomolecules to the final, complex biological function. The study of the fast structural dynamics of biological molecules requires experiments that operate on the appropriate time scales, and in this Account, we discuss the application of ultrafast two-dimensional infrared (2D IR) vibrational echo spectroscopy to the study of dynamics. The 2D IR vibrational echo experiment is akin to 2D NMR, but it operates on time scales many orders of magnitude faster. In the experiments, a particular vibrational oscillator serves as a vibrational dynamics probe. As the structure of the protein evolves in time, the structural changes are manifested as time dependent changes in the frequency of the vibrational dynamics probe. The 2D IR vibrational echo experiments can track the vibrational frequency evolution, which we then relate to the time evolution of the protein structure. In particular, we measured protein substate interconversion for mutants of myoglobin using 2D IR chemical exchange spectroscopy and observed well-defined substate interconversion on a sub-100 picosecond time scale. In another study, we investigated the influence of binding five different substrates to the enzyme cytochromeP450cam. The various substrates affect the enzyme dynamics differently, and the observed dynamics are correlated with the enzyme's specificity of hydroxylation of the substrates and with the substrate binding affinity.
I. Introduction
In recent years, the study of the dynamics of biological molecules undergoing structural changes on a wide range of timescales, from femtoseconds to milliseconds, has been the topic of considerable interest.1–4 Biological function requires protein structural changes on a variety of timescales.1,2 Accumulating evidence suggests that very fast structural fluctuations on the sub-nanosecond timescales can be intimately related to protein function manifested on much longer timescales.5–9 For example, sub-nanosecond timescale motions have been implicated in the thermodynamics and specificity of protein-protein binding9,10 and allostery.8 The 2D IR spectroscopic experiments discussed herein suggest motions on the picosecond timescale contribute to the selectivity of hydroxylation by cytochrome P450cam.7 Understanding the structural dynamics of biomolecules can provide valuable information regarding the relationship between structure and function.5,11,12
The energy landscapes of proteins are complex and frequently contain a number of local minima of similar energy. Each local minimum reflects a particular conformational state where the protein adopts a distinct structure.5 Under thermal equilibrium conditions, protein structures fluctuate and continually switch among their conformational states. In addition to interconversion between distinct energy minima, proteins undergo structural fluctuations within a particular conformational state.
Two dimensional infrared (2D IR) vibrational echo spectroscopy can measure protein structural fluctuations on fast times scales.7,13–16 Applications of 2D IR spectroscopy to biomolecules include studies of protein structure, dynamics, and folding.7,15–21 Here we discuss two related 2D IR techniques that have been employed for the study of protein dynamics. The first is chemical exchange spectroscopy, which provides a direct observable for monitoring the interconversion between two distinct protein conformations. The second is the measurement of spectral diffusion, which is the time evolution of the frequency of the vibrational probe within the inhomogeneous distribution of states reflected in the vibrational absorption line width. The time dependent frequency changes are caused by structural fluctuations of the vibrational probe and its environment. The experimental measurement of spectral diffusion is used to determine the frequency-frequency correlation function (FFCF), which is the connection between the experimental observables and the underlying dynamics of the system.22
II. Experimental Procedures
Below are discussed example studies of two heme proteins: mutants of myoglobin (Mb) and cytochrome P450cam (P450cam). CO binds the active sites of both heme proteins and displays a strong vibrational stretching transition at ~1950 cm−1. The CO serves as the vibrational probe of the surrounding protein dynamics.
The laser system used for these experiments consists of a Ti:Sapphire oscillator and regenerative amplifier pumping an optical parametric amplifier and difference frequency stage to produce ~90 fs pulses at ~5 μm (1950 cm−1). The frequency of the IR is tuned to the transition frequency of the CO stretch for the protein under study. Because the pulses are short, the bandwidth spans the ground state to first vibrational excited state (0–1) transition as well as the first to second excited state transition (1–2).
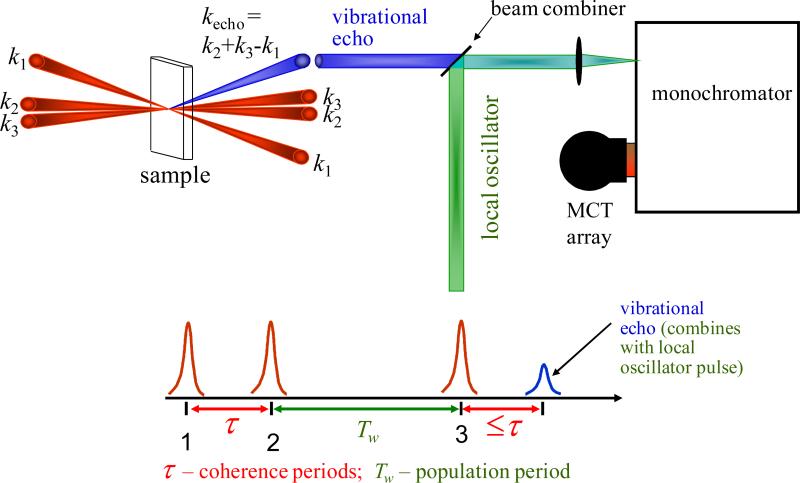
In 2D IR vibrational echo experiments,22 the IR beam is split into three excitation pulses and a fourth beam, the local oscillator (LO) (Figure 1). The three excitation pulses are time ordered, with pulses 1 and 2 traveling along variable delay stages. The first pulse creates a coherence consisting of a superposition of the ν = 0 and ν = 1 vibrational levels. During the evolution period τ the phase relationships between the oscillators decay. The second pulse reaches the sample at time τ and creates a population state in either ν = 0 or ν = 1. A time Tw (the waiting period) elapses before the third pulse arrives at the sample to create another coherence that partially restores the phase relationships. Rephasing of the oscillators causes emission of a vibrational echo signal. For very short Tw times, the echo will be emitted at a time t ≈ τ after the third pulse, and for increasingly longer Tw times, will appear increasingly nearer the time of the third pulse. During Tw , the frequencies of the CO molecules change (chemical exchange14,21,23 or spectral diffusion7,15,16) as they sample different environments due to the structural evolution of the proteins.24–26 The echo signal is spatially and temporally overlapped with the LO for heterodyned detection, which provides both amplitude and phase information. The heterodyned signal is frequency dispersed by a monochromator and detected with an array detector. Taking the spectrum of the signal provides the vertical axis (ωm axis) in the 2D spectrum. At each ωm frequency, scanning τ produces a temporal interferogram. Numerical Fourier transforms of these interferograms give the horizontal axis (ωτ axis). Then Tw is changed and another 2D spectrum is recorded. The time evolution of the 2D spectra provides the information on the system dynamics.
Figure 1.
2D IR experimental pulse sequence, geometry, and detection.
III. Results and Discussion
A. Substate Switching in Myoglobin-CO Observed with Chemical Exchange Spectroscopy
The ability of proteins to undergo conformational switching is central to protein function. For example, conformational changes often accompany enzyme-ligand or protein-protein binding.27–29 A folding protein will sample many conformations as it progresses toward the folded structure.30 Proteins can undergo large conformational changes that occur on longer, milliseconds to seconds time scales. However, these large conformational changes consist of a vast number of more local elementary conformational steps involving small scale structural fluctuations of individual amino acids that can occur on much faster time scales.
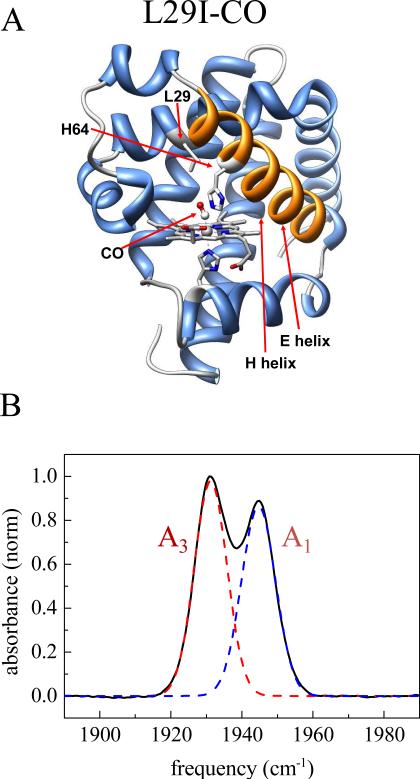
The experimental determination of the time scales of elementary conformational steps is a long standing problem that has now been successfully addressed using ultrafast 2D-IR vibrational echo chemical exchange spectroscopy.14,21,23 Conformational switching has been studied extensively in the protein Mb with the ligand CO bound at the active site (MbCO).14,21,23,31,32 The Fourier transform infrared (FT IR) spectrum of the heme-ligated CO stretching mode of Mb has two major absorption bands, denoted A1 (1945 cm−1 and A3 (1932 cm−1), and a third small band, A0 (1965 cm−1) (Figure 2B).33 Only the A1 and A3 bands will be discussed here. These bands reflect conformational substates of Mb where the distal histidine residue, His64, adopts different configurations (Figure 2A).33–35
Figure 2.
(A) Structure of Mb L29I (pdb id 1MWC) (B) FT IR spectrum of CO in L29I Mb.
MbCO rapidly interconverts between the A1 and A3 states under thermal equilibrium conditions. CO binding rate constants following photolysis determined at low temperature and extrapolated to ambient temperature indicated the switching between A1 and A3 to be < 1 ns.36 Molecular dynamics (MD) simulations have placed the A1–A3 switching time on the order of a few hundred picoseconds.21,23,35
Here, direct measurements of the A1–A3 interconversion time for two Mb mutants under thermal equilibrium conditions using 2D-IR vibrational echo chemical exchange spectroscopy are described. This method has proven useful for studying fast dynamical processes in liquids.24,26,37,38 The 2D-IR vibrational echo chemical exchange experiment is akin to a 2D NMR chemical exchange experiment except that it can operate on a picosecond time scale, and it directly probes the structural degrees of freedom through the time evolution of the 2D vibrational spectrum.
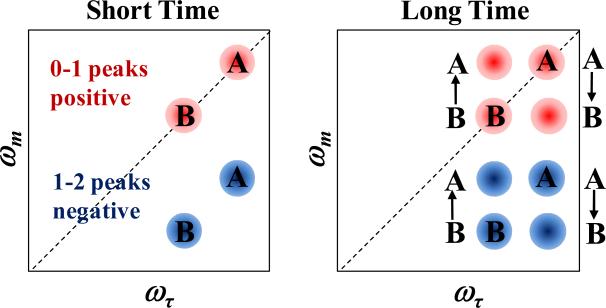
Figure 3 shows a schematic illustration of spectra for an ideal 2D IR chemical exchange experiment. There are two species, A and B, with absorption frequencies, ωA and ωB. At short time (left panel), prior to any chemical exchange, two peaks appear on the diagonal that arise from the 0–1 vibrational transitions (red, positive going), and two corresponding peaks appear below, shifted to lower frequency along the ωm axis by the vibrational anharmonicity, due to vibrational echo emission at the 1–2 transition frequency (blue, negative going).. At long time (right panel), chemical exchange has occurred. Some A's have turned into B's, and because the system is in equilibrium, the same number of B's have turned into A's. The chemical exchange is manifested by the growth of the off-diagonal peaks. Measurement of the time dependent increase in the off-diagonal peaks enables determination of the time scale of chemical exchange.24
Figure 3.
Schematic of 2D IR spectra illustrating chemical exchange.
Because the A3 absorption peak of wild-type MbCO is relatively weak compared to the A1 peak, which results in the A1 peak dominating the spectra, we performed the experiments on two Mb mutants - L29I and the double mutant, T67R/S92D. These mutations cause the A1 and A3 bands in the FT IR spectrum to be approximately the same amplitude (Figure 2B), which helped us to clearly discern all the diagonal and off-diagonal chemical exchange peaks and facilitated their analysis.
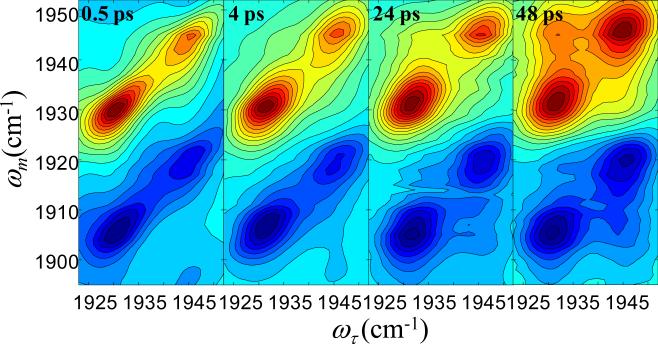
Figure 4 displays 2D-IR spectra of CO bound to L29I at several Tws.14 The data have been normalized to the largest peak at each Tw. Consider the spectrum for Tw = 0.5 ps. The two bands on the diagonal (red) correspond to the A3 and A1 bands in the absorption spectrum (Figure 2B). The off-diagonal bands (blue) centered at (ωτ, ωm) = (1932 cm−1, 1908 cm−1) and (1945 cm−1, 1922 cm−1) result from vibrational echo emission at the 1–2 vibrational transitions of the A3 and A1 substates, respectively. The spectrum at Tw = 0.5 ps shows no cross peaks because 0.5 ps is short relative to the conformational switching time.
Figure 4.
2D IR spectra of CO in L29I Mb at several waiting times.
In contrast, by Tw = 48 ps (Figure 4, right panel) sufficient time has elapsed for conformational switching to occur to a significant extent. The conformational switching is manifested by the growth of cross peaks,24 which are most apparent to the upper left of the 0–1 bands and to the lower right of the 1–2 bands. These cross peaks correspond to the A3 to A1 and A1 to A3 interconversion, respectively. The overlap of the positive and negative going bands reduces the amplitudes of the other two cross peaks, that is at (ωτ, ωm) = (1945 cm−1, 1932 cm−1) and (ωτ, ωm) = (1932 cm−1, 1920 cm−1). The 2D IR spectra for T67R/S92D MbCO have a similar appearance.23
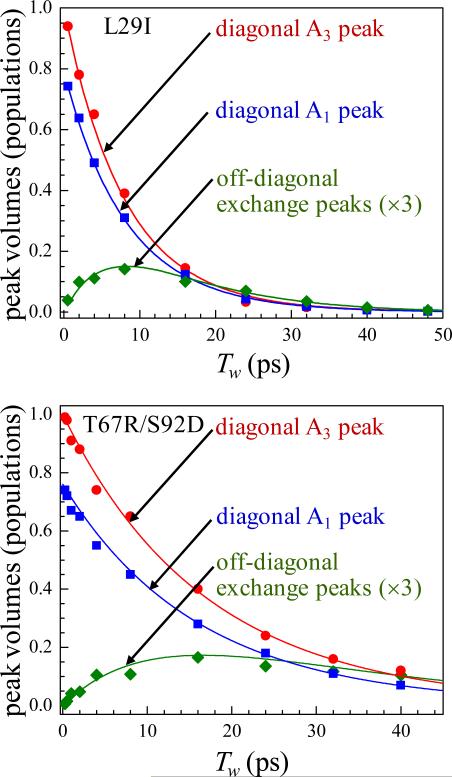
The time dependent 2D IR spectra can be analyzed to quantitatively extract the time constant for the conformational switching. Although the time evolution of the 2D spectra including spectral diffusion and chemical exchange can be calculated using response function theory, it was previously demonstrated that the exchange rate can be extracted using a simpler method.25 The populations of the conformations are reflected by the integrated volumes of their bands. Because spectral diffusion does not change the peak volumes, only their shapes, at each Tw the volumes can determined by fitting all of the peaks to 2D Gaussian functions.24,25 Conformational exchange causes the original peaks to decrease in volume and the cross peaks to increase in volume. Concurrently, vibrational and orientational relaxation leads to the decay of all bands with increasing Tw. The time dependent populations from the peak volumes can be fit with a previously described kinetic model to obtain the time constant of conformational switching.24,25,38
Figure 5 displays the chemical exchange data for the two MbCO variants.14,23 The data (points) show the decay of the diagonal peaks and the growth and decay of the off-diagonal chemical exchange peaks. The solid lines through the data for each mutant are obtained from a fit employing only a single adjustable parameter, the conformational switching time for the interconversion between the A1/A3 substates. The fits yielded conformational switching times of 47 ± 8 ps and 76 ± 10 ps for L29I and T67R/S92D, respectively.
Figure 5.
Time dependent changes in the populations of the diagonal and exchange peaks in the 2D IR spectra of CO in L29I (upper) and T67R/S92D (lower) Mb.
The vibrational echo experiments can be combined with MD simulations to better elucidate the structural change associated with the A1/A3 conformational switching.21,35 As discussed above, rotation of the imidazole side group of His64 is directly involved in creating the difference in the frequencies of the A1 and A3 absorption bands. This structural change is supported by high resolution crystal structures of MbCO that show evidence for two His64 conformations.34,39 Moreover, an additional Xe binding site distant from the heme iron has been observed in crystal structures of the A3 conformation of Mb, indicating the presence of a cavity not found in the A1 state.40 This suggests that the A1/A3 interconversion involves significantly more motion than the rotation of the imidazole side group of His64.
The 2D IR chemical exchange studies of substate switching in the two Mb variants demonstrate that elementary structural changes in proteins can occur on fast time scales. The results presented here show that the time scale can be faster than 100 ps. Motions on similarly fast, sub-nanosecond timescales also have been characterized through extensive NMR relaxation studies of protein backbone and sidechains.4,41 The NMR experiments can provide order parameters that reflect the angular restriction of backbone and methyl group side chain motion for residues throughout a protein on timescales faster than the protein's global macromolecular tumbling time (typically tens of nanoseconds). These studies suggest that fast internal protein motions contribute significantly to protein function, for instance from their involvement in the conformational entropy of protein-protein binding9 and in the allosteric control of molecular recognition.8
B. The Influence of Substrate Binding on the Dynamics of P450cam Observed with Spectral Diffusion Measurements
Protein dynamics are thought to play an important role in the activity of P450s,42144 a family of monooxygenases of substantial biological and medicinal importance.45 P450s display a remarkable ability to act on substrates that can differ vastly in their size, structure, and chemical nature.46 The specificity of their activity for different substrates varies widely for individual enzymes of the family. Structural studies suggest the promiscuity of P450s results from the high plasticity of their active sites.27–29 Although large structural changes are sometimes observed, often substrate binding leads to only localized changes in protein structure.47–49 The motions involved in these smaller structural changes occur on fast timescales that have been historically difficult to investigate.
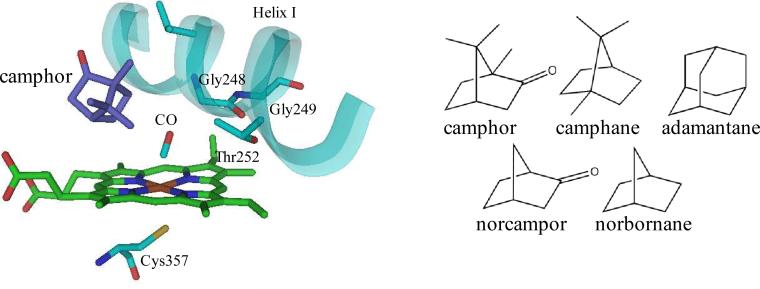
Among P450s, the paradigmatic P450cam from Pseudomonas putida shows relatively high specificity for small, hydrophobic compounds similar to its physiological substrate, camphor.50 The high specificity is thought to result from relatively constrained active site dynamics.43,47 While P450cam does act on a number of compounds, lower substrate binding affinity and stereo/regioselectivity are observed compared to camphor, the natural substrate.51–53 Calculations suggest that the variations in activity cannot be explained by differences in the chemical reactivity of the substrates, rather that the fluctuating protein environment contributes substantially to the differences.54 The involvement of protein motions in controlling the selectivity of hydroxylation was examined by characterizing the dynamics of P450cam-CO bound to substrates with mild variations from the camphor structure (camphane, adamantane, norcamphor, and norbornane, Figure 6).
Figure 6.
Structure of the active site of P450cam (pdb id 1T87) (left) and substrates of complexes studied (right).
Protein structural fluctuations cause the CO stretch frequency to evolve in time, leading to spectral diffusion. The structural changes of the proteins are connected to Tw dependent changes in the 2D band shapes caused by spectral diffusion via the frequency-frequency correlation function (FFCF). The center line slope (CLS) method provides an accurate way to determine the FFCF from 2D and linear spectra.55,56 It has been shown theoretically that the Tw dependent part of the normalized FFCF is directly related to the Tw dependence of the slope of the center line.55,56 Thus the slope of the center line, the CLS, will vary between a maximum of 1 at Tw = 0 and 0 in the limit of sufficiently long waiting time. Detailed procedures for converting the CLS measurement into the FFCF have been described previously.55,56
The multiple time scale dynamics are often modeled by a multiexponential form of the FFCF, C(t).
| (1) |
For the ith dynamical process, Δi is the range of CO frequencies sampled due to protein structural fluctuations, and τi is the time constant of these fluctuations. This form of the FFCF has been widely used and in particular found applicable in studies of the structural dynamics of heme-CO proteins.15,16,21,35,57 If Δτ< 1 for one component of the FFCF, then I and τ cannot be determined separately, but rather give rise to a motionally narrowed homogeneous contribution to the absorption spectrum. The presence of a homogeneous contribution causes the initial value of the CLS to be less than 1 at Tw = 0. By combining the CLS with the linear absorption spectrum, the full FFCF can be obtained including the homogeneous component.
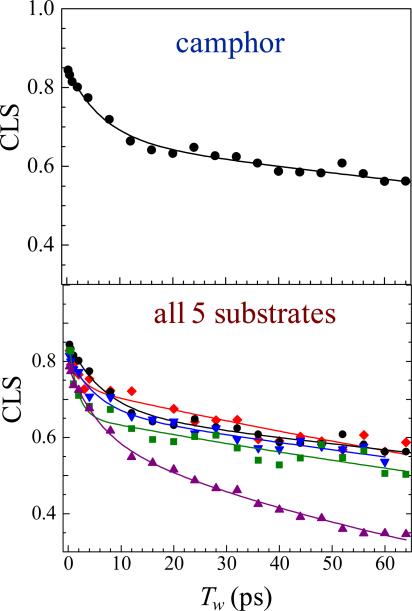
Figure 7 displays the 2D IR vibrational echo data for the camphor and norcamphor P450cam -CO complexes at two Tw's. The change in shape of the 2D spectra with time is evident. Figure 8 shows CLS decays for the substrate-P450cam complexes. All of the decays have the same general form. The off-sets from 1 at Tw = 0 reflect the magnitude of the homogeneous component. The decays are bi-exponential, with the fast and slow time constants τ1 and τ2, respectively. Table 1 gives the FFCF parameters obtained from the CLS analysis. A complete discussion of the FFCF parameters has been given,7 although here we will focus only on the slowest decay time, τ2.
Figure 7.
2D IR spectra of CO in P450cam bound to camphor (left) and norcamphor (right) at two waiting times.
Figure 8.
CLS decays and corresponding exponential fits for CO in P450cam bound to camphor (upper) and to all substrates studied (lower).
Table 1.
Dynamic Parameters from 2D IR Spectra and Dissociation Constants
| Substrate | T2 (ps) | Δ1 (cm−1) | τ1 (ps) | Δ2 (cm−1) | τ2 (ps) | KD (μM) |
|---|---|---|---|---|---|---|
| Camphor | 4.3 ± 0.8 | 2.8 ± 0.3 | 6.8 ± 1.4 | 5.4 ± 0.2 | 370 ± 65 | 0.8a |
| Camphane | 7.2 ± 2.7 | 1.8 ± 0.3 | 5.5 ± 1.8 | 3.8 ± 0.1 | 300 ± 60 | 1.1a |
| Adamantane | 6.3 ± 0.8 | 2.3 ± 0.3 | 1.6 ± 0.6 | 4.1 ± 0.07 | 260 ± 40 | 50b |
| Norbornane | 7.9 ± 0.3 | 2.4 ± 0.5 | 2.2 ± 1.2 | 4.7 ± 0.06 | 230 ± 30 | 47a |
| Norcamphor | 4.9 ± 1.8 | 1.8 ± 0.1 | 5.8 ± 1.0 | 3.2 ± 0.1 | 110 ± 6 | 345a |
The slowest dynamics measured in this study of P450cam complexes occur on the 100–370 ps timescale (Table 1). The approximately two-fold larger value of Δ2 (root mean frequency fluctuation amplitude) compared to Δ1 for all of the complexes shows that these slower motions make the greatest contribution to the vibrational line width. The slow timescale suggests that this component arises from larger-scale motions than give rise to the faster dynamics, likely similar in scale to the 50–100 ps A1–A3 switching measured for MbCO.14,21,23 However, molecular dynamics simulations of MbCO find that dynamics throughout the protein contribute to the FFCF,57 and this is likely also the case for the FFCFs of the P450cam complexes.
The motions on the hundreds of picosecond timescale are found to be the slowest in P450cam bound to its natural substrate, camphor, implying that the barriers to structural fluctuations on this timescale are greatest for this complex. In comparison, the τ2 correlation time is several times shorter for the norcamphor complex. From a simple Eyring model of kinetics,58 comparison of the longer timescales components suggest the barriers to the corresponding structural changes in the camphor complex are roughly 30% greater than in the norcamphor complex, and are consistent with optimal packing of the natural camphor substrate in the P450cam active site. The faster dynamics of the norcamphor complex indicate relatively low kinetic barriers among structural conformations and hence a smoother energy landscape. Conversely, the slower dynamics in the complex with the natural substrate indicate relatively high barriers to motion, leading to the picture of a more “rugged” energy landscape.
The uniquely fast dynamics observed in the norcamphor complex (Table 1) are particularly notable given the low selectivity of the hydroxylation of the norcamphor substrate. While 100% and 90% 5'-exo hydroxylation product is obtained from camphor and camphane, respectively,52 the activity of P450cam toward norcamphor results in only 60% of the 5'1exo hydroxylation product.53 (Adamantane and norbornane do not possess an equivalent number of distinct carbon atoms.) The correlation between the dynamics of the complexes and their regioselectivities with different substrates is consistent with the involvement of protein dynamics in the selectivity of P450cam activity. While the actual chemical reaction likely involves a low probability incursion to a high energy state, it seems plausible that the more rugged landscape would serve to restrict the particular sequences of structural fluctuations that can lead to the transition state, and thus enhance the selectivity of camphor hydroxylation. In contrast, the smoother energy landscape of the norcamphor complex may lead to a more permissive trajectory to the transition state and thus allow the reaction to proceed with “incorrect” carbon centers.
In addition, the 2D IR results suggest that the dynamics of the complexes may influence the binding affinity, as the dissociation constants and τ2 are also generally correlated. Those substrates with smaller KD values for binding to P450cam show longer τ2 times in the FFCFs of the substrate complexes (Table 1). Thus the binding affinity increases with slower dynamics. This effect is not likely due to conformational entropy changes upon binding, as more constrained substrate complexes should lead to a greater entropic penalty for binding. It is more likely that the higher barriers that result in slower dynamics are due to more enthalpically favorable interactions within the tighter complexes.
2D IR vibrational echo spectroscopy measured dynamics in P450cam complexes on a wide range of timescales. The complex with the natural substrate, camphor, shows slower motions compared to the unnatural substrate complexes, indicating higher barriers to protein structural changes. The enzyme likely has evolved to optimally bind camphor to restrict the structural fluctuations that may lead to the transition state, such that hydroxylation occurs only at a specific carbon center. Thus, overall the data support the involvement of fast structural dynamics in enzyme function, and in particular, the specificity of hydroxylation by P450cam.
Similarly fast motions have been observed in other enzymes with spectral diffusion measurements employing small ligand IR probes.18,59,60 Motions on the tens of picoseconds timescale were observed in 2D IR studies of azide bound to carbonic anhydrase60 and a small molecule nitrile inhibitor bound to HIV reverse transcriptase.59 In a study of azide, a transition state analog, bound to formate dehydrogenase in several substrate/cofactor complexes, slower motions observed in the binary ligand complex of formate dehydrogenase disappeared upon forming the reactant and product ternary complexes,18 suggesting that protein motions on fast, sub-nanosecond timescales might impact enzyme molecular recognition, in accord with the P450cam study described here.
IV Concluding Remarks
The application of two techniques of ultrafast 2D IR vibrational echo spectroscopy to the study of proteins has been demonstrated. One method, chemical exchange spectroscopy was used to directly observe the interconversion between distinct structural substates of two Mb mutants. In both cases conformational switching times less than 100 ps were measured, demonstrating that basic structural changes in proteins can occur on fast time scales.
In the second application, 2D IR vibrational echo experiments were used to measure spectral diffusion, which is directly related to protein structural fluctuations. The dynamics of the P450cam in complex with CO and five different substrates were discussed. The slowest components of the fast structural fluctuations show correlations with the selectivity of the activity and the binding constants of the substrates with the enzyme. These results indicate that an enzyme's fast structural fluctuations are intimately involved in biological processes that occur on time scales that are many orders of magnitude slower.
The applications presented here of 2D IR spectroscopy to the measurement of protein dynamics used a heme-bound CO ligand as an IR probe. To generalize the methods of 2D IR spectroscopy to study dynamics beyond those that bind small molecule ligands and to measure the dynamics at sites throughout the protein structure, our group has begun to combine the spectroscopic methods with the site-specific incorporation of amino acids that bear vibrational probe groups.13,15 Azido, cyano, and carbon-deuterium labeled amino acids can be introduced at specific sites in proteins to exploit their infrared frequencies around 2000 cm−1 in a relatively transparent region of a protein IR spectrum,13,15,61 permitting the discernment and analysis of absorption bands due single residues in proteins. Cyanophenylalanine has been employed in 2D IR studies of peptide dynamics and folding.15 Recently, our group reported the first study of the dynamics of a labeled amino acid, azidophenylalanine in a full length protein, myoglobin.13 The combination of site-specific protein labeling and 2D IR spectroscopy promises to be a power means of understanding the role of dynamics in protein function.
Acknowledgements
We thank the National Institutes of Health (21R01-GM061137-09) for support of this research. MCT also thanks the National Institutes of Health for a post doctoral fellowship (F32-GM090549).
Biographies
Michael D. Fayer received his B.S. (1969) and Ph.D. (1974) from the University of California at Berkeley. He joined the faculty at Stanford University in 1974, where he is the David Mulvane Ehrsam and Edward Curtis Franklin Professor of Chemistry. He is a member of the National Academy of Science, and he has received the E. Bright Wilson Award for Spectroscopy, the Ellis R. Lippincott Award, the Earl K. Plyler Prize for Molecular Spectroscopy, and the Arthur L. Schawlow Prize in Laser Science.
Megan C. Thielges received her B.S. (2003) from Arizona State University and Ph.D. (2009) from the Scripps Research Institute. She is currently a NIH postdoctoral fellow in the Fayer group at Stanford University.
References
- 1.Henzler-Wildman KA, Lei M, Thai V, Kerns SJ, Karplus M, Kern D. A Hierarchy of Timescales in Protein Dynamics Is Linked to Enzyme Catalysis. Nature. 2007;450:913–916. doi: 10.1038/nature06407. [DOI] [PubMed] [Google Scholar]
- 2.Hammes-Schiffer S, Benkovic SJ. Relating Protein Motion to Catalysis. Annu. Rev. Biochem. 2006;75:519–541. doi: 10.1146/annurev.biochem.75.103004.142800. [DOI] [PubMed] [Google Scholar]
- 3.Erzberger JP, Berger JM. Evolutionary Relationships and Structural Mechanisms of AAA+ Proteins. Annu. Rev. Biophys. Biomol. Struct. 2006;35:93–114. doi: 10.1146/annurev.biophys.35.040405.101933. [DOI] [PubMed] [Google Scholar]
- 4.Boehr DD, Dyson HJ, Wright PE. An NMR Perspective on Enzyme Dynamics. Chem. Rev. 2006;106:3055–3079. doi: 10.1021/cr050312q. [DOI] [PubMed] [Google Scholar]
- 5.Frauenfelder H, Sligar SG, Wolynes PG. The Energy Landscapes and Motions of Proteins. Science. 1991;254:1598–1603. doi: 10.1126/science.1749933. [DOI] [PubMed] [Google Scholar]
- 6.Parak F, Frauenfelder H. Protein Dynamics. Physica A. 1993;201:332–345. [Google Scholar]
- 7.Thielges MC, Chung JK, Fayer MD. Protein Dynamics in Cytochrome P450 Molecular Recognition and Substrate Specificity Using 2D IR Vibrational Echo Spectroscopy. J. Am. Chem. Soc. 2011;133:3995–4004. doi: 10.1021/ja109168h. [DOI] [PMC free article] [PubMed] [Google Scholar]
- 8.Petit CM, Zhang J, Sapienza PJ, Fuentes EJ, Lee AL. Hidden Dynamic Allostery in a Pdz Domain. Proc. Natl. Acad. Sci. U.S.A. 2009;106:18249–18254.9. doi: 10.1073/pnas.0904492106. [DOI] [PMC free article] [PubMed] [Google Scholar]
- 9.Frederick KK, Marlow MS, Valentine KG, Wand AJ. Conformational in Molecular Recognition by Proteins. Nature. 2007;448:325–329. doi: 10.1038/nature05959. [DOI] [PMC free article] [PubMed] [Google Scholar]
- 10.Jimenez R, Salazar G, Yin J, Joo T, Romesberg FE. Protein Dynamics and the Immunological Evolution of Molecular Recognition. Proc. Natl. Acad. Sci. USA. 2004;101:3803–8. doi: 10.1073/pnas.0305745101. [DOI] [PMC free article] [PubMed] [Google Scholar]
- 11.Hong MK, Braunstein D, Cowen BR, Frauenfelder H, Iben IET, Mourant JR, Ormos P, Scholl R, Schulte A, Steinbach PJ, Xie AH, Young RD. Conformational Substates and Motions in Myoglobin - External Influences on Structure and Dynamics. Biophys. J. 1990;58:429–436. doi: 10.1016/S0006-3495(90)82388-2. [DOI] [PMC free article] [PubMed] [Google Scholar]
- 12.Frauenfelder H, McMahon BH, Austin RH, Chu K, Groves JT. The Role of Structure, Energy Landscape, Dynamics, and Allostery in the Enzymatic Function of Myoglobin. Proc. Natl. Acad. Sci. U.S.A. 2001;98:2370–2374. doi: 10.1073/pnas.041614298. [DOI] [PMC free article] [PubMed] [Google Scholar]
- 13.Thielges MC, Axup JY, Wong D, Lee HS, Chung JK, Schultz PG, Fayer MD. Two-Dimensional IR Spectroscopy of Protein Dynamics Using Two Vibrational Labels: A Site-Specific Genetically Encoded Unnatural Amino Acid and an Active Site Ligand. J. Phys. Chem. B. 2011;115:11294–11304. doi: 10.1021/jp206986v. [DOI] [PMC free article] [PubMed] [Google Scholar]
- 14.Ishikawa H, Kwak K, Chung JK, Kim S, Fayer MD. Direct Observation of Fast Protein Conformational Switching. Proc. Natl. Acad. Sci. U.S.A. 2008;105:8619–8624. doi: 10.1073/pnas.0803764105. [DOI] [PMC free article] [PubMed] [Google Scholar]
- 15.Chung JK, Thielges MC, Fayer MD. Dynamics of the Folded and Unfolded Villin Headpiece (HP35) Measured with Ultrafast 2D IR Vibrational Echo Spectroscopy. Proc. Natl. Acad. Sci. U.S.A. 2011;108:3578–3583. doi: 10.1073/pnas.1100587108. [DOI] [PMC free article] [PubMed] [Google Scholar]
- 16.Chung JK, Thielges MC, Bowman SEJ, Bren KL, Fayer MD. Temperature Dependent Equilibrium Native to Unfolded Protein Dynamics and Properties Observed with IR Absorption and 2D IR Vibrational Echo Experiments. J. Am. Chem. Soc. 2011;133:6681–6691. doi: 10.1021/ja111009s. [DOI] [PMC free article] [PubMed] [Google Scholar]
- 17.Ganim Z, Chung HS, Smith AW, Deflores LP, Jones KC, Tokmakoff A. Amide I Two-Dimensional Infrared Spectroscopy of Proteins. Acc. Chem. Res. 2008;41:432–441. doi: 10.1021/ar700188n. [DOI] [PubMed] [Google Scholar]
- 18.Bandaria JN, Dutta S, Nydegger MW, Rock W, Kohen A, Cheatum CM. Characterizing the Dynamics of Functionally Relevant Complexes of Formate Dehydrogenase. Proc. Natl. Acad. Sci. U.S.A. 2010;107:17974–17979. doi: 10.1073/pnas.0912190107. [DOI] [PMC free article] [PubMed] [Google Scholar]
- 19.Middleton CT, Woys AM, Mukherjee SS, Zanni MT. Residue-Specific Structural Kinetics of Proteins through the Union of Isotope Labeling, Mid-IR Pulse Shaping, and Coherent 2D IR Spectroscopy. Methods. 2010;52:12–22. doi: 10.1016/j.ymeth.2010.05.002. [DOI] [PMC free article] [PubMed] [Google Scholar]
- 20.Kim YS, Hochstrasser RM. Applications of 2D IR Spectroscopy to Peptides, Proteins, and Hydrogen-Bond Dynamics. J. Phys. Chem. B. 2009;113:8231–8251. doi: 10.1021/jp8113978. [DOI] [PMC free article] [PubMed] [Google Scholar]
- 21.Bagchi S, Nebgen BT, Loring RF, Fayer MD. Dynamics of a Myoglobin Mutant Enzyme: 2D IR Vibrational Echo Experiments and Simulations. J. Am. Chem. Soc. 2010;132:18367–18376. doi: 10.1021/ja108491t. [DOI] [PMC free article] [PubMed] [Google Scholar]
- 22.Park S, Kwak K, Fayer MD. Ultrafast 2D-IR Vibrational Echo Spectroscopy: A Probe of Molecular Dynamics. Laser Phys. Lett. 2007;4:704–718. [Google Scholar]
- 23.Bagchi S, Thorpe DG, Thorpe IF, Voth GA, Fayer MD. Conformational Switching between Protein Substates Studied with 2D IR Vibrational Echo Spectroscopy and Molecular Dynamics Simulations. J. Phys. Chem. B. 2010;114:17187–17193. doi: 10.1021/jp109203b. [DOI] [PMC free article] [PubMed] [Google Scholar]
- 24.Zheng J, Kwak K, Asbury JB, Chen X, Piletic I, Fayer MD. Ultrafast Dynamics of Solute-Solvent Complexation Observed at Thermal Equilibrium in Real Time. Science. 2005;309:1338–1343. doi: 10.1126/science.1116213. [DOI] [PubMed] [Google Scholar]
- 25.Kwak K, Zheng J, Cang H, Fayer MD. Ultrafast 2D IR Vibrational Echo Chemical Exchange Experiments and Theory. J. Phys. Chem. B. 2006;110:19998–20013. doi: 10.1021/jp0624808. [DOI] [PubMed] [Google Scholar]
- 26.Moilanen DE, Wong D, Rosenfeld DE, Fenn EE, Fayer MD. Ion-Water Hydrogen Bond Switching Observed with 2D IR Vibrational Echo Chemical Exchange Spectroscopy. Proc. Nat. Acad. Sci. U.S.A. 2009;106:375–380. doi: 10.1073/pnas.0811489106. [DOI] [PMC free article] [PubMed] [Google Scholar]
- 27.Scott EE, He YA, Wester MR, White MA, Chin CC, Halpert JR, Johnson EF, Stout CD. An Open Conformation of Mammalian Cytochrome P4502B4 at 1.6-Angstrom Resolution. Proc. Natl. Acad. Sci. U.S.A. 2003;100:13196–13201. doi: 10.1073/pnas.2133986100. [DOI] [PMC free article] [PubMed] [Google Scholar]
- 28.Poulos TL, Johnson EF. In: Cytochrome P450: Structure, Mechanism, and Biochemistry. de Montellano O, editor. Vol. 3. Plenum Press; New York: 2005. pp. 87–114. [Google Scholar]
- 29.Ekroos M, Sjögren T. Structural Basis for Ligand Promiscuity in Cytochrome P450 3A4. Proc. Natl. Acad. Sci. U.S.A. 2006;103:13682–13687. doi: 10.1073/pnas.0603236103. [DOI] [PMC free article] [PubMed] [Google Scholar]
- 30.Oliveberg M, Wolynes PG. The Experimental Survey of Protein-Folding Energy Landscapes. Q. Rev. Biophys. 2005;38:245–288. doi: 10.1017/S0033583506004185. [DOI] [PubMed] [Google Scholar]
- 31.Ansari A, Beredzen J, Braunstein D, Cowen BR, Frauenfelder H, Hong MK, Iben IET, Johnson JB, Ormos P, Sauke T, Schroll R, Schulte A, Steinback PJ, Vittitow J, Young RD. Rebinding and Relaxation in the Myoglobin Pocket. Biophys. Chem. 1987;26:337–355. doi: 10.1016/0301-4622(87)80034-0. [DOI] [PubMed] [Google Scholar]
- 32.Muller JD, McMahon BH, Chen EYT, Sligar SG, Nienhaus GU. Connection between the Taxonomic Substates of Protonation of Histidines 64 and 97 in Carbonmonoxy Myoglobin. Biophys. J. 1999;77:1036–1051. doi: 10.1016/s0006-3495(99)76954-7. [DOI] [PMC free article] [PubMed] [Google Scholar]
- 33.Li TS, Quillin ML, Phillips GN, Jr., Olson JS. Structural Determinants of the Stretching Frequency of CO Bound to Myoglobin. Biochemistry. 1994;33:1433–1446. doi: 10.1021/bi00172a021. [DOI] [PubMed] [Google Scholar]
- 34.Vojtechovsky J, Chu K, Berendzen J, Sweet RM, Schlichting I. Crystal Structures of Myoglobin-Ligand Complexes at near Atomic Resolution. Biophys. J. 1999;77:2153–2174. doi: 10.1016/S0006-3495(99)77056-6. [DOI] [PMC free article] [PubMed] [Google Scholar]
- 35.Merchant KA, Noid WG, Akiyama R, Finkelstein IJ, Goun A, McClain BL, Loring RF, Fayer MD. Myoglobin-CO Substate Structures and Dynamics: Multidimensional Vibrational Echoes and Molecular Dynamics Simulations. J. Am. Chem. Soc. 2003;125:13804–13818. doi: 10.1021/ja035654x. [DOI] [PMC free article] [PubMed] [Google Scholar]
- 36.Johnson JB, Lamb DC, Frauenfelder H, Müller JD, McMahon B, Nienhaus GU, Young RD. Ligand Binding to Heme Proteins. 6. Interconversion of Taxonomic Substates in Carbonmonoxymyoglobin. Biophys. J. 1996;71:1563–1573. doi: 10.1016/S0006-3495(96)79359-1. [DOI] [PMC free article] [PubMed] [Google Scholar]
- 37.Kim YS, Hochstrasser RM. Chemical Exchange 2D IR of Hydrogen-Bond Making and Breaking. Proc. Natl. Acad. Sci. U.S.A. 2005;102:11185–11190. doi: 10.1073/pnas.0504865102. [DOI] [PMC free article] [PubMed] [Google Scholar]
- 38.Zheng J, Kwak K, Xie J, Fayer MD. Ultrafast Carbon-Carbon Single Bond Rotational Isomerization in Room Temperature Solution. Science. 2006:1951–1955. doi: 10.1126/science.1132178. [DOI] [PubMed] [Google Scholar]
- 39.Teeter MM. Myoglobin Cavities Provide Interior Ligand Pathway. Protein Sci. 2004;13:313–318. doi: 10.1110/ps.03334304. [DOI] [PMC free article] [PubMed] [Google Scholar]
- 40.Tilton RF, Jr., Kuntz ID, Jr., Petsko GA. Cavities in Proteins: Structure of a Metmyoglobin-Xenon Complex Solved to 1.9 A. Biochemistry. 1984;23:2849–2857. doi: 10.1021/bi00308a002. [DOI] [PubMed] [Google Scholar]
- 41.Igumenova TI, Frederick KK, Wand AJ. Characterization of the Fast Dynamics of Protein Amino Acid Side Chains Using Nmr Relaxation in Solution. Chem. Rev. 2006;106:1672–1699. doi: 10.1021/cr040422h. [DOI] [PMC free article] [PubMed] [Google Scholar]
- 42.Skopalík J, Anzenbacher P, Otyepka M. Flexibility of Human Cytochromes P450: Molecular Dynamics Reveals Differences between Cyps 3A4, 2C9, and 2A6, Which Correlate with Their Substrate Preferences. J. Phys. Chem. B. 2008;112:8165–73. doi: 10.1021/jp800311c. [DOI] [PubMed] [Google Scholar]
- 43.Winn PJ, Lüdemann SK, Gauges R, Lounnas V, Wade RC. Comparison of the Dynamics of Substrate Access Channels in Three Cytochrome P450s Reveals Different Opening Mechanisms and a Novel Functional Role for a Buried Arginine. Proc. Natl. Acad. Sci. U.S.A. 2002;99:5361–5366. doi: 10.1073/pnas.082522999. [DOI] [PMC free article] [PubMed] [Google Scholar]
- 44.Wade RC, Motiejunas D, Schleinkofer K, Sudarko; Winn PJ, Banerjee A, Kariakin A, Jung C. Multiple Molecular Recognition Mechanisms. Cytochrome P450--a Case Study. Biochim. Biophys. Acta. 2005;1754:239–44. doi: 10.1016/j.bbapap.2005.07.044. [DOI] [PubMed] [Google Scholar]
- 45.Guengerich FP. Cytochrome P450 and Chemical Toxicology. Chem Res Toxicol. 2008;21:70–83. doi: 10.1021/tx700079z. [DOI] [PubMed] [Google Scholar]
- 46.Schuler MA, Sligar SG. In: The Ubiquitous Roles of the Cytochromes: Metal Ions in Life Sciences. Sigel A, Sigel H, Sigel RKO, editors. Vol. 3. John Wiley & Sons, Ltd.; West Sussex: 2007. pp. 1–26. [Google Scholar]
- 47.Schlichting I, Berendzen J, Chu K, Stock AM, Maves SA, Benson DE, Sweet BM, Ringe D, Petsko GA, Sligar SG. The Catalytic Pathway of Cytochrome P450cam at Atomic Resolution. Science. 2000;287:1615–1622. doi: 10.1126/science.287.5458.1615. [DOI] [PubMed] [Google Scholar]
- 48.Williams PA, Cosme J, Vinkovic DM, Ward A, Angove HC, Day PJ, Vonrhein C, Tickle IJ, Jhotiw H. Crystal Structures of Human Cytochrome P450 3A4 Bound to Metyrapone and Progesterone. Science. 2004;305:683–686. doi: 10.1126/science.1099736. [DOI] [PubMed] [Google Scholar]
- 49.Sakurai K, Shimada H, Hayashi T, Tsukihara T. Substrate Binding Induces Structural Changes in Cytochrome P450cam. Acta Crystallogr. F. 2009;65:80–83. doi: 10.1107/S1744309108044114. [DOI] [PMC free article] [PubMed] [Google Scholar]
- 50.Harris D, Loew G. Prediction of Regiospecific Hydroxylation of Camphor Analogs by Cytochrome-P450(Cam) J. Am. Chem. Soc. 1995;117:2738–2746. [Google Scholar]
- 51.White RE, Mccarthy MB, Egeberg KD, Sligar SG. Regioselectivity in the Cytochromes-P-450 - Control by Protein Constraints and by Chemical Reactivities. Arch. Biochem. Biophys. 1984;228:493–502. doi: 10.1016/0003-9861(84)90015-8. [DOI] [PubMed] [Google Scholar]
- 52.Atkins WM, Sligar SG. The Roles of Active-Site Hydrogen-Bonding in Cytochrome P-450cam as Revealed by Site-Directed Mutagenesis. J. Biol. Chem. 1988;263:18842–18849. [PubMed] [Google Scholar]
- 53.Loida PJ, Sligar SG, Paulsen MD, Arnold GE, Ornstein RL. Stereoselective Hydroxylation of Norcamphor by Cytochrome P450(Cam) - Experimental-Verification of Molecular-Dynamics Simulations. J. Biol. Chem. 1995;270:5326–5330. doi: 10.1074/jbc.270.10.5326. [DOI] [PubMed] [Google Scholar]
- 54.Collins JR, Loew GH. Theoretical-Study of the Product Specificity in the Hydroxylation of Camphor, Norcamphor, 5,5-Difluorocamphor, and Pericyclocamphanone by Cytochrome-P-450cam. J. Biol. Chem. 1988;263:3164–3170. [PubMed] [Google Scholar]
- 55.Kwak K, Park S, Finkelstein IJ, Fayer MD. Frequency-Frequency Correlation Functions and Apodization in Two-Dimensional Infrared Vibrational Echo Spectroscopy: A New Approach. J. Chem. Phys. 2007;127:124503. doi: 10.1063/1.2772269. [DOI] [PubMed] [Google Scholar]
- 56.Kwak K, Rosenfeld DE, Fayer MD. Taking Apart the Two-Dimensional Infrared Vibrational Echo Spectra: More Information and Elimination of Distortions. J. Chem. Phys. 2008;128:204505. doi: 10.1063/1.2927906. [DOI] [PubMed] [Google Scholar]
- 57.Massari AM, Finkelstein IJ, McClain BL, Goj A, Wen X, Bren KL, Loring RF, Fayer MD. The Influence of Aqueous Versus Glassy Solvents on Protein Dynamics: Vibrational Echo Experiments and Molecular Dynamics Simulations. J. Am. Chem. Soc. 2005;127:14279–14289. doi: 10.1021/ja053627w. [DOI] [PubMed] [Google Scholar]
- 58.Eyring H. The Activated Complex in Chemical Reactions. J. Chem. Phys. 1935;3:107. [Google Scholar]
- 59.Fang C, Bauman JD, Das K, Remorino A, Arnold E, Hochstrasser RM. Two-Dimensional Infrared Spectra Reveal Relaxation of the Nonnucleoside Inhibitor Tmc278 Complexed with HIV-1 Reverse Transcriptase. Proc. Natl. Acad. Sci. U.S.A. 2008;105:1472–1477. doi: 10.1073/pnas.0709320104. [DOI] [PMC free article] [PubMed] [Google Scholar]
- 60.Lim M, Hamm P, Hochstrasser RM. Protein Fluctuations Are Sensed by Stimulated Infrared Echoes of the Vibrations of Carbon Monoxide and Azide Probes. Proc. Natl. Acad. Sci. U.S.A. 1998;95:15315–15320. doi: 10.1073/pnas.95.26.15315. [DOI] [PMC free article] [PubMed] [Google Scholar]
- 61.Chin JK, Jimenez R, Romesberg FE. Direct Observation of Protein Vibrations by Selective Incorporation of Spectroscopically Observable Carbon–Deuterium Bonds in Cytochrome C. J. Am. Chem. Soc. 2001;123:2426–2427. doi: 10.1021/ja0033741. [DOI] [PubMed] [Google Scholar]


