Abstract
Cytosines in genomic DNA are sometimes methylated. This affects many biological processes and diseases. The standard way of measuring methylation is to use bisulfite, which converts unmethylated cytosines to thymines, then sequence the DNA and compare it to a reference genome sequence. We describe a method for the critical step of aligning the DNA reads to the correct genomic locations. Our method builds on classic alignment techniques, including likelihood-ratio scores and spaced seeds. In a realistic benchmark, our method has a better combination of sensitivity, specificity and speed than nine other high-throughput bisulfite aligners. This study enables more accurate and rational analysis of DNA methylation. It also illustrates how to adapt general-purpose alignment methods to a special case with distorted base patterns: this should be informative for other special cases such as ancient DNA and AT-rich genomes.
INTRODUCTION
Methylation of cytosine at position 5 (5meC) regulates many aspects of human biology, including embryonic development, transcription, chromatin structure, X-chromosome inactivation, genomic imprinting and chromosome stability (1). It is no less important in plants, where it affects transcription, replication, DNA repair, gene transposition and cell differentiation (2). Fascinatingly, DNA methylation is involved in plasticity and memory in nervous systems (3). Abnormal DNA methylation is characteristic of many diseases, including Alzheimer's (4) and cancer (1). Epigenetic cancer treatments are being explored, which aim to restore normal methylation patterns (5). In short, cytosine methylation has broad and deep biomedical importance.
Improvements in high-throughput DNA sequencing have recently enabled the measurement of methylation rates at cytosines throughout a genome. As sequencing technology continues to develop, it will likely be applied to methylome analysis in hundreds of cell types, thousands of organisms and many thousands of people in case–control studies of diseases. Thus, establishment of accurate analysis methods is timely.
The standard way of measuring 5meC is to treat the DNA sample with bisulfite, which converts unmethylated cytosines to uracils (and ultimately thymines after polymerase amplification). The DNA is then sequenced and compared with a reference genome, so that c:c matches and t:c mismatches indicate methylated and unmethylated cytosines, respectively.
There are actually two variants of bisulfite sequencing: the first produces sequences with c→t conversions only, and the second also produces reverse-complements exhibiting g→a conversions. This study considers the first variant only. (The second is discussed in the Supplementary Text).
The two critical analysis steps are as follows: aligning the DNA reads to the genome and then inferring methylation rates. Both steps are non-trivial, because sequencers produce short reads with errors, genomes are rife with similar repeats and duplications, and because the sampled DNA may differ from the reference genome due to polymorphisms. This study considers only the alignment step, because the two steps are largely independent and best optimized separately.
Sequence alignment has been studied for several decades, and hundreds of aligners have been published. Classic ‘medium-throughput’ methods such as Blast use statistical model likelihood ratios to score alignments, and a sensitive seed-and-extend approach to find them (6). More recently, high-throughput sequencing has spurred a new class of aligners, which are typically based on finding matches with low edit distance (i.e. few differences) very quickly. On the other hand, we have developed an aligner called Last, which is similar to Blast except that it achieves high speed by using adaptive seeds (7). By building on the classic techniques, Last can find alignments with high sensitivity as well as speed (8).
In this study, we first describe how to use Last for aligning bisulfite-converted DNA reads to a genome. We then set up a benchmark to test the accuracy and speed of alignment. This benchmark models polymorphisms and sequencing errors in a more realistic way than many previous tests of high-throughput aligners. Finally, we test Last alongside all other high-throughput bisulfite alignment methods that we could find.
MATERIALS AND METHODS
Score matrix
Traditional alignment methods use a score matrix, which assigns a positive or negative score for aligning any pair of bases (9). An example is shown in Table 1. The scores are actually log likelihood ratios:
Here, Ax is the probability (abundance) of base x in the reference sequence, and By is the probability of y in the query sequence. Mxy is the probability of x aligned to y in a true alignment, and T is an arbitrary scale factor.
Table 1.
Score matrix for aligning bisulfite-converted DNA reads to a reference genome sequence
| a | c | g | t | |
|---|---|---|---|---|
| a | 6 | −18 | −18 | −18 |
| c | −18 | 6 | −18 | 3 |
| g | −18 | −18 | 6 | −18 |
| t | −18 | −18 | −18 | 3 |
Columns refer to bases in the read, and rows refer to bases in the genome.
Bisulfite converts a fraction F of cytosines to thymines. This alters By and Mxy, as follows:
 |
Thus, we ought to use a suitably adjusted score matrix.
In this study, we assume that Ax ≈ By ≈ 1/4, and that:
This is suitable for alignments with 99% identity. (We also tried settings suited to ∼99.9% identity: Supplementary Figure S1.)
We assume that F ≈ 1, because typically most cytosines are unmethylated and thus converted. Finally, we set T ≈ 10/ln(10), which is the same scale as ‘phred’ scores (10). We used the score matrix in Table 1, which approximately fits these settings.
Using sequence quality data
Current sequencing technologies have significant error rates, and they often provide an error probability for each base. We previously showed how to combine these error estimates with the score matrix, to obtain generalized likelihood ratio scores (11). Since then, we have improved that method so as to allow for unequal base frequencies (Supplementary Text).
Seeding
Last starts by finding seeds (crude initial matches). It uses subset seeds, which are exact matches using reduced alphabets (7,12). It is possible to use a different reduced alphabet at each position of the match. The choice of which alphabet to use at each position is called the ‘seed pattern’.
In this study, we used the following seed pattern: 111111110. This means that, in the first 8 positions we used a three-letter alphabet where c and t are considered equivalent, whereas in Position 9 we used a one-letter alphabet where all four bases are considered equivalent. (The seed length is not fixed: if it is shorter than 9 then a prefix of the pattern is used, if it longer than 9 the pattern repeats.) The purpose of the ‘0’ is to increase sensitivity (13). We did not systematically optimize the seed pattern, but we tried a few other patterns (Supplementary Figure S3 and S4).
Last details
Last has three parts. First, lastdb constructs an index of the genome. Then, lastal finds alignments, possibly more than one alignment per DNA read. Finally, last–map–probs resolves multi-mapping reads, by estimating the probability that each alignment is the correct one (11). Only alignments with low mismap probability (e.g. ≤0.01) are retained.
Benchmark data
The test data consist of computer-simulated DNA reads from chromosomes 1–22 and X of the human genome (hg19).
First, we randomly assigned a methylation rate to every cytosine in both strands of each chromosome. Each cytosine received one of five possible methylation rates (Table 2). A methylation rate of (say) 0.2 means that this cytosine is methylated in 20% of the genomes from which the DNA sample was obtained. In our simulation, the probability of assigning each methylation rate depended whether or not the c was followed by a g (Table 2).
Table 2.
Simulated cytosine methylation rates, and their probabilities
| Methylation rate | Probability in cg context | Probability in non-cg context | Bisulfite conversion rate |
|---|---|---|---|
| ∼0 | 0.1 | 0.96 | 0.99 |
| ∼0.1 | 0.1 | 0.01 | 0.9 |
| ∼0.2 | 0.1 | 0.01 | 0.8 |
| ∼0.5 | 0.1 | 0.01 | 0.5 |
| ∼1 | 0.6 | 0.01 | 0 |
Each cytosine was randomly assigned one of five possible methylation rates. The probability of choosing each rate depended on whether the c was followed by a g. [Strictly speaking, the simulation assigned bisulfite conversion rates, not methylation rates. Conversion rate = 0.99 × (1–methylation rate).]
Second, we randomly simulated polymorphisms in the genome, by picking real alleles based on their frequencies, obtained from snp132Common.txt from the UCSC Genome Database (14,15). These include not only substitutions, but also insertions and deletions. Some of the insertions are large enough that it is possible for a DNA read to come entirely from sequence that is absent in the original genome.
Third, we extracted 1 million random fragments, of length 87 (Dataset A) or 85 (Dataset B), from the polymorphed genome. We used these lengths in order to match two real datasets (SRR019072 and SRR094461).
Next, we simulated bisulfite conversion, by changing each cytosine to thymine with probability: 0.99 × (1–methylation rate). This simulates the typical conversion efficiency of ∼0.99.
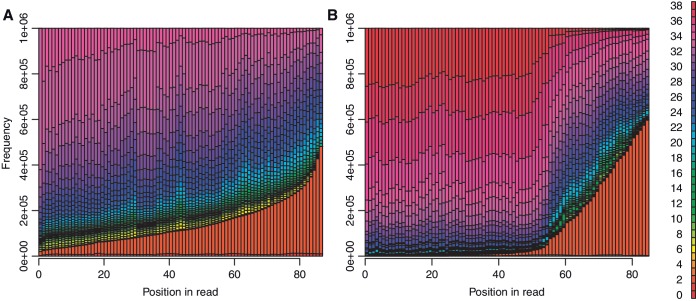
Finally, we simulated sequencer errors, according to the per-base error probabilities of the first 1 million reads in SRR019072 (Dataset A) or SRR094461 (Dataset B). The error distributions are shown in Figure 1.
Figure 1.
Distribution of sequence quality (phred) scores for the two datasets. (Phred score = −10log10 error probability.) Each dataset contains 1 million DNA reads of length 87 (A) or 85 (B).
Some aspects of this simulation are more intricate than necessary for testing alignment, but would be useful for testing methylation rate inference. The test data and simulation programs are available at: http://www.cbrc.jp/dnemulator/.
Benchmark measurements
Each aligner produces at most one alignment per DNA read. We define an alignment as ‘correct’ if at least one of its columns is exactly correct. (For gapped alignments, it is possible that some columns are correct and others are not).
As far as possible, we measured the CPU time of the alignment step only, excluding index-building, etc. For the methods that wrap Bowtie and Gsnap, we just recorded the time for the aligner itself.
Other alignment methods tested
We tested Bismark (16) and BS_Seeker (17), which both use Bowtie (18) as the alignment engine. We also tested the Bowtie recipe of Lister et al. (19). In addition, we tested MethylCoder (20), using Gsnap (21) as the alignment engine. (MethylCoder can also use Bowtie, but we did not test that.) We also tested Brat (22), Bsmap (23), Novoalign (www.novocraft.com), Pash (24) and Rmap (25). Versions and settings are detailed in the Supplementary Text.
Repeat data
Repeat annotations were obtained from the files rmsk.txt and genomicSuperDups.txt from UCSC (version hg19) (15).
RESULTS
Performance of alignment methods on the benchmark
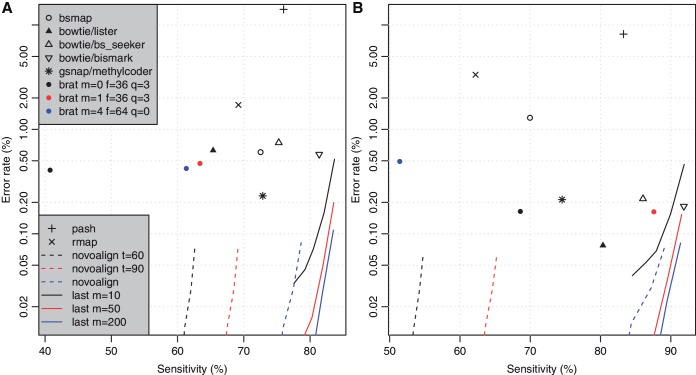
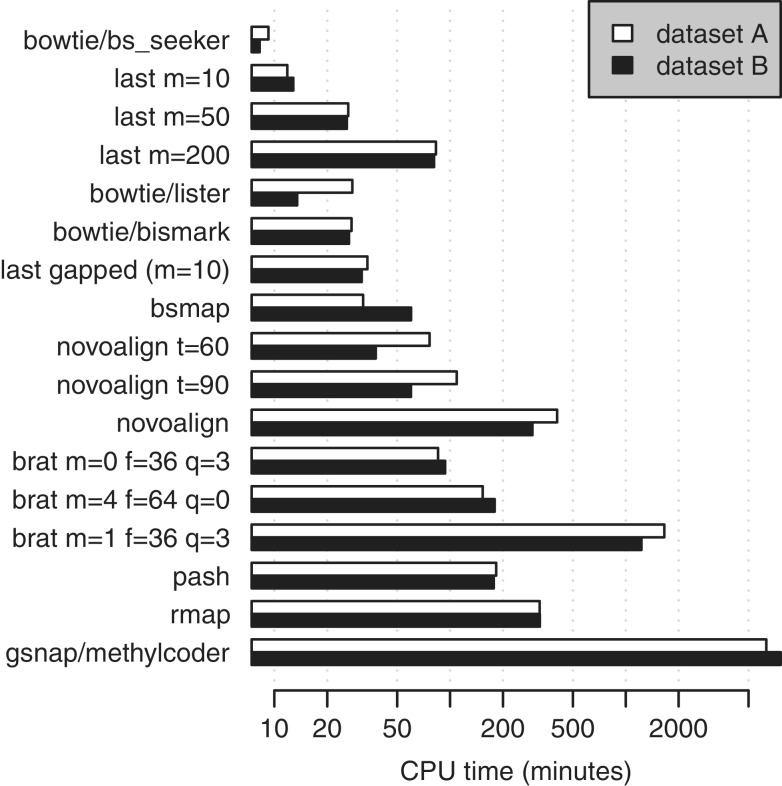
The sensitivity, error rate and CPU time of each method is shown in Figures 2 and 3.
Figure 2.
Accuracy of various methods for aligning bisulfite-converted DNA reads to the reference genome, for datasets (A) and (B). The sensitivity is the percentage of total reads that were correctly aligned. The error rate is the percentage of aligned reads that were wrongly aligned. For Last and Novoalign, each line shows the effect of varying the max mismap probability.
Figure 3.
Run times of various methods for aligning bisulfite-converted DNA reads to the reference genome.
For Last, we tried varying two parameters: max seed frequency (m) and max mismap probability. As expected (7), m smoothly trades accuracy for speed. (Higher m increases accuracy but decreases speed). Also as expected, the mismap parameter smoothly trades sensitivity for error rate. (If we accept alignments with higher mismap probability, we get higher sensitivity and also more errors.)
Novoalign also estimates a mismap probability, which trades sensitivity for error rate in a similar fashion to Last. In addition it has a t parameter, which trades sensitivity for speed. For a given speed, Last is much more sensitive than Novoalign. On the other hand, Novoalign consistently enables very low error rates.
Bismark exhibits high sensitivity, and for Dataset B it achieves the same accuracy for a given run time as Last. On the other hand, we could not discern a way to trade Bismark's sensitivity for lower error rate.
BS_Seeker was the fastest method, and it achieved moderately good accuracy.
Memory usage
The methods vary several-fold in memory usage, and Last uses more than most (Table 3). (It has parameters that trade memory for speed or accuracy, which we did not test.) A few dozen gigabytes is increasingly affordable, so this is not a severe limitation for any method.
Table 3.
Peak memory usage for the alignment step of the tested methods
| Method | Memory (GB) |
|---|---|
| Bowtie | <3 |
| Brat m=0 | 22 |
| Brat m>0 | 12 |
| Bsmap | 8 |
| Gsnap | 10 |
| Last | 15 |
| Novoalign | 13 |
| Pash | 11 |
| Rmap | <1 |
Parameter optimization
For most of the methods, we tried multiple parameter settings (Supplementary Datasets 1 and 2), but only the best results are shown here. This possibly overstates the performance of some methods. For example, Bismark works much better after trimming bases with phred score <3 than trimming bases <10 or not trimming, but we discovered this only empirically. In other words, the performance of some methods is sensitive to non-obvious parameter changes. Furthermore, it is not clear that the same parameters would be optimal for different data (e.g. different read lengths and error patterns).
On the other hand, we did not consciously optimize Last on the test data. In fact, we discovered some parameters that improve it slightly (Supplementary Figures S1–S4), but we do not use these parameters in the main figures.
Avoiding biased methylation estimates
Our alignment procedure with Last risks a kind of bias. Suppose that one genomic cytosine is methylated in 50% of genomes in our sample, so that 50% of the reads covering it have c and 50% have t. It is possible that the reads with c are easier to align, so we align more of them. This will make the methylation rate appear >50%. This bias is not specific to Last (25).
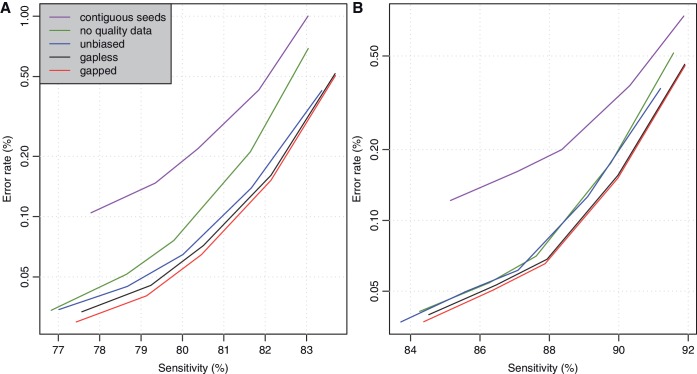
We can avoid this bias by computationally converting all cs in the reads to ts, prior to alignment. This is expected to harm alignment accuracy: in the example above, all the reads would become harder to align. Fortunately, this procedure had little effect in our tests: Figure 4 shows the accuracy with (blue lines) and without (black lines) computational c→t conversion.
Figure 4.
Accuracy of Last, with various parameter settings, for aligning bisulfite-converted DNA reads to the reference genome, for datasets (A) and (B). The black lines in this figure are identical to the solid black lines in Figure 2.
We mention in passing a useful trick: convert the cs to lowercase ts, with all other letters uppercase. Our alignment procedure treats lowercase identically to uppercase, but preserves it in the output, allowing us to see which bases were converted.
Effect of gaps
Last can run in either gapless or gapped mode. Gapped alignment had only slightly higher accuracy (Figure 4), as expected since gaps are rare, but significantly lower speed (Figure 3). Unfortunately, we suspect that gaps are less rare in real data, so the relevance of this result is unclear. Among the other methods, only Gsnap, Novoalign and Pash allow gaps.
Effect of using sequence quality data
In order to learn which aspects of Last contribute to its performance, we tried it without using sequence quality data (i.e. pretending that all bases have zero error probability). This decreased its accuracy, but not greatly (Figure 4). In one sense this result is encouraging, because in our benchmark the quality data are perfectly accurate, but in real data it might not be. (On one hand, quality data are often made accurate by calibration. On the other hand, if the quality data are random, calibration cannot make it informative.) Quality data would likely have more effect if there were more phred scores in the range 5–15 or so, i.e. not too high and not so low that the bases are near-random.
Effect of spaced seeds
We also ran Last with contiguous seeds, i.e. seed pattern ‘1’, which means allowing ct mismatches in all positions and no other mismatches. This decreased the accuracy quite noticeably, but not so much as to be the main factor in Last's performance (Figure 4).
We believe that the key factor behind Last's performance is the use of a seed-and-extend strategy with adaptive seeds.
Effect of genomic repeats
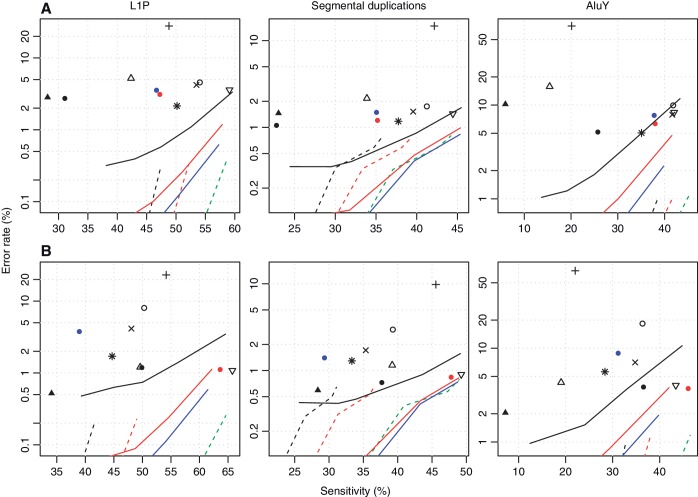
To better understand the impact of alignment accuracy, it is important to consider not only the genome average (Figure 2), but also the accuracy in problematic loci, i.e. repeats (Figure 5).
Figure 5.
Accuracy of various methods for aligning bisulfite-converted DNA reads to recent duplications in the genome. The upper row shows results for dataset (A), and the lower row for dataset (B). The left-most column shows results for L1P elements, the middle column for segmental duplications and the right-most column for AluY elements. The sensitivity is the percentage of reads from within duplicated regions that were correctly aligned. The error rate is the percentage of reads aligned within duplicated regions that were wrongly aligned. Each symbol and line refers to a different alignment method: see the key in Figure 2.
About 6% of reads came from within primate-specific LINE-1 (L1P) elements. For these reads, Last and Novoalign have roughly equal accuracy for a given run time. Bismark also performs well, especially for Dataset B.
About 5% of reads came from within segmental duplications. For these reads, Last is more accurate than Novoalign for a given run time.
About 1% of reads came from within young Alu (AluY) elements. For these reads, Novoalign clearly performs best.
Overall, it is possible to achieve non-negligible sensitivity (30–50%), with error rates <1%, even in these recently duplicated repeats.
DISCUSSION
Comparison of bisulfite alignment methods
Overall, our results strongly suggest that Last is the best high-throughput aligner for bisulfite-converted DNA. However, there is a suspicious pattern in bioinformatics publications of the authors' own method performing best. This could arise because the testers use the other methods in suboptimal ways, or over-fit their own method to the benchmark. To mitigate the first danger, we contacted the authors of the other methods, described the benchmark and checked whether we were using their method appropriately. As for over-fitting, the only aspects of Last we changed for this study that affect the results are the score matrix and the seed pattern, neither of which were fitted to the benchmark. Nevertheless, an independent test would be reassuring.
It must also be emphasized that the other aligners are being improved, indeed newer versions were steadily appearing as we finalized this study.
Benchmark
Our conclusions depend critically on the validity of the benchmark. The benchmark used here simulates polymorphisms and sequencing errors based on real data, so that the error rates vary both within and between reads. In contrast, some previous tests of high-throughput aligners have used uniform random mutations, which is less realistic, and we suspect it favors edit-distance-centric aligners.
It is also important to consider sensitivity, error rate and speed in combination, not separately. This is because some aligners can trade speed for accuracy, or sensitivity for fewer errors. Thus, it is not very meaningful to measure ‘sensitivity’, instead we must measure ‘sensitivity for a given error rate and speed’ or the like.
It may be tempting to assess aligners on real data, where the true answer is unknown, but we can measure the percentage of reads aligned and the run time. This is dangerous, because it is trivial to align 100% of reads infinitely fast if correctness is not considered.
Our benchmark is not perfectly realistic. For one thing, real DNA reads often have non-genomic adapter sequences at the ends. For some aligners it is critical to remove them first: e.g. the Bowtie/Lister method requires the first 20 bases of the read to match the genome exactly. Last, on the other hand, finds local alignments between any part of the read and the genome, so it is robust to adapters.
More importantly, real data will include DNA reads from unsequenced regions of the genome, alternative haplotypes, structural variants, contaminants and probably other artifacts that we have not imagined. These cast doubt, in particular, on the extremely low error rates achieved by e.g. Novoalign: it only takes a small percentage of confounding artifacts to overwhelm an otherwise low error rate.
Potential countermeasures for such artifacts include using a more stringent score matrix, and perhaps a higher alignment score threshold (Supplementary Text). It might also be worth flagging alignments of low-complexity sequence (26). As food for thought, if a read comes from a locus with different copy numbers in the sampled and reference genomes, it is not clear what a correct alignment would be.
Finally, our conclusions only apply to read lengths ∼85 with error patterns like those shown in Figure 1. We used two datasets with somewhat different error patterns in order to make the conclusions more robust. Of course some sequencing technologies are very different, and most are evolving.
Methylation rate inference and low-quality bases
Even if the reads are perfectly aligned, it is not completely trivial to infer methylation rates. In general, one genomic c will have several cs and ts (and as and gs) aligned to it, each with a quality score, and we must allow for sequencing errors and SNPs. This problem is no different for Last than for any other aligner, so we can use inference methods developed separately. The only caveat is that it might be necessary to remove poor quality bases, if the inference method does not take quality into account.
Possible enhancements
We have assumed the bisulfite conversion rate F ≈ 1, but it is known that cytosines are more frequently methylated in certain contexts, especially in cg context. Alignment accuracy could possibly be improved by incorporating sequence context in the likelihood-ratio scoring [see the Supplementary Text for contexts cg, chg (h in non-g), and chh].
Another enhancement is probabilistic alignment, which optimizes the accuracy of each column within an alignment (8). This will have a significant effect when gaps are common, as is the case for some sequencing technologies.
Paired-end or mate-paired reads help disambiguate alignments to repetitive regions. Different aligners use different algorithms for such data, which are built on simpler algorithms for unpaired alignment. This study focused on unpaired alignment, to avoid the confounding issue of different pairing algorithms, and because better unpaired alignment contributes to better paired alignment.
Beyond bisulfite sequencing
Distorted base patterns occur in other kinds of data too. Ancient DNA exhibits cytosine to uracil conversions (27). Some organisms have highly biased base abundances, for example ∼80% a+t in Plasmodium and Dictyostelium. We hope this study will be instructive for adapting alignment parameters to these and other non-standard kinds of sequence data. (We must point out there is at least one sophisticated aligner specialized for ancient DNA: https://bioinf.eva.mpg.de/anfo/).
A major reason for Last's effectiveness is that it builds on decades of classic alignment research. This makes it versatile and perhaps especially promising for ‘unusual’ alignment problems. Unfortunately, adapting Last (or any other aligner) is not straightforward: for example, the danger of biased methylation estimates is not immediately obvious. For this kind of reason, any new type of sequence data may require expert design of an alignment protocol. Moreover, each type of data may have special-case tasks, like inferring methylation rates. Thus there is an important place for specialized tools that ‘wrap’ alignment methods; like Bismark, BS_Seeker and MethylCoder.
SUPPLEMENTARY DATA
Supplementary Data are available at NAR Online: Supplementary Text (including Supplementary Figures 1–4 and Supplementary Datasets 1–2).
FUNDING
Grant-in-Aid for Scientific Research on Innovative Areas 221S0002 from the Ministry of Education, Culture, Sports, Science and Technology in Japan; National Cancer Center Research and Development Fund 23-A-8. Funding for open access: AIST (National Institute for Advanced Industrial Science and Technology).
Conflict of interest statement. None declared.
Supplementary Material
ACKNOWLEDGEMENTS
We thank Wei Qu for advice on bisulfite sequence data.
REFERENCES
- 1.Watanabe Y, Maekawa M. Methylation of DNA in cancer. Adv. Clin. Chem. 2010;52:145–167. doi: 10.1016/s0065-2423(10)52006-7. [DOI] [PubMed] [Google Scholar]
- 2.Vanyushin BF, Ashapkin VV. DNA methylation in higher plants: past, present and future. Biochim. Biophys. Acta. 2011;1809:360–368. doi: 10.1016/j.bbagrm.2011.04.006. [DOI] [PubMed] [Google Scholar]
- 3.Yu NK, Baek SH, Kaang BK. DNA methylation-mediated control of learning and memory. Mol. Brain. 2011;4:5. doi: 10.1186/1756-6606-4-5. [DOI] [PMC free article] [PubMed] [Google Scholar]
- 4.Coppieters N, Dragunow M. Epigenetics in Alzheimer's disease: a focus on DNA modifications. Curr. Pharm. Des. 2011;17:3398–3412. doi: 10.2174/138161211798072544. [DOI] [PubMed] [Google Scholar]
- 5.Mund C, Lyko F. Epigenetic cancer therapy: Proof of concept and remaining challenges. Bioessays. 2010;32:949–957. doi: 10.1002/bies.201000061. [DOI] [PubMed] [Google Scholar]
- 6.Altschul SF, Madden TL, Schaffer AA, Zhang J, Zhang Z, Miller W, Lipman DJ. Gapped BLAST and PSI-BLAST: a new generation of protein database search programs. Nucleic Acids Res. 1997;25:3389–3402. doi: 10.1093/nar/25.17.3389. [DOI] [PMC free article] [PubMed] [Google Scholar]
- 7.Kielbasa SM, Wan R, Sato K, Horton P, Frith MC. Adaptive seeds tame genomic sequence comparison. Genome Res. 2011;21:487–493. doi: 10.1101/gr.113985.110. [DOI] [PMC free article] [PubMed] [Google Scholar]
- 8.Hamada M, Wijaya E, Frith MC, Asai K. Probabilistic alignments with quality scores: an application to short-read mapping toward accurate SNP/indel detection. Bioinformatics. 2011;27:3085–3092. doi: 10.1093/bioinformatics/btr537. [DOI] [PubMed] [Google Scholar]
- 9.Durbin R, Eddy S, Krogh A, Mitchison G. Biological Sequence Analysis: Probabilistic Models of Proteins and Nucleic Acids. Cambridge University Press; 1998. [Google Scholar]
- 10.Ewing B, Green P. Base-calling of automated sequencer traces using phred. II. Error probabilities. Genome Res. 1998;8:186–194. [PubMed] [Google Scholar]
- 11.Frith MC, Wan R, Horton P. Incorporating sequence quality data into alignment improves DNA read mapping. Nucleic Acids Res. 2010;38:e100. doi: 10.1093/nar/gkq010. [DOI] [PMC free article] [PubMed] [Google Scholar]
- 12.Kucherov G, Noe L, Roytberg M. A unifying framework for seed sensitivity and its application to subset seeds. J. Bioinform. Comput. Biol. 2006;4:553–569. doi: 10.1142/S0219720006001977. [DOI] [PMC free article] [PubMed] [Google Scholar]
- 13.Ma B, Tromp J, Li M. PatternHunter: faster and more sensitive homology search. Bioinformatics. 2002;18:440–445. doi: 10.1093/bioinformatics/18.3.440. [DOI] [PubMed] [Google Scholar]
- 14.Sherry ST, Ward MH, Kholodov M, Baker J, Phan L, Smigielski EM, Sirotkin K. dbSNP: the NCBI database of genetic variation. Nucleic Acids Res. 2001;29:308–311. doi: 10.1093/nar/29.1.308. [DOI] [PMC free article] [PubMed] [Google Scholar]
- 15.Fujita PA, Rhead B, Zweig AS, Hinrichs AS, Karolchik D, Cline MS, Goldman M, Barber GP, Clawson H, Coelho A, et al. The UCSC Genome Browser database: update 2011. Nucleic Acids Res. 2011;39:D876–D882. doi: 10.1093/nar/gkq963. [DOI] [PMC free article] [PubMed] [Google Scholar]
- 16.Krueger F, Andrews SR. Bismark: a flexible aligner and methylation caller for Bisulfite-Seq applications. Bioinformatics. 2011;27:1571–1572. doi: 10.1093/bioinformatics/btr167. [DOI] [PMC free article] [PubMed] [Google Scholar]
- 17.Chen PY, Cokus SJ, Pellegrini M. BS Seeker: precise mapping for bisulfite sequencing. BMC Bioinformatics. 2010;11:203. doi: 10.1186/1471-2105-11-203. [DOI] [PMC free article] [PubMed] [Google Scholar]
- 18.Langmead B, Trapnell C, Pop M, Salzberg SL. Ultrafast and memory-efficient alignment of short DNA sequences to the human genome. Genome Biol. 2009;10:R25. doi: 10.1186/gb-2009-10-3-r25. [DOI] [PMC free article] [PubMed] [Google Scholar]
- 19.Lister R, Pelizzola M, Dowen RH, Hawkins RD, Hon G, Tonti-Filippini J, Nery JR, Lee L, Ye Z, Ngo QM, et al. Human DNA methylomes at base resolution show widespread epigenomic differences. Nature. 2009;462:315–322. doi: 10.1038/nature08514. [DOI] [PMC free article] [PubMed] [Google Scholar]
- 20.Pedersen B, Hsieh TF, Ibarra C, Fischer RL. MethylCoder: software pipeline for bisulfite-treated sequences. Bioinformatics. 2011;27:2435–2436. doi: 10.1093/bioinformatics/btr394. [DOI] [PMC free article] [PubMed] [Google Scholar]
- 21.Wu TD, Nacu S. Fast and SNP-tolerant detection of complex variants and splicing in short reads. Bioinformatics. 2010;26:873–881. doi: 10.1093/bioinformatics/btq057. [DOI] [PMC free article] [PubMed] [Google Scholar]
- 22.Harris EY, Ponts N, Levchuk A, Roch KL, Lonardi S. BRAT: bisulfite-treated reads analysis tool. Bioinformatics. 2010;26:572–573. doi: 10.1093/bioinformatics/btp706. [DOI] [PMC free article] [PubMed] [Google Scholar]
- 23.Xi Y, Li W. BSMAP: whole genome bisulfite sequence MAPping program. BMC Bioinformatics. 2009;10:232. doi: 10.1186/1471-2105-10-232. [DOI] [PMC free article] [PubMed] [Google Scholar]
- 24.Coarfa C, Yu F, Miller CA, Chen Z, Harris RA, Milosavljevic A. Pash 3.0: a versatile software package for read mapping and integrative analysis of genomic and epigenomic variation using massively parallel DNA sequencing. BMC Bioinformatics. 2010;11:572. doi: 10.1186/1471-2105-11-572. [DOI] [PMC free article] [PubMed] [Google Scholar]
- 25.Smith AD, Chung WY, Hodges E, Kendall J, Hannon G, Hicks J, Xuan Z, Zhang MQ. Updates to the RMAP short-read mapping software. Bioinformatics. 2009;25:2841–2842. doi: 10.1093/bioinformatics/btp533. [DOI] [PMC free article] [PubMed] [Google Scholar]
- 26.Frith MC. Gentle masking of low-complexity sequences improves homology search. PLoS One. 2011;6:e28819. doi: 10.1371/journal.pone.0028819. [DOI] [PMC free article] [PubMed] [Google Scholar]
- 27.Briggs AW, Stenzel U, Johnson PL, Green RE, Kelso J, Prufer K, Meyer M, Krause J, Ronan MT, Lachmann M, et al. Patterns of damage in genomic DNA sequences from a Neandertal. Proc. Natl Acad. Sci. USA. 2007;104:14616–14621. doi: 10.1073/pnas.0704665104. [DOI] [PMC free article] [PubMed] [Google Scholar]
Associated Data
This section collects any data citations, data availability statements, or supplementary materials included in this article.


