

Abstract
Feed-efficient animals have lower production costs and reduced environmental impact. Given that rumen microbial fermentation plays a pivotal role in host nutrition, the premise that rumen microbiota may contribute to host feed efficiency is gaining momentum. Since diet is a major factor in determining rumen community structure and fermentation patterns, we investigated the effect of divergence in phenotypic residual feed intake (RFI) on ruminal community structure of beef cattle across two contrasting diets. PCR-denaturing gradient gel electrophoresis (DGGE) and quantitative PCR (qPCR) were performed to profile the rumen bacterial population and to quantify the ruminal populations of Entodinium spp., protozoa, Fibrobacter succinogenes, Ruminococcus flavefaciens, Ruminococcus albus, Prevotella brevis, the genus Prevotella, and fungi in 14 low (efficient)- and 14 high (inefficient)-RFI animals offered a low-energy, high-forage diet, followed by a high-energy, low-forage diet. Canonical correspondence and Spearman correlation analyses were used to investigate associations between physiological variables and rumen microbial structure and specific microbial populations, respectively. The effect of RFI on bacterial profiles was influenced by diet, with the association between RFI group and PCR-DGGE profiles stronger for the higher forage diet. qPCR showed that Prevotella abundance was higher (P < 0.0001) in inefficient animals. A higher (P < 0.0001) abundance of Entodinium and Prevotella spp. and a lower (P < 0.0001) abundance of Fibrobacter succinogenes were observed when animals were offered the low-forage diet. Thus, differences in the ruminal microflora may contribute to host feed efficiency, although this effect may also be modulated by the diet offered.
INTRODUCTION
The rumen ecosystem harbors an immense diversity of microscopic organisms, including, anaerobic bacteria, archaea, fungi, and single-celled ciliated protozoa (28). The structure of this microbial community is influenced by many factors, including host species, age, health status, diet, geographical location, and whether the animal has received antibiotic treatment (8). Microbes that have been previously isolated from the bovine rumen include Prevotella bacteria (e.g., Prevotella brevis), fibrolytic bacteria (e.g., Fibrobacter succinogenes, Ruminococcus flavefaciens, and Ruminococcus albus), rumen fungi, and protozoa (e.g., Entodinium) (28). Collectively, these microorganisms enable the regulation of ruminal pH (56) and the fermentation of cellulose, hemicellulose, and fiber (39) to end products utilizable by the host and therefore having a significant effect on host maintenance, growth, and performance. In return, the host animal provides substrate, together with a suitable anaerobic environment for the microbes to thrive.
Residual feed intake (RFI), defined as the difference between an animal's actual feed intake and its predicted intake based on rate of gain and body size, has become the preferred measure of energetic efficiency for livestock (23). This is largely because RFI is moderately heritable and genetically independent of growth and body size (7). Efficient or low-RFI animals offer a significant economic advantage since they consume less feed, than expected, for their weight and rate of gain, compared to their more inefficient or high-RFI counterparts. Although the specific biological mechanisms contributing to improved feed efficiency have yet to be fully elucidated, it is likely to be controlled by a combination of factors, including physiological (23), genetic (24), and behavioral mechanisms (34). Indeed, a recent molecular analysis of rumen contents from Canadian feedlot managed beef steers reported evidence for a link between rumen bacterial profiles and RFI in animals offered a high-energy finishing diet (20). In that study, PCR-denaturing gradient gel electrophoresis (DGGE) profiles generated for efficient steers differed from those for inefficient steers, indicating that the rumen microbial population may contribute to feed efficiency of the host.
Diet is one of the main factors influencing rumen microbial populations and specifically the milieu of substrate derived from microbial fermentation of ingested feed. The principal fermentation components will of course vary depending on the chemical composition of the feed. For example, a forage-based diet is dominated by cellulose and hemicellulose, which favors the proliferation of fibrolytic bacteria. Starch and sugars are the major fermentation components of concentrate-based diets, thus favoring starch-degrading amylolytic bacteria. A few studies to date have provided evidence for an effect of diet on the ruminal microbial consortia in cattle (9, 50). Furthermore, a host-specific microbiome has been identified in cattle divergent in RFI offered a high-energy diet (20). However, despite its obvious critical importance, there is little published information on the effect of diet composition on the ruminal microbial consortia in cattle divergent for RFI. Although our own work suggests moderate within-animal repeatability of RFI while maintained on a constant diet type (31), other recent work from Canada has shown that the relative ranking of animals for this trait may change when moved from a low- to a high-energy diet (14).
In the present study, we hypothesized that both the overall rumen microbial profile and specific rumen microbial groups would be influenced by host feed efficiency and that this may also depend on the dietary substrate offered. Therefore, a molecular analysis of the rumen microflora of beef heifers phenotypically divergent for RFI across two contrasting diets, namely, high-forage grass silage (HF) followed by a low-forage high concentrate diet (LF) was conducted.
MATERIALS AND METHODS
All procedures involving animals were approved for the use of live animals in experiments by the University College Dublin Animal Research Ethics Committee and were licensed by the Irish Department of Health and Children in accordance with the Cruelty to Animals Act (Ireland 1897) and European Community Directive 86/609/EC.
Animals and diets.
This experiment was conducted as part of a larger study designed to examine the physiological control of energetic efficiency in growing beef heifers (30). Briefly, individual dry matter intake (DMI) and growth were recorded for 86 yearling Limousin × Friesian heifers offered ad libitum access to a high-energy low forage (LF) diet over 112 days. All animals were subsequently ranked retrospectively on phenotypic RFI, defined as the deviation of predicted DMI from actual daily DMI (7). Fourteen heifers with the highest (inefficient; high RFI) and 14 heifers with the lowest (efficient; low RFI) RFI coefficients during that study were selected (n = 28 in total) for use in the present study (see Table S1 in the supplemental material). The mean RFI value for the H-RFI heifers was 0.7 (standard deviation [SD] = 0.39), while the mean RFI value for the L-RFI heifers was −0.7 (SD = 0.24). The mean age at the start of the experiment was 248 days (SD = 20 days), and the mean weight was 315 kg (SD = 35.5 kg). After initial selection, all 28 animals were re-allocated to a high-forage diet (HF), and the individual feed intake was recorded for a 44-day period. After this 44-day period (period 1), all animals were turned out to pasture for a 56-day dietary “washout” period. Subsequently, all 28 animals were rehoused and re-allocated to a low-forage diet (LF), and the individual feed intake was recorded for 35 days (period 2). Individual feed intake and body weight gain were recorded for a further 84 days, and the RFI was recalculated. All 28 animals remained within their respective RFI groups (31). The experiment was therefore designed to have two factors: RFI phenotype and diet type. The HF diet was composed of grass silage only, whereas the LF diet was composed of pelleted concentrate and corn silage at a 70:30 concentrate/forage ratio (dry matter [DM] basis) and was offered as a total mixed ration (TMR). Both diets were offered ad libitum. Dietary ingredients and chemical composition has been previously described in detail (30). Daily feed intake was measured for each animal using a previously validated (30) electronic feed intake monitoring system (Insentec, Marknesse, Netherlands). The total daily DMI was calculated as the sum of all meals consumed within each day corrected for DM content. The average daily metabolizable energy intake (MEI) per unit of metabolic body weight was estimated using the following equation: MEI = [gross energy × digestible energy (42) × 0.82]/metabolic body weight as previously described (16). Animals were weighed at 14-day intervals over both dietary periods using calibrated scales. The average daily gain (ADG) was computed as the coefficient of the linear regression of weight (in kg) over time using the Statistical Analysis Systems REG procedure (SAS Institute, Inc., Cary, NC). Mid-test metabolic body weight (MBW) was estimated from the intercept and slope of the regression line after fitting a linear regression through all metabolic body weight (BW0.75) observations.
Rumen sampling.
Rumen sampling was performed at the end of both dietary periods. Samples of rumen fluid were collected using a transesophageal sampling device (FLORA rumen scoop; Guelph, Ontario, Canada). The pH of each sample was recorded immediately after collection using a Mettler Toledo MP 200 pH meter (Mettler Toledo, Ltd., Essex, England). Subsequently, a 20-ml aliquot was transferred using a pipette and sterilized tip into a separate labeled sterilized container, immediately frozen in liquid nitrogen, and stored at −80°C until processing.
DNA extraction from rumen fluid.
Total microbial DNA was extracted from the 28 rumen fluid samples by adaptation of the repeated bead beating and column purification (RBB+C) method described by Yu and Morrison (59), which provides efficient recovery of PCR-quality microbial DNA. The detailed experimental procedure for DNA extraction is provided in the supplemental material.
PCR amplification of bacterial 16S rRNA genes.
DNA extracted from individual rumen fluid samples was diluted to a concentration of 100 ng μl−1, and 1 μl of this diluted DNA was used as a template in all PCRs. Approximately 200 bp of the V2-V3 region of the 16S rRNA gene (positions 339 to 539 in the Escherichia coli 16S rRNA gene, accession number EU009187) was amplified using the universal bacterial primer set HDA-1GC and HDA2 (HDA1 GC [5′-CGC CCG GGG CGC GCC CCG GGC GGG GCG GGG GCA CGG GGG GAC TCC TAC GGG AGG CAG CAG T-3′] and HDA2 [5′-GTA TTA CCG CGG CTG CTG GCA C-3′]) (54). The hypervariable V3 region of the 16S rRNA gene has been reported as the most favorable target in PCR-DGGE analysis when profiling microbial communities in the gastrointestinal tract of herbivores (58). The forward primer incorporated a 40-bp GC clamp (indicated in boldface) (40) at its 5′ terminus. All PCR amplifications were optimized and performed in 0.2-ml tubes in a DNA thermal cycler (Bio-Rad S1000 thermal cycler; Bio-Rad Laboratories, Inc., Hercules, CA). The amplification procedure was carried as previously described (46), with the exception of a 2- min duration for the initial denaturation step. Aliquots (10 μl) of the PCR products were analyzed by electrophoresis on a 1.5% agarose gel (wt/vol) in sodium borate buffer to verify the presence and sizes of the PCR products. Negative controls without template DNA were included in parallel. All PCR products were stored at −20°C until further use in DGGE analysis.
PCR-DGGE.
PCR amplicons were used for sequence specific separation by DGGE. DGGE was performed using a D-Code universal mutation detection system (Bio-Rad) at a constant voltage of 75 V as previously described (46). A customized DGGE marker and a sample pool of all 56 PCR products were both used as references to normalize the band position for later gel comparisons. After electrophoresis, the gels were stained for 10 to 15 min in 1× Tris-acetate-EDTA (TAE) buffer containing SYBR Green I dye (Invitrogen, Carlsbad, CA) and destained in 1× TAE buffer for 5 min. Visualization of DNA was carried out using a Bio-Rad Geldoc XR system (Bio-Rad) with the aid of Quantity One software (Bio-Rad), and the image was saved for further profile analysis.
DGGE profile analysis.
DGGE profile analysis was carried out as previously described (29). After normalization, the similarity between profiles was calculated using the Dice similarity coefficient (Dsc) (12), and clustering was performed by construction of dendrograms using unweighted pairwise grouping with mathematical averages (UPGMA). Subsequently, the average Dsc values were calculated according to the method of Guan et al. (20). Multidimensional scaling (MDS) was performed using the MDS module supplied with the Bionumerics software package.
CCA.
The canonical correspondence analysis (CCA) technique was developed to relate community profiles to known external variables (51). In our study, CCA was used to investigate the relationships between rumen microbial community composition obtained from the DGGE banding patterns and a number of physiological and rumen fermentation variables (see Table 3) measured on the animals. When used for DGGE profile analysis, CCA creates axes of variation in profile banding patterns that are maximally related to explanatory variables. CCA was implemented using CANOCO 4.0 (52) for Microsoft Windows software under default settings, and the results of the analyses were visualized as ordination biplots. A detailed explanation of a CCA biplot is provided below (see the legend for Fig. 2). A Monte Carlo permutation test based on 499 random permutations was used to test the null hypothesis that bacterial profiles were unrelated to the physiological and rumen fermentation variables.
Fig 2.
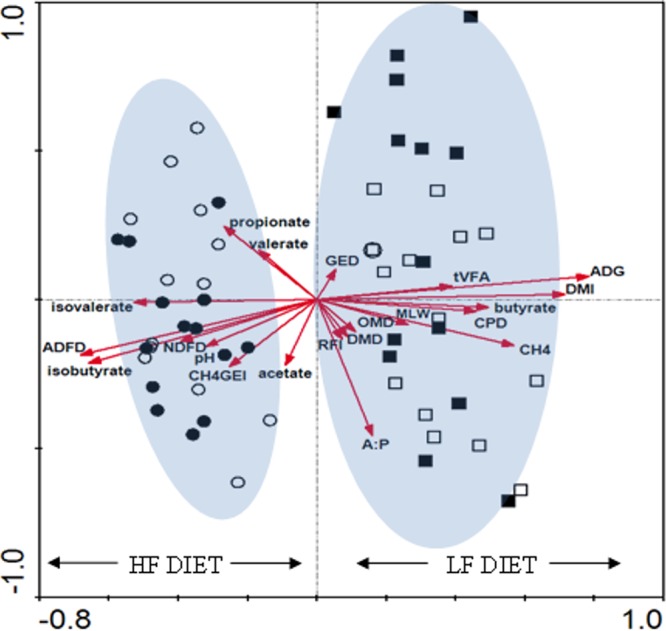
Canonical correspondence analysis (CCA) biplot of bacterial community diversity patterns generated by 16S rRNA gene DGGE banding patterns of 56 rumen fluid samples. Each symbol represents an individual DGGE profile (i.e., ○ = H-RFI HF diet, ● = L-RFI HF diet, □ = H-RFI LF diet, and ■ = L-RFI LF diet, respectively). On a CCA ordination plot (or biplot) the environmental variables are represented as arrows. In general, the direction of the arrows for individual environmental factors indicates an increasing concentration of that factor, while the angle between the arrows indicates the degree to which they are correlated. In addition, the magnitude of the arrows determines the importance of that variable on the bacterial profile. Environmental variables with long arrows are more strongly correlated with the ordination axes than short arrows and therefore have a greater influence on the pattern of variation.
Quantitative PCR (qPCR).
The genus- and species-specific primer sets used in the present study to amplify partial 16S rRNA/18S rRNA gene regions of the microbial genome were selected on the basis of a thorough review of the published literature (Table 1). All primer sets were commercially synthesized (Sigma-Aldrich Ireland, Ltd., Dublin, Ireland), and endpoint PCR was conducted to validate the specificity of the primers against target species. Extracted DNA from individual rumen fluid samples was diluted to a concentration of 100 ng μl−1, and 1 μl of diluted DNA was used as a template in all PCRs. All PCR amplifications were optimized and performed in 0.5-ml tubes in a DNA thermal cycler (Master Cycle; Eppendorf AG, Hamburg, Germany) using the following program: an initial denaturation step of 95°C for 2 min, followed by 30 cycles of 95°C for 30 s, 60°C for 30 s, and 72°C for 30 s, with a final elongation cycle of 72°C for 7 min. The PCR solution (Bioron, Ludwigshafen, Germany) was as previously described (21) with the addition 40 μl of molecular-grade H2O to give a final concentration of 50 μl. Aliquots (10 μl) of PCR products were analyzed by electrophoresis on a 2% agarose gel (wt/vol) to verify the presence and size of the amplicons. Negative controls without template DNA were included in parallel. Amplicons corresponding to specific species were subjected to sequence analysis to verify their specific identity (Macrogen, Seoul, Korea).
Table 1.
PCR primers used in this study for the quantification of specific rumen microbes by qPCR
| Target taxon | SSU rRNAa | Primer (5′–3′) |
||||
|---|---|---|---|---|---|---|
| Forward | Reverse | Efficiency (e) | Product size (bp) | Reference | ||
| 16S V3b | 16S | CCTACGGGAGGCAGCAG | ATTACCGCGGCTGCTGG | 2.00 | 194 | 40 |
| Entodinium | 18S | GAGCTAATACATGCTAAGGC | CCCTCACTACAATCGAGATTTAAGG | 2.08 | 317 | 47 |
| Fibrobacter succinogenes | 16S | GTTCGGAATTACTGGGCGTAAA | CGCCTGCCCCTGAACTATC | 1.99 | 121 | 10 |
| General anaerobic fungi | 18S | GAGGAAGTAAAAGTCGTAACAAGGTTTC | CAAATTCACAAAGGGTAGGATGATT | 2.02 | 120 | 10 |
| Prevotella spp. | 16S | GGTTCTGAGAGGAAGGTCCCC | TCCTGCACGCTACTTGGCTG | 2.08 | 121 | 48 |
| Prevotella brevis | 16S | GGTTTCCTTGAGTGTATTCGACGTC | CTTTCGCTTGGCCGCTG | 1.94 | 219 | 48 |
| Protozoa | 18S | GCTTTCGWTGGTAGTGTATT | CTTGCCCTCYAATCGTWCT | 1.97 | 223 | 49 |
| Ruminococcus albus | 16S | TGTTAACAGAGGGAAGCAAAGCA | TGCAGCCTACAATCCGAACTAA | 1.99 | 75 | 48 |
| Ruminococcus flavefaciens | 16S | CGAACGGAGATAATTTGAGTTTACTTAGG | CGGTCTCTGTATGTTATGAGGTATTACC | 2.03 | 132 | 10 |
SSU rRNA, small subunit rRNA gene targeted.
Primers used for qPCR normalization.
qPCR assays.
Relative qPCR assays were performed on an ABI 7500 Fast real-time PCR system using Fast SYBR master mix (Applied Biosystems, Warrington, United Kingdom). Optimization of assay conditions were performed for both primer and template DNA concentrations. To reduce PCR inhibition, total microbial DNA was diluted to 1 ng μl−1. A primer concentration of 10 μM was found to be optimal for each assay. All amplified qPCRs were carried out as previously described (32) utilizing Fast SYBR Green master mix.
Due to inconsistency in the concentration of PCR inhibitors in each rumen sample, it is essential to verify the efficiency of the reaction to ensure correct quantitation. Seven serial dilutions (10- or 5-fold) of total microbial DNA were amplified by real-time PCR as described above. Real-time PCR amplification efficiencies (e) were estimated for the primer sets listed in Table 1 from a linear regression of the threshold cycle (CT) for each dilution versus the log dilution using the formula: e = 10−1/slope or e = 5−1/slope (45), where “10” or “5” is the corresponding fold dilution. Efficiencies of the species-specific primers sets are presented in Table 1. These efficiencies ranged from 1.94 to 2.08, close to the optimum value of 2.0, which is representative of the doubling effect of the target sequence during the qPCR cycle. Only primers with PCR efficiencies between 90 and 110% were used in the present study.
While adhering to the MIQE guidelines (4), qPCR data were processed using the software package GenEx 5.2.1.3 (MultiD Analyses AB, Gothenburg, Sweden) as previously described (43). The relative abundance of the microbial populations was expressed as a proportion of total estimated rumen bacterial 16S rRNA gene as described previously (6) according to the following equation: relative quantification = 2−(CT-target − CT-total bacteria), where CT represents the threshold cycle. Changes in microbial communities due to an effect of RFI phenotype or dietary energy type were expressed relative to the total bacteria.
Statistical analysis.
All data were analyzed using SAS v9.1 2002 (SAS Institute, Cary, NC) as previously described (32). Spearman partial correlation analysis (PROC CORR; SAS) was conducted to examine associations among the physiological data, rumen fermentation variables, and measured relative microbial abundance values, with RFI and dietary treatment included as fixed effects in the analysis.
RESULTS
Analysis of rumen microbial community composition.
In all, four DGGE gels representing 56 samples were processed and included both low- and high-RFI groups and low- and high-dietary-forage groups. PCR-DGGE microbial community analysis revealed complex banding patterns and showed that each animal possessed an individual unique community structure (see Fig. S1 and S2 in the supplemental material). Across the samples (n = 56), the mean number of DGGE bands per sample was 27, with a range of 12 to 41 bands.
The microbial communities from each sample were first compared individually, to identify any differences in the microbial profiles of H- or L-RFI animals offered a HF (see Fig. S1A in the supplemental material) or LF (Fig. S1B in the supplemental material) diet. UPGMA analysis of the bacterial DGGE profiles of animals offered the HF diet (see Fig. S1A in the supplemental material) resulted in segregation of the majority of L-RFI and H-RFI profiles into two distinct clusters. This suggests that differences between the bacterial population in rumen fluid of H-RFI and L-RFI animals existed. Within the profiles corresponding to the HF diet (see Fig. S1A in the supplemental material), the mean number of bands for H-RFI heifers was 32, with a range of 19 to 41 bands. The mean number of bands for L-RFI heifers on the HF diet was 28, with a range of 21 to 36 bands. For the HF diet profiles, the banding patterns of the bacterial PCR DGGE profiles from the 28 rumen fluid samples tended to cluster according to RFI phenotype, with the majority of the H-RFI banding patterns grouping together and segregating from the majority of the L-RFI banding patterns. The overall average Dsc (%) for the DGGE profile of animals on the HF diet was 72%, while the average Dsc values for the L-RFI and H-RFI groups were 76 and 75%, respectively.
Segregation of bacterial profiles from the two phenotypes was not consistently observed when animals were offered the LF diet (see Fig. S1B in the supplemental material). In profiles from animals on the LF diet (see Fig. S1B in the supplemental material), the mean number of bands for inefficient heifers was 25, with a range of 14 to 34, whereas the efficient heifers had a mean number of 23 bands, ranging from 12 to 32. The clustering of the banding patterns for this diet was different from that for the HF diet in that no large segregated clusters between L-RFI and H-RFI were evident. However, some smaller clusters from either all H-RFI or L-RFI animals were observed (see Fig. S1B in the supplemental material). The average Dsc for the LF diet PCR-DGGE profile was 60%. The similarity of the profiles for the two phenotypes was 60% for the L-RFI and 62% for the H-RFI heifers, respectively.
All PCR-DGGE profiles were further compared concurrently across both diets irrespective of the RFI ranking to examine the effect of diet on bacterial populations in the rumen. For both diets, the complexity of the banding patterns from profiles was quite diverse, with the LF diet profiles exhibiting greater diversity than HF diet profiles. Visually, the banding patterns were different between the diets, with many bands observed in the LF diet profiles that were not found in the HF profiles (see Fig. S2 in the supplemental material). Some of these bands were found to have increased intensity compared to the rest of the bands in the LF diet profile. Band intensity is a semiquantitative method for inferring relative microbial abundance (60). Therefore, the intense bands detected in the LF diet may only be in high abundance due to the dietary substrate offered. In addition, there were more bands present in the lower section of the DGGE profile of animals on the LF diet compared to animals on the HF diet. The position of these lower bands in the section of the gel with a higher percentage of urea indicates that they are likely to be GC-rich. After UPGMA analysis, the overall bacterial communities separated into two major clusters based on diet (see Fig. S2 in the supplemental material). The banding profile for the HF grass silage diet tended to cluster together and segregate from the banding profile of the LF TMR diet, which also clustered together. The overall average level of similarity based on diet of this profile was 30%. The data also show that the rumen bacteria present when animals were maintained on the HF diet were more similar to each other (73% similarity) than when animals were maintained on a high-starch, predominantly concentrate-based diet (58% similarity).
In order to further characterize the effect of diet on rumen microbial community structure, MDS was used to produce a three-dimensional plot to show the relationship of bacterial diversity among both H-RFI and L-RFI animals across both diets. The MDS analysis showed that PCR-DGGE profiles from animals offered the HF diet (Fig. 1, green symbols) grouped closely together and that the PCR-DGGE profiles from animals offered the LF diet (Fig. 1, red symbols) grouped together, but less closely, compared to profiles from the HF diet.
Fig 1.

MDS plot of the PCR-DGGE profiles shown in Fig. S2 in the supplemental material. HF diet profiles are shown in green, and LF diet profiles are shown in red.
Influence of animal performance, rumen fermentation variables, and diet digestibility on rumen microbial community composition.
CCA was used to investigate whether the variation observed between different ruminal microbial profiles is associated with variation in either animal performance- or rumen fermentation-related variables. Figure 2 shows the CCA ordination plot of the DGGE profiles (n = 56) from high and low RFI animals across both diets in relation to a range of potential influencing factors, including animal performance (dry matter intake [DMI], RFI, ADG, and mid-test live weight [MLW]), rumen fermentation variables (methane [CH4], total volatile fatty acids [tVFA], acetate, propionate, butyrate, isobutyrate, valerate, isovalerate, acetate:propionate ratio [A:P], pH, and methane as a proportion of gross energy intake [CH4GEI]), and diet digestibility (dry matter digestibility [DMD], organic matter digestibility [OMD], crude protein digestibility [CPD], neutral detergent fiber digestibility [NDFD], acid detergent fiber digestibility [ADFD], and gross energy digestibility [GED]). A summary of the effect of RFI phenotype and diet on these measured variables is provided in Table S2 in the supplemental material. Axes 1 and 2 were found to explain 10.7 and 5.0% of the overall variance within the DGGE data, accounting for 15.7% of the total variance. The cumulative species-environment relationship for axes 1 and 2 was 32.8%. CCA also showed a high correlation value between species and environmental variables for the first (0.935) and second (0.839) axes, indicating a strong relationship between the environmental variables and the rumen community structure. Monte Carlo significance tests indicated that both axes explained a substantial proportion (P < 0.01) of the variation in the data. Canonical coefficients for the environmental factors revealed that most of these species-environment relationships could be explained by an individual factor with ADG (r = 0.7338) exhibiting maximum correlation with axis 1 and A:P ratio (r = −0.3832) with axis 2. In all, the four ordination axes explained 24% of the rumen bacterial variation in the 56 samples.
The CCA ordination plot presented in Fig. 2 suggests that two distinct bacterial groupings exist based on diet and the fact that a relationship exists between these microbial groups and specific environmental factors. This manifested as an association between host performance and bacterial profiles under an LF dietary régime, whereas under an HF diet a relationship between rumen fermentation and bacterial profiles existed. The position of the profile in relation to the factor arrows is indicative of how a particular profile is influenced and correlates to a given environmental factor. In general, animal performance- related factors (ADG, DMI, and MLW) were correlated with bacterial profiles when the LF diet was offered, whereas nearly all fermentation-related variables (namely, acetate, propionate, butyrate, isobutyrate, valerate, isovalerate, pH, and CH4GEI) were correlated to the profiles from the HF diet. The CCA model revealed that propionate, valerate, isovalerate, ADFD, NDFD, pH, CH4GEI, acetate, and isobutyrate appeared to be the dominant factors influencing the bacterial community structure while animals were offered the HF diet. In contrast, MLW, OMD, DMD, A:P, CH4, CPD, butyrate, tVFA, DMI, and ADG were the dominant factors affecting the bacterial profiles of animals offered the LF diet. Overall, increased propionate, valerate, ADFD, NDFD, pH, and CH4GEI were observed in animals on the HF diet. while greater OMD, DMD, A:P, CH4, CPD, butyrate, tVFA, DMI. and ADG were observed in animals on the LF diet.
CCA also revealed relationships among the animal physiological factors measured. For example, DMI was highly correlated with MLW (r = 0.77), CH4 (r = 0.76), and ADG (r = 0.72), DMD was highly correlated with OMD (r = 0.99), ADFD was correlated with isobutyrate (r = 0.80) and NDFD (r = 0.92), CH4 was correlated with MLW (r = 0.76), and propionate was positively correlated with valerate (r = 0.45) and negatively correlated with MLW (r = 0.60). Individual DGGE profiles also correlated to specific host physiological variables (Fig. 2). For example, two L-RFI HF diet profiles are located on the same trajectory as isovalerate and in the opposite direction of DMI, indicating that these profiles were negatively correlated with increasing DMI and positively correlated with increasing isovalerate. Similarly, one L-RFI LF diet profile was positively associated with CH4 and MLW, while two L-RFI HF diet profiles were negatively correlated with these variables.
Relative abundance of specific ruminant microbes according to host feed efficiency and/or diet.
Specific rumen microbial populations of Entodinium spp., protozoa, Fibrobacter succinogenes, Ruminococcus flavefaciens, Ruminococcus albus, Prevotella brevis, genus Prevotella, and general anaerobic fungi were targeted using relative qPCR analysis to examine whether these populations were associated with variance in feed efficiency and/or dietary energy type in cattle. The mean changes in rumen populations of these species are presented in Table 2. There was evidence for an RFI phenotype-diet interaction (P < 0.05) observed for the relative abundance of R. albus. This was manifested as a difference (P = 0.02) in R. albus between the RFI groups while offered the HF diet, with a 1.7-fold-greater relative abundance detected in the L-RFI phenotype compared to the H-RFI phenotype, but the abundance did not differ (P = 0.81) between groups offered the LF diet. No interactions were observed for the total relative abundance of any of the other microbial species measured (P > 0.05); however, although not statistically significant, Ruminococcus flavefaciens tended to be increased (1.5-fold, P = 0.08) in the H-RFI animals compared to the L-RFI animals on the HF diet. Neither animal phenotype nor diet type affected the total relative abundance of fungi (P > 0.05); however, there was a positive association between abundance of fungi and CH4 (r = 0.35; P < 0.05) (Table 3).
Table 2.
Effect of phenotypic RFI and diet on ruminal microbial populations
| Organism | Proportiona |
Significanceb |
|||||||
|---|---|---|---|---|---|---|---|---|---|
| RFI |
Diet |
||||||||
| H | L | SED | HF | LF | SED | RFI | Diet | RFI vs. diet | |
| Entodinium | 0.01 | 0.01 | 0.004 | 0.01 | 0.02 | 0.004 | NS | <0.0001 | NS |
| Fibrobacter succinogenes | 0.05 | 0.05 | 0.013 | 0.09 | 0.02 | 0.013 | NS | <0.0001 | NS |
| General anaerobic fungi | 0.02 | 0.01 | 0.012 | 0.01 | 0.02 | 0.012 | NS | NS | NS |
| Genus Prevotella | 0.49 | 0.42 | 0.065 | 0.19 | 0.72 | 0.065 | 0.05 | <0.0001 | NS |
| Prevotella brevis | 0.03 | 0.03 | 0.008 | 0.02 | 0.04 | 0.008 | NS | NS | NS |
| Protozoa | 0.01 | 0.01 | 0.003 | 0.01 | 0.02 | 0.003 | NS | NS | NS |
| Ruminococcus albus | 0.01 | 0.01 | 0.002 | 0.01 | 0.01 | 0.002 | NS | NS | 0.05 |
| Ruminococcus flavefaciens | 0.001 | 0.001 | 0.0001 | 0.001 | 0.001 | 0.0001 | NS | NS | NS |
Microbes were measured as a proportion of the total estimated rumen bacterial 16S rRNA gene [relative quantification = 2−(CT-target − CT-total bacteria)]. H, high; L, low; HF, high forage; LF, low forage; SED, standard error of the difference.
Significance values for transformed data were determined. Back-transformed means are presented for clarity. RFI, residual feed intake; NS, not significant (P > 0.05).
Table 3.
Association between physiological and rumen fermentation variables and relative microbial abundance in beef heifers divergent for residual feed intake
| Variablea | Association between physiological and rumen fermentation variables and relative microbial abundanceb |
|||||||
|---|---|---|---|---|---|---|---|---|
| Entodinium | F. succinogenes | Fungi | Prevotella spp. | P. brevis | Protozoa | R. albus | R. flavefaciens | |
| DMI | 0.30† | 0.16 | –0.01 | –0.03 | 0.25 | 0.08 | –0.11 | 0.09 |
| CH4 | –0.39* | –0.07 | 0.35* | –0.03 | –0.01 | –0.12 | –0.16 | 0.09 |
| MLW | 0.24 | 0.02 | 0.24 | –0.25 | 0.06 | 0.14 | –0.14 | 0.13 |
| tVFA | –0.19 | –0.10 | –0.03 | 0.28† | –0.02 | –0.01 | 0.01 | 0.01 |
| Acetate | 0.13 | 0.06 | 0.20 | –0.05 | –0.01 | 0.16 | 0.15 | 0.03 |
| Propionate | –0.20 | 0.01 | –0.26 | 0.16 | –0.06 | –0.34* | –0.05 | 0.05 |
| Isobutyrate | 0.01 | –0.22 | 0.10 | –0.38* | –0.17 | 0.42** | –0.02 | –0.19 |
| Butyrate | 0.03 | –0.20 | 0.20 | 0.05 | 0.16 | 0.43** | 0.20 | –0.21 |
| Isovalerate | 0.03 | –0.27† | –0.03 | –0.43** | –0.04 | 0.25 | –0.07 | –0.23 |
| Valerate | –0.16 | –0.13 | –0.13 | –0.18 | –0.15 | –0.07 | –0.30† | –0.13 |
| A:P | 0.20 | 0.01 | 0.25 | –0.16 | 0.06 | 0.32* | 0.09 | –0.03 |
| pH | 0.13 | 0.19 | –0.15 | 0.15 | 0.08 | 0.16 | –0.37* | 0.10 |
| CH4GEI | –0.50*** | –0.19 | 0.26 | –0.01 | –0.15 | –0.10 | –0.03 | 0.04 |
| DMD | –0.32* | –0.21 | 0.12 | –0.31† | –0.10 | 0.20 | –0.12 | –0.21 |
| OMD | –0.39* | –0.20 | 0.13 | –0.32* | –0.14 | 0.14 | –0.13 | –0.20 |
| CPD | –0.22 | –0.11 | –0.01 | –0.17 | 0.01 | 0.20 | 0.14 | –0.16 |
| NDFD | –0.22 | –0.02 | 0.02 | –0.23 | –0.20 | 0.08 | –0.32* | –0.01 |
| ADFD | –0.20 | –0.01 | –0.03 | –0.29† | –0.13 | 0.08 | –0.20 | –0.02 |
| GED | –0.29† | –0.19 | 0.20 | –0.28† | –0.09 | 0.22 | –0.07 | –0.18 |
DMI, dry matter intake; CH4, methane; MLW, mean live weight; tVFA, total volatile fatty acids; A:P, acetate/propionate ratio; CH4GEI, methane energy from gross energy intake; DMD, dry matter digestibility; OMD, organic matter digestibility; CPD, crude protein digestibility; NDFD, neutral detergent fiber digestibility; ADFD, acid detergent fiber digestibility; GED, gross energy digestibility.
The organisms tested included Fibrobacter succinogenes, Prevotella brevis, Ruminococcus albus, and Ruminococcus flavefaciens. Correlation coefficients indicated in boldface are different from zero (P < 0.10). †, P < 0.10; *, P < 0.05; **, P < 0.01; ***, P < 0.001.
An effect (P < 0.05) of RFI phenotype on the relative abundance of genus Prevotella was observed, with a greater relative abundance detected in the H-RFI animals compared to the L-RFI animals. The RFI phenotype had no effect on any of the other microbial populations measured, although a tendency (P = 0.08) was observed toward a positive effect of RFI on R. albus abundance, with a marginal increase (1.7-fold) in its abundance in the L-RFI animals compared to H-RFI animals. The abundance of R. albus was negatively associated with pH (r = −0.37, P < 0.05) and NDFD (r = −0.32, P < 0.05) (Table 3).
An effect of diet (P < 0.0001) on the relative abundance of both Entodinium species and Prevotella was observed, with a greater abundance of these microbes detected, while animals were offered the LF diet compared to the HF diet. In addition, the abundance of Entodinium was negatively correlated with CH4 (r = −0.39; P < 0.05), CH4 GEI (r = −0.50, P < 0.001), DMD (r = −0.32, P < 0.05), and OMD (r = −0.39, P < 0.05), whereas the abundance of Prevotella was negatively correlated with isobutyrate (r = −0.38, P < 0.05), isovalerate (r = −0.433, P < 0.01), and OMD (r = −0.32, P < 0.05) (Table 3). Dietary energy type was also found to affect (P < 0.0001) F. succinogenes abundance, with a reduction observed in this cellulolytic bacteria while animals were offered the LF diet. Although not statistically significant, there was a strong trend toward a greater relative abundances of Prevotella brevis (P = 0.07, 1.8-fold) and protozoa (P = 0.08, 1.7-fold) in cattle offered the LF diet, with diet type having no effect on the total relative abundances of R. albus and R. flavefaciens (P > 0.05), respectively. Protozoal abundance was positively associated with isobutyrate (r = 0.42; P < 0.01), butyrate (r = 0.43; P < 0.01), and A:P (r = 0.32; P < 0.05) (Table 3).
DISCUSSION
Host physiology in terms of age (36), genetics (20), and species (55) has been shown to influence rumen microbial consortia. Furthermore, physiological differences in methane output (22) and improved nutrient digestion (41) have been reported to be associated with variation in feed efficiency, thus supporting a role for improved rumen fermentation in increased feed efficiency. Indeed, a putative effect of feed efficiency phenotype on rumen microbial populations in beef cattle offered a LF diet has been reported (20). However, recent evidence suggests that while the ranking of cattle for feed efficiency across different phases of life remains relatively consistent when animals remain on the same diet (31), significant reranking can occur where diets are varied over time (14). Therefore, increased knowledge of the microbial consortia in the rumen of animals varying in feed efficiency and how these change in response to diet offered is necessary to enhance our understanding of the contribution of the rumen microbiota to host feed efficiency. First, our study used PCR-DGGE microbial community analysis to profile the overall bacterial population in the rumen of animals (n = 28) divergent in RFI phenotype initially offered an HF diet and then subsequently offered an LF diet. Second, qPCR analysis allowed quantification of selected prominent rumen microbes involved in processes, such as plant fiber degradation (17), starch metabolism (56), and degradation of proteins (28), which ultimately improve diet digestibility, metabolism, and nutrient utilization of the host.
The physiological processes contributing to variation in RFI have been reviewed (23), with interanimal differences in digestion proposed to contribute ca. 10%. In addition, significant differences in terms of energy metabolism have been reported in cattle divergent in RFI (22). In the rumen, organic chemicals such as C, H, and N contained in plants are metabolized by the microbes to produce VFA. The terminal products of communal anaerobic metabolism are principally methane and CO2. Since VFA production in the rumen by microbial fermentation represents the currency in terms of energy for host nutrition, divergence in microbial fermentation efficiency is likely to be associated with this trait. Consistent with the findings of a previous study (20), our own PCR-DGGE analysis revealed that RFI phenotype was associated with the overall bacterial profile in the rumen. Relative to feed effects, however, the effect of RFI phenotype was quite small. Community profile analysis showed that the effect of RFI phenotype was modified in accordance with the chemical composition of the diet offered, with RFI-mediated divergence in microbial profiles only observed while animals were offered an HF diet. This result was surprising given that the LF diet offered in our study was more similar, in terms of dietary energy content, to the finishing diet offered in the study of Guan et al. (20), than the HF diet, which consisted of grass silage only. However, diet is widely accepted to contribute to microbial diversity in the rumen. This, coupled with the recent evidence showing reranking of animals based on phenotypic RFI depending on the diet offered (14), suggests that while the rumen microbiota may play a role in host feed efficiency, this effect is most likely modulated by the type of diet offered.
In the present study we observed associations between host physiology and the rumen microbial community; however, these associations were influenced by the chemical composition of the diet. Diet type is widely accepted to contribute to production of specific rumen fermentation variables. Therefore, it is unsurprising that, relationships between host physiology and the rumen microbial community may be dependent on the chemical composition of the diet offered, as observed here. Indeed, a recent study reported that several rumen fermentation variables and feed efficiency traits were correlated with specific rumen bacteria, under a low-energy dietary regime (26).
In our study, the observation that numerous bacteria from the LF diet were negatively correlated with rumen pH, while many bacteria from the HF diet correlated with this fermentation variable, further supports the fact that rumen pH is a critical factor in influencing the types of bacteria present in the rumen, with some bacteria proliferating better at higher pH than others and vice versa (28). In the rumen, butyrate is primarily used as a source of energy for the host (39) and has been found to be increased significantly when the diet is changed from a low-concentrate, low-energy diet to a high-concentrate, high-energy diet (35). Our results further support this finding, since butyrate was the only individual VFA associated with bacterial profiles while animals were offered the LF diet. Due to the rumen fill value of the diet, voluntary DMI can be suppressed in animals offered forage-only-based diets compared to diets containing high concentrate levels (13). This can be ascribed to the slow rate of fermentation and onward passage of small particles due to the fibrous bulky nature of a forage based diet (18). It is generally accepted that rumen liquid and particle turnover rate are positively correlated with intake; therefore, we hypothesize that inevitability this would affect both the numbers and diversity of bacteria in the rumen. Thus, it was unsurprising that DMI was positively correlated to bacterial profiles of the LF diet and negatively correlated to that of the HF diet.
Using PCR-DGGE, previously identified rumen bacteria reported to be associated with RFI in cattle include Prevotella sp., and Ruminococcus gauvreauii strain CCRI 16110 (25, 26). In the present study, specific quantification of the Prevotella genus using qPCR showed an effect of both RFI and diet on this microbial group. The effect of diet on the rumen microbial consortia has been discussed in the previous section. However, the effect of RFI on rumen Prevotella suggests that a genetic difference may exist in terms of Prevotella abundance in the rumens of H- and L-RFI animals, since this effect was consistently observed irrespective of the diet offered. Rumen Prevotella spp. metabolize starch, protein, peptides, hemicellulose, and pectin. Fermentation products of rumen Prevotella spp. include acetate, succinate, and propionate. Therefore, greater abundance of this genus in H-RFI animals suggests a probable difference in the fermentation pathways of these dietary components between H- and L-RFI animals. Differences in the abilities of Prevotella spp. to degrade polysaccharides have been observed. Moreover, a recently published study identified significant differences between two Prevotella species after sequencing of excised PCR-DGGE bands (25). Therefore, further research is required to investigate this microbial group at the species or strain level to elucidate its association with host feed efficiency. Our qPCR results also showed that Prevotella spp. were the most abundant of the microbes analyzed here. This is consistent with the findings of Tajima et al. (50), who reported that Prevotella species were far more abundant than 11 other bacterial species examined in that study. We identified negative associations between Prevotella and isobutyrate, isovalerate, and OMD. In agreement with Hernandez-Sanabria et al. (26), who reported several associations of Prevotella sp. with various products of fermentation, given that rumen Prevotella are a predominant rumen microbial population, it is not surprising that these microbes were associated with rumen fermentation variables.
The predominant rumen fibrolytic bacteria are Fibrobacter succinogenes, Ruminococcus flavefaciens, and Ruminococcus albus (28), which possess a greater ability to digest cellulose than other cellulolytic species. In our study, we detected more R. albus in the L-RFI animals while maintained on the HF diet. Since R. albus is a major player in the degradation of cellulose to carbohydrates in the rumen, a higher abundance of this may contribute to greater feed digestibility and thus feed efficiency. Consistent with previous findings (37), we detected no difference in R. albus abundance when the diet was changed from HF to LF. This was not surprising given that the activity of these bacteria is inhibited when the diet is high in either starch or sugars (44). We also observed a negative association for R. albus with rumen pH and NDFD. Since R. albus has a narrow pH range (pH 6 to 7) for proliferation, any fluctuation in pH outside this range would undoubtedly affect the abundance of this cellulolytic bacterium. NDFD is used as a measure of the digestibility of the diet, with the majority of the energy available within the NDF fraction contained in cellulose (19). Therefore, the negative association between R. albus and NDFD is quite possibly due to a lesser requirement of these bacteria to break down the cellulose fraction of the diet when the digestibility of the diet is increased. The negative association between the abundances of R. flavefaciens and R. albus has been documented (5). Thus, the lower abundance of R. flavefaciens in L-RFI animals on the HF diet may be due to the higher abundance of R. albus observed in these animals. Inversely, the higher abundance of R. flavefaciens in the H-RFI phenotypes may have been due to some degree to the lower R. albus abundance. F. succinogenes has been denoted as one of the most widespread cellulolytic bacteria in the rumen, contributing ca. 5 to 6% of total prokaryotic 16S rRNA in the rumen contents of cattle (3). Given the fibrolytic activity of this species, we would have anticipated its abundance to be lower for animals on the LF diet due to the lower fiber content. Moreover, the observation in our study that F. succinogenes was the most abundant cellulolytic species is in agreement with previous findings in sheep (33). However, in contrast to the findings of earlier studies, our study showed that R. flavefaciens was the least abundant of the three cellulolytic species analyzed, although it should be noted that the abundances of both R. albus and R. flavfaciens were much lower than that of F. succinogenes. This difference is potentially due to the well-documented variation in host and environmental factors (diet, age of the animal, and geographical location) and also due to the different molecular techniques used.
Rumen fungi play an important role in fiber degradation within the rumen, since they can penetrate both the cuticle and the cell wall of lignified material (28). However, despite their central role in rumen fiber degradation, we failed to detect any difference in the abundance of fungi between RFI groups or dietary energy type. Rumen fungi can exist in two biological life stages which occupy distinct niches in total rumen contents. Free-living zoospores are found in the rumen fluid, while zoospores and sporangia may be found attached to solid particulate material. Since zoospores occur in relatively low numbers (103 to 104 per ml of rumen fluid), this may be the reason we detected no difference in fungal abundance. However, published data suggest that diet can have a significant effect on fungal populations, with high-fiber diets promoting larger fungal populations (1) than high-concentrate diets. Indeed, a recent review by McAllister (38) noted that the most dramatic change in rumen microbial profile is most likely evoked during transition from a forage to a concentrate diet, as fermentation parameters are switched from mainly cellulose and hemicellulose to starch and sugars.
There are discrepancies in the literature with regard to the importance of protozoa to the host ruminant. Some studies have reported that protozoa provide no obvious benefit to host nutrition (2), while others have reported that protozoa may reduce the availability of both dietary and microbial protein available to the animal (53). However, there is extensive evidence to suggest that protozoa are responsible for many functions in the rumen that are beneficial to the host (56). In the present study we observed a greater relative abundance of Entodinium spp. while animals were offered the LF diet compared to the HF diet. It has been shown that Entodinium thrives on increased concentrate diets due to the higher starch content (11). These protozoa engulf starch and attached amylolytic bacteria, thus regulating the rate of starch fermentation in the rumen. Moreover, total protozoa have been reported to be in greatest abundance when the concentrate proportion of the diet was increased in cattle (11). We observed a negative relationship between protozoa and propionate and positive relationships between protozoa and butyrate, isobutyrate, and A:P ratio. In accordance with these findings, the removal of rumen protozoa has been shown to result in increased propionate concentrations (27) and reduced A:P ratio. In addition, rumen protozoa produce butyrate as a metabolic end product. Although the negative association between Entodinium spp. and CH4 and CH4GEI was surprising given that these hydrogen producers are deemed to positively influence CH4 production, it has also been reported that methanogens take longer than other rumen microbes to adapt to changes in their environment (57). Furthermore, methanogenesis could potentially be altered due to fluctuations in the abundances of other H2-producing rumen microbes.
Although it could be argued that the digesta sampling procedure used in the present study was limited in that it predominantly facilitated the liquid fraction of the rumen to be sampled, other methods of sample collection which allow both solid and liquid fractions to be collected are not without limitation (15). Indeed, a recent study using deep sequencing of the rumen contents from both the solid and the liquid phase identified greater bacterial diversity in the liquid phase compared to the solid phase (9).
Conclusion.
Data from the present study show an association between both feed efficiency phenotype and diet with rumen microbial diversity in cattle. PCR-DGGE analysis revealed that the chemical composition of the diet can alter the bacterial diversity in the rumen with profiles generating distinct clusters according to diet. A link between the overall bacterial ecology of the rumen and host feed efficiency has recently been reported in animals offered one diet type (20). Our study shows that this link may not be consistent across diets since although the majority of animals on the HF diet clustered according to RFI phenotype, animals grouped separately irrespective of RFI ranking on the LF diet. This suggests that the effect of this diet was greater than individual interanimal variation. In this regard, our data are also consistent with recent studies highlighting the re-ranking of animals for RFI across different diet types (14). Furthermore, we have demonstrated that diet type may modulate the effect of RFI phenotype on the abundance of specific rumen microbes, and we report here, for the first time, a link between the abundance of rumen Prevotella and host feed efficiency. Rumen Prevotella are therefore candidates for further investigation at the species level to elucidate their association with host feed efficiency, which might provide insight as to whether these microbes could be manipulated to improve feed efficiency in beef cattle. In addition, the present study further emphasizes that many rumen microbial populations can either gain or loose dominance in the rumen depending on the composition of the diet. Future work using high-throughput next-generation sequencing will allow us to focus on microbe-microbe and microbe-host interactions and will further elucidate the biodiversity of rumen microflora and their potential role in host feed efficiency.
Supplementary Material
ACKNOWLEDGMENT
Funding for this research was provided under the National Development Plan through the Research Stimulus Fund, administered by the Department of Agriculture, Fisheries, and Food (Ireland; RSF 05 224).
Published ahead of print 4 May 2012
Supplemental material for this article may be found at http://aem.asm.org/.
REFERENCES
- 1.Bauchop T. 1979. Rumen anaerobic fungi of cattle and sheep. Appl. Environ. Microbiol. 38: 148–158 [DOI] [PMC free article] [PubMed] [Google Scholar]
- 2.Becker ER, Hsiung TS. 1929. The method by which ruminants acquire their fauna of infusoria and remarks concerning experiments on the host specificity of these protozoa. Proc. Natl. Acad. Sci. U. S. A. 15: 684–690 [DOI] [PMC free article] [PubMed] [Google Scholar]
- 3.Briesacher SL, et al. 1992. Use of DNA probes to monitor nutritional effects on ruminal prokaryotes and Fibrobacter succinogenes S85. J. Anim. Sci. 70: 289–295 [DOI] [PubMed] [Google Scholar]
- 4.Bustin SA, et al. 2009. The MIQE guidelines: minimum information for publication of quantitative real-time PCR experiments. Clin. Chem. 55: 611–622 [DOI] [PubMed] [Google Scholar]
- 5.Chen J, Stevenson DM, Weimer PJ. 2004. Albusin B, a bacteriocin from the ruminal bacterium Ruminococcus albus 7 that inhibits growth of Ruminococcus flavefaciens. Appl. Environ. Microbiol. 70: 3167–3170 [DOI] [PMC free article] [PubMed] [Google Scholar]
- 6.Chen XL, Wang JK, Wu YM, Liu JX. 2008. Effects of chemical treatments of rice straw on rumen fermentation characteristics, fibrolytic enzyme activities and populations of liquid- and solid-associated ruminal microbes in vitro. Anim. Feed Sci. Technol. 141: 1–14 [Google Scholar]
- 7.Crews DH. 2005. Genetics of efficient feed utilization and national cattle evaluation: a review. Genet. Mol. Res. 4: 152–165 [PubMed] [Google Scholar]
- 8.Dehority BA, Orpin CG. 1997. Development of, and natural fluctuations in, rumen microbial populations, p 196–245 In Hobson PN, Stewart CS. (ed), The rumen microbial ecosystem. Blackie Academic and Professional, London, United Kingdom [Google Scholar]
- 9.de Menezes AB, et al. 2011. Microbiome analysis of dairy cows fed pasture or total mixed ration diets. FEMS Microbiol. Ecol. 78: 256–265 [DOI] [PubMed] [Google Scholar]
- 10.Denman SE, McSweeney CS. 2006. Development of a real-time PCR assay for monitoring anaerobic fungal and cellulolytic bacterial populations within the rumen. FEMS Microbiol. Ecol. 58: 572–582 [DOI] [PubMed] [Google Scholar]
- 11.Dennis SM, Arambel MJ, Bartley EE, Dayton AD. 1983. Effect of energy concentration and source of nitrogen on numbers and types of rumen protozoa. J. Dairy Sci. 66: 1248–1254 [DOI] [PubMed] [Google Scholar]
- 12.Dice LR. 1945. Measures of the amount of ecologic association between species. Ecology 26: 297–302 [Google Scholar]
- 13.Dulphy JP, Faverdin P, Jarrige R. 1989. Feed intake: the fill unit systems, p 61–71 In Jarrige R. (ed), Ruminant nutrition: recommended allowances and feed tables. INRA, Paris, France [Google Scholar]
- 14.Durunna ON, et al. 2011. Feed efficiency differences and reranking in beef steers fed grower and finisher diets. J. Anim. Sci. 89: 158–167 [DOI] [PubMed] [Google Scholar]
- 15.Egan A, Makkar H, McSweeney C. 2005. Experimental designs for rumen microbiology, p 3–19 In Harinder PSM, McSweeney C. (ed), Methods in gut microbial ecology for ruminants. Springer, Amsterdam, Netherlands [Google Scholar]
- 16.El-Meccawi S, Kam M, Brosh A, Degen AA. 2009. Energy intake, heat production and energy and nitrogen balances of sheep and goats fed wheat straw as a sole diet. Livestock Sci. 125: 88–91 [Google Scholar]
- 17.Flint HJ, Bayer EA, Rincon MT, Lamed R, White BA. 2008. Polysaccharide utilization by gut bacteria: potential for new insights from genomic analysis. Nat. Rev. Microbiol. 6: 121–131 [DOI] [PubMed] [Google Scholar]
- 18.Forbes JM. 2005. Voluntary feed intake and diet selection, p 607–625 In Dijkstra J, Forbes JM, France J. (ed), Quantitative aspects of ruminant digestion and metabolism. CAB International, University Press, Cambridge, United Kingdom [Google Scholar]
- 19.Goeser JP. 2008. Improvement of rumen in vitro NDF digestibility techniques and data analysis. University of Wisconsin, Madison, WI [Google Scholar]
- 20.Guan LL, Nkrumah JD, Basarab JA, Moore SS. 2008. Linkage of microbial ecology to phenotype: correlation of rumen microbial ecology to cattle's feed efficiency. FEMS Microbiol. Lett. 288: 85–91 [DOI] [PubMed] [Google Scholar]
- 21.Hamill RM, Noor MAF, Watson ET, Ritchie MG. 2006. New microsatellite loci for the European bushcricket, Ephippiger ephippiger (Orthoptera: Tettigoniidae). Mol. Ecol. Notes 6: 340–342 [Google Scholar]
- 22.Hegarty RS, Goopy JP, Herd RM, McCorkell B. 2007. Cattle selected for lower residual feed intake have reduced daily methane production. J. Anim. Sci. 85: 1479–1486 [DOI] [PubMed] [Google Scholar]
- 23.Herd RM, Arthur PF. 2009. Physiological basis for residual feed intake. J. Anim. Sci. 87: E64–E71 [DOI] [PubMed] [Google Scholar]
- 24.Herd RM, Bishop SC. 2000. Genetic variation in residual feed intake and its association with other production traits in British Hereford cattle. Livestock Prod. Sci. 63: 111–119 [Google Scholar]
- 25.Hernandez-Sanabria E, et al. 2012. Impact of feed efficiency and diet on adaptive variations in the bacterial community in the rumen fluid of cattle. Appl. Environ. Microbiol. 78: 1203–1214 [DOI] [PMC free article] [PubMed] [Google Scholar]
- 26.Hernandez-Sanabria E, et al. 2010. Correlation of particular bacterial PCR-denaturing gradient gel electrophoresis patterns with bovine ruminal fermentation parameters and feed efficiency traits. Appl. Environ. Microbiol. 76: 6338–6350 [DOI] [PMC free article] [PubMed] [Google Scholar]
- 27.Hess HD, et al. 2003. Saponin-rich tropical fruits affect fermentation and methanogenesis in faunated and defaunated rumen fluid. Anim. Feed Sci. Technol. 109: 79–94 [Google Scholar]
- 28.Hobson PN, Stewart CS. (ed). 1997. The rumen microbial ecosystem. Blackie Academic and Professional, London, England [Google Scholar]
- 29.Karnati SKR, Yu Z, Firkins JL. 2009. Investigating unsaturated fat, monensin, or bromoethanesulfonate in continuous cultures retaining ruminal protozoa. II. Interaction of treatment and presence of protozoa on prokaryotic communities. J. Dairy Sci. 92: 3861–3873 [DOI] [PubMed] [Google Scholar]
- 30.Kelly AK, et al. 2010. Effect of divergence in residual feed intake on feeding behavior, blood metabolic variables, and body composition traits in growing beef heifers. J. Anim. Sci. 88: 109–123 [DOI] [PubMed] [Google Scholar]
- 31.Kelly AK, et al. 2010. Repeatability of feed efficiency, carcass ultrasound, feeding behavior, and blood metabolic variables in finishing heifers divergently selected for residual feed intake. J. Anim. Sci. 88: 3214–3225 [DOI] [PubMed] [Google Scholar]
- 32.Kelly AK, et al. 2011. mRNA expression of genes regulating oxidative phosphorylation in the muscle of beef cattle divergently ranked on residual feed intake. Physiol. Genomics 43: 12–23 [DOI] [PubMed] [Google Scholar]
- 33.Koike S, Yabuki H, Kobayashi Y. 2007. Validation and application of real-time polymerase chain reaction assays for representative rumen bacteria. Anim. Sci. J. 78: 135–141 [Google Scholar]
- 34.Lancaster PA, Carstens GE, Ribeiro FRB, Tedeschi LO, Crews DH. 2009. Characterization of feed efficiency traits and relationships with feeding behavior and ultrasound carcass traits in growing bulls. J. Anim. Sci. 87: 1528–1539 [DOI] [PubMed] [Google Scholar]
- 35.Leedle JA, Coe ML, Frey RA. 1995. Evaluation of health and ruminal variables during adaptation to grain-based diets in beef cattle. Am. J. Vet. Res. 56: 885–892 [PubMed] [Google Scholar]
- 36.Li RW, Connor EE, Li C, Baldwin VIRL, Sparks ME. 2011. Characterization of the rumen microbiota of pre-ruminant calves using metagenomic tools. Environ. Microbiol. 14: 129–139 [DOI] [PubMed] [Google Scholar]
- 37.Mackie RI, Gilchrist FMC, Roberts AM, Hannah PE, Schwartz HM. 1978. Microbiological and chemical changes in the rumen during the stepwise adaptation of sheep to high concentrate diets. J. Agric. Sci. 90: 241–254 [Google Scholar]
- 38.McAllister TA. 2009. Learning more about rumen bugs: genetic and environmental factors affecting rumen bugs. Southern Alberta Beef Review; Government of Alberta Agriculture and Rural Development, Edmonton, Alberta, Canada [Google Scholar]
- 39.McDonald P, Edwards RA, Greenhalgh JFD, Morgan CA. 2002. Animal nutrition, 6th ed Longman, Harlow, United Kingdom [Google Scholar]
- 40.Muyzer G, de Waal EC, Uitterlinden AG. 1993. Profiling of complex microbial populations by denaturing gradient gel electrophoresis analysis of polymerase chain reaction-amplified genes coding for 16S rRNA. Appl. Environ. Microbiol. 59: 695–700 [DOI] [PMC free article] [PubMed] [Google Scholar]
- 41.Nkrumah JD, et al. 2006. Relationships of feedlot feed efficiency, performance, and feeding behavior with metabolic rate, methane production, and energy partitioning in beef cattle. J. Anim. Sci. 84: 145–153 [DOI] [PubMed] [Google Scholar]
- 42. NRC 2000. Nutrient requirements of beef cattle, 7th ed National Academy Press, Washington, DC [Google Scholar]
- 43.O'Loughlin A, McGee M, Waters S, Doyle S, Earley B. 2011. Examination of the bovine leukocyte environment using immunogenetic biomarkers to assess immunocompetence following exposure to weaning stress. BMC Vet. Res. 7: 45. [DOI] [PMC free article] [PubMed] [Google Scholar]
- 44.Orskov ER. 1982. Protein nutrition in ruminants. Academic Press, New York, NY [Google Scholar]
- 45.Pfaffl MW. 2001. A new mathematical model for relative quantification in real-time RT-PCR. Nucleic Acids Res. 29: 2002–2007 [DOI] [PMC free article] [PubMed] [Google Scholar]
- 46.Popko DA, Han S-K, Lanoil B, Walton WE. 2006. Molecular ecological analysis of planktonic bacterial communities in constructed wetlands invaded by Culex (Diptera: Culicidae) mosquitoes. J. Med. Entomol. 43: 1153–1163 [DOI] [PubMed] [Google Scholar]
- 47.Skillman LC, Toovey AF, Williams AJ, Wright A-DG. 2006. Development and validation of a real-time PCR method to quantify rumen protozoa and examination of variability between Entodinium populations in sheep offered a hay-based diet. Appl. Environ. Microbiol. 72: 200–206 [DOI] [PMC free article] [PubMed] [Google Scholar]
- 48.Stevenson D, Weimer P. 2007. Dominance of Prevotella and low abundance of classical ruminal bacterial species in the bovine rumen revealed by relative quantification real-time PCR. Appl. Microbiol. Biotechnol. 75: 165–174 [DOI] [PubMed] [Google Scholar]
- 49.Sylvester JT, Karnati SKR, Yu Z, Morrison M, Firkins JL. 2004. Development of an assay to quantify rumen ciliate protozoal biomass in cows using real-time PCR. J. Nutr. 134: 3378–3384 [DOI] [PubMed] [Google Scholar]
- 50.Tajima K, et al. 2001. Diet-dependent shifts in the bacterial population of the rumen revealed with real-time PCR. Appl. Environ. Microbiol. 67: 2766–2774 [DOI] [PMC free article] [PubMed] [Google Scholar]
- 51.ter Braak CJF. 1986. Canonical correspondence analysis: a new eigenvector technique for multivariate direct gradient analysis. Ecology 67: 1167–1179 [Google Scholar]
- 52.ter Braak CJF, Milauer P. 1998. CANOCO reference manual and user's guide to Canoco for Windows: software for canonical community ordination (version 4). Microcomputer Power, Ithaca, NY [Google Scholar]
- 53.Ushida K, Jouany JP, Thivend P. 1986. Role of rumen protozoa in nitrogen digestion in sheep given two isonitrogenous diets. Br. J. Nutr. 56: 407–419 [DOI] [PubMed] [Google Scholar]
- 54.Walter J, et al. 2000. Detection and identification of gastrointestinal Lactobacillus species by using denaturing gradient gel electrophoresis and species-specific PCR primers. Appl. Environ. Microbiol. 66: 297–303 [DOI] [PMC free article] [PubMed] [Google Scholar]
- 55.Wanapat M, et al. 2000. A comparative study on the rumen microbial population of cattle and swamp buffalo raised under traditional village conditions in the northeast of Thailand. Asian-Australasian J. Anim. Sci. 13: 918–921 [Google Scholar]
- 56.Williams AG, Coleman GS. 1997. The rumen protozoa, p 73–120 In Hobson PN, Stewart CS. (ed), The rumen microbial ecosystem, 2nd ed. Elsevier Applied Science, New York, NY [Google Scholar]
- 57.Williams YJ, et al. 2009. A vaccine against rumen methanogens can alter the composition of archaeal populations. Appl. Environ. Microbiol. 75: 1860–1866 [DOI] [PMC free article] [PubMed] [Google Scholar]
- 58.Yu Z, Morrison M. 2004. Comparisons of different hypervariable regions of rrs genes for use in fingerprinting of microbial communities by PCR-denaturing gradient gel electrophoresis. Appl. Environ. Microbiol. 70: 4800–4806 [DOI] [PMC free article] [PubMed] [Google Scholar]
- 59.Yu Z, Morrison M. 2004. Improved extraction of PCR-quality community DNA from digesta and fecal samples. Biotechniques 36: 808–812 [DOI] [PubMed] [Google Scholar]
- 60.Zhang T, Fang HHP. 2000. Digitization of DGGE (denaturing gradient gel electrophoresis) profile and cluster analysis of microbial communities. Biotechnol. Lett. 22: 399–405 [Google Scholar]
Associated Data
This section collects any data citations, data availability statements, or supplementary materials included in this article.