

Abstract
RAS mutations are highly relevant for progression and therapy response of human tumours, but the genetic network that ultimately executes the oncogenic effects is poorly understood. Here, we used a reverse-engineering approach in an ovarian cancer model to reconstruct KRAS oncogene-dependent cytoplasmic and transcriptional networks from perturbation experiments based on gene silencing and pathway inhibitor treatments. We measured mRNA and protein levels in manipulated cells by microarray, RT–PCR and western blot analysis, respectively. The reconstructed model revealed complex interactions among the transcriptional and cytoplasmic components, some of which were confirmed by double pertubation experiments. Interestingly, the transcription factors decomposed into two hierarchically arranged groups. To validate the model predictions, we analysed growth parameters and transcriptional deregulation in the KRAS-transformed epithelial cells. As predicted by the model, we found two functional groups among the selected transcription factors. The experiments thus confirmed the predicted hierarchical transcription factor regulation and showed that the hierarchy manifests itself in downstream gene expression patterns and phenotype.
Keywords: cancer systems biology, modular response analysis, oncogenes, ovarian carcinoma model, signal transduction
Introduction
RAS genes are frequently mutated in human tumours and have a crucial role in the development of cancer (Tchernitsa et al, 2004; Karnoub and Weinberg, 2008). Although efficient therapeutic approaches for targeting RAS proteins directly do not exist to-date, signalling kinase pathways downstream of RAS have been recognized as vulnerable elements to block cellular transformation. However, the clinical benefit of targeted therapies is limited by acquired tumour cell resistance to signalling kinase inhibition (Corcoran et al, 2011; Fritsche-Guenther et al, 2011). To improve inhibitor action, a better understanding of the dynamics of signalling, pathway cross-talk, feedback regulation and of the mechanisms of target gene deregulation are essential. Chronically activated RAS pathways trigger transcriptional upregulation of genes capable of promoting growth, invasion and metastasis. RAS pathway-related gene signatures also comprise downregulated target genes that control anti-proliferative, anti-invasive and anti-angiogenic processes (Zuber et al, 2000; Brem et al, 2001; Tchernitsa et al, 2004). The deregulation of the genetic program provides a unique opportunity to elucidate the topology of the underlying transcription factor network. Currently it is not known whether few transcriptional master regulators (‘hubs’) drive the entire genetic program mediating cellular transformation or whether multiple transcriptional regulators act jointly in RAS pathway-controlled gene expression. A redundant network topology is expected to render the network robustly towards genetic or pharmacological perturbation.
The reconstruction of complex regulatory network topologies from high-throughput data poses a major challenge in systems biology. Genome-wide RNAi screens have been employed to identify key regulators of biological processes (Berns et al, 2004; Paddison et al, 2004). However, loss-of-function approaches with a single biological read-out do not allow detailed conclusions regarding the underlying regulatory network structure, since the dynamics of network components cannot be determined explicitly. Microarray analysis permits the simultaneous assessment of many network elements. However, the derivation of the network topology from microarray data is not straight-forward, as direct regulatory interactions are not measured by them. Typically, reverse-engineering algorithms are required to deduce the structure of gene-regulatory networks from perturbation data. Several different reverse-engineering approaches have been proposed including those based on metabolic control analysis (Kholodenko et al, 2002), Bayesian statistics, information theory (Margolin et al, 2006), ordinary differential equation (ODE) models (Madar et al, 2009), discovering algebraic relations (Schmidt and Lipson, 2009) and neural network type ODE models (Busch et al, 2009). Applications of reverse-engineering approaches that integrate theoretical prediction of network structures and experimental validation comprise the SOS pathway in E. coli (Gardner et al, 2003), nerve growth factor-induced differentiation of PC12 phaeochromocytoma cells (Santos et al, 2007), hepatocyte growth factor-induced migration (Busch et al, 2008) and the analysis of synthetic gene-regulatory networks (Cantone et al, 2009).
Here, we set out to reverse engineer a KRAS oncoprotein-regulated transcriptional network by systematic experimental perturbation and by employing an algorithm that is based on the framework called modular response analysis (MRA). This framework involves an analysis of the steady-state response of a dynamic system upon perturbation (Kholodenko et al, 2002). MRA assumes that the system can sufficiently be well explained when it is linearized. Since its introduction by Kholodenko and co-workers, MRA has been successfully applied to uncover the regulatory interactions in signal transduction pathways (Kholodenko et al, 2002; Gardner et al, 2003; Santos et al, 2007). Individual nodes in a network are treated as modules, which activate or inhibit each other (all possible interactions are allowed), but do not communicate by mass flow. The network interaction strengths are determined by fitting the perturbation-response behaviour of the model to the experimentally obtained perturbation-response data. The perturbation-response behaviour of the model is determined by so-called local response coefficients, which quantify how strongly an activity change of one node directly influences the others. Thus, the fitted local response coefficients represent the network topology most likely underlying the perturbation-response data.
A gene signature related to KRAS oncogene-mediated transformation in an ovarian carcinoma model served as the basis for determining the perturbation response at the experimental level. The signature was obtained by comparing the transcriptional programs of pre-neoplastic rat ovarian surface epithelial (ROSE) cells and a KRAS oncogene-transformed derivative (Tchernitsa et al, 2004). The cells exhibit enhanced activity of the Raf/Mek/Erk pathway, epithelial–mesenchymal transition (EMT), anchorage independence and tumorigenicity (Adams and Auersperg, 1981; Tchernitsa et al, 2004). Of 51 transcription factors that were upregulated upon KRAS transformation of ROSE cells, 7 were chosen for detailed network reconstruction. Two of these transcription factors, Fos-like antigen 1 (Fosl1, Fra-1) and high mobility group AT hook 2 (Hmga2), are well known to contribute to proliferation and cellular transformation (for review, see Verde et al, 2007; Cleynen and Van de Ven, 2008). To be able to investigate the network in further detail, we decided to investigate the impact of four additional transcription factors which showed strong upregulation in KRAS-transformed cells, and met critical functional criteria such as high expression as a consequence of reactivation during inflammatory responses, tissue damage and tumorigenesis as well as repression in differentiated cells. The homologue of Drosophila orthodenticle 1 (Otx1) (Kanzler et al, 1994; de et al, 2006), Kruppel-like factor 6 (Klf6) (Narla et al, 2005; DiFeo et al, 2006), the transcriptional repressor growth factor independent 1 (Gfi1) (Grimes et al, 1996; Dwivedi et al, 2007) and the proto-oncogene JunB (Battista et al, 1998; van Dam and Castellazzi, 2001) fulfilled the criteria. Additionally, we included RelA, a component of the NF-κB transcription factor complex, in the network analysis. The NF-κB pathway is known to contribute to RAS oncogene-mediated transformation (Finco et al, 1997; Karin et al, 2002; Lerebours et al, 2008). The RelA expression level is controlled by post-transcriptional mechanisms (Madrid et al, 2000).
In this work, we characterized functional interactions among Fosl1, Hmga2, Otx1, Klf6, Gfi1, JunB and RelA by systematically perturbing and measuring their expression levels. Reverse engineering by MRA provided experimentally testable predictions concerning molecular interactions in the network, some of which were verified by double perturbation experiments. The hierarchical transcription factor organization predicted by the model was reflected at the level of phenotypic responses to transcription factor silencing, suggesting that cellular decision making can be understood at the level of transcriptional regulation.
Results
Differential expression of transcription factors in KRAS-transformed ROSE cells
We first confirmed the overexpression of the selected transcription factors in RAS-ROSE cells by RT–PCR and western blotting, respectively (Figure 1). All transcription factors, except RelA, showed a coordinated mRNA and protein upregulation in RAS-ROSE cells. The upregulation of RelA solely occurred at the protein level. To investigate the impact of upstream signalling pathways on transcription factor expression, we treated RAS-ROSE cells with the Mek inhibitor U0126 and the PI3K inhibitor LY 294002, respectively. The mRNA and protein expression levels of Fosl1, Hmga2, Otx1, Klf6, Gfi1 and JunB were strongly dependent on Raf/Mek/Erk signalling as suggested by the previous gene profiling analysis (Tchernitsa et al, 2004). RelA expression was insensitive to MAPK signalling, but the protein level was strongly downregulated upon PI-3-K inhibition (Figure 1B). Only few other species showed regulation by PI3K signalling, including Hmga2 protein as well as Otx1 mRNA and protein.
Figure 1.
Selection of the network components. (A) Non-transformed rat ovarian surface epithelial (ROSE) cells and their KRAS-transformed derivatives (RAS-ROSE) were subjected to gene expression analysis by interrogating Affymetrix microarrays and customized RAS target arrays (Tchernitsa et al, 2005). Overall, 51 transcription factors were found to be upregulated in KRAS-transformed cells, of which 7 were chosen for further analysis (see text for details). (B) Expression of selected transcription factors in normal ROSE cells and their KRAS-transformed derivatives was investigated by RT–PCR and western blot. Pathway-specific expression regulation was assessed by treatment with the Mek1/2 inhibitor U0126 and the PI3K inhibitor LY 294002. Loading was controlled using Gapdh primers for RT–PCR and Histone H3 antibody for western blot. Source data is available for this figure in the Supplementary Information.

A complex transcriptional network revealed by RNAi-mediated perturbations
To investigate their functional relevance and impact on the transcriptome, we transiently silenced the selected transcription factors by using two independent specific siRNAs targeting each factor. The efficiency of knockdown at the protein level ranged from 77 to 99% as calculated by densitometric analysis and normalized to control levels of cell transfected with scrambled siRNA (Supplementary Figure 1). While KRAS-transformed ROSE cells were characterized by spindle-shaped morphology, silencing of each of the transcription factors resulted in a partial morphological reversion, as indicated by length reduction of lateral processes and increased intercellular adhesion contacts (Figure 2A). A quantitative analysis of cell lengths revealed that the effects of each transcription factor knockdown were similar and highly significant (Figure 2A and B; P?0.001). In order to analyse the involvement of selected transcription factors in the deregulation of the genetic program in RAS-ROSE cells, we interrogated genome-wide microarrays. KRAS oncogene-mediated transformation of ROSE cells was associated with the deregulation of 1826 genes represented by 7561 probe sets on Affymetrix Rat Gene 1.0 ST arrays. In all, 990 of these genes were downregulated, while 836 genes were upregulated relative to non-transformed control. Probe sets showed opposing regulation for seven genes. Knockdown of each transcription factor partially reverted target deregulation by KRAS signalling (Figure 2C). Overall, 5971 of 7561 (80%, corresponding to 1562 of 1826 genes) RAS-responsive probe sets indicated regulation by any of the 7 selected transcription factors. The number of probe sets indicating target gene upregulation by any of the knockdowns (3247) was comparable to number of probe sets indicating downregulation (3054), while only few probe sets indicated inconsistent regulation under conditions of transcription factor silencing. Each of the transcription factors regulated 43% of the RAS responsive probe sets on average, ranging from 35% for Klf6 to 52% for Hmga2, while transfection with a scrambled siRNA affected only 4%. Thus, the patterns of target regulation overlapped substantially. Only 19% of probe sets for transcription factor targets were specifically regulated by silencing a single factor, while the remainder was controlled by at least two of the factors (Figure 2D). Surprisingly, we observed that 1081 (18%) of the transcription factor target probe sets were always regulated regardless of the silenced transcription factor (Figure 2D). Notably, the mode of deregulation was coherent over all seven knockdown experiments as indicated by the hybridization pattern to 1077 out of 1081 probe sets. Thus, the corresponding target genes were consistently upregulated or downregulated by all transcription factor perturbations. We concluded that the transcriptional alterations mediated by the RAS pathway are controlled by a densely connected transcription factor network with Fosl1, Hmga2, Otx1, Klf6, Gfi1, JunB and RelA positioned at critical nodes, rather than by a single transcriptional master regulator. As expression profiling based on the interrogation of commercially available rat microarrays continues to be hampered by suboptimal annotation of the rat genome, we also hybridized customized microarrays representing 329 independently validated RAS pathway-target genes (Tchernitsa et al, 2005). We found that 116 out of 209 knockdown-sensitive target genes were controlled by at least two transcription factor knockdowns as well (Supplementary Figure 2). This finding supports the notion that the transcriptome of KRAS-transformed cells is controlled by a densely connected transcription factor network.
Figure 2.
Effects of transcription factor silencing on cell morphology and the transcriptional profile of RAS-ROSE cells. (A) Morphological characteristics of normal ROSE versus RAS-ROSE cells 48 h after treatment with scrambled siRNA-duplex (Sc), transfection reagents only (Mock) and two independent specific siRNAs targeting Fosl1, Hmga2, Klf6, JunB, Otx1, Gfi1 and RelA, respectively. Phase contrast, magnification: 450-fold. (B) Quantification of lateral processes of RAS-ROSE and transfectants, in which transcription factor expression was silenced by siRNA. (C) Effects of transcription factor silencing on the transcriptome of RAS-ROSE cells. Each transcription factor controlled expression of hundreds of regulated genes as indicated by hybridization of target RNA to probe sets on the microarray (cutoff for significant upregulation or downregulation: ±0.7 on log2 scale). Total number of probe sets indicating expression alterations as a response to transcription factor silencing: 5971 (3247 and 3054 upregulated and downregulated by knockdown, respectively; few probe sets indicated inconsistent target regulation among knockdowns); average number of probe sets indicating response to silencing of an individual transcription factor: 3300; number of probe sets indicating response to scrambled (sc) siRNA: 319. (D) Specificity of transcription factor silencing as determined by profiling of target genes. Transcription factor knockdowns induced broadly overlapping gene expression responses. Each probe set indicating expression alterations was classified according to the exact number of transcription factor knockdowns (1–7) affecting gene expression. Cutoff used for significant deregulation as in C. In total, expression levels of genes represented by 4832 (81%) probe sets were altered by two or more transcription factor knockdowns, while genes represented by only 1139 probe sets (19%) indicated specifically responded to one of the knockdowns. Source data is available for this figure in the Supplementary Information.

The results of siRNA-mediated silencing (Figure 2) revealed an important role for each of the transcription factors in mediating downstream transcriptional responses, but did not allow any conclusions about the topology of the regulatory network. We sought to gain further insights into the functional interactions between the transcription factors and to identify direct partners of each factor. We therefore systematically analysed how transcription factor perturbations affect the expression and activity of other network components. After knockdown of each single transcription factor we monitored the resulting expression changes of all other transcription factors by microarray, RT–PCR and western blot analysis (Supplementary Figures 1 and 3). Each transcription factor knockdown enhanced and/or reduced the mRNA and protein levels of the remaining factors, as visualized in the perturbation-response matrix shown in Figure 3A. This result lends further support to our conclusion that the transcription factors are organized in a densely connected network. We also included the Raf/MAPK and PI3K signalling pathways in the perturbation screen, by measuring the levels of phosphorylated Erk and Akt and perturbing these with Mek or PI3K inhibitors, respectively. Surprisingly, silencing of transcription factors profoundly affected the activity of signalling proteins (Figure 3A; Supplementary Figure 4). This finding indicated that upstream signalling is regulated by transcriptional feedback. We expected that the perturbation-response patterns of transcription factor network should impinge on the genome-wide gene expression profiles. The 1067 probe sets representing mRNAs coherently upregulated or downregulated by all 7 transcription factor knockdowns may, for example, be direct transcriptional targets of Fosl1, since the protein levels of this factor coherently respond to all knockdowns as well (Figure 3A). By filtering genes (probe sets) using expression cutoffs, we found that most transcription factor perturbation-response patterns were preserved at the level of target gene expression (Figure 3B and C; Supplementary Table 1). Out of 5971 probe sets that responded significantly to any of the transcription factor perturbations, we found 947 probe sets (corresponding to 451 genes) whose perturbation response resembled the patterns of the transcription factor protein measurements (Figure 3B). These corresponding genes are likely to be directly induced or repressed by the respective transcription factor. At the mRNA level, 532 probe sets (corresponding to 310 genes) indicated target perturbation-response patterns closely matching those of the mRNAs of any of the seven transcription factors (Figure 3C). The transcription of these genes is likely to be controlled in the same way as the perturbed transcription factors. For the majority of genes (58%), the perturbation-response patterns of multiple probe sets representing the same gene were identical. We conclude that the behaviour of many target genes is consistent with a minimal model, in which each target gene is controlled by a single transcription factor. The remaining target genes did not follow transcription factor patterns, at least according to the criteria applied here. We speculate that these genes may be controlled in a combinatorial manner or that they may require input from transcription factors not considered in the perturbation-response analysis. Given that transcription factor patterns impinge on downstream gene expression, we sought to gain insights into how the transcription factors are wired among each other and how they are coupled to upstream signalling pathways. Therefore, we employed a reverse-engineering approach to reduce the complexity of perturbation data and to deduce functional interactions between nuclear and cytoplasmic network components.
Figure 3.
Perturbation experiments. (A) Summary of the perturbation-response data of the signalling and gene-regulatory networks as determined by microarray, RT–PCR and western blot analysis. Rows in graph correspond to mRNAs and proteins analysed, columns correspond to experimental perturbations (overexpression of mutant RAS, inhibition of signalling kinases by small molecules and siRNA-mediated silencing of indicated transcription factors, respectively). Each square represents the log2-fold change for the perturbation-response combination (see Materials and methods). Blue squares denote responses indicating downregulation, red squares denote responses indicating upregulation (see Supplementary Figures 1, 3 and 4). (B, C). Relationship between transcription factors and target gene expression as determined by expression changes upon transcription factor knockdown. Upper heat maps of graphs B and C illustrate target gene expression patterns over seven knockdown conditions: Specifically, only probe sets related to target genes are shown whose expression patterns matched perturbation-response patterns of transcription factor protein and mRNA, and may thus represent direct targets or co-regulated genes, respectively. For comparison, lower heat maps of graphs B and C show patterns of transcription factor protein and mRNA expression, respectively (the area width of each transcription factor pattern in the heat map was adjusted to the number of matching probe sets and designations of transcription factors were placed underneath the brackets at the bottom of the lower panels). A probe set (gene expression pattern) was defined as ‘matching the transcription factor pattern’, if the log-fold transcription factor mRNA or protein change cutoffs, defined as large (<1), small (0.3–1), or absent (<0.3), respectively, were accompanied by comparable expression changes of the target gene over all knockdown conditions (correlations and anti-correlations were considered; see Supplementary Table 1 for details). Out of 5971 probe sets indicating an mRNA expression change mediated by transcription factor knockdown, 947 matched the transcription factor protein pattern and 532 probe sets the mRNA patterns, respectively. Note that we included moderate differences between transcription factor and target gene patterns to accommodate high versus low affinity transcription factor targets and variability in microarray measurements. Source data is available for this figure in the Supplementary Information.

Mathematical modelling reveals hierarchical regulation in the transcription factor network
Although the perturbation-response matrix in Figure 3A contains important information about the molecular interactions between transcription factor mRNAs/proteins and signalling proteins, it is not possible to distinguish direct and indirect regulatory effects. For example, the activation of Gfi1 expression by RAS (see top left data point in Figure 3A) might be achieved directly through signalling intermediates not measured within the perturbation screen. Alternatively, Gfi1 expression and activity might be mediated indirectly via one of the other RAS pathway-induced transcription factors, which in turn regulate Gfi1 (e.g., RAS→Otx1→Gfi1). Hence, many different network topologies might underlie the perturbation-response data, and it is difficult to select the most plausible topology by intuitive reasoning. One strategy to derive experimentally testable predictions from the data set in Figure 3A is to apply reverse-engineering algorithms, which determine the most likely network topology from perturbation-response data. We chose the framework of MRA to model the network response. Existing algorithms to determine the connectivity of the network using MRA require that all nodes in the network are perturbed independently. This requirement is not fulfilled in our case, as protein levels could not be perturbed independently from mRNA levels. Accordingly, the perturbation-response matrix in Figure 3A does not follow a square arrangement (10 perturbations; 16 responses), rendering the reverse-engineering problem with 16 nodes underdetermined. Therefore, we applied a modified MRA algorithm suited for incomplete perturbation data (see Materials and methods for details). In brief, we assumed that the underlying network was likely to be sparse (e.g., not every node was connected to all other nodes), and that certain interactions were improbable. We excluded a priori the following improbable regulatory interactions (Figure 4A): (i) direct regulation of other nodes in the network without translation of mRNAs into proteins (panels 2, 6 and 8), (ii) post-transcriptional interactions between transcription factor protein species (panel 6) and (iii) feedback regulation of exogenously overexpressed RAS proteins by other nodes in the network. The latter assumption is based on our experimental observation that RAS-GTP levels in RAS-ROSE cells are not affected by transcription factor knockdowns or signalling perturbations. To keep the MRA model as simple as possible, we applied an incremental model selection strategy. The number of allowed regulatory interactions was iteratively increased until the fit to the data did not improve significantly. We note that such a greedy hill-climbing algorithm is not necessarily converging to a global optimum, which may become problematic especially for larger network sizes. We benchmarked our approach using simulated data of a similar size, and find that typically the precision is larger than 80% (Supplementary Figure 9; Supplementary information).
Figure 4.

Network model of hierarchical and regulatory interactions among the KRAS-dependent transcriptional network components and signalling pathways. (A) Result of modular response analysis (MRA) applied for mathematical calculation of hierarchical and regulatory interactions (cf. Figure 3A). Each dot indicates an inferred regulatory interaction expressed as the local response coefficient (see legend on bottom of A). The rows and columns indicate the regulator and effector species, respectively. Some interactions were excluded a priori in the derivation of the model (panels 2, 6 and 8); others (indicated by boxes) were confirmed by work published previously. (B) Correlation between measured global response coefficients (Figure 3A) and simulation results of the best-fit model (A). Off-diagonal lines indicate standard deviation of response coefficients. (C) Schematic representation of the network model depicted in A. Arrows point at a direct activating interaction between network components. The markings + or − placed at the top of a protein symbol represent activation or inhibition of transcription factors by cytoplasmic signalling; the markings + or − placed at the bottom of a protein symbol imply stimulation or inhibition of signalling activity (kinase phosphorylation) by downstream transcription factors.
The interaction matrix of the final model is shown in Figure 4A and a graphical representation in Figure 4C (see Supplementary Table S3 for quantification of the network). The model comprises 32 regulatory interactions as opposed to 160 perturbation-response measurements (Figure 3A), thus representing a strongly overdetermined problem that is robust to experimental measurement noise. The best model fit agreed well with the measured perturbation-response data (χ2=182.19; N=160), and most data points lay within one standard deviation (Figure 4B). The reverse-engineering strategy helped to decompose the complex perturbation-response matrix into a relatively simple series of direct regulatory interactions. For example, the transcriptional regulatory network deduced by MRA comprises only 10 links (Figure 4A, panel 3), while each transcription factor knockdown had an effect on the expression of nearly every other transcription factor in the original perturbation-response data (Figure 3A). The model correctly inferred the topology of the signal transduction pathways (i.e., RAS activates Erk and Akt, cf. Figure 4A, panel 7) as well as the translation of transcription factor mRNAs (panel 5). Interesting interactions between signalling pathways and the transcription factors were unveiled: Transcriptional induction of Gfi1, Otx1, Fosl1 and Hmga2 was attributed to the Mapk pathway (panel 1). The model also suggested that Mapk signalling directly reduced the protein level of Hmga2 and that the RelA protein was stabilized by the PI3K/Akt pathway (panel 4). The model also uncovered transcriptional feedback regulation of signal transduction (panel 9): Otx1, RelA and Klf6 were predicted to inhibit the phosphorylation of Erk. Otx1 and Fosl1 were inferred to reduce phosphorylation of Akt, while JunB was predicted to increase Akt phosphorylation. We also quantified the evidence for each link by removing each link separately and refitting the model. By comparing the resulting χ2-value to the full model, we can rank our predictions. Interestingly, the strongest predictions relate to edges from mRNA to protein, which represents translation, and removal of any of the transcriptional regulatory interactions are associated with an increase of the χ2-value by >10, corresponding to P-values <0.005 (Likelihood-ratio test). To validate the uncovered network topology, we collected experimental evidence from published studies. We marked each of the predicted interactions with a box whenever supporting evidence was retrieved (Figure 4A). In all, 22 of the 32 interactions have been previously described (cf. Supplementary Table 2; Supplementary References). Notably, at least one of the predicted interactions was contradictory to a current publication: It has been reported that Fosl1 is stabilized by Erk signalling (Casalino et al, 2003). In contrast, our model predicts that Erk activity reduces Fosl1 protein levels (Figure 4A, panel 4). We therefore decided to investigate and refine this interaction further.
The protein level of Fosl1 is influenced by Otx1
We investigated the interaction between Erk activity and Fosl1 further by double perturbation experiments. Fosl1 was expressed ectopically in RAS-ROSE cells, rendering Fosl1 mRNA expression virtually independent of endogenous Erk activity (Figure 5A). Ectopic Fosl1 expression of Fosl1 resulted in an ∼15-fold overexpression of the protein (Figure 5B, left bar). Treatment of Fosl1 transfectants with the Mek inhibitor U0126 did not affect Fosl1 mRNA levels (Supplementary Figure 5), confirming that ectopic expression eliminates endogenous transcriptional regulation. At the protein level, U0126 treatment induced pronounced Fosl1 downregulation, well in line with previous reports on Fosl1 protein stabilization by Erk signalling (Figure 5B). We conclude that the Fosl1 overexpression experiments do not support the model prediction concerning Erk-mediated downregulation of Fosl1 protein; this suggests that other post-transcriptional mechanisms underlie the opposite regulation of Fosl1 mRNA and protein under various experimental conditions (cf. Figure 3A). Thus, our model assumption that transcription factor protein pools are controlled by signalling pathways only (cf. Figure 4A, panel 6) led to false predictions not verifiably by experiments.
Figure 5.
Simulated and experimental double perturbations unveil incoherent regulation of Fosl1 protein by Otx1, and complex regulation of Hmga2 expression. (A) Strategy for assessing the post-transcriptional regulation of Fosl1 in RAS-ROSE cells: Ectopic Fosl1 overexpression eliminates endogenous transcriptional regulation (indicated by red X). (B) Inhibition of phospho-Erk strongly reduces Fosl protein level as shown by treatment of Fosl1 overexpressing cells with the Mek inhibitor U0126. Bars show log-fold change compared with control (mock transfection). (C) Model with refined post-transcriptional regulation. The MRA model selection procedure was applied after removing the negative influence of phosho-Erk on Fosl1 protein (indicated by red X; cf. B), and allowing other transcription factor proteins to regulate Fosl1 post-transcriptionally. The refined model includes post-transcriptional regulation by Gfi1, Otx1, Klf6 and Hmga2, while all other regulatory interactions of the original model in Figure 4C are retained. (D) The refined model reproduces incoherent regulation of Fosl1 mRNA (blue) and protein (red) after Otx1 knockdown. A set of independent gene silencing experiments was performed in RAS-ROSE cells to confirm incoherent regulation of Fosl1 mRNA and protein as described in Figure 3A. Bars show log-fold changes of Fosl1 mRNA and protein after Otx1 silencing compared with transfection of scrambled siRNA as control. (E) Post-transcriptional control of Fosl1 by Otx1 as revealed by double perturbation. Downregulation of Fosl1 protein by Otx1 knockdown was predicted and experimentally verified, even if Fosl1 was expressed ectopically. Overexpression was simulated by setting all local response coefficients for Fosl1 mRNA regulation to zero. Bars show log2-fold change following Otx1 knockdown relative to Fosl1 overexpression (OE) and transfection of scrambled siRNA. (F) Fosl1 is an upstream regulator of Hmga2. The model predicts a strong downregulation of Hmga2 mRNA after Mek inhibition, a modest increase after Fosl1 overexpression, and a modest decrease after combined Mek inhibition and Fosl1 overexpression. This pattern was verified in experiments based on Fosl1 overexpression and treatment with the Mek inhibitor U0126. Bars show average log2-fold changes of two independent experiments relative to DMSO-treated or mock-transfected controls. Source data is available for this figure in the Supplementary Information.

To refine the model, we altered our restrictions on the model by removing the negative effect of pErk on the Fosl1 protein, and allowed other transcription factors to regulate Fosl1 post-transcriptionally. Afterwards, we repeated the MRA model selection procedure. Our algorithm selected interactions from the transcription factors Gfi1, Otx1, Klf6 and Hmga2 on Fosl1 protein (Figure 5C). While Gfi1 was predicted to negatively regulate Fosl1 protein, the others were predicted to stabilize Fosl1. The interaction of Otx1 and Fosl1 had the largest local response coefficient (0.67), and Otx1 knockdown regulated Fosl1 mRNA and protein in opposite directions (Figure 3A). Thus, Otx1 was the most likely candidate for post-transcriptional regulation of Fosl1. Simulations confirmed that our refined model recapitulates incoherent regulation of Fosl1 mRNA and protein by Otx1 knockdown (Figure 5D, left two bars), and the effect was further supported by an independent set of experiments (Figure 5D, right bars). To assess post-transcriptional regulation more directly, we analysed a double perturbation combining Otx1 knockdown and Fosl1 overexpression in silico. The model predicted that Otx1 knockdown should reduce Fosl1 protein even if endogenous transcriptional regulation was eliminated by ectopic Fosl1 overexpression (Figure 5E, left bar). In line with model predictions, our experiments revealed that Fosl1 protein levels were strongly reduced upon Otx1 knockdown (Figure 5E, right bars), while the Fosl1 mRNA pool remained unchanged (Supplementary Figure 5). Thus, the double perturbation experiment confirmed the positive interaction between Otx1 and Fosl1 protein at the post-transcriptional level. Whether the interaction between Otx1 and Fosl1 is direct or indirect involving Otx1 targets remains to be determined. Interestingly, we found that Erk phosphorylation is slightly elevated upon Otx1 knockdown in Fosl1 overexpressing cells (Supplementary Figure 5). This suggests that pErk-mediated stabilization of the Fosl1 protein does not contribute to post-transcriptional Fosl1 regulation by Otx1 knockdown. Taken together, our systematic perturbation-response analyses indicate that transcription factors communicate through strong post-transcriptional regulation, possibly without feedback to the signalling network. Thus, the gene-regulatory network downstream of Ras shows multiple layers of regulation in addition to transcriptional control.
Hierarchy of the regulatory network
The transcriptional network in mammalian cells is still incompletely characterized. Hence, it is not surprising that only 4 of 10 gene-regulatory interactions between transcription factors were reported previously (Figure 4A, panel 3) and that the network predictions were mostly unknown. Interestingly, the transcription factors showed hierarchical regulation: Otx1, Gfi1 and RelA regulated each other and also controlled the downstream factors Hmga2, Fosl1, Klf6 and JunB in multiple ways. The downstream factors were also interconnected, but did not have a direct impact on the upstream factors. More specifically, Hmga2 did not control the upstream network at all. JunB, Fosl1 and Klf6 exhibited only a minor impact on the upstream factors via pErk- or pAkt-dependent pathways. Transcription factor hierarchy was also reflected in the perturbation-response matrix (Figure 3A). The upstream factors Otx1, Gfi1 and RelA tended to be less affected by transcription factor knockdown than the downstream factors Hmga2, Fosl1, Klf6 and JunB. We employed the Fosl1 overexpression system to independently confirm our model prediction that positions Fosl1 upstream of Hmga2 (cf. Vallone et al, 1997). The model predicted that pErk controls Hmga2 transcription at least in part via Fosl1. Hmga2 downregulation by U0126 should therefore be alleviated by simultaneously blocking the endogenous transcriptional regulation of Fosl1 by overexpression of the gene (Figure 5F, left bars). The validation experiments confirmed that Fosl1 overexpression alone does not significantly affect Hmga2 mRNA expression, while it has a strong compensatory effect in combination with U0126 (Figure 5F, right bars). These data support the conclusion that pErk controls Hmga2 transcription at least in part via Fosl1.
The hierarchical transcription factor organization predicted by the model should impinge on phenotypic responses to transcription factor knockdowns. Perturbations of Otx1, Gfi1 and RelA were expected to affect target genes which are regulated by Hmga2, Fosl1, Klf6 and JunB, but not vice versa. Specifically, phenotypic effects mediated by Hmga2, Fosl1, Klf6 and JunB should also be modulated by perturbations of Otx1, Gfi1 and RelA. In contrast, phenotypes mediated by Otx1, Gfi1 and RelA might be independent of Hmga2, Fosl1, Klf6 and JunB. Taken together, the model predicted that the phenotypic responses mediated by downstream factors Hmga2, Fosl1, Klf6 and JunB might be a subset of those mediated by upstream factors Otx1, Gfi1 and RelA. Consequently, such phenotypic traits had to be scrutinized by an appropriate functional read-out.
Phenotypic analysis supports the existence of transcription factor hierarchy predicted by the model
To provide experimental evidence for the model prediction, we systematically measured anchorage-dependent growth on a solid substratum in monolayer culture (‘two dimensional, 2D growth’) and anchorage-independent growth on poly-heme-coated substratum in media containing semi-solid agar (‘three dimensional, 3D growth’) by XTT-based colorimetric assays. Silencing of each of the seven transcription factors significantly reduced 3D growth of RAS-ROSE cells to a similar extent (Figure 6A). In contrast, we observed a strong difference in the effects on 2D growth. Depletion of Otx1, Gfi1 and RelA reduced anchorage-dependent growth in monolayer cultures, while perturbations of the downstream transcription factors Hmga2, Fosl1, Klf6 and JunB were had no significant effect (Figure 6B). Effects on anchorage-dependent and -independent growth were confirmed in two independent growth assays (Supplementary Figures 6 and 7). Since the reduced proliferation of the cell populations could be due to enhanced apoptosis or cell-cycle arrest, we employed flow cytometry to analyse the cell-cycle distribution of cells in which the selected transcription factors were transiently silenced (Figure 6C; Supplementary Figure 8). Cultures transfected with siRNAs against Otx1, Gfi1 and RelA exhibited G1-phase arrest compared with control cells (Figure 6C). In contrast, there was no significant difference in cell-cycle distribution after silencing of Fosl1, Hmga2, JunB and Klf6 in RAS-ROSE cells compared with control cells (Figure 6C). We did not find any evidence for enhanced apoptosis, as the sub-G1 peaks characteristic for apoptotic cells were insignificant in all flow-cytometric measurements (Supplementary Figure 8). The cell-cycle analysis supported the model prediction that the upstream transcription factors Otx1, Gfi1 and RelA are functionally distinct from and independent of the downstream factors Hmga2, Fosl1, Klf6 and JunB. The fact that all seven transcription factors were involved in anchorage-independent growth supported the notion that the upstream factors regulated the downstream factors which in turn impinged on the transcriptional program to mediate anchorage-independent growth (hierarchical model). However, the ability of cells to traverse the cell cycle is a prerequisite for anchorage-independent growth. Thus, the effect of the upstream factors on 3D growth is likely to be non-specific in the sense that it was solely due to a general cell-cycle block.
Figure 6.
Effects of transcription factor silencing on transformed phenotypes expressed in KRAS-transformed cells support hierarchical regulation in the gene-regulatory network. (A) Anchorage-independent proliferation (‘3-dimensional’ (3D) growth in soft agar cultures). (B) Anchorage-dependent proliferation (‘2-dimensional’ (2D) growth in adherent monolayer cultures) of RAS-ROSE cells 48 h after treatment with scrambled siRNA-duplex (Sc), transfection reagents only (Mock) and two independent siRNA duplexes targeting each transcription factor as determined by colorimetric XTT assay. Each bar indicates the alteration of cell growth relative to untransfected RAS-ROSE cells. Upstream transcription factors: Otx1, Gfi1, RelA and downstream transcription factors: Fosl1, Hmga2, Klf6 and JunB (see text). (C) Cell-cycle analysis of RAS-ROSE cells 48 h after treatment with scrambled siRNA-duplex (Sc), transfection reagents only (Mock) and two independent siRNA duplexes targeting each transcription factor. Distribution of cell-cycle phases G0/G1, S and G2/M was determined by FACS analysis after DNA staining of cells with propidium iodide (Supplementary Figure 8). Each bar shows the number of cells in G0/G1 phase relative to untransfected RAS-ROSE cells. (D) Representative images of scratch assays to determine migratory activity of RAS-ROSE cells following transcription factor silencing. Cells were transfected with scrambled siRNA, transfection reagents only (mock), and two independent siRNA duplexes targeting RelA. Pictures were taken before scratching the wound, at time 0 and 19, 24 and 36 h post scratch. Phase contrast, magnification 100-fold. Migration was strongly inhibited after RelA knockdown as compared with controls. (E) Quantitative analysis of wound closure by RAS-ROSE cells following transcription factor knockdown as compared with control cells. Bar plots show average and standard deviation of two biological and three technical replicates for two different transfected siRNAs normalized to scrambled control. Source data is available for this figure in the Supplementary Information.

In addition, we performed scratch assays to monitor cell migration in monolayer cultures. Cells were transiently transfected with siRNAs targeting the transcription factors, replated to achieve confluent monolayers and deprived of serum growth factors before inserting wounds by scratching the surface of the dishes with a micropipet tip. We determined the migratory activity by quantifying the wounded areas over time (see Figure 6D for an example). Silencing of Hmga2, Fosl1 and JunB generated no significant change in migration potential compared with cells treated with scrambled siRNA (Figure 6E). However, knockdown of the upstream transcription factors Otx1, Gfi1 and RelA impaired migration strongly. In addition, silencing of Klf6, a component of the downstream module, reduced wound closure. Migration was thus primarily controlled by transcription factors of the upstream layer in the network, and perturbation of the downstream factors (except Klf6) did not impair migration. Our observation that Klf6 was also involved in regulating migration did not contradict hierarchical regulation predicted by the model: Klf6 is the uppermost member of the Klf6→Fosl1→JunB→Hmga2 cascade in the downstream module, and the directionality of this cascade was only disturbed by moderate transcriptional regulation of Klf6 by JunB. Thus, it is expected that the upstream cascade member Klf6 elicited phenotypic responses not mediated by downstream factors in the cascade (Fosl1, JunB and Hmga2). Taken together, the migration data further supported the notion that the upstream elements of the network were not influenced by the downstream factors.
Discussion
We employed a top-down systems biological approach to identify regulation principles in the transcription factor network downstream of the RAS/MAPK pathway. To uncover elements of the network, we integrated perturbation of transcription factor expression by RNA interference, expression profiling of target genes and computational modelling. At the phenotypic level, siRNA-mediated silencing of the transcription factors generated reproducible effects on morphology, growth and anchorage independence of ovarian epithelial cells. Since the relationship of the different regulators could not be interpreted intuitively, we introduced a modification of MRA, which has been established for the construction of genetic networks (Kholodenko et al, 2002; Santos et al, 2007). Local response coefficients illustrating the mutual impact of single transcription factor perturbations on other network components were derived from the model. The simulations predicted three central hubs (RelA, Gfi1 and Otx1), which act upstream of the remaining factors (Fosl1, JunB, Hmga2 and Klf6). Interestingly, hierarchical regulation among transcription factors appeared to involve transcriptional as well as post-transcriptional regulation. The importance of post-transcriptional effects points to a central role of miRNAs in growth control, as suggested by a recent study on EGF-induced transcriptional networks (Avraham et al, 2010). The three upstream factors had strong specific effects on anchorage-dependent proliferation, cell-cycle progression and migration activity in monolayer cultures. The four downstream factors had an exclusive role in controlling anchorage-independent proliferation and migration, both of which are hallmarks of tumorigenicity. Overall, these different phenotypic read-outs reflected the hierarchical structure of the transcription factor network. All transcription factors partially modulated KRAS morphological alterations, suggesting that the morphological features cannot be clearly separated from effects on proliferation in adherent and in semi-solid agar (anchorage-independent) cultures.
The transcription factors involved in the network belong to an even larger set of regulatory molecules upregulated in conjunction with KRAS-mediated oncogenesis in the ovarian epithelium (Tchernitsa et al, 2004). Large-scale studies simultaneously characterizing all these factors will be required to fully understand gene expression patterns in RAS-transformed cells. In particular, it will be interesting to see whether additional RAS pathway-regulated transcription factors decompose into hierarchically organized upstream and downstream layers as well. We speculate that upstream transcriptional regulators may be primary targets solely controlled by signal transduction, while downstream effectors require dual inputs and thus require feed-forward regulation. Such feed-forward loops are known to promote robustness and specificity in the response to MAPK pathway activation (Murphy et al, 2002; Goentoro et al, 2009). Transcription factors downstream of RAS may be modulated by signalling pathways other than the Mek/Erk pathway (Tchernitsa et al, 2004). The contribution to KRAS oncogene-mediated transformation of RelA, which is a major component of the NF-κB transcription regulatory complex and is activated by Akt signalling, is well known (Madrid et al, 2000; Basseres et al, 2010). In contrast, the roles of zinc finger transcription factor Gfi1 and the bicoid-like homeodomain protein Otx1 in oncogenesis have not yet been investigated. The impact of Gfi1 and Otx1 on growth and transcriptional control in KRAS-transformed ovarian epithelial cells suggests a function in growth control. However, further functional studies are needed for establishing a more general role of Gfi1 and Otx1, beyond the cellular model studied here, as upstream regulators of the transcription factors Fosl1, JunB, Hmga2 and Klf6, which appear to be directly involved in cellular transformation.
The role of the downstream transcription factors Fosl1, JunB, Hmga2 in cancer cells is well established as shown by expression analysis and functional studies. Fosl1 (Fra-1) is a component of the AP-1 transcription activation complex and is frequently overexpressed in epithelial cancer (Milde-Langosch, 2005). Enhanced AP-1 activity is driven by RAS transformation (Mechta et al, 1997; Battista et al, 1998). Fra-1 promotes growth and survival in RAS-transformed cells (Tchernitsa et al, 2004; Casalino et al, 2007). Enhanced AP-1 activity coincides with JunB upregulation (Mechta et al, 1997; Battista et al, 1998). Recently, we have shown that short hairpin RNA-mediated downregulation of Hmga2 suppressed the growth of an ovarian cancer cell line in vitro and in vivo (Malek et al, 2008). In addition, Hmga2 activity is required to maintain oncogenic RAS-induced EMT in pancreatic cancer cells (Watanabe et al, 2009). The Kruppel-like zinc finger transcription factor Klf6 was identified as a tumour suppressor, however, Klf6 splice variants were described that exert an opposing oncogenic role in epithelial neoplasms including ovarian cancer (DiFeo et al, 2006). The inactivation of the tumour suppressor is triggered by RAS-mediated alternative splicing (Yea et al, 2008), suggesting that Klf6 overexpressed in KRAS-transformed ROSE cells represents the alternatively spliced oncogenic form.
The primary aim of the study was to model the transcription factor network downstream of the KRAS/MAPK pathway by integrating the results of siRNA-mediated perturbation of transcription factor expression, the mutual effects of those factors on network components and the downstream consequences of target gene transcription. Besides these effects, silencing of transcription factors resulted in the modification of cytoplasmic signalling involving pErk, pMek and pAkt. Notably, silencing of the upstream transcription factors Otx1, Gfi1 and RelA enhanced phosphorylation of Erk, Mek and Akt, respectively. This suggests that the downregulation of those transcription factors is partially compensated by enhancement of upstream signalling activity. Such transcriptional feedback regulation appears to be common in mammalian signalling networks (Legewie et al, 2008). The enhancement of the signalling input may explain why proliferation of cells was reduced only partially upon transcription factor knockdown and the KRAS pathway-mediated phenotype was stabilized. Possibly, the transcription factors of the entire network contributed to this compensatory regulation as well. A recent report described a systematic siRNA knockdown of a large group of transcription factors involved in the differentiation of a human monocytic cell line. Interestingly, no single transcription factor knockdown was necessary and sufficient to deregulate cellular differentiation (Suzuki et al, 2009).
Knockdown of the downstream transcription factors Fosl1, JunB, Hmga2 and Klf6 did not enhance pErk and pAkt, but even reduced pMek. We assume that the regulatory communication between cytoplasmic signalling and the downstream elements of the network is generally restricted. Alternatively, other regulatory mechanisms, for example, transcriptional feedback involving phosphatases (Bhalla and Iyengar, 1999; Bluthgen et al, 2009), may have a differential impact on upstream and downstream elements of the network. Our study revealed a strong phenotypic robustness of the transformed cells, since no perturbation alone was able to fully revert a phenotype. It remains to be elucidated which topological or kinetic mechanisms provide robustness within this network or similar transcriptional networks. We propose that a combination of topological properties of the transcriptional network, that is, redundancy and high connectivity within the groups, together with non-overlapping control of redundant target genes may contribute to the observed robustness. Furthermore, feedbacks towards cytoplasmic signalling may further enhance robustness. Network robustness may also explain some aspects of resistance to therapies, which target receptor tyrosine kinases or signalling kinases downstream of RAS in cells expressing a mutated oncogene (Longley and Johnston, 2005; Breccia et al, 2009).
Our approach combined systematic perturbations of a transcriptional network, network modelling and measurement of phenotypic parameters. The transcription factors Hmga2, Fosl1, JunB and Klf6 acted as specific regulators of anchorage-independent growth, which is strongly correlated with tumorigenicity. Hence, these factors may serve as promising targets for gene silencing, as exemplified by Hmga2 (Malek et al, 2008). Blocking anchorage independence and tumorigenicity without affecting cellular proliferation per se might result in diminished therapy side effects. However, the complexity of the network is likely to require combined ablation of factors acting in distinct hierarchical groups. We believe that a similar approach, on a larger scale, may help to reveal which mechanisms render cellular decision making robust, and will unveil which combinatorial perturbations are required to successfully interfere with the oncogenic network.
Materials and methods
Cell culture
The ROSE 199 cell line was derived from rat ovarian surface epithelium (Adams and Auersperg, 1985). KRAS-transformed ROSE cells (designated as RAS-ROSE) were obtained by transfection of ROSE 199 cells with the oncogenic human KRAS (V12) gene under the control of the human elongation factor promoter cloned into the expression vector pEF-BOS (Tchernitsa et al, 2004). Cell lines were cultured in Dulbecco’s modified Eagle’s medium (DMEM; Invitrogen) supplemented with 10% fetal calf serum (FCS; Sigma-Aldrich), 2 mM Ultraglutamine 1 (Lonza, BioWhittaker), and 100 units/ml penicillin/streptomycin (Biochrom AG) (standard medium). The medium for RAS-ROSE cells was supplemented with G418 (400 μg/μl).
siRNA, expression vectors and conditions of transfection
SiRNA duplexes were generated with the Silencer®siRNA Construction Kit (Ambion) according to manufacturer’s protocol. The sequences of siRNAs used for silencing of the transcription factors were as follows:
- Fosl1 (1)
Sense: 5′-GGACACAGGUGGUAUCAGCUU-3′Antisense: 5′-GCUGGUACCACCUGUGUCCUU-3′
- Fosl1 (2)
Sense: 5′-GCUGCUAUUUAUUUUCCUAtt-3′Antisense: 5′-UAGGAAAAUAAAUAGCAGCtg-3′
- Gfi1 (1)
Sense: 5′-AACAGATCTTACAGTCAAAGCCCTGTCTC-3′Antisense: 5′-CAGCTTTGACTGTAAGATCTGCCTGTCTC-3′
- Gfi1 (2)
Sense: 5′-AATTTCAAAGGGATACTTTCCCCTGTCTC-3′Antisense: 5′-AAGGAAAGTATCCCTTTGAAACCTGTCTC-3′
- Hmga2 (1)
Sense: 5′-AACTCCCGAGCCGTAGCGGAGCCTGTCTC-3′Antisense: 5′-AACTCCGCTACGGCTCGGGAGCTTGTCTC-3′
- Hmga2 (2)
Sense: 5′-CCAUUGGAGAAAAACGGCCtt-3′Antisense: 5′-GGCCGUUUUUCUCCAAUGGtc-3′
- JunB (1)
Sense: 5′-GCGACUUCGUGUCUAAAGUtt-3′Antisense: 5′-ACUUAAGACACGAAGUGCGTT-3′
- JunB (2)
Sense: 5′-CAUACGCAGCGGCAGGAUAtt-3′Antisense: 5′-UAUCCUGCCGCUGCGUAUGAG-3′
- Klf6 (1)
Sense: 5′-AATTCAGGAAATGATTGGTGGCCTGTCTC-3′Antisense: 5′-GACCACCAATCATTTCCTGAACCTGTCTC-3′
- Klf6 (2)
Sense: 5′-AATTATAATTAAAGCCGGAGCCCTGTCTC-3′Antisense: 5′-CAGCTCCGGCTTTAATTATAACCTGTCTC-3′
- Otx1 (1)
Sense: 5′-AATAGGACATAGGGTAGGAGGCCTGTCTC-3′Antisense: 5′-GACCTCCTACCCTATGTCCTACCTGTCTC-3′
- Otx1 (2)
Sense: 5′-AATGAAGATTGGCTCAGTGGGCCTGTCTC-3′Antisense: 5′-CACCCACTGAGCCAATCTTCACCTGTCTC-3′
- RelA (1)
Sense: 5′-AAGTTAGGATGATGTGCGTCGCCTGTCTC-3′Antisense: 5′-AACGACGCACATCATCCTAACCCTGTCTC-3′
- RelA (2)
Sense: 5′-CCGGAUUGAAGAAAAACGCtt-3′Antisense: 5′-GCGUUUUUCUUCAAUCCGGTG-3′
- Scrambled (Sc)
Sense: 5′-AAGCGAAGCCCATTACCCCTTCCTGTCTC-3′Antisense: 5′-AAAAGGGTTAATGGGCTTCGCCCTGTCTC-3′
For transient transfection of siRNA, 4.5 × 10⁴ RAS-ROSE cells were seeded into six-well plates 24 h before transfection. Cells were transfected twice with an interval of 24 h using a final siRNA concentration of 1 nM of siRNA and Oligofectamine (Invitrogen) in serum-free OptiMEM (Invitrogen). After 4 h of incubation, FCS was added to the medium at a final concentration of 10%. Cells treated with transfection reagents only (Mock) and cells transfected with scrambled siRNA duplexes (Scr) served as controls. For overexpression of the Fosl1 gene, the cells were transiently transfected in serum-free OptiMEM medium (Invitrogen) with 1 μg of the expression vector NM_005438.2 (OriGene Technologies) using the Arrest-In transfection reagent (Open Biosystems). After 4 h of incubation, FCS was added to the medium at a final concentration of 10%. Control cells were treated under the same conditions. The cells were analysed after 48 h.
Inhibitor studies
The Mek1/2 inhibitor U0126 (Promega) and PI3K inhibitor LY294002 (Alexis Biochemicals) were dissolved in DMSO in a final concentration of 50 mM. RAS-ROSE cells were treated 24 h after seeding with a final inhibitor concentration of 10 μM for 48 h. Control cells were incubated without inhibitors, but the same amount of DMSO was added (solvent control).
RNA extraction and RT–PCR analysis
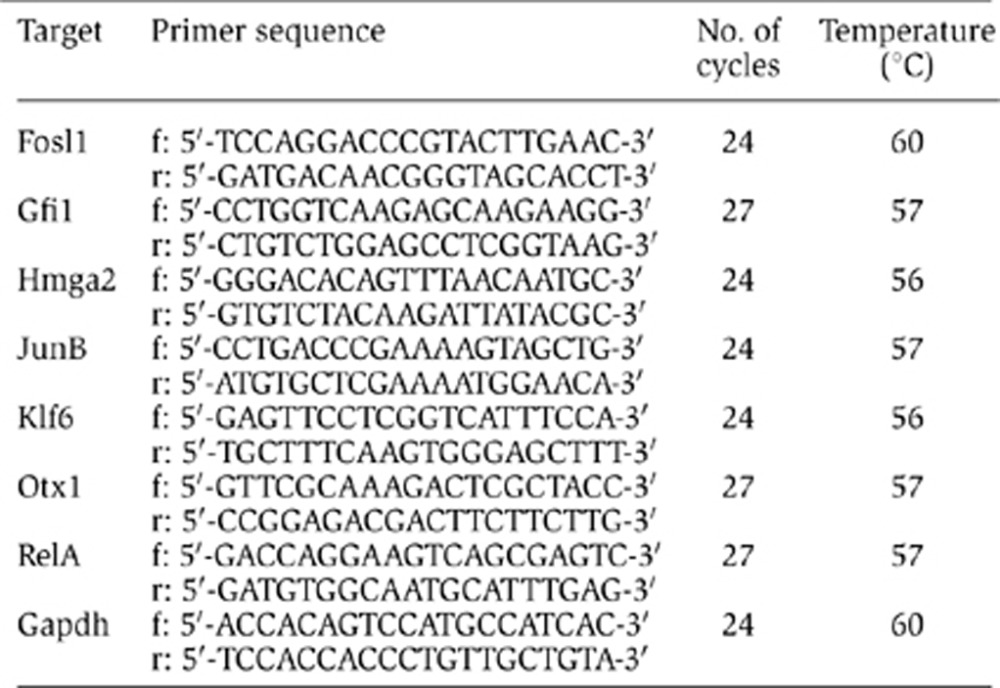
For extraction of total RNA, we used the TRIZOL reagent (Invitrogen) or the RNeasy Mini Kit and QIAshredder (Qiagen) according to manufacturer’s instructions. The cDNA synthesis and PCR were performed with the C. therm. Polymerase One-Step RT–PCR System and 100 ng of total RNA template according to manufacturer’s instructions (Roche). The primers (Eurofins MWG) were used at a final concentration of 10 μM. The number of PCR cycles and the primer annealing temperature were optimized for each primer set and the specific PCR product as follows:
RT–PCR products were analysed on 1.5% (w/v) agarose gels containing ethidium bromide (0.5 μg/ml). We used the SmartLadder SF (Eurogentec) as molecular weight marker. RT–PCR products were documented by digital imaging after visualization under ultraviolet light. The quantification was done manually using ImageJ analytic software (http://rsbweb.nih.gov/ij/). For normalization, the relative density was determined as the ratio of the signal intensity of the test sample to the corresponding Gapdh band. Densitometer read-outs were first normalized to the values obtained for the housekeeping gene Gapdh and finally expressed as percentage relative to the control values obtained with cell transfectred with scrambled siRNA.
For the analysis of transgene expression, cDNA synthesis was performed with 500 ng total RNA per sample using TaqMan® Reverse Transcription Reagents (Applied Biosystems) and Progene Thermal Cycler (Techne) according to the manufacturer protocol. The real-time RT–PCRs were performed by StepOnePlus Real Time PCR System (Applied Biosystems) with 1 μg total cDNA using SYBRGreen, Micro Amp Fast Optical 96-Well Reaction Plate (Applied Biosystems) and the following primers (Tib Molbiol) at an annealing temperature of 60°C: Fosl1 forward: 5′-CAGCCTCATTTCCTGGG-3′; Fosl1 reverse: 5′-TCCTCCGGGCTGATCT-3′. Quantification of transcript levels was done using the 2deltaCt method (Livak and Schmittgen, 2001).
Protein extraction and western blot analysis
Preparation of whole cell lysates
Cells were washed twice with cold PBS buffer and resuspended in lysis buffer (10 mM Tris–HCl, 150 mM NaCl, 1% Triton X-100, 1% DOC pH 7.2, 1 mM PMSF, 50 mM NaF, 50 μg/ml leupeptin, 1 mM Na-orthovanadate, 4 μg/ml aprotinin). To remove debris, the lysates were centrifuged at 16 000 g at 4°C for 15 min. Supernatants containing total proteins were transferred to a fresh 2 ml reaction tube, mixed with 25% v/v 4 × SDS sample buffer: 0.25 M Tris–HCl, pH 6.8 (Merk), 8% w/v SDS (Serva), 40% v/v glycerol, 20% v/v β-mercaptoethanol (Promega), and 0.18% (w/v) bromophenol blue (Sigma-Aldrich). The lysates were heated for 5 min at 95°C and stored at −20°C.
Preparation of nuclear extracts
Cells were washed twice with cold PBS and treated with hypotonic lysis buffer containing 10 mM Tris–HCl pH 8.0 and complete protease inhibitors (Roche). Hypotonically treated cells were homogenized in a pre-cooled cell 23-homogenizer (Kontes Glass Co., NJ, USA) and the integrity of the nuclei was checked by microscopy. The suspension was transferred to 13 ml tubes (Sarstedt) and centrifuged at 1089 g, at 4°C for 10 min. The pellets containing nuclear proteins were resuspended in 50–100 μl PBS and mixed with 25% v/v 4 × SDS sample buffer. The lysates were boiled for 5 min at 95°C and stored at −20°C.
Determination of protein concentration, SDS–polyacrylamide gel electrophoresis and western blotting
The protein concentration was determined by the amido black method (Schaffner and Weissmann, 1973). In all, 30–60 μg per sample of nuclear protein lysates and 40 μg of total protein lysates were then fractionated by electrophoresis through 12% SDS–polyacrylamide gel electrophoresis (SDS–PAGE) gels (4% stacking gel) and transferred onto nitrocellulose membranes (Protran Whatman) with a semi-dry blotter system (Peqlab) at 100 mA per gel. The membrans were blocked using 10% w/v non-fat dried milk powder (AppliChem GmbH) in TBST at room temperature for 1 h. The following antibodies were used at the indicated dilutions:
Membranes were washed three times in TBST for 5 min, incubated with the corresponding secondary antibodies for 1 h at room temperature and washed again three times in TBST for 5 min. The membranes were incubated with a chemoluminescence detection kit (GE Healthcare) according to manufacturer’s specifications. Protein bands were detected after exposure to Amersham hyperfilm ECL (GE Healthcare) according to manufacturer’s specifications (Kodak). For detection of several antigens on the same membrane, the blots were stripped with the Western Blot recycling kit (Alpha Diagnostics) before incubation with the subsequent primary antibody. To verify equal protein loading, blots were incubated with antibodies against β-tubulin, Gapdh or histone H3 as shown in the figures.
Cell proliferation assays
Cell proliferation was monitored semiquantitatively by sodium 3′ [1-(phenyl-amino-carbonyl)-3,4-tetrazoliu]-bis(4-methoxy-6-nitro)-benzene sulphonic acid hydrate (XTT)-based colorimetric assay (Roche) or by alamarBlue assay (TREK Diagnostic) in 96-well plates. In all, 500 cells were seeded into each well of the 96-well plates in a volume of 100 μl. All assays were performed in triplicate and independently repeated at least once. To evaluate anchorage-independent cell growth, the 96-well plates were coated with poly-2-hydroxyethyl methacrylate (poly-HEME; Sigma-Aldrich) before cell seeding. We added 75 μl of a 5-μg/ml poly-HEME stock solution dissolved in 95% ethanol to each well and allowed the plates to dry for 72 h at 37°C. Cell growth was determined in cultures on non-coated and coated wells after 24, 48 and 72 h. Formazane formation through cleavage of the tetrazolium salt in metabolically active cells was determined by measuring the optical density in a spectrophotometer at 490 nm for XTT assays. The optical density of alamarBlue assays was determined at 600 nm. The statistical significance of measurements was calculated using the program GraphPadPrism 5.01 (GraphPad Software) with one-way ANOVA and Tukey tests.
Cell-cycle analysis
Trypsinized cells were denatured in cold 70% ethanol overnight, pelleted by centrifugation and resuspended in PBS supplemented with 0.1% Triton X/0.5% BSA and incubated with 10 mg/ml RNase at 37°C for 30 min. After centrifugation, the pellet was resuspended in dilution puffer and incubated with 20 μg/ml propidium iodide at room temperature in the dark for 20 min. DNA histograms were recorded in an FACSCalibur flow cytometer (BD Biosciences). The raw data were analysed with the programs Cylchred and WinMDI 2.8 (Joseph Trotter, San Diego, USA).
Wound closure (scratch) assay
RAS-ROSE cells were transienly transfected with siRNA in 10 cm dishes (BD Falcon). To obtain a confluent monolayer, 4 × 10⁵ cells were replated after 24 h into single wells of six-well plates (BD Falcon) containing standard medium. After the cells had attached to the plates, the medium was replaced by serum-reduced medium (1% FCS). Forty-eight hours after the last transfection, the monolayers were wounded by scratching cells off the dish using a 100-μl plastic pipet tip. The plates were washed with PBS to remove non-adherent cells. Cell migration was documented by phase-contrast microscopy at 40-fold (Keyence BZ-8000, Keycence) or 100-fold (Leica DMIL, Leica Microsystems) magnification after several time intervals for up to 36 h after wounding the monolayer. The wound area in pixels was determined manually using the ImageJ analytic software (http://rsbweb.nih.gov/ij/) and with custom software that automatically segmented the image using a texture filter (rangefilt) of the MATLAB image processing toolbox, which gave indistinguishable results. A migration index was calculated using the following formula: (area of fresh wound−area after xy h)/xy h=pixels/h.
Design and preparation of the tailored microarray representing transcriptional targets of the RAS signalling pathway
The RAS signalling target array comprises 329 gene probes and was designed and produced essentially as described (Tchernitsa et al, 2005; Tchernitsa et al, 2006). Briefly, for assembling probes on the microarray we selected Ras pathway target genes recovered from subtracted cDNA libraries representing differentially expressed genes in KRAS-transformed ROSE 199 cells versus their pre-neoplastic precursors (Tchernitsa et al, 2004) and in HRAS-transformed 208F cells versus non-tumorigenic precursors (Zuber et al, 2000). Differential expression of all targets was independently confirmed by conventional northern analysis. The set of validated target genes was complemented with probes related to canonical Ras pathway targets previously described and with 13 different housekeeping genes as described in different tissues and cell lines.
70-mer DNA oligonucleotides were designed as probes with open source software (http://oligo.lnatools.com/expression/) by choosing the following parameters: LNA frequency=0, melting temperature 74–76°C, GC content 45–55%, absence of strong secondary structures and proximity to 3′ end of coding sequence. Unmodified oligonucleotides were synthesized at 50 nmol scale (Illumina). Before oligonucleotide spotting, Super Frost glass slides (Menzel GmbH) were soaked in 200 ml of washing solution containing 80 ml of 5 M NaOH and 120 ml of 95% ethanol for 5–6 h. Slides were washed 10 times with 200 ml of ddH2O, incubated for 30 min on a shaker with 20 ml of poly-L-lysine (Sigma-Aldrich) solution, mixed with 160 ml of ddH2O, filtered and washed again 10 times with 200 ml of ddH2O. Afterwards, the remaining washing solution was removed by centrifugation of slides in a microarray centrifuge (Telechem). The slides were dried for 2 h at 45°C. The oligonucleotides were adjusted to a concentration of 20 μM in 3 × SSC/0.01% SDS buffer and spotted using a MicroGrid compact microarrayer (Genomic Solutions) equipped with MicroSpot 2500 quill pins. The pins had a diameter of 100 μm and typically delivered spot diameters of 180 μm. Microarrays were printed at a relative humidity of 50–60%. Pins were rinsed twice in distilled water between each probe aspiration/dispense cycle. The fabricated microarrays contained a total of 1300 features due to spotting each oligonucleotide at three different positions on the slides. After printing, microarrays were rehydrated twice by placing them over boiling water for 5 s each, snap-dried on a hot plate (90°C) for 10 s with the DNA side pointing upwards and cross-linked with an intensity of 60 mJ (UVC-500 cross-linker; Hoefer). Afterwards, slides were incubated in blocking solution (3.2 g of succinic anhydride mixed with 200 ml of N-methyl-pyrolidone and 4.45 ml of 1 M sodium borate) for 20 min on an orbital shaker, rinsed three times with ddH2O and dried by centrifugation.
RNA extraction, labelling and customized microarray hybridization
We applied dendrimer technology for cDNA labelling using the 3DNA Array 900 MPX Kit for Microarray (Genisphere). Two samples of cDNA were synthesized from 4 μg of each target RNA by reverse transcription with random primers which contained capture sequences complimentary to capture reagents carrying Cy3- or Cy5-fluorescent dyes, respectively. The cDNA samples carrying the appropriate capture sequences were mixed in the following combinations: cDNAs from ROSE cells with RAS-ROSE cells, RAS-ROSE treated with scrambled siRNA/RAS-ROSE transiently transfected with siRNA targeting transcription factor mRNA, respectively. For control hybridizations, we mixed cDNAs from RAS-ROSE transfected with scrambled siRNA and cDNAs from RAS-ROSE cells transfected with the transfection reagent only. The second round of hybridization was performed in a reaction mix containing equal amounts of 3DNA capture Reagent Cy3 and 3DNA Capture Reagent Cy5. The composition of the reaction mixes, hybridization and washing conditions were as described by the kit manufacturer.
Customized microarray evaluation
Microarray images were obtained on an Agilent G2565AA scanner at 10 μm resolution. Image analysis was performed using ImaGene software (BioDiscovery). For each target RNA, we performed two independent hybridizations by inverting the Cy3 and Cy5 fluorescent dyes in the labelling reactions (dye swap). A global normalization procedure that takes into account the entire fluorescence intensity of each microarray was performed. Imagene software was used for feature extraction. The statistical significance was determined using the SAM (Statistical Analysis of Microarrays) algorithm (Tusher et al, 2001). The complete microarray data set was converted into text files and analysed with the hierarchical clustering explorer program (version 3.0, University of Maryland, USA). The specific parameter settings were row-by-row, normalization and average linkage.
Accession number, customized array data is GSE 24668.
Whole genome microarray analysis
Labelling of RNA targets, hybridization and post-hybridization procedures for Affymetrix microarrays were essentially as previously described (Jurchott et al, 2010). Normalization and determining the expression values were done using Robust Multi-array Average (RMA) available in the bioconductor R-package. We determined RAS target genes on a genome-wide scale by measuring gene expression for ROSE cells and RAS-ROSE cells using Affymetrix Rat 230 V2 Gene Chips. We defined differential expression as a log2-fold change of 1 or more. To determine the effects of knockdowns on gene expression, we interrogated Rat Gene 1.0 ST oligonucleotide microarrays (Affymetrix) with the same RNA as used for Ras target microarray analysis. These arrays were analysed using the bioconductor oligo package, with RMA for normalization. To map probe sets to genes, we used the xmapcore database available at bioconductor and used Ensembl IDs for representing genes.
Accession numbers are GSE 38584 and 38585.
Model construction and evaluation
The global response matrix R was calculated from the experimentally determined perturbation data (depicted in Figure 3A). R quantifies the relative change in one node of the network in response to a change of another node: Rij=xj/xi dxi/dxj, with xi and xj being the steady-state value of the observed and perturbed node, respectively. The rows of this matrix R were defined by the perturbation (overexpression of mutated RAS, treatment with small-molecule inhibitors, siRNA-mediated silencing of transcription factors). The rows denote the mRNA and protein responses. Each response coefficient was then approximated by: Rij=2 (xj(perturbed)−xj(unperturbed))/(xj(perturbed)+xj(unperturbed)), with xj being the mRNA or protein levels before and after perturbation (see Kholodenko et al, 2002). Note that these values do not represent global response coefficients, but only an approximation, where each row is scaled by the perturbation strength. MRA (see Kholodenko et al, 2002) estimates the direct effects of one node on another (i.e., the network structure) based on the experimentally accessible global response matrix (which contains a superposition of direct and indirect perturbation effects). The network interactions are quantified by a so-called local response coefficients, rij=xj/xi δxi/δxj (note that rij quantifies direct network interactions only, while Rij represents a superposition of local and network propagation effects). The matrix of local response coefficients r, which is a square matrix and can be interpreted as an weighted adjacency matrix of the network graph with ones in the diagonal, zeros if there is no direct interaction, and non-zero elements when there are direct interactions. In standard MRA, r can be determined by inverting R and subsequent normalization (see Kholodenko et al, 2002). However, in our case, the matrix R was not a square matrix: more nodes were measured than perturbed, and transcription factors were perturbed by different siRNAs each, which we did not pool but kept separate, and consequently R could not be inverted. Thus, we used a maximum likelihood approach that estimates the most likely values of the local response matrix r that give rise to the observed experimental data in the matrix R. From MRA, it follows that the scaled data matrix R can be predicted from r by: (−r−1)s p, where s indicates that only rows of the inverse are taken that have been measured, and p is a matrix that contains row-wise the strength of the perturbation that was applied. Since the perturbation strength is also unknown, we estimated r and p by minimizing the (weighted) squared difference between the predicted response (−r−1)s p and the measured response R. The cost function Σ((r−1)s−pR)ij2 was minimized numerically using a Levenberg-Marquardt optimization algorithm. Mathematical modelling often faces a trade-off between model complexity and predictive power: large models generally provide a better fit to experimental data, but the ability to make reliable predictions vanishes as the number of parameters becomes too large (‘overfitting’). We therefore sought to derive a minimal essential model of the Ras-regulated transcription factor network. To this end, we systematically tested model variants of different complexities (allowing different numbers of network interactions rij to be non-zero), and compared their ability to fit the experimental observations. An iterative greedy hill-climbing approach was taken by first setting all values of r (except for the diagonal values, which were fixed to −1) to 0, and iteratively adding the additional edges, which improved the model fit mostly. Thereby more links were added to the model until no significant improvement of the model fit was seen any more (P<0.05, using likelihood-ratio test, assuming an error in R of 0.4 in each value of the global response matrix of R).
We observed in simulated data that this algorithm often found ‘shortcuts’, for example, if the correct network is A→B→C, the algorithm often identified A→C first and only later it identified A→B and B→C. In order to remove such shortcuts, links were iteratively removed until the model fit turned significantly worse (P<0.05, likelihood-ratio test). At the end, all values in r that were <0.2 were discarded as they result in effects below the noise level, and would be biologically not important. The entire algorithm was written in the C++ programming language. Matrix inversion was performed by calculating the pseudo-inverse using singular value decomposition (function gesdd from blas library, http://www.netlib.org/blas/). Minimization was done using a Levenberg-Marquardt optimization algorithm (LEVMAR library version 2.3, Manolis Lourakis, http://www.netlib.org/blas/). Simulations were performed by inverting the resulting matrix r and multiplying it with a perturbation vector p using the packages R (http://www.r-project.org/) and matlab (Mathworks). Ectopic overexpression had two effects: the mRNA level was elevated and the promoter became independent of the levels of other nodes in the network. We simulated this using a positive entry in the perturbation vector p and removed all entries in the local response matrix r in the respective column. Perturbation strength for simulation was −2 for Otx knockdown, 5 for overexpression of Fosl1 and −3 for U0126 treatment.
Supplementary Material
Supplementary figures S1-9, Supplementary tables S1-3
Acknowledgments
We thank Sabine Bobbe for excellent technical help. Our work was supported by the Collaborative Research Center (SFB) 618 (grants to NB, CS, HH and RS), BMBF grants NGFN2 (RS), ColoNet (RS, CS, NB and HH), FORSYS (NB) and Virtual Liver (SL).
Author contributions: IS-K performed pertubation experiments and analysed transcription factor expression, signalling and cellular phenotypes. SL, NB, HH and BK developed and tested the mathematical model. OT designed the customized microarrays. FW evaluated scratch assays, CS and RS developed the rat ovarian epithelial cancer model and contributed transcriptome data. IS-K, SL, NB and RS wrote the manuscript. NB and RS designed the study and incorporated comments and suggestions from all authors, coordinated experiments and mathematical modelling.
Footnotes
The authors declare that they have no conflict of interest.
References
- Adams AT, Auersperg N (1981) Transformation of cultured rat ovarian surface epithelial cells by Kirsten murine sarcoma virus. Cancer Res 41: 2063–2072 [PubMed] [Google Scholar]
- Adams AT, Auersperg N (1985) A cell line, ROSE 199, derived from normal rat ovarian surface epithelium. Exp Cell Biol 53: 181–188 [DOI] [PubMed] [Google Scholar]
- Avraham R, Sas-Chen A, Manor O, Steinfeld I, Shalgi R, Tarcic G, Bossel N, Zeisel A, Amit I, Zwang Y, Enerly E, Russnes HG, Biagioni F, Mottolese M, Strano S, Blandino G, Borresen-Dale AL, Pilpel Y, Yakhini Z, Segal E et al. (2010) EGF decreases the abundance of microRNAs that restrain oncogenic transcription factors. Sci Signal 3: ra43. [DOI] [PubMed] [Google Scholar]
- Basseres DS, Ebbs A, Levantini E, Baldwin AS (2010) Requirement of the NF-kappaB subunit p65/RelA for K-Ras-induced lung tumorigenesis. Cancer Res 70: 3537–3546 [DOI] [PMC free article] [PubMed] [Google Scholar]
- Battista S, de NF, Fedele M, Chiappetta G, Scala S, Vallone D, Pierantoni GM, Mega T, Santoro M, Viglietto G, Verde P, Fusco A (1998) Increase in AP-1 activity is a general event in thyroid cell transformation in vitro and in vivo. Oncogene 17: 377–385 [DOI] [PubMed] [Google Scholar]
- Berns K, Hijmans EM, Mullenders J, Brummelkamp TR, Velds A, Heimerikx M, Kerkhoven RM, Madiredjo M, Nijkamp W, Weigelt B, Agami R, Ge W, Cavet G, Linsley PS, Beijersbergen RL, Bernards R (2004) A large-scale RNAi screen in human cells identifies new components of the p53 pathway. Nature 428: 431–437 [DOI] [PubMed] [Google Scholar]
- Bhalla US, Iyengar R (1999) Emergent properties of networks of biological signaling pathways. Science 283: 381–387 [DOI] [PubMed] [Google Scholar]
- Bluthgen N, Legewie S, Kielbasa SM, Schramme A, Tchernitsa O, Keil J, Solf A, Vingron M, Schafer R, Herzel H, Sers C (2009) A systems biological approach suggests that transcriptional feedback regulation by dual-specificity phosphatase 6 shapes extracellular signal-related kinase activity in RAS-transformed fibroblasts. FEBS J 276: 1024–1035 [DOI] [PubMed] [Google Scholar]
- Breccia M, Frustaci AM, Cannella L, Soverini S, Stefanizzi C, Federico V, Grammatico S, Santopietro M, Alimena G (2009) Sequential development of mutant clones in an imatinib resistant chronic myeloid leukaemia patient following sequential treatment with multiple tyrosine kinase inhibitors: an emerging problem? Cancer Chemother Pharmacol 64: 195–197 [DOI] [PubMed] [Google Scholar]
- Brem R, Certa U, Neeb M, Nair AP, Moroni C (2001) Global analysis of differential gene expression after transformation with the v-H-ras oncogene in a murine tumor model. Oncogene 20: 2854–2858 [DOI] [PubMed] [Google Scholar]
- Busch AC, Scheffer C, Basson AH (2009) Development and testing of a prototype reflex measurement system employing artificial neural networks. Comput Methods Programs Biomed 94: 15–25 [DOI] [PubMed] [Google Scholar]
- Busch H, Camacho-Trullio D, Rogon Z, Breuhahn K, Angel P, Eils R, Szabowski A (2008) Gene network dynamics controlling keratinocyte migration. Mol Syst Biol 4: 199. [DOI] [PMC free article] [PubMed] [Google Scholar]
- Cantone I, Marucci L, Iorio F, Ricci MA, Belcastro V, Bansal M, Santini S, di BM, di BD, Cosma MP (2009) A yeast synthetic network for in vivo assessment of reverse-engineering and modeling approaches. Cell 137: 172–181 [DOI] [PubMed] [Google Scholar]
- Casalino L, Bakiri L, Talotta F, Weitzman JB, Fusco A, Yaniv M, Verde P (2007) Fra-1 promotes growth and survival in RAS-transformed thyroid cells by controlling cyclin A transcription. EMBO J 26: 1878–1890 [DOI] [PMC free article] [PubMed] [Google Scholar]
- Casalino L, De Cesare D, Verde P (2003) Accumulation of Fra-1 in ras-transformed cells depends on both transcriptional autoregulation and MEK-dependent posttranslational stabilization. Mol Cell Biol 23: 4401–4415 [DOI] [PMC free article] [PubMed] [Google Scholar]
- Cleynen I, Van de Ven WJ (2008) The HMGA proteins: a myriad of functions (Review). Int J Oncol 32: 289–305 [PubMed] [Google Scholar]
- Corcoran RB, Settleman J, Engelman JA (2011) Potential therapeutic strategies to overcome acquired resistance to BRAF or MEK inhibitors in BRAF mutant cancers. Oncotarget 2: 336–346 [DOI] [PMC free article] [PubMed] [Google Scholar]
- de HT, Oussoren E, Grajkowska W, Perek-Polnik M, Popovic M, Zadravec-Zaletel L, Perera M, Corte G, Wirths O, van SP, Pietsch T, Troost D, Baas F, Versteeg R, Kool M (2006) OTX1 and OTX2 expression correlates with the clinicopathologic classification of medulloblastomas. J Neuropathol Exp Neurol 65: 176–186 [DOI] [PubMed] [Google Scholar]
- DiFeo A, Narla G, Hirshfeld J, Camacho-Vanegas O, Narla J, Rose SL, Kalir T, Yao S, Levine A, Birrer MJ, Bonome T, Friedman SL, Buller RE, Martignetti JA (2006) Roles of KLF6 and KLF6-SV1 in ovarian cancer progression and intraperitoneal dissemination. Clin Cancer Res 12: 3730–3739 [DOI] [PubMed] [Google Scholar]
- Dwivedi PP, Anderson PH, Tilley WD, May BK, Morris HA (2007) Role of oncoprotein growth factor independent-1 (GFI1) in repression of 25-hydroxyvitamin D 1alpha-hydroxylase (CYP27B1): a comparative analysis in human prostate cancer and kidney cells. J Steroid Biochem Mol Biol 103: 742–746 [DOI] [PubMed] [Google Scholar]
- Finco TS, Westwick JK, Norris JL, Beg AA, Der CJ, Baldwin AS Jr (1997) Oncogenic Ha-Ras-induced signaling activates NF-kappaB transcriptional activity, which is required for cellular transformation. J Biol Chem 272: 24113–24116 [DOI] [PubMed] [Google Scholar]
- Fritsche-Guenther R, Witzel F, Sieber A, Herr R, Schmidt N, Braun S, Brummer T, Sers C, Bluthgen N (2011) Strong negative feedback from Erk to Raf confers robustness to MAPK signalling. Mol Syst Biol 7: 489. [DOI] [PMC free article] [PubMed] [Google Scholar]
- Gardner TS, di BD, Lorenz D, Collins JJ (2003) Inferring genetic networks and identifying compound mode of action via expression profiling. Science 301: 102–105 [DOI] [PubMed] [Google Scholar]
- Goentoro L, Shoval O, Kirschner MW, Alon U (2009) The incoherent feedforward loop can provide fold-change detection in gene regulation. Mol Cell 36: 894–899 [DOI] [PMC free article] [PubMed] [Google Scholar]
- Grimes HL, Chan TO, Zweidler-McKay PA, Tong B, Tsichlis PN (1996) The Gfi-1 proto-oncoprotein contains a novel transcriptional repressor domain, SNAG, and inhibits G1 arrest induced by interleukin-2 withdrawal. Mol Cell Biol 16: 6263–6272 [DOI] [PMC free article] [PubMed] [Google Scholar]
- Jurchott K, Kuban RJ, Krech T, Bluthgen N, Stein U, Walther W, Friese C, Kielbasa SM, Ungethum U, Lund P, Knosel T, Kemmner W, Morkel M, Fritzmann J, Schlag PM, Birchmeier W, Krueger T, Sperling S, Sers C, Royer HD et al. (2010) Identification of Y-box binding protein 1 as a core regulator of MEK/ERK pathway-dependent gene signatures in colorectal cancer cells. PLoS Genet 6: e1001231. [DOI] [PMC free article] [PubMed] [Google Scholar]
- Kanzler B, Viallet JP, Le MH, Boncinelli E, Duboule D, Dhouailly D (1994) Differential expression of two different homeobox gene families during mouse tegument morphogenesis. Int J Dev Biol 38: 633–640 [PubMed] [Google Scholar]
- Karin M, Cao Y, Greten FR, Li ZW (2002) NF-kappaB in cancer: from innocent bystander to major culprit. Nat Rev Cancer 2: 301–310 [DOI] [PubMed] [Google Scholar]
- Karnoub AE, Weinberg RA (2008) Ras oncogenes: split personalities. Nat Rev Mol Cell Biol 9: 517–531 [DOI] [PMC free article] [PubMed] [Google Scholar]
- Kholodenko BN, Kiyatkin A, Bruggeman FJ, Sontag E, Westerhoff HV, Hoek JB (2002) Untangling the wires: a strategy to trace functional interactions in signaling and gene networks. Proc Natl Acad Sci USA 99: 12841–12846 [DOI] [PMC free article] [PubMed] [Google Scholar]
- Legewie S, Herzel H, Westerhoff HV, Bluthgen N (2008) Recurrent design patterns in the feedback regulation of the mammalian signalling network. Mol Syst Biol 4: 190. [DOI] [PMC free article] [PubMed] [Google Scholar]
- Lerebours F, Vacher S, Andrieu C, Espie M, Marty M, Lidereau R, Bieche I (2008) NF-kappa B genes have a major role in inflammatory breast cancer. BMC Cancer 8: 41. [DOI] [PMC free article] [PubMed] [Google Scholar]
- Livak KJ, Schmittgen TD (2001) Analysis of relative gene expression data using real-time quantitative PCR and the 2(−Delta Delta C(T)) Method. Methods 25: 402–408 [DOI] [PubMed] [Google Scholar]
- Longley DB, Johnston PG (2005) Molecular mechanisms of drug resistance. J Pathol 205: 275–292 [DOI] [PubMed] [Google Scholar]
- Madar A, Greenfield A, Ostrer H, Vanden Eijnden E, Bonneau R (2009) The Inferelator 2.0: a scalable framework for reconstruction of dynamic regulatory network models. Conf Proc IEEE Eng Med Biol Soc 2009: 5448–5451 [DOI] [PubMed] [Google Scholar]
- Madrid LV, Wang CY, Guttridge DC, Schottelius AJ, Baldwin AS Jr, Mayo MW (2000) Akt suppresses apoptosis by stimulating the transactivation potential of the RelA/p65 subunit of NF-kappaB. Mol Cell Biol 20: 1626–1638 [DOI] [PMC free article] [PubMed] [Google Scholar]
- Malek A, Bakhidze E, Noske A, Sers C, Aigner A, Schäfer R, Tchernitsa OI (2008) HMGA2 gene is a promising target for ovarian cancer silencing therapy. Int J Cancer 123: 348–356 [DOI] [PubMed] [Google Scholar]
- Margolin AA, Nemenman I, Basso K, Wiggins C, Stolovitzky G, Dalla FR, Califano A (2006) ARACNE: an algorithm for the reconstruction of gene regulatory networks in a mammalian cellular context. BMC Bioinformatics 20: 7 Suppl 1 S7. [DOI] [PMC free article] [PubMed] [Google Scholar]
- Mechta F, Lallemand D, Pfarr CM, Yaniv M (1997) Transformation by ras modifies AP1 composition and activity. Oncogene 14: 837–847 [DOI] [PubMed] [Google Scholar]
- Milde-Langosch K (2005) The Fos family of transcription factors and their role in tumourigenesis. Eur J Cancer 41: 2449–2461 [DOI] [PubMed] [Google Scholar]
- Murphy LO, Smith S, Chen RH, Fingar DC, Blenis J (2002) Molecular interpretation of ERK signal duration by immediate early gene products. Nat Cell Biol 4: 556–564 [DOI] [PubMed] [Google Scholar]
- Narla G, DiFeo A, Reeves HL, Schaid DJ, Hirshfeld J, Hod E, Katz A, Isaacs WB, Hebbring S, Komiya A, McDonnell SK, Wiley KE, Jacobsen SJ, Isaacs SD, Walsh PC, Zheng SL, Chang BL, Friedrichsen DM, Stanford JL, Ostrander EA et al. (2005) A germline DNA polymorphism enhances alternative splicing of the KLF6 tumor suppressor gene and is associated with increased prostate cancer risk. Cancer Res 65: 1213–1222 [DOI] [PubMed] [Google Scholar]
- Paddison PJ, Silva JM, Conklin DS, Schlabach M, Li M, Aruleba S, Balija V, O’Shaughnessy A, Gnoj L, Scobie K, Chang K, Westbrook T, Cleary M, Sachidanandam R, McCombie WR, Elledge SJ, Hannon GJ (2004) A resource for large-scale RNA-interference-based screens in mammals. Nature 428: 427–431 [DOI] [PubMed] [Google Scholar]
- Santos SD, Verveer PJ, Bastiaens PI (2007) Growth factor-induced MAPK network topology shapes Erk response determining PC-12 cell fate. Nat Cell Biol 9: 324–330 [DOI] [PubMed] [Google Scholar]
- Schaffner W, Weissmann C (1973) A rapid and sensitive method for the determination of protein in dilute solution. Anal Biochem 56: 502–514 [DOI] [PubMed] [Google Scholar]
- Schmidt M, Lipson H (2009) Distilling free-form natural laws from experimental data. Science 324: 81–85 [DOI] [PubMed] [Google Scholar]
- Suzuki H, Forrest AR, van NE, Daub CO, Balwierz PJ, Irvine KM, Lassmann T, Ravasi T, Hasegawa Y, de Hoon MJ, Katayama S, Schroder K, Carninci P, Tomaru Y, Kanamori-Katayama M, Kubosaki A, Akalin A, Ando Y, Arner E, Asada M et al. (2009) The transcriptional network that controls growth arrest and differentiation in a human myeloid leukemia cell line. Nat Genet 41: 553–562 [DOI] [PMC free article] [PubMed] [Google Scholar]
- Tchernitsa OI, Sers C, Geflitter A, Schafer R (2005) Effects of ras signaling on gene expression analyzed by customized microarrays. Methods Enzymol 407: 373–387 [DOI] [PubMed] [Google Scholar]
- Tchernitsa OI, Sers C, Geflitter A, Schäfer R (2006) Oligonucleotide microarrays for studying the effects of Ras signal transduction on the genetic program. Signal Transduction 6: 209–218 [Google Scholar]
- Tchernitsa OI, Sers C, Zuber J, Hinzmann B, Grips M, Schramme A, Lund P, Schwendel A, Rosenthal A, Schafer R (2004) Transcriptional basis of KRAS oncogene-mediated cellular transformation in ovarian epithelial cells. Oncogene 23: 4536–4555 [DOI] [PubMed] [Google Scholar]
- Tusher VG, Tibshirani R, Chu G (2001) Significance analysis of microarrays applied to the ionizing radiation response. Proc Natl Acad Sci USA 98: 5116–5121 [DOI] [PMC free article] [PubMed] [Google Scholar]
- Vallone D, Battista S, Pierantoni GM, Fedele M, Casalino L, Santoro M, Viglietto G, Fusco A, Verde P (1997) Neoplastic transformation of rat thyroid cells requires the junB and fra-1 gene induction which is dependent on the HMGI-C gene product. EMBO J 16: 5310–5321 [DOI] [PMC free article] [PubMed] [Google Scholar]
- van Dam H., Castellazzi M (2001) Distinct roles of Jun: Fos and Jun: ATF dimers in oncogenesis. Oncogene 20: 2453–2464 [DOI] [PubMed] [Google Scholar]
- Verde P, Casalino L, Talotta F, Yaniv M, Weitzman JB (2007) Deciphering AP-1 function in tumorigenesis: fra-ternizing on target promoters. Cell Cycle 6: 2633–2639 [DOI] [PubMed] [Google Scholar]
- Watanabe S, Ueda Y, Akaboshi S, Hino Y, Sekita Y, Nakao M (2009) HMGA2 maintains oncogenic RAS-induced epithelial-mesenchymal transition in human pancreatic cancer cells. Am J Pathol 174: 854–868 [DOI] [PMC free article] [PubMed] [Google Scholar]
- Yea S, Narla G, Zhao X, Garg R, Tal-Kremer S, Hod E, Villanueva A, Loke J, Tarocchi M, Akita K, Shirasawa S, Sasazuki T, Martignetti JA, Llovet JM, Friedman SL (2008) Ras promotes growth by alternative splicing-mediated inactivation of the KLF6 tumor suppressor in hepatocellular carcinoma. Gastroenterology 134: 1521–1531 [DOI] [PMC free article] [PubMed] [Google Scholar]
- Zuber J, Tchernitsa OI, Hinzmann B, Schmitz AC, Grips M, Hellriegel M, Sers C, Rosenthal A, Schafer R (2000) A genome-wide survey of RAS transformation targets. Nat Genet 24: 144–152 [DOI] [PubMed] [Google Scholar]
Associated Data
This section collects any data citations, data availability statements, or supplementary materials included in this article.
Supplementary Materials
Supplementary figures S1-9, Supplementary tables S1-3