

Abstract
The transcription factor NF-E2-related factor 2 (Nrf2) is a master regulator of a genetic program, termed the phase 2 response, that controls redox homeostasis and participates in multiple aspects of physiology and pathology. Nrf2 protein stability is regulated by two E3 ubiquitin ligase adaptors, Keap1 and β-TrCP, the latter of which was only recently reported. Here, two-dimensional (2D) gel electrophoresis and site-directed mutagenesis allowed us to identify two serines of Nrf2 that are phosphorylated by glycogen synthase kinase 3β (GSK-3β) in the sequence DSGISL. Nuclear magnetic resonance studies defined key residues of this phosphosequence involved in docking to the WD40 propeller of β-TrCP, through electrostatic and hydrophobic interactions. We also identified three arginine residues of β-TrCP that participate in Nrf2 docking. Intraperitoneal injection of the GSK-3 inhibitor SB216763 led to increased Nrf2 and heme oxygenase-1 levels in liver and hippocampus. Moreover, mice with hippocampal absence of GSK-3β exhibited increased levels of Nrf2 and phase 2 gene products, reduced glutathione, and decreased levels of carbonylated proteins and malondialdehyde. This study establishes the structural parameters of the interaction of Nrf2 with the GSK-3/β-TrCP axis and its functional relevance in the regulation of Nrf2 by the signaling pathways that impinge on GSK-3.
INTRODUCTION
Organisms have developed complex defense mechanisms to control damage produced by harmful endogenous and exogenous agents. In recent years it has become apparent that the transcription factor NF-E2-related factor 2 (Nrf2) plays a central role in controlling both intrinsic and inducible resistance to oxidants and electrophiles (43). Nrf2 was initially reported as a cap'n'collar basic-region leucine zipper transcription factor that controls the expression of drug metabolism genes that contain antioxidant response elements (ARE) in their promoter regions (15, 48). Nrf2 is now considered a master regulator of redox homeostasis, which controls the expression of over 100 genes involved in defense against reactive oxygen species and electrophiles.
In common with other transcription factors involved in protection against stress, such as hypoxia-inducible factor 1α (HIF1α), heat shock factor (HSF), ATF4, and NF-κB, basal activity of Nrf2 is restricted to low levels. Indeed, high constitutive Nrf2 activity has been observed only in some tumors, where it is associated with increased cell proliferation and resistance to chemotherapeutic drugs. Thus, in a proportion of lung cancers, high Nrf2 activity is due to somatic mutations that enable this factor to evade, at least partially, degradation through the ubiquitin-proteasome pathway (13, 46).
Nrf2 is principally controlled through regulation of protein turnover by the ubiquitin-proteasome system, exhibiting a half-life of about 30 min. More than 100 different protein adaptors mediate the interaction of a few E3 ubiquitin ligases with their substrates. These adaptors confer selectivity to the process by their ability to recognize unique sequences in the target protein that are required for degradation (i.e., degrons). Many of these cis-acting sequences contain several Ser or Thr residues that need to be phosphorylated in order to create a phosphodegron that can then be recognized by the adaptor E3 ligase protein. In other cases, the phosphorylated Ser or Thr residues may be replaced with negatively charged amino acids that form a permanent docking site for their appropriate E3 ligase adaptor protein. The Nrf2 protein appears to be controlled through both degron and phosphodegron sequences. It is constitutively recognized by the substrate adaptor Keap1 in its N-terminal Neh2 domain and presented for Cul3 (cullin-3)-based E3 ligase ubiquitination and proteasomal degradation (6, 10, 21, 22, 26, 28, 47, 54). Keap1 is inhibited by thiol-reactive compounds, and upon exposure to such stressors, Keap1-mediated ubiquitination of Nrf2 by Cul3 ceases to occur. While this model explains how Nrf2 is upregulated by soft electrophiles other regulatory mechanisms must exist because Nrf2 is abundant in metabolically active tissues regardless of Keap1 levels (4), and it is influenced by growth factor signaling through a Keap1-independent mechanism.
Recently we reported the existence of a previously unrecognized phosphodegron in Nrf2 that requires the concerted action of glycogen synthase kinase 3 (GSK-3) isoform α or β and the E3 ligase adaptor β-transducin repeat-containing protein (38). (Note that there are two mammalian β-TrCP paralogues, β-TrCP1 and β-TrCP2, which possess similar properties. In this paper we employ the general term β-TrCP unless specific experimental details are described.) In particular, we provided evidence that GSK-3α or -β might phosphorylate Nrf2 somewhere within a cluster of Ser residues in the Neh6 domain of Nrf2 that overlaps with a putative destruction motif for β-TrCP. However, the specific residues that are phosphorylated by GSK-3 or the residues that interact with β-TrCP have not been identified. Also, the functional consequences of this degradation pathway are not known. In the present study, we characterized the Ser residues that are phosphorylated by GSK-3β to create the β-TrCP-dependent phosphodegron. By using a combination of transfer nuclear magnetic resonance (NMR) and docking experiments (37), we have identified the phosphorylated residues of Nrf2 that contact specific amino acids that comprise the binding pocket in the WD40 propeller of β-TrCP. Finally, we show that the expression of Nrf2 target genes is increased in the hippocampi of mice that lack GSK-3β.
MATERIALS AND METHODS
Neuron-specific GSK-3β knockout mice.
Mice with postnatal neuronal deficiency of GSK-3β were generated by the Cre/lox system as described previously (18). Transgenic mice with the GSK-3β gene flanked by loxP sites were crossed with mice expressing Cre recombinase under the Thy1 gene promoter. Mice with two floxed GSK-3β alleles but not expressing Cre recombinase (−Cre mice) were used as controls for the double-transgenic mice that express Cre recombinase (+Cre mice) and that lack both GSK-3β alleles postnatally and only in neurons (18). All experiments were approved by the KU Leuven ethical commission, according to institutional Belgian and European guidelines (European Council Directives 86/609/EEC and 2003/65/EC). Animals were anesthetized with 8 mg/kg ketamine and 1.2 mg/kg xylazine and, depending on the experiment, perfused with 4% paraformaldehyde for immunohistochemistry analysis or sacrificed by cervical dislocation, and the hippocampus was rapidly frozen at −80°C for RNA and protein analysis.
Drug administration and tissue processing.
Three-month-old male C57BL/6 mice were intraperitoneally injected with five doses of 10 mg/kg SB216763 dissolved in 10% dimethyl sulfoxide (DMSO) in saline buffer at 1-hour intervals. The control group was injected with vehicle (10% DMSO in saline) using the same schedule. We also included positive-control mice injected with a single dose of 50 mg/kg sulforaphane (SFN) for 1 h. Hippocampi and livers from both groups were dissected after 6 h and processed for immunoblot analysis. Briefly, 100 mg of liver was homogenized using a Polytron homogenizer in 0.4 ml of cold lysis buffer (50 mM HEPES [pH 7.4], 1% Triton X-100, 50 mM NaPPi, 0.1 M NaF, 10 mM EDTA, 10 mM Na3VO4, 1 mM phenylmethylsulfonyl fluoride, and 1 μg/ml leupeptin). After 30 min in ice, the samples were centrifuged at 80,000 g and 4°C during 1 h. Supernatants were analyzed by immunoblotting. Hippocampi were homogenized in 0.2 ml of cold radioimmunoprecipitation assay (RIPA) buffer (25 mM Tris-HCl [pH 7.6], 150 mM NaCl, 1 mM EGTA, 1% NP-40, 1% sodium deoxycholate, 0.1% sodium dodecyl sulfate [SDS], 0.1 M NaF, 10 mM EDTA, 10 mM Na3VO4, 1 mM phenylmethylsulfonyl fluoride, and 1 μg/ml leupeptin). Samples were sonicated after addition of loading buffer containing 2% SDS.
Reduced and oxidized glutathione levels.
Reduced glutathione (GSH) levels were measured using a fluorometric method according to reference 11. Hippocampal tissue samples were homogenized in 1 ml EDTA-phosphate buffer (pH 8.0) with 300 μl HPO3 (25%) and centrifuged at 3,000 × g for 15 min. Afterwards, 500 μl of supernatant was derivatized with 100 μl of o-phthalaldehyde. Mixtures were then incubated for 20 min at 25°C, and the amount of GSH was calculated by measuring the corresponding fluorescent signal in a Synergy HT fluorometer (Bio-Tek) at wavelengths of 350 nm (excitation) and 420 nm (emission). Total glutathione was evaluated by performing a reduction step of oxidized glutathione (GSSG). Briefly, 500 μl of sample was mixed with 100 μl of 25 mM dithiothreitol and incubated for 30 min at 40°C. The samples were centrifuged (5,000 × g, 10 min), and supernatants were used for derivatization. The GSSG concentration was obtained by subtracting experimental-GSH from whole-GSH values after the reduction step. Data were corrected for protein content.
Protein carbonyl content.
As previously described (31), hippocampal homogenates were incubated with 10% streptomycin sulfate to remove nucleic acids and centrifuged at 6,000 × g (4°C, 20 min). Supernatants were treated with 10 mM 2,4-dinitrophenylhydrazine (DNPH, in 2.5 M HCl) for 1 h at 25°C. After addition of 20% trichloroacetic acid, samples were centrifuged (3,000 × g, 4°C) for 10 min. Pellets were dissolved with 1 M guanidine hydrochloride (in phosphate buffer, pH 8.0) and centrifuged (5,000 × g, 4°C) for 5 min. Absorbance was measured in a spectrometer at 370 nm. Protein carbonyl content is expressed as nmol DNPH/mg protein using the molar absorption coefficient of DNPH (22,000 M−1 cm−1).
Malondialdehyde determination.
Lipid peroxidation was determined as the formation of thiobarbituric acid-reactive substances (TBA-RS), according to a previous report (12). Three hundred microliters of hippocampal homogenates was added to 500 μl of TBA reagent (0.375 g TBA, 7.5 g trichloroacetic acid, and 2.54 ml HCl) and incubated at 100°C for 30 min. A pink chromophore was produced in samples in direct relation to the amount of peroxidized products. Samples were then kept in ice for 5 min and centrifuged at 3,000 × g for 15 min. The optical density of the supernatants was measured in a spectrometer at 532 nm. The amount of TBA-RS (mostly malondialdehyde [MDA]) was calculated by interpolation of values in a constructed MDA standard curve with 1,1,3,3-tetrametoxypropane, and results were expressed as nanomoles of MDA per mg of protein.
Cell culture and reagents.
Human embryonic kidney 293T (HEK293T) cells were grown in Dulbecco's modified Eagle's medium (DMEM) supplemented with 10% fetal bovine serum and 80 μg/ml gentamicin. Transient transfections were performed with calcium phosphate, using reagents from Sigma-Aldrich (Madrid, Spain) or with TransFectin lipid reagent from Bio-Rad (Hercules, CA). SB216763 and MG132 were from Sigma-Aldrich. Sulforaphane (SFN) was from LKT Laboratories (Saint Paul, MN).
Transient transfection of MEFs and luciferase assay.
Immortalized mouse embryo fibroblasts (MEFs) from Nrf2-null mice (derived from Nrf2 knockout mice initially provided by Masayuki Yamamoto, Tohoku University, Sendai, Japan [15]) were maintained in Dulbecco's modified Eagle's medium supplemented with 15% bovine growth serum (HyClone, Waltham, MA) and 100 U/ml penicillin plus 0.1 mg/ml streptomycin. One day before transfection, immortalized Nrf2-null MEFs were seeded at 80% confluence in 24-well plates. Transient transfection was performed with the GenJet in vitro DNA transfection reagent (Signagen Laboratories, Gaithersburg, MD) following the manufacturer's instructions. Expression vectors were pTK-Renilla (Promega), ARE-Luc (which was described previously [27]), and the indicated Nrf2 and GSK-3β mutant versions in Fig. 5B. After a 48-h recovery from transfection, the cells were lysed and assayed for luciferase activity with a dual-luciferase assay system (Promega). Relative light units were measured in a GloMax 96 microplate luminometer with dual injectors (Promega). Light units were normalized with Nrf2 mutant expression levels using a quantitative reverse transcription-PCR (qRT-PCR) method and the primers 5′-TGA ATA CTC TCT GCA GCA AA-3′ and 5′-GAG GGT TAG GGA TAG GCT TA-3′.
Fig 5.

Identification of critical residues for Nrf2 docking onto β-TrCP. (A) HEK293T cells were cotransfected with Flag-tagged β-TrCP, HA-tagged GSK-3βY216F (plus incubation with SB216763), and GSK-3βΔ9, as indicated, plus V5-tagged mouse Nrf2ΔETGE with either a wild-type Neh6 domain (wt) or mutations of Ser335 to Ala (S335A), Ser338 to Ala (S338A), Ser335 and Ser338 to Ala (2S/2A), or Ser335, Ser338, Ser342, and Ser347 to Ala (4S/4A). Cells were maintained in low serum for 16 h and treated with 40 μM MG132 for the last 3 h before pulldown of protein with anti-V5 antibodies. Lysates from only V5- or HA-transfected HEK293T were incubated with anti-V5 antibodies and G protein to control unspecific binding. (B) Nrf2-null MEFs were cotransfected with ARE-Luc, pTK-Renilla as control vector, HA-tagged GSK-3βY216F, or GSK-3βΔ9, as indicated, and increasing amounts of Nrf2-V5, Nrf22S/2A-V5, or Nrf24S/4A-V5. After 48 h, luciferase activity was determined. Values are means ± SEM from three independent samples. (C) Association of endogenous Nrf2 with Flag-tagged wild-type and mutant β-TrCPs. HEK293T cells were transfected with the Flag-β-TrCP constructs and HA-tagged GSK-3βY216F (plus incubation with SB216763) or GSK-3βΔ9. After 16 h in low-serum medium, cells were treated for 3 h with 40 μM MG132 and then immunoprecipitated with anti-Flag antibody. Samples from cells transfected with empty vector (mock) were included to control unspecific binding.
Plasmids.
The expression vectors pcDNA3.1-mNrf2-V5/HisB and pcDNA3.1-mNrf2ΔETGE-V5/HisB were previously described (29). Vectors pCGN-HA-GSK-3βΔ9 and pCGN-HA-GSK-3βY216F were provided by Akira Kikuchi (Department of Biochemistry, Faculty of Medicine, Hiroshima University). Conditions of active GSK-3 were obtained by transfection of the constitutively active mutant GSK-3βΔ9, which lacks the first 9 amino-terminal residues. Conditions of GSK-3 inactivation were achieved by transfection of the hypomorphic Y216F mutant (7) and incubation with the GSK-3 inhibitor SB216763 (10 μM, 3 h). A plasmid encoding β-TrCPΔFbox (pcDNA3β-TrCPΔFbox-HA) was provided by Serge Y. Fuchs (Department of Animal Biology, University of Pennsylvania, Philadelphia, PA). An expression construct encoding β-TrCP1 (pcDNA3-Flag-β-TrCP1) was provided by Tomoki Chiba (Department of Molecular Biology, University of Tsukuba, Japan). Chimeric construct Δ1 of the pEYFP-mNrf2-V5 series was generated as described in reference 42 for plasmid pEYFP-Nrf2-V5. The other chimeras were generated using Δ1 as the template with a GC-rich PCR system (Roche Applied Science, Basel, Switzerland). N-terminal deletions were generated with a common reverse primer: 5′-TCAGAAGCCATAGAGCCCACCGCAT-3′. The forward primers were as follows: Δ2, 5′-TAACGGATCCTTCATAGCAGAGCCCAGTGAC-3′; Δ3, 5′-TAACGGATCCAAAGCTTTCAACCCGAAGCAC-3′; Δ4, 5′-TAACGGATCCCAGAACGGCCCTAAAGCACAG-3′, and Δ5, 5′-TAACGGATCCAAAAATCATTAACCTCCCTGTT-3′. The amplified fragments were digested with BamHI (underlined) and PmeI and cloned in pEYFP-CI between the BglII and SmaI sites. pcDNA3.1-mNrf2ΔETGE 6S/6A-V5/HisB containing the mutations S335A, S338A, S342A, S347A, S351A, and S355A was previously described (38).
Plasmids encoding EYFP-mNrf2(317–372)-V5 and EYFP-mNrf2(317–372) 6S/6A-V5 were generated using the primers 5′-TAACAGATCTGGTAAGCCTATCCCTAACCCTCTCCTC-3′ (forward) and 5′-TAACAGATCTATCTAGCTCCTCCATTTCCGAGTCACT-3′ (reverse) and pEYFP-mNrf2-V5 and pEYFP-mNrf26S/6A-V5 as templates, respectively. Underlined HindIII sites were included in all primers to allow the religation of the PCR product. Mutant mNrf2 and β-TrCP constructs were generated using GeneTailor site-directed mutagenesis system (Invitrogen, Carlsbad, CA), and the primers are shown in Table SA in the supplemental material. All sequences were verified by automated sequencing. pcDNA3.1-mNrf22S/2A-V5/HisB, pcDNA3.1-mNrf22SP/2AP-V5/HisB, and pcDNA3.1-mNrf24S/4A-V5/HisB were generated by replacing the fragment between two HindIII sites with the corresponding portions of pcDNA3.1-mNrf2ΔETGE-V5/HisB.
Immunoblotting.
The primary antibodies used were anti-V5 and anti-β-TrCP (Invitrogen), antihemagglutinin (anti-HA) (Covance, Berkeley, CA), anti-GFP and anti-Flag (Sigma-Aldrich), anti-GSK-3β (Cell Signaling, Beverly, MA), anti-Keap1 and β-actin (Santa Cruz Biotechnology), sc-33569 and sc-1616 (Santa Cruz, Delaware, CA), anti-GSTM5 and anti-mouse Nrf2 (made in the Hayes laboratory), anti-GCLM and anti-GCLC (kind gifts from Terrance Kavanagh, University of Washington), anti-human Nrf2 (Abgent, San Diego, CA) anti-HO-1 (made in the Cuadrado laboratory), and anti-NQO1 (Abcam, Cambridge, United Kingdom). Cell lysates were resolved by SDS-polyacrylamide gel electrophoresis (PAGE) and transferred to Immobilon-P membranes (Millipore, Billerica, MA). These membranes were analyzed using the appropriate primary antibodies and peroxidase-conjugated secondary antibodies. Proteins were detected by enhanced chemiluminescence (GE Healthcare, Buckinghamshire, United Kingdom).
Coimmunoprecipitation.
Assays were performed as indicated elsewhere (38). The samples were resolved by SDS-PAGE and immunoblotted. Mouse IgG TrueBlot (eBiosciences, San Diego, CA) was used as the peroxidase-conjugated secondary antibody (1:10,000 dilution) to avoid interference with the 55-kDa heavy and 23-kDa light chains of the immunoprecipitating antibody.
2D-PAGE.
Assays with lambda phosphatase (λPPase) and 2D gel electrophoresis were performed as described in reference 40. Reagents for 2D-PAGE were supplied by PlusOne-GE Healthcare.
In vitro kinase assays.
In vitro phosphorylation was performed using immunocomplexes with V5-tagged EYFP-Neh6 Nrf2 versions, which were immunoprecipitated with anti-V5 antibodies from transiently transfected HEK293T cells. In all cases, the kinase assays were performed using 5 ng of active recombinant GSK-3β (Millipore) per reaction and 5 μCi of [γ-32P]ATP in 25 μl of reaction buffer (10 mM MgCl2, 100 μM ATP in 40 mM MOPS [pH 7.0], and 1 mM EDTA) for 20 min at 30°C with continuous shaking. Kinase reaction products were resolved by SDS-PAGE, transferred to Immobilon-P membranes, and subjected to autoradiography or immunoblotted.
Peptide synthesis.
The Nrf2 peptide with residues 333 to 362 from the human sequence (4P-hNrf2) with phosphorylated serines at positions 344, 347, 351, and 356 was purchased from Invitrogen. The Nrf2 peptide comprising residues 333 to 359 (2P-hNrf2) with phosphorylated serines at positions 344 and 347 was purchased from JPT Innovative Peptide Solutions (Berlin, Germany). The purity of both peptides was higher than 95%, as determined by high-pressure liquid chromatography (HPLC). Both peptides were N acetylated and C amidated at their respective termini.
Purification of the WD repeat region from human protein β-TrCP1 fused to the maltose-binding protein (MBP).
The method of purification of MBP–β-TrCP was previously described (36). Following this protocol, the final yield of purified MBP-β-TrCP was 1.3 mg/liter. This amount of purified recombinant protein was used to prepare the NMR samples.
NMR spectroscopy.
NMR spectroscopy experiments were run at 500.13 MHz for 1H on a Bruker Avance 500 spectrometer with a Linux PC workstation, using standard 5-mm or Shigemi 5-mm tubes with susceptibility matched to solvent 2H2O-water sample tubes with a 5-mm outer diameter. The spectra of the peptide at a 2 mM sample concentration were recorded in 20 mM sodium phosphate buffer at pH 7.2, prepared in 95% H2O and 5% 2H2O. Two-dimensional NMR spectra were recorded in the phase-sensitive mode using the States time-proportional phase incrementation (TPPI) method (45). All experiments were carried out using either the WATERGATE (water suppression by gradient-tailored excitation) pulse sequence for water suppression (34) or the excitation sculpting water suppression (14) to eliminate the solvent signal in a 95:5 H2O-2H2O solution. The COSY (correlation spectroscopy), TOCSY (total correlation spectroscopy), and NOESY (nuclear Overhauser enhancement spectroscopy) spectra from the two-dimensional experiments were recorded at several temperatures within the 280- to 310-K range. 2D TOCSY spectra were recorded using an MLEV-17 spin-lock sequence (2) with mixing times (τm) of 35 and 70 ms. 2D NOESY experiments were recorded using a τm of 100, 200, or 500 ms. The heteronuclear 1H-13C HSQC (heteronuclear single-quantum coherence) spectra were recorded at 280 K in the same conditions. For NMR experiments with β-TrCP, the ligand-to-protein ratio was set to 98:1 (1.6 mM 4P-Nrf2 or 2P-Nrf2 peptide, 17 μM MBP-β-TrCP protein). Chemical shift assignments referred to internal standard 3-(trimethylsilyl) propionic acid-2,2,3,3-d4, sodium salt (TSP-d4). Transferred nuclear Overhauser effect spectroscopy (TRNOESY) spectra of 4P-Nrf2 or 2P-Nrf2 with β-TrCP were recorded using a τm of 100, 200, or 500 ms.
1H saturation transfer difference (STD) NMR spectra of the protein-peptide mixtures were recorded at 500 MHz with 1,024 scans and selective saturation of protein resonances at −3 ppm (on-resonance frequency) (30 ppm for reference spectra). At this frequency, no peptide resonances are found, whereas the significant line width of the protein signals still allows this protein to be selectively and uniformly saturated and be efficiently used for the STD NMR technique. In order to achieve the desired selectivity and to avoid side band irradiation, shaped pulses are employed for the saturation of the protein signals. STD NMR spectra were acquired using a series of 40 equally spaced 50-ms Gaussian-shaped pulses for selective saturation (total saturation time ∼ 2.05 s), with a 1-ms delay between the pulses. With an attenuation of 50 dB, the radio frequency field strength for the selective saturation pulses in all the STD NMR experiments was 190 Hz. The irradiation yields full saturation of the protein by efficient spin diffusion. Subtraction of flame ionization detection (FID) values with on- and off-resonance protein saturation was achieved by phase cycling. Relative STD values were calculated by dividing STD signal intensities by the intensities of the corresponding signals in a one-dimensional 1H NMR reference spectrum of the same sample recorded with 1,024 scans and similar parameter conditions.
Structure calculations.
The calculated distances were incorporated into a simulated annealing protocol within the program ARIA 2.3 (25). Details on the three-dimensional structure calculation were presented elsewhere (36). PyMOL (http://www.pymol.org) was used for the analysis and presentation of the results of structure determination. The final step of the work was a docking analysis using Surflex-Dock 2.0 (SYBYL-X 1.2; Tripos Certara Company, St. Louis, MO).
Immunohistochemistry.
Animals were perfused, brains fixed, and 30-μm-thick coronal sections obtained as previously described (39). Sections were treated as reported elsewhere (19) and incubated for 24 h at 4°C with rabbit anti-GSK-3β (1:500; Cell Signaling). Secondary biotinylated anti-rabbit antibody was used at a 1:1,000 dilution for 1 h at room temperature (Vector Labs, Burlingame, CA), and sections were subsequently developed by using an avidin-biotin peroxidase complex system, following the manufacturer's instructions (ABC kit; Vector Labs). Finally, sections were incubated in Nissl's solution (0.1% cresyl violet [Sigma-Aldrich], 2.5 ml 10% acetic acid) at room temperature for 15 min, rinsed in deionized water for 5 min, dehydrated in graded alcohols, cleared in xylene, and covered with coverslips.
Analysis of mRNA levels.
Total RNA was extracted using TRIzol reagent according to the manufacturer's instructions (Invitrogen). Reverse transcription and quantitative PCR were done as detailed elsewhere (38). Primer sequences are shown in Table SB of the supplemental material. Data analysis was based on the ΔΔCT method with normalization of the raw data to housekeeping genes (Applied Biosystems). All PCRs were performed in triplicate.
Image analyses and statistics.
Different band intensities (density arbitrary units), corresponding to immunoblot detection of protein samples, were quantified using MCID software (MCID, Cambridge, United Kingdom). Student's t test was used to assess differences between groups; a P value of <0.05 was considered significant. Unless otherwise indicated, all experiments were performed at least three times with similar results. The values presented in the graphs are the means for at least three samples. Results are expressed as means ± standard errors of the means (SEM).
RESULTS
The Neh6 domain of Nrf2 binds β-TrCP.
In order to map the domain of Nrf2 that interacts with β-TrCP, we transfected HEK293T cells with expression vectors for V5-tagged enhanced yellow fluorescent protein (EYFP) linked to various mNrf2 deletion mutants (Fig. 1A) and with a truncated version of β-TrCP that contains the WD40 propeller, which participates in recognition and binding to substrates, but lacks the Fbox domain, which is required for interaction with cullin1 (β-TrCPΔFbox) (Fig. 1B). After transfection, the cells were maintained in serum-free medium for 16 h, to ensure that GSK-3β retained its activity (42). Pulldown of V5-tagged EYFP-Δ(1–5)Nrf2 chimeras showed that those that contained the Neh6 domain (i.e., Δ1 to Δ3) could associate with HA-tagged β-TrCPΔFbox, whereas those that lacked the Neh6 (i.e., Δ4 and 5) could not (Fig. 1C and D). These results indicate that the Neh6 domain of Nrf2 interacts with the GSK-3/β-TrCP axis.
Fig 1.

Mapping the Nrf2 domain involved in interaction with β-TrCP. (A) Diagram showing the general organization of the Neh domains in Nrf2 according to reference 16 and the EYFP-mNrf2-V5 chimeras used in pulldown assays with N-terminal deletions of mNrf2. Each chimera carries the following residues from mNrf2: Δ1, 98 to 579; Δ2, 280 to 579; Δ3, 316 to 579; Δ4, 381 to 579; Δ5, 464 to 579. Black boxes indicate the positions of Ser/Thr clusters that might be phosphorylated by GSK-3 (for details, see Fig. SA in the supplemental material). (B) Ribbon diagram of the E3 ligase adaptor β-TrCP (modified from protein data bank ID 1P22 [52]) showing the substrate binding domain (WD40 propeller) in red and the Skp1 binding domain (Fbox) in blue. (C and D) Pulldown assays of ectopically expressed EYFP-mNrf2-V5 chimeras and β-TrCPΔFbox-HA, which contains only the WD40 domain (residues 170 to 542 of β-TrCP2). HEK293T cells were cotransfected with expression vectors for the indicated EYFP fusion proteins, Δ1, Δ2, Δ3, Δ4, and Δ5, and β-TrCPΔFbox. Thereafter, the cells were maintained in low-serum medium (0.5% fetal calf serum in DMEM) for 16 h and analyzed by coimmunoprecipitation. (C) Immunoblots showing inputs of ectopically expressed β-TrCPΔFbox-HA and EYFP-mNrf2-V5 proteins with anti-HA and anti-V5 antibodies, respectively. (D) Immunoprecipitation of EYFP-mNrf2-V5 fusion chimeras with anti-V5 antibody followed by immunoblot with either anti-HA antibody to detect β-TrCPΔFbox-HA or anti-V5 antibody to detect EYFP-mNrf2-V5 chimeras.
Identification of Ser residues in the Neh6 domain phosphorylated by GSK-3.
The fact that Nrf2 contains many putative phosphorylation sites (see Fig. SA in the supplemental material) complicates the identification of modified residues. To simplify this task, we restricted our study to the examination of the Neh6 domain. We generated a fusion protein comprising EYFP and residues 317 to 372 of mouse Nrf2 (EYFP-mNrf2(317–372)-V5) that contained the putative sites for GSK-3 phosphorylation and β-TrCP binding. This protein migrated as two bands during SDS-PAGE, and the retarded band was eliminated if cell lysates were treated with λ-phosphatase (λPPase) prior to electrophoresis, indicating that it was a phosphorylated form of Nrf2 (Fig. 2A, left). In contrast, mutation of six Ser residues to Ala (residues 335, 338, 342, 347, 351, and 355) in this region (EYFP-mNrf2(317–372)6S/6A-V5) yielded a protein with only the fast-migrating form, indicating that at least some of these six serines are involved in phosphorylation and retarded gel mobility (Fig. 2A, left). When EYFP-mNrf2(317–372)-V5 was expressed together with active GSK-3βΔ9, the pattern of mobility was almost unchanged, making the identification of residues phosphorylated by the kinase by this approach difficult (Fig. 2A, right). We circumvented this problem by employing 2D-PAGE (Fig. 2C and D). HEK293T cells were transfected with EYFP-mNrf2(317–372)-V5 under conditions where GSK-3 activity was modulated. Inactivation of GSK-3 was achieved by cotransfection of a hypomorphic version of GSK-3β that retains only residual activity, GSK-3βY216F, and incubation with the GSK-3 inhibitor SB216763 (10 μM) during the course of the experiment. Activation of this kinase was performed by cotransfection with active GSK-3βΔ9. The modified forms of the fusion protein were resolved by 2D-PAGE and then blotted with anti-V5 antibody. Cotransfection of EYFP-mNrf2(317–372)-V5 with GSK-3βY216F and incubation with SB216763 (10 μM, 3 h) resolved this chimera into two rows of spots (Fig. 2C). When cell lysates were preincubated with λPPase, the protein migrated as three spots, indicating the presence of posttranslational modifications of the fluorescent protein that cannot be attributed to phosphorylation (40) (Fig. 2D). More importantly, however, when cells were cotransfected with EYFP-mNrf2(317–372)-V5 and GSK-3βΔ9, we observed an increase in the intensity of spots with acidic pIs and a decrease in the intensity of spots with basic pIs (Fig. 2C) as a consequence of phosphorylation. To narrow down the putative sites of phosphorylation in the Neh6 domain of mouse Nrf2, we analyzed the point mutants shown in Fig. 2B. The mutant EYFP-mNrf2(317–372)6S/6A-V5 exhibited similar 2D-PAGE mobility patterns under conditions of GSK-3β inhibition and activation, indicating that these Ser residues are crucial for phosphorylation by GSK-3 (Fig. 2E). When Ser-to-Ala mutations were restricted to those at positions 335, 338, 342, and 347, the resulting EYFP-mNrf2(317–372)4S/4A-V5 protein yielded the same 2D-PAGE pattern as EYFP-mNrf2(317–372)6S/6A-V5, indicating that Ser351 and Ser355 are not phosphorylated by GSK-3 (Fig. 2F). A mutant with both Ser335 and Ser338 changed to Ala (EYFP-mNrf2(317–372)2S/2A-V5) presented an enrichment of the most acidic spot (Fig. 2G, filled arrow) and a decrease in the most basic spot (Fig. 2G, empty arrow) induced by GSK-3βΔ9. This chimeric mutant indicates that GSK-3β can induce phosphorylation of either Ser342 or Ser347 or both. Finally, 2D-PAGE examination of a mutant with Ser342 and Ser347 replaced with Ala (EYFP-mNrf2(317–372)2SP/2AP-V5) yielded a new pattern of minor spots with acidic pIs that were enhanced in the presence of GSK-3βΔ9 (Fig. 2H). Therefore, GSK-3β phosphorylated Ser335 and Ser338, although the faint intensity of the acidic spots suggests that optimal phosphorylation by GSK-3 requires intact Ser342 and Ser347 residues.
Fig 2.
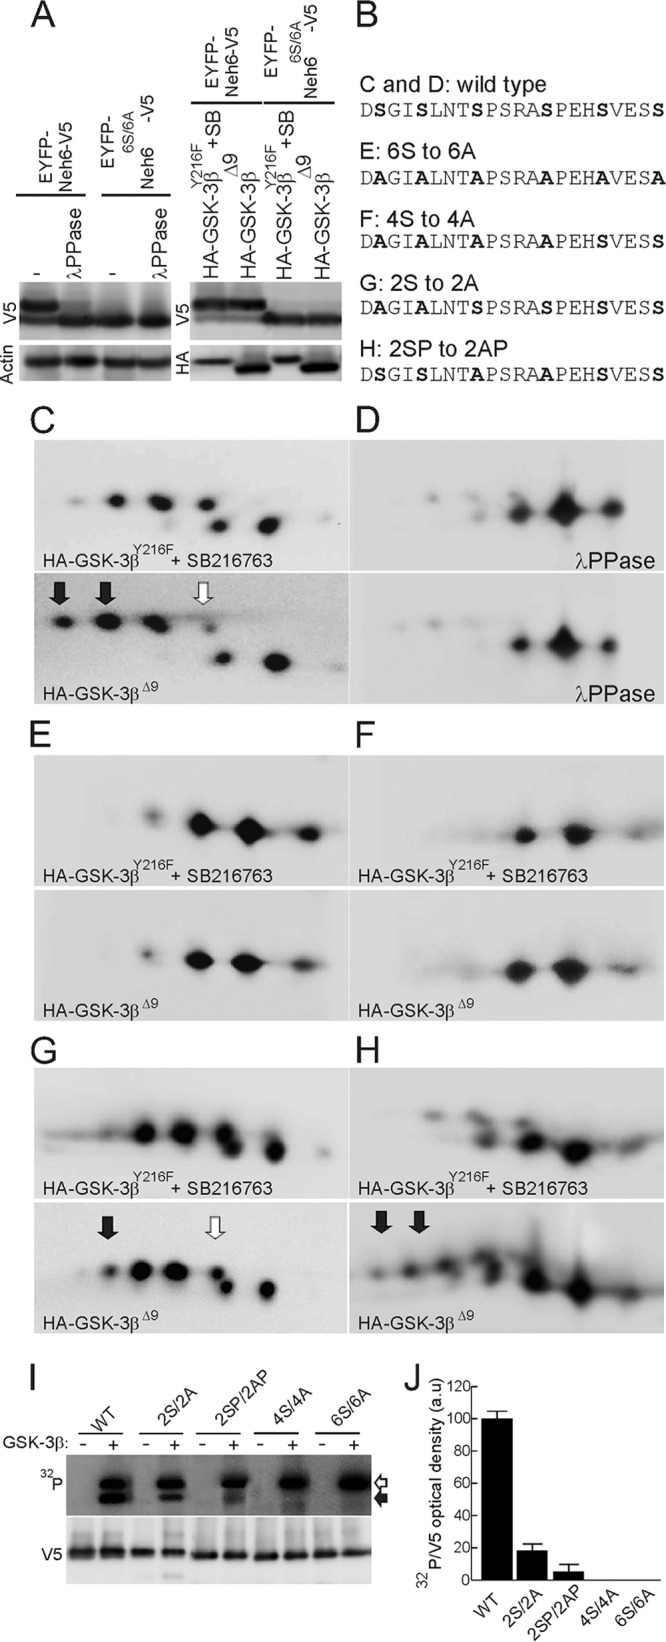
The Neh6 domain is phosphorylated by GSK-3β. (A) (Left) HEK293T cells were transfected with expression vectors for EYFP-mNrf2(317–372)-V5 and mutant EYFP-mNrf2(317–372)6S/6A-V5. Cell lysates were incubated with λPPase as indicated and resolved by one-dimensional SDS-PAGE. (Top) Immunoblot with anti-V5 antibody; (bottom) immunoblot with anti-β-actin antibody to check equal protein loading. (Right) HEK293T cells were cotransfected with expression vectors for EYFP-mNrf2(317–372)-V5 and mutant EYFP-mNrf2(317–372)6S/6A-V5 together with either HA-GSK-3βY216F (plus incubation with SB216763, 10 μM, 3 h), as a negative control, or constitutively active HA-GSK-3βΔ9. (Top) Immunoblot with anti-V5 antibody; (bottom) immunoblot with anti-HA antibody. (B) Comparison of mNrf2 sequences from wild-type and mutant EYFP chimeras examined in panels C to H. (C) 2D-PAGE analysis of EYFP-mNrf2(317–372)-V5 in the presence of either HA-GSK-3βY216F (plus incubation with SB216763) or active HA-GSK-3βΔ9. (D) Same lysates as in C after treatment with λPPase. (E to H) 2D gel analysis of mutant EYFP-mNrf2(317–372)6S/6A-V5 (E), mutant EYFP-mNrf2(317–372)4S/4A-V5 (F), mutant EYFP-mNrf2(317–372)2SP/2AP-V5 (G), and mutant EYFP-mNrf2(317–372)2S/2A-V5 (H), in the presence of HA-GSK-3βY216F (plus incubation with SB216763) or active HA-GSK-3βΔ9. Filled arrows indicate acidic spots that result from GSK-3 phosphorylation; empty arrow indicates spots whose intensity is reduced in the presence of HA-GSK3βΔ9 as a result of protein migration toward that acidic spot. (I and J) In vitro GSK-3β kinase assays on Nrf2-derived substrates. HEK293T cells were transfected with wild-type and mutant EYFP-Neh6-V5, as indicated. Cell lysates were immunoprecipitated with anti-V5 antibodies and then subjected to phosphorylation with recombinant GSK-3β. (Top) 32P autoradiography. Filled and empty arrowheads indicate phosphorylated EYFP-Neh6-V5 and autophosphorylated GSK-3β, respectively. (Bottom) Immunoblots with anti-V5 antibodies showing similar amounts of immunoprecipitated EYFP-Neh6-V5 proteins per reaction. To exclude the possibility that a contaminating kinase in the reaction mixture might be responsible for modifying Nrf2, we performed parallel in vitro kinase assays without recombinant GSK-3β. (J) Densitometric quantification of 32P autoradiography normalized to EYFP-Neh6-V5 densities. Values are means and SEM from three independent reactions per EYFP-Neh6-V5 mutant.
In order to exclude indirect GSK-3β regulation of Nrf2 phosphodegron, we performed GSK-3β in vitro kinase assays. EYFP-Neh6-V5 versions were obtained by immunoprecipitation from transiently transfected HEK293T cells. These substrates were subjected to enzymatic kinase reactions with recombinant GSK-3β. As shown in Fig. 2I and J, GSK-3β phosphorylated EYFP-Neh6-V5, but a clear reduction of phosphate incorporation was observed for EYFP-Neh62S/2A-V5 and EYFP-Neh62SP/2AP-V5. According to the previous 2D results, GSK-3β did not phosphorylate EYFP-Neh64S/4A-V5 and EYFP-Neh66S/6A-V5 mutants. Taken together, these results indicate that GSK-3β participates in the phosphorylation of Ser335, Ser338, Ser342, and Ser347.
Identification of phosphoserines in Neh6 that interact with β-TrCP.
We used NMR with two phosphopeptides derived from human Nrf2, 4P-hNrf2 and 2P-hNrf2, to identify residues in the Neh6 domain that are bound to β-TrCP. Human Nrf2 is longer than mouse Nrf2, and the Neh6 domain is displaced by 9 residues despite the fact that the amino acid sequence is identical within the region studied here (see Fig. SA in the supplemental material). Therefore, to recapitulate basal and GSK-3-induced phosphorylations, the 4P-hNrf2 peptide carried phosphoserines at positions 344, 347, 351, and 356 (equivalent to positions 335, 338, 342, and 347 in mNrf2) whereas the 2P-hNrf2 carried phosphoserines only at positions 344 and 347, corresponding to GSK-3-induced phosphorylations (Fig. 3A). The complete assignment of resonances of both 2P-hNrf2 and 4P-hNrf2 peptides was established by two-dimensional 1H, 1H TOCSY, and NOESY experiments. The 13C signals were assigned using 13C-edited HSQC spectra (51) on samples containing a natural abundance of 13C. The chemical shifts of hNrf2 peptides free in solution and in the presence of a recombinant fusion protein made of maltose-binding protein and the WD40 propeller of β-TrCP (MBP-β-TrCP) were analyzed at 280 K, pH 7.2 (see Tables SC to SF in the supplemental material). The sequential assignment of 1H resonances was carried out using a classical assignment strategy (53). The analysis of the Hδi-Hαi−1 NOE cross-peaks revealed the Xi−1-Proi bonds to be mainly trans (53). No cis-trans isomerization was detected across proline amide bonds.
Fig 3.

Structure analysis of 2P-hNrf2 and 4P-hNrf2. (A) Sequence of 2P-hNrf2 and 4P-hNrf2 phosphopeptides from human Nrf2; for reference with regard to amino acid positions, the mouse Nrf2 sequence is also shown. In addition, the human β-catenin sequence is included for comparison. (B) Temperature coefficients of the amide proton chemical shifts (ppb K−1) for the 2P-hNrf2 and 4P-hNrf2 peptides at pH 7.2 plotted against the residue number. (C) Chemical shift differences for the NH resonances of the 2P-hNrf2 and 4P-hNrf2 peptides free in buffer solution and in the presence of MBP-β-TrCP at 280 K and pH 7.2, plotted against the residue number. (D) Relative STD intensities for 2P-hNrf2 and 4P-hNrf2 peptides. The integral values of the largest signal for the 2P-hNrf2 peptide (pSer347 HN proton) and for the 4P-hNrf2 peptide (pSer344 HN proton) were set to 100%. The relative degree of saturation for the individual protons normalized to the largest signal was used to compare the STD effect. (E) Effect of temperature (280 K or 293 K) on the relative STD intensities for 4P-hNrf2. The integral value of the largest signal of the 4P-Nrf2 (pSer344 HN proton) was set to 100% at 280 K. A correction factor of 0.85 was applied to STD values obtained at 293 K.
The amide signal shift temperature coefficients [Δ(δNH)/ΔT, in ppb K−1] were derived for all backbone amide protons in both peptides (Fig. 3B). For the residues involved in intramolecular hydrogen-bonding networks or hidden in the solvent-protected structural core, low absolute values of this coefficient are expected compared with the range of values measured for random-coil peptides (3). The region between Asn340 and pSer347, and particularly Gly345, gave the lowest values, between −7 and −4 ppb K−1, and can be considered to be at least partially protected from external water molecules. Therefore, the similar pattern observed for this region in 2P-hNrf2 and 4P-hNrf2 peptides reveals that they possess similar structures. In the presence of β-TrCP (Fig. 3C), the highest chemical-shift variations (Δδ) were found roughly in the same region (344pSGIpSLN349) of both 2P-hNrf2 and 4P-hNrf2 peptides and in pSer351 and pSer356 of 4P-hNrf2 peptide.
To further characterize the amino acids of Nrf2 involved in the interaction with β-TrCP, we used saturation transfer difference (STD) NMR experiments, as they have been used successfully to characterize the interaction of β-TrCP with substrates such as Vpu (5), β-catenin (30), IκBα (35), and ATF-4 (36). We observed Nrf2 signals in the STD spectrum at 280 K, which indicated binding of β-TrCP to the peptides (Fig. 3D). The amide protons of pSer344 and pSer347 of 2P-hNrf2 and 4P-hNrf2 peptides participated in this interaction, showing more than 80% relative STD intensities. Other residues in this region, such as Ile346 and Leu348, exhibited close to 80% relative STD intensities, suggesting that they also participate in binding through hydrophobic interactions. In 4P-hNrf2, pSer351 and pSer356 also displayed a high intensity in the STD spectrum. To determine the specificity of these interactions we repeated the STD experiment for 4P-hNrf2 at 293 K. At this higher temperature, the STD intensity was decreased (Fig. 3E), indicating dissociation of the complex. To take into account the STD signal reduction and to allow a better understanding of the temperature effect, a global reduction factor of 0.85 was applied for STD intensities at 293 K. The intensities at the N and C termini of 4P-hNrf2 remained very similar at both temperatures, with mean values of about 50 to 60%. However, the interactions between Asn340 and Ser360 were reduced at 293 K, but pSer344, Ile346, and pSer347 retained high STD values. These results suggest that the residues in the pSGIpS region are essential for the contacts of both 4P-hNrf2 and 2P-hNrf2 peptides with β-TrCP. Interestingly, the interactions of pSer351 and pSer356 in 4P-hNrf2 were reduced at 293 K (Fig. 3E). These results indicate the importance of pSer344 and pSer347 in binding to β-TrCP, while pSer351 and pSer356 appear to be involved mainly in weak interactions.
Molecular structure of the interaction between the phosphodegron in Nrf2 and β-TrCP.
We sought to elucidate the structure of the complex formed between 2P-hNrf2 and purified MBP-β-TrCP by using distance restraints derived from TRNOE spectra at 100- and 200-ms mixing times at 280 K. Of a total of 218 TRNOE cross-peaks, 108 were translated into unambiguous restraints. Using the ARIA 2.3 software, 50 structures of 2P-hNrf2 bound to β-TrCP were generated, and their superimposition onto the DpSGIpS motif of the five lowest-energy structures is displayed in Fig. 4A. The presence of the phosphorylated serines in the peptide induces a turn conformation also found in other β-TrCP substrates (37). The backbone average root mean square difference (RMSD) value for the DpSGIpS motif is 1.2 ± 0.6 Å.
Fig 4.
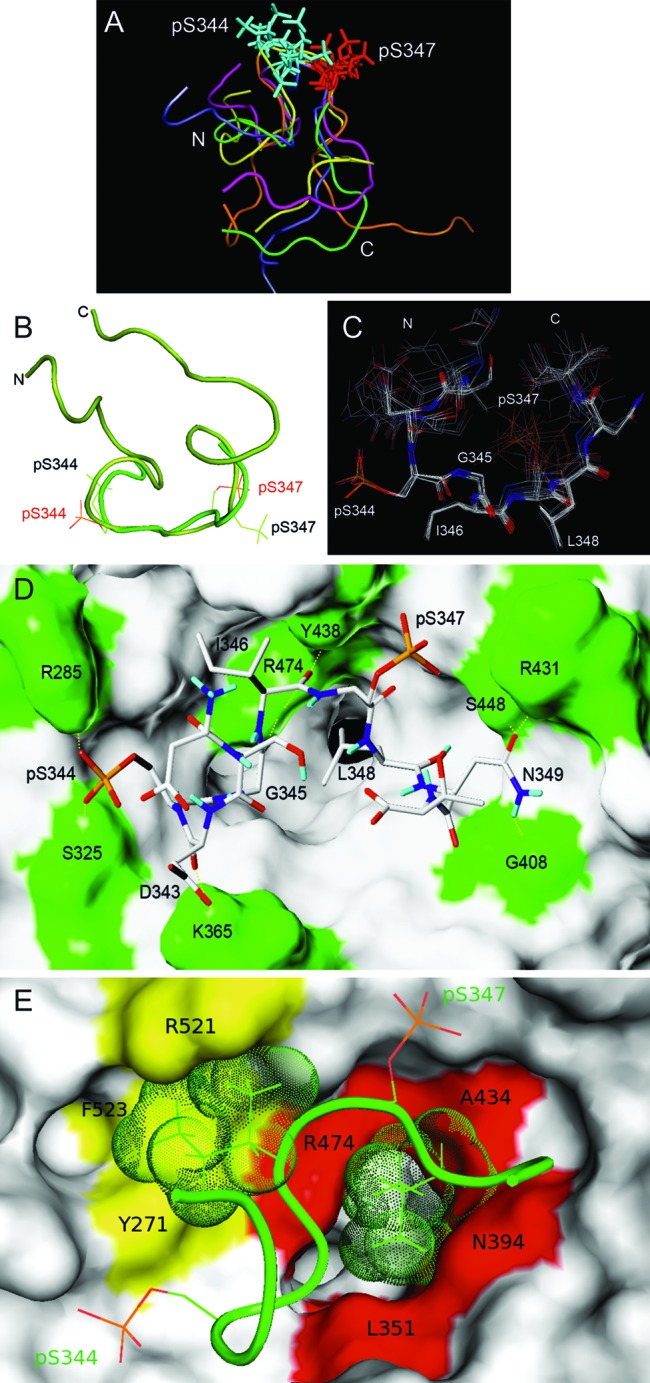
TRNOE-derived structures of the 2P-hNrf2 peptide bound to β-TrCP and analysis of the docking interactions. (A) Of 50 TRNOE-derived structures, the five lowest-energy conformations are shown. Superimpositions are shown on the DpSGIpS motif. (B) Nrf2 docked structure (light green) superimposed on the TRNOE bound structure (dark green) on the DpSGIpS motif. Phosphoserine residues are labeled in red in the docked structure and black in the TRNOE structure. (C) The seven lowest-score configurations that are representative of the bound structures of Nrf2. The superimposition was made on the DpSGIpS motif. (D and E) Structure of the complex of β-TrCP with the best docking conformation of Nrf2 deduced from the NMR data. β-TrCP is shown in surface representation. (D) β-TrCP residues that participate in hydrophilic intermolecular interactions including Arg285, Ser325, Lys365, Gly408, Arg431, Tyr438, Ser448, and Arg474 (green). H bonds are shown with dashed yellow lines. (E) Amino acids of β-TrCP and Nrf2 that participate in hydrophobic intermolecular interactions. The hydrophobic cluster located at the entrance of the central channel of β-TrCP (red), interacts with the side chain of Leu348 (green dots). A second hydrophobic cluster (yellow) interacts with the side chain of Ile346 (green dots).
A model for the phospho-Nrf2/β-TrCP complex was based on docking calculations starting from the lowest-energy bound structure that was obtained from the TRNOE NMR experiment. Due to the high degree of flexibility, Surflex-Dock (17) calculations were limited to 10 residues centered on the interaction motif 341DSDpSGIpSLNT350. The previously reported three-dimensional crystal structure of human β-TrCP in complex with a 10-residue β-catenin peptide (PDB ID code 1P22) (52) was used as the starting structure for the docking calculations. We obtained 32 configurations of docking conformers. The lowest-energy docking conformer of the DSDpSGIpSLNT sequence was superimposed with the lowest-energy TRNOE bound structure on the DpSGIpS sequence (Fig. 4B). The backbone RMSD values were 1.9 ± 0.6 Å (DSDpSGIpSLNT) and 1.1 ± 0.4 Å (DpSGIpS). The turn motif is preserved in both structures, but the position of the phosphate groups changes. In contrast to the Nrf2-bound structure, we found that the phosphate groups of pSer344 and pSer347 in the docked structure adopt a lower-energy conformation that optimizes the interaction with the surface of β-TrCP. We superimposed the seven configurations of docking conformers with the lowest scores (Fig. 4C) and found a good fit for the pSGI fragment and Leu348, while the side chain of pSer347 was more flexible. The backbone RMSD value for the DpSGIpS motif is 0.4 ± 0.2 Å, and that for the sequence with the 10 residues is 0.9 ± 0.5 Å. The lowest-energy structure of the complex is shown in a Dreiding model (Fig. 4D). The amino acids of β-TrCP that participate in hydrogen bonding with Nrf2 are in green. Seven of 10 hydrogen bonds involve the DpSGI motif, and the remaining three involve Asn349. The carbonyl and carboxyl groups of Asp343 make two H bonds with the εNH2 group of Lys365 of β-TrCP. The phosphate group of pSer344 makes two H bonds with the εNH group of Arg285 and the OH of Ser325 of β-TrCP. The carbonyl group of Gly345 forms an H bond with the εNH of Arg474 of β-TrCP. The carbonyl group of Ile346 makes H bonds with the εNH of Arg474 and the OH of Tyr438 of β-TrCP. The γ-carbonyl group of Asn349 forms H bonds with the εNH of Arg431 and the OH of Ser448 of β-TrCP. Finally, the γNH2 of Asn349 makes one H bond with the carbonyl group of Gly408 of β-TrCP. It is possible that pSer347 could form H bonds or ionic interactions with either the εNH groups of Arg521 or Arg431 of β-TrCP, but these contacts were not found in the lowest-energy structure.
In addition to H bonds, hydrophobic contacts were observed (Fig. 4E). The side chain of Ile346 is stabilized in the hydrophobic pocket made by the aromatic rings of Phe523 and Tyr271 and the guanidinium group of Arg521 of β-TrCP. The side chain of Leu348 is stabilized in the hydrophobic central channel involving contacts with the side chains of Leu351, Asn394, Ala434, and Arg474 on the WD40 propeller of β-TrCP. All these contacts participate in the stability of the 2P-hNrf2/β-TrCP complex.
Ser residues in the Neh6 phosphodegron are necessary for the interaction with β-TrCP.
The contribution of individual residues to the association between Nrf2 and β-TrCP was examined using a pulldown assay. In the first set of experiments, HEK293T cells were cotransfected with expression vectors for Flag-tagged β-TrCP and either GSK-3βY216F as a filling control vector plus SB216763 or constitutively active GSK-3βΔ9. The cells were also cotransfected with a Keap1-insensitive form of Nrf2, mNrf2ΔETGE-V5, having either an intact Neh6 (wild type [wt]) or Ser-to-Ala mutations at position 335 (S335A), position 338 (S338A), positions 335 and 338 (2S/2A), or positions 335, 338, 342, and 347 (4S/4A), as indicated in Fig. 5A. Cells were serum starved for 16 h and kept in the presence of the proteasome inhibitor MG132 (40 μM) for the last 3 h of incubation. Nrf2 with an intact Neh6 domain associated with β-TrCP, and this interaction was enhanced in the presence of active GSK-3βΔ9. In contrast, mutations of Ser335, Ser338 or both in mNrf2 were sufficient to abolish this interaction. These results are consistent with the NMR data.
To further analyze the impact of Ser335 and Ser338 in GSK-3-mediated regulation of Nrf2, we performed complementation experiments in Nrf2-null MEFs subjected to luciferase assays. MEFs were transfected with an ARE-driven luciferase reporter construct (ARE-Luc) and pTK-Renilla as an internal control. In addition, cells were cotransfected with HA-tagged GSK-3βY216F or active GSK-3βΔ9 and increasing amounts of Nrf2-V5, Nrf22S/2A-V5, and Nrf24S/4A-V5 mutants, as indicated in Fig. 5B. Active GSK-3βΔ9 attenuated the transactivating capacity of wild-type Nrf2. In contrast, Nrf24S/4A was insensitive to GSK-3β regulation. Interestingly, Nrf22S/2A showed only partial modulation by GSK-3β. Overall, these results indicate that GSK-3 activation inhibits Nrf2 function at least through the phosphorylation of Ser335 and Ser338 within the β-TrCP interaction motif.
In a second set of experiments, we explored the contribution of some Arg residues in the WD40 propeller of β-TrCP to the docking of Nrf2. Figure SB in the supplemental material shows the interaction of Flag-tagged β-TrCP with replacements of Arg285, Arg410, Arg431, Arg474, or Arg521 by Glu with transfected V5-tagged Nrf2. To assess the relevance of this interaction with endogenous Nrf2 in the context of GSK-3 activity, HEK293T cells were cotransfected with HA-GSK-3βY216F (and incubated with SB216763) or HA-GSK-3βΔ9 and wild-type and the β-TrCP point mutants as indicated in Fig. 5C. Cells were serum starved for 16 h and maintained in 40 μM MG132 for the last 3 h. Endogenous Nrf2 associated with Flag-β-TrCP, and this interaction was reinforced in the presence of active GSK-3βΔ9. Similarly, β-TrCPR410E and β-TrCPR431E mutants associated with Nrf2, and the association was also increased in the presence of GSK-3βΔ9. In contrast, the mutation of Arg285, Arg474, or Arg521 abrogated the association of Nrf2 with β-TrCP. These results are consistent with our docking model based on the NMR data.
In vivo effect of GSK-3β on Nrf2 activity.
We analyzed Nrf2 protein levels in mice subjected to five intraperitoneal injections of the GSK-3 inhibitor SB216763. After 6 h, liver and hippocampal extracts (Fig. 6A and B) exhibited increased Nrf2 protein levels comparable to those of mice treated with SFN for 1 h. As a control, SB216763 also increased β-catenin levels (Fig. 6C). As an alternative approach, we also analyzed Nrf2 function in the hippocampi of transgenic mice with a conditional neuron-specific depletion of GSK-3β (+Cre). Immunohistochemistry and immunoblotting revealed a strong reduction in GSK-3β in +Cre mice compared to control mice (−Cre) (Fig. 6D and F). Quantitative determination of mRNA levels indicated a reduction of GSK-3β transcripts to about 20% relative to control mice, but GSK-3α mRNA levels were unaffected (Fig. 6E). While GSK-3β protein levels were reduced to about 25% in +Cre mice, Keap1 and β-TrCP levels remained similar (Fig. 6G). In contrast, Nrf2 protein levels were increased in the hippocampi of +Cre mice relative to those in control −Cre mice (Fig. 6F and G). Moreover, both protein (Fig. 7A and B) and mRNA (Fig. 7C) levels of the phase 2 enzymes HO-1, GSTM5, GCLM, GCLC, and NQO1 were increased in GSK-3β-deficient hippocampi.
Fig 6.

Pharmacological and genetic inhibition of GSK-3 increases Nrf2 protein levels. Mice were intraperitoneally injected with five doses of 10 mg/kg SB216367 or with vehicle at 1-h intervals. As a positive control, mice were injected with a single dose of 50 mg/kg SFN. (A) (Top) Immunoblots showing Nrf2 protein levels in liver and hippocampus. The filled arrowhead indicates Nrf2; the empty arrowhead indicates an unspecific band observed with the anti-mouse Nrf2 antibody. (Middle) Immunoblots showing β-catenin protein levels in liver and hippocampus. (Bottom) Immunoblots for β-actin in liver and hippocampus, with similar protein amounts in all lanes. (B and C) Densitometric quantification of protein levels from representative blots like those in panel A normalized to β-actin. (D) Immunohistochemistry of 30-μm-thick hippocampal sections from control mice (−Cre), with normal GSK-3β levels, and neuron-specific GSK-3β knockout mice (+Cre). (Top) Anti-GSK-3β antibody staining and Nissl counterstaining. (Bottom) Higher magnification of the CA1 regions. (E) mRNA levels in hippocampi of GSK-3β and GSK-3α in −Cre and +Cre mice, determined by qRT-PCR. (F) Immunoblots showing protein levels of GSK-3β, Nrf2, Keap1, β-TrCP, and β-actin. (G) Densitometric quantification of protein levels from representative blots like those in panel F, normalized to β-actin levels. In panels B, C, E, and G, values are means ± SEM for six animals per group. Student's t test was applied to determine the significance of biochemical differences among groups. Asterisks denote significant differences between genotypes or treatments (P < 0.05).
Fig 7.

GSK-3β deficiency results in increased expression of Nrf2-target genes and antioxidant capacity. (A) Immunoblots showing protein levels of five enzymes regulated by Nrf2 (heme oxygenase 1 [HO-1], glutathione S-transferase M5 [GSTM5], γ-glutamyl cysteine ligase modulatory subunit [GCLM], γ-glutamyl cysteine ligase catalytic subunit [GCLC], and NADPH quinone oxidoreductase [NQO1]). (B) Densitometric quantification of protein levels from representative blots like those in panel A. (C) mRNA levels of HO-1, GSTM5, GCLM, GCLC, and NQO1, by qRT-PCR. (D) Levels of reduced glutathione (GSH). (E) Levels of oxidized glutathione (GSSG). (F) GSH/GSSG ratio. (G) Protein carbonyl content as determined by DNPH levels. (H) Thiobarbituric acid-reactive substances (TBARs) representing mostly MDA. Values are means ± SEM (n = 3). *, P < 0.05.
The functional impact of the GSK-3-mediated regulation of Nrf2 was further analyzed in the hippocampi of these mice. As shown in Fig. 7D, E, and F, hippocampi from +Cre mice exhibited higher levels of reduced glutathione and lower contents of GSSG than those from −Cre mice. Also, +Cre mice presented lower levels of DNPH (Fig. 7G) and MDA (Fig. 7H) than −Cre mice, indicating a reduction in carbonylated proteins and peroxidated lipids, respectively. These results demonstrate that interruption of the GSK-3/β-TrCP ubiquitination pathway at the level of GSK-3β results in upregulation of Nrf2 and its target genes in vivo, increasing the cellular antioxidant capacity.
DISCUSSION
Nrf2 can be regulated by cell signaling pathways, but the mechanisms involved are not understood. Herein, we describe a Keap1-independent mechanism by which Nrf2 is repressed that is based on its interaction with the SCF ubiquitin ligase adaptor β-TrCP. The binding of β-TrCP to Nrf2 involves the formation of a phosphodegron in the Neh6 domain of this transcription factor that is catalyzed by GSK-3, and it is therefore apparent that the process is strongly influenced by signaling via PI3K and mTOR. Moreover, this mechanism is likely to be perturbed in a number of major diseases such as cancer, Alzheimer's disease, and diabetes mellitus.
Mammalian Nrf2 comprises approximately 600 amino acids, of which more than 100 are serine, threonine, and tyrosine (see Fig. SA in the supplemental material). The fact that Nrf2 is an unstable protein that contains many putative phosphorylation sites complicates the identification of phosphorylation events that might control its activity. To date, mass spectroscopy studies have identified phosphorylation sites that appear to have only a relatively minor role in the function of Nrf2. In order to map the sites in Nrf2 that are phosphorylated by GSK-3, we employed a reductionist approach that incorporated the following three strategies: (i) creation of an EYFP-Neh6 fusion protein (EYFP-mNrf2(317–372)) in which the region of interest in Nrf2 was restricted to 56 residues; (ii) site-directed mutagenesis of critical residues in Neh6; (iii) use of 2D-PAGE to increase the resolution of phosphorylated and nonphosphorylated proteins. This approach allowed us to detect two rows of electrophoretically distinct protein spots. The faster-migrating lower row of spots represented a posttranslational modification in the fluorescent protein that is not related to Nrf2, since it was observed in nonchimeric EGFP (40). The slower-migrating upper row of electrophoretic spots correlated with phosphorylation of Neh6, because it disappeared when cell lysates were treated with λPPase. The identification of the slower-migrating bands as phosphorylated protein is also supported by the fact that when cells were cotransfected with vectors for EYFP-mNrf2(317–372)-V5 and the constitutively active GSK-3βΔ9 kinase, at least two additional acidic spots were observed in the upper row of polypeptides that coincided with a reduced intensity of the most basic spot. Taken together, these results indicate that active GSK-3β increased the abundance of phosphorylated EYFP-mNrf2-V5. These spots were not observed when cells were transfected with a kinase-deficient mutant that retains partial activity (GSK-3βY216F) (7) as a filling control vector and then incubated in the presence of SB216763 to ensure inactivation of GSK-3.
Analysis of EYFP-mNrf2(317–372)-V5 mutants by 2D-PAGE indicated that Ser342 and Ser347 in mouse Nrf2, which are situated N terminally to Pro residues, are partially phosphorylated under conditions of GSK-3 inactivation (cotransfection of HA-GSK-3βY216F together with incubation with SB216763, 10 μM, 3 h), suggesting that, in addition to GSK-3, other Pro-directed Ser/Thr kinases might participate in their modification. It is interesting that the double mutant lacking both Ser342 and Ser347 was still phosphorylated by GSK-3β, although to a lesser extent and with a somewhat distorted pattern of spots. This result is consistent with a role for GSK-3 in phosphorylation of Ser335 and Ser338 within the DpSGIpS phosphodegron. Also, the fact that the most abundant spots in this mutant correspond to the unphosphorylated protein suggests that GSK-3β is more effective at phosphorylating this degron when Ser342 and Ser347 have already been phosphorylated. Indeed, it is known that GSK-3 exhibits preference for substrates that have been previously phosphorylated in the consensus sequence (S/T)X1–4p(S/T), where X is any amino acid and p(S/T) is a Ser/Thr residue that has been previously phosphorylated by some other “priming” kinase (23). In this regard, the GSK-3 phosphorylated sequence of Nrf2 is most similar to that of the human erythropoietin receptor (SGIS) and human YAP (SGLS), which also have a smaller spacing of two residues. Nrf2 and EPO R share the same sequence, while Nrf2 and YAP differ in that a Leu is changed to Ile. We are currently seeking to identify the putative kinases that “prime” Ser342 and Ser347 in mouse Nrf2 for subsequent modification by GSK-3.
The E3 ligase substrate adaptor β-TrCP targets proteins such as Snail, IκBα, IκBβ, IκKε, WEE1, CDC25A, CDC25B, β-catenin, PDC4, REST, ATF4, PRL-R, IFNR, p63, GHR, Bora, STAT1, Gli2, Gli3, and Xom for ubiquitination and proteasomal degradation (1, 9, 20, 24, 32, 33, 49, 50, 55, 56). Many of these proteins are implicated in cell proliferation, and it is tempting to speculate that Nrf2 activity is linked to proliferative signals through the GSK-3/β-TrCP axis. Thus, GSK-3 is inhibited by several kinases during cell proliferation, and this should result in upregulation of Nrf2, which would in turn afford protection against increased levels of reactive oxygen species that are generated during cell cycle progression.
Our NMR studies indicate that the phosphodegron of Nrf2 is likely to possess a high degree of structure with a turn conformation which is found also in other substrates of β-TrCP (37). Our data suggest that the DpSGIpSLN motif that adopts the turn structure and contains phosphoserines pSer344 and pSer347 that play a specific role in the interaction. In contrast, the adjacent pSer351 and pSer356 residues may not be so important. This interpretation is consistent with the fact that in other substrates recognized by β-TrCP, GSK-3 phosphorylates a cluster of Ser/Thr residues in the target protein to give the consensus sequence DpSGX1–4pS, which is then recognized by β-TrCP through its WD40 domain (8, 44).
We hypothesize that three structural determinants stabilize the interaction of Nrf2 with β-TrCP. First, the phosphate group of the N-terminal phosphoserine makes H bonds and ionic interaction with Arg285 and Ser325 of β-TrCP. Second, a hydrophobic residue close to the N-terminal phosphoserine Ile346 interacts with the hydrophobic pocket formed by Phe523, Tyr271, and Arg521 of β-TrCP. Third, the interaction of a hydrophobic residue with the central channel of β-TrCP, Leu348, should be preserved to allow the stabilization of the C-terminal phosphoserine with Arg431 or Arg521 of β-TrCP.
As an additional confirmation of our NMR data, we analyzed the association of mNrf2 and β-TrCP mutants in pulldown assays. Indeed, mutation of Ser335 and Ser338 of mNrf2 (equivalent to Ser344 and Ser347 of hNrf2) was enough to lose the association with β-TrCP. Moreover, Arg285, Arg474, and Arg521 of the WD40 domain of β-TrCP were required for docking because when they were mutated to Glu, the association between Nrf2 and β-TrCP diminished substantially. These observations reinforce our interpretation of NMR data indicating a relevant role of these three residues in stabilization of docking: Arg258 with pSer344, Arg474 with Gly345 and Ile346, and Arg521 with Ile346 and possibly with pSer347.
The functional relevance of the control of Nrf2 by GSK-3/β-TrCP was addressed in vivo by injecting intraperitoneally the GSK3 inhibitor SB216763 or by using mice with a targeted deletion of GSK-3β in neurons. Depletion of GSK-3 resulted in increased Nrf2 protein levels, which correlated with increased Nrf2-regulated gene products as well as increased levels of GSH and lower levels of carbonylated protein and lipid peroxides. These observations suggest the relevance of the GSK-3/β-TrCP axis in sensitization to oxidant damage. In fact, we have reported that GSK-3 blocks the protective effect of Nrf2 in a kainic acid-based model of excitotoxicity in hippocampus (41) and against H2O2-induced neuronal damage (42). Because GSK-3β has a tremendous impact on many aspects of cell physiology, metabolism, differentiation, and proliferation, a more comprehensive vision of the Nrf2 function and regulation mechanisms will be achieved only when Nrf2 is analyzed as a downstream target of GSK-3β.
Supplementary Material
ACKNOWLEDGMENTS
This work was supported by MICINN grant SAF2010-18722 from the Spanish Ministry of Science and Innovation. Patricia Rada is contracted under the Formación de Profesorado Universitario program of the Spanish Ministry of Science and Innovation. We acknowledge funding and infrastructural support from EEC 7th Framework Program, KU Leuven Research Fund, and KU Leuven Research & Development.
We thank James Woodgett (Samuel Lunenfeld Research Institute, Toronto, Canada) for mice and advice.
Footnotes
Published ahead of print 2 July 2012
Supplemental material for this article may be found at http://mcb.asm.org/.
REFERENCES
- 1. Aberle H, Bauer A, Stappert J, Kispert A, Kemler R. 1997. beta-catenin is a target for the ubiquitin-proteasome pathway. EMBO J. 16: 3797– 3804 [DOI] [PMC free article] [PubMed] [Google Scholar]
- 2. Bax A, Davis DG. 1985. MLEV-17-based two-dimensional homonuclear magnetization transfer spectroscopy. J. Magn. Reson. 65: 355– 360 [Google Scholar]
- 3. Blanco FJ, Rivas G, Serrano L. 1994. A short linear peptide that folds into a native stable beta-hairpin in aqueous solution. Nat. Struct. Biol. 1: 584– 590 [DOI] [PubMed] [Google Scholar]
- 4. Chan K, Lu R, Chang JC, Kan YW. 1996. NRF2, a member of the NFE2 family of transcription factors, is not essential for murine erythropoiesis, growth, and development. Proc. Natl. Acad. Sci. U. S. A. 93: 13943– 13948 [DOI] [PMC free article] [PubMed] [Google Scholar]
- 5. Coadou G, et al. 2003. NMR studies of the phosphorylation motif of the HIV-1 protein Vpu bound to the F-box protein beta-TrCP. Biochemistry 42: 14741– 14751 [DOI] [PubMed] [Google Scholar]
- 6. Cullinan SB, Gordan JD, Jin J, Harper JW, Diehl JA. 2004. The Keap1-BTB protein is an adaptor that bridges Nrf2 to a Cul3-based E3 ligase: oxidative stress sensing by a Cul3-Keap1 ligase. Mol. Cell. Biol. 24: 8477– 8486 [DOI] [PMC free article] [PubMed] [Google Scholar]
- 7. Dajani R, et al. 2003. Structural basis for recruitment of glycogen synthase kinase 3beta to the axin-APC scaffold complex. EMBO J. 22: 494– 501 [DOI] [PMC free article] [PubMed] [Google Scholar]
- 8. Feldman RM, Correll CC, Kaplan KB, Deshaies RJ. 1997. A complex of Cdc4p, Skp1p, and Cdc53p/cullin catalyzes ubiquitination of the phosphorylated CDK inhibitor Sic1p. Cell 91: 221– 230 [DOI] [PubMed] [Google Scholar]
- 9. Frescas D, Pagano M. 2008. Deregulated proteolysis by the F-box proteins SKP2 and beta-TrCP: tipping the scales of cancer. Nat. Rev. Cancer 8: 438– 449 [DOI] [PMC free article] [PubMed] [Google Scholar]
- 10. Furukawa M, Xiong Y. 2005. BTB protein Keap1 targets antioxidant transcription factor Nrf2 for ubiquitination by the Cullin 3-Roc1 ligase. Mol. Cell. Biol. 25: 162– 171 [DOI] [PMC free article] [PubMed] [Google Scholar]
- 11. Galvan-Arzate S, et al. 2005. Delayed effects of thallium in the rat brain: regional changes in lipid peroxidation and behavioral markers, but moderate alterations in antioxidants, after a single administration. Food Chem. Toxicol. 43: 1037– 1045 [DOI] [PubMed] [Google Scholar]
- 12. Garcia E, et al. 2008. Lipid peroxidation, mitochondrial dysfunction and neurochemical and behavioural deficits in different neurotoxic models: protective role of S-allylcysteine. Free Radic. Res. 42: 892– 902 [DOI] [PubMed] [Google Scholar]
- 13. Hayes JD, McMahon M. 2009. NRF2 and KEAP1 mutations: permanent activation of an adaptive response in cancer. Trends Biochem. Sci. 34: 176– 188 [DOI] [PubMed] [Google Scholar]
- 14. Hwang TL, Shaka AJ. 1995. Water suppression that works—excitation sculpting using arbitrary wave-forms and pulsed-field gradients. J. Magn. Reson. 112: 275– 279 [Google Scholar]
- 15. Itoh K, et al. 1997. An Nrf2/small Maf heterodimer mediates the induction of phase II detoxifying enzyme genes through antioxidant response elements. Biochem. Biophys. Res. Commun. 236: 313– 322 [DOI] [PubMed] [Google Scholar]
- 16. Itoh K, et al. 1999. Keap1 represses nuclear activation of antioxidant responsive elements by Nrf2 through binding to the amino-terminal Neh2 domain. Genes Dev. 13: 76– 86 [DOI] [PMC free article] [PubMed] [Google Scholar]
- 17. Jain AN. 2003. Surflex: fully automatic flexible molecular docking using a molecular similarity-based search engine. J. Med. Chem. 46: 499– 511 [DOI] [PubMed] [Google Scholar]
- 18. Jaworski T, et al. 2011. GSK-3alpha/beta kinases and amyloid production in vivo. Nature 480: E4– 5, E6 [DOI] [PubMed] [Google Scholar]
- 19. Jazwa A, et al. 2011. Pharmacological targeting of the transcription factor Nrf2 at the basal ganglia provides disease modifying therapy for experimental parkinsonism. Antioxid. Redox. Signal. 14: 2347– 2360 [DOI] [PubMed] [Google Scholar]
- 20. Kanemori Y, Uto K, Sagata N. 2005. Beta-TrCP recognizes a previously undescribed nonphosphorylated destruction motif in Cdc25A and Cdc25B phosphatases. Proc. Natl. Acad. Sci. U. S. A. 102: 6279– 6284 [DOI] [PMC free article] [PubMed] [Google Scholar]
- 21. Katoh Y, et al. 2005. Evolutionary conserved N-terminal domain of Nrf2 is essential for the Keap1-mediated degradation of the protein by proteasome. Arch. Biochem. Biophys. 433: 342– 350 [DOI] [PubMed] [Google Scholar]
- 22. Kobayashi A, et al. 2004. Oxidative stress sensor Keap1 functions as an adaptor for Cul3-based E3 ligase to regulate proteasomal degradation of Nrf2. Mol. Cell. Biol. 24: 7130– 7139 [DOI] [PMC free article] [PubMed] [Google Scholar]
- 23. Kockeritz L, Doble B, Patel S, Woodgett JR. 2006. Glycogen synthase kinase-3—an overview of an over-achieving protein kinase. Curr. Drug Targets 7: 1377– 1388 [DOI] [PubMed] [Google Scholar]
- 24. Latres E, Chiaur DS, Pagano M. 1999. The human F box protein beta-Trcp associates with the Cul1/Skp1 complex and regulates the stability of beta-catenin. Oncogene 18: 849– 854 [DOI] [PubMed] [Google Scholar]
- 25. Linge JP, Habeck M, Rieping W, Nilges M. 2003. ARIA: automated NOE assignment and NMR structure calculation. Bioinformatics 19: 315– 316 [DOI] [PubMed] [Google Scholar]
- 26. Lo SC, Li X, Henzl MT, Beamer LJ, Hannink M. 2006. Structure of the Keap1:Nrf2 interface provides mechanistic insight into Nrf2 signaling. EMBO J. 25: 3605– 3617 [DOI] [PMC free article] [PubMed] [Google Scholar]
- 27. Martin D, et al. 2004. Regulation of heme oxygenase-1 expression through the phosphatidylinositol 3-kinase/Akt pathway and the Nrf2 transcription factor in response to the antioxidant phytochemical carnosol. J. Biol. Chem. 279: 8919– 8929 [DOI] [PubMed] [Google Scholar]
- 28. McMahon M, Thomas N, Itoh K, Yamamoto M, Hayes JD. 2006. Dimerization of substrate adaptors can facilitate cullin-mediated ubiquitylation of proteins by a “tethering” mechanism: a two-site interaction model for the Nrf2-Keap1 complex. J. Biol. Chem. 281: 24756– 24768 [DOI] [PubMed] [Google Scholar]
- 29. McMahon M, Thomas N, Itoh K, Yamamoto M, Hayes JD. 2004. Redox-regulated turnover of Nrf2 is determined by at least two separate protein domains, the redox-sensitive Neh2 degron and the redox-insensitive Neh6 degron. J. Biol. Chem. 279: 31556– 31567 [DOI] [PubMed] [Google Scholar]
- 30. Megy S, et al. 2005. STD and TRNOESY NMR studies on the conformation of the oncogenic protein beta-catenin containing the phosphorylated motif DpSGXXpS bound to the beta-TrCP protein. J. Biol. Chem. 280: 29107– 29116 [DOI] [PubMed] [Google Scholar]
- 31. Molina-Jijon E, et al. 2011. Curcumin prevents Cr(VI)-induced renal oxidant damage by a mitochondrial pathway. Free Radic. Biol. Med. 51: 1543– 1557 [DOI] [PubMed] [Google Scholar]
- 32. Pan Y, Bai CB, Joyner AL, Wang B. 2006. Sonic hedgehog signaling regulates Gli2 transcriptional activity by suppressing its processing and degradation. Mol. Cell. Biol. 26: 3365– 3377 [DOI] [PMC free article] [PubMed] [Google Scholar]
- 33. Papkoff J, Aikawa M. 1998. WNT-1 and HGF regulate GSK3 beta activity and beta-catenin signaling in mammary epithelial cells. Biochem. Biophys. Res. Commun. 247: 851– 858 [DOI] [PubMed] [Google Scholar]
- 34. Piotto M, Saudek V, Sklenar V. 1992. Gradient-tailored excitation for single-quantum NMR spectroscopy of aqueous solutions. J. Biomol. NMR 2: 661– 665 [DOI] [PubMed] [Google Scholar]
- 35. Pons J, et al. 2007. Structural studies on 24P-IkappaBalpha peptide derived from a human IkappaB-alpha protein related to the inhibition of the activity of the transcription factor NF-kappaB. Biochemistry 46: 2958– 2972 [DOI] [PubMed] [Google Scholar]
- 36. Pons J, et al. 2008. Transfer-NMR and docking studies identify the binding of the peptide derived from activating transcription factor 4 to protein ubiquitin ligase beta-TrCP. Competition STD-NMR with beta-catenin. Biochemistry 47: 14– 29 [DOI] [PubMed] [Google Scholar]
- 37. Pons J, Tanchou V, Girault JP, Bertho G, Evrard-Todeschi N. 2011. NMR applications for identifying beta-TrCP protein-ligand interactions. Mini Rev. Med. Chem. 11: 283– 297 [DOI] [PubMed] [Google Scholar]
- 38. Rada P, et al. 2011. SCF/{beta}-TrCP promotes glycogen synthase kinase 3-dependent degradation of the Nrf2 transcription factor in a Keap1-independent manner. Mol. Cell. Biol. 31: 1121– 1133 [DOI] [PMC free article] [PubMed] [Google Scholar]
- 39. Rojo AI, et al. 2010. Nrf2 regulates microglial dynamics and neuroinflammation in experimental Parkinson's disease. Glia 58: 588– 598 [DOI] [PubMed] [Google Scholar]
- 40. Rojo AI, et al. 2012. Signaling pathways activated by the phytochemical nordihydroguaiaretic acid contribute to a Keap1-independent regulation of Nrf2 stability: role of glycogen synthase kinase-3. Free Radic. Biol. Med. 52: 473– 487 [DOI] [PubMed] [Google Scholar]
- 41. Rojo AI, et al. 2008. Functional interference between glycogen synthase kinase-3 beta and the transcription factor Nrf2 in protection against kainate-induced hippocampal cell death. Mol. Cell. Neurosci. 39: 125– 132 [DOI] [PubMed] [Google Scholar]
- 42. Rojo AI, Sagarra MR, Cuadrado A. 2008. GSK-3beta down-regulates the transcription factor Nrf2 after oxidant damage: relevance to exposure of neuronal cells to oxidative stress. J. Neurochem. 105: 192– 202 [DOI] [PubMed] [Google Scholar]
- 43. Rushmore TH, Kong AN. 2002. Pharmacogenomics, regulation and signaling pathways of phase I and II drug metabolizing enzymes. Curr. Drug Metab. 3: 481– 490 [DOI] [PubMed] [Google Scholar]
- 44. Skowyra D, Craig KL, Tyers M, Elledge SJ, Harper JW. 1997. F-box proteins are receptors that recruit phosphorylated substrates to the SCF ubiquitin-ligase complex. Cell 91: 209– 219 [DOI] [PubMed] [Google Scholar]
- 45. States DJ, Haberkorn RA, Ruben DJ. 1982. A two-dimensional nuclear Overhauser experiment with pure absorption phase in four quadrants. J. Magn. Reson. 48: 286– 292 [Google Scholar]
- 46. Taguchi K, Motohashi H, Yamamoto M. 2011. Molecular mechanisms of the Keap1-Nrf2 pathway in stress response and cancer evolution. Genes Cells 16: 123– 140 [DOI] [PubMed] [Google Scholar]
- 47. Tong KI, Kobayashi A, Katsuoka F, Yamamoto M. 2006. Two-site substrate recognition model for the Keap1-Nrf2 system: a hinge and latch mechanism. Biol. Chem. 387: 1311– 1320 [DOI] [PubMed] [Google Scholar]
- 48. Venugopal R, Jaiswal AK. 1996. Nrf1 and Nrf2 positively and c-Fos and Fra1 negatively regulate the human antioxidant response element-mediated expression of NAD(P)H:quinone oxidoreductase1 gene. Proc. Natl. Acad. Sci. U. S. A. 93: 14960– 14965 [DOI] [PMC free article] [PubMed] [Google Scholar]
- 49. Wang B, Li Y. 2006. Evidence for the direct involvement of βTrCP in Gli3 protein processing. Proc. Natl. Acad. Sci. U. S. A. 103: 33– 38 [DOI] [PMC free article] [PubMed] [Google Scholar]
- 50. Watanabe N, et al. 2004. M-phase kinases induce phospho-dependent ubiquitination of somatic Wee1 by SCFbeta-TrCP. Proc. Natl. Acad. Sci. U. S. A. 101: 4419– 4424 [DOI] [PMC free article] [PubMed] [Google Scholar]
- 51. Willker W, Leibfritz D, Kerssebaum R, Bermel W. 1993. Gradient selection in inverse heteronuclear correlation spectroscopy. Magn. Reson. Chem. 31: 287– 292 [Google Scholar]
- 52. Wu G, et al. 2003. Structure of a beta-TrCP1-Skp1-beta-catenin complex: destruction motif binding and lysine specificity of the SCF(beta-TrCP1) ubiquitin ligase. Mol. Cell 11: 1445– 1456 [DOI] [PubMed] [Google Scholar]
- 53. Wüthrich K. 1986. NMR of proteins and nucleic acids. John Wiley & Sons, New York, NY [Google Scholar]
- 54. Zhang DD, Lo SC, Cross JV, Templeton DJ, Hannink M. 2004. Keap1 is a redox-regulated substrate adaptor protein for a Cul3-dependent ubiquitin ligase complex. Mol. Cell. Biol. 24: 10941– 10953 [DOI] [PMC free article] [PubMed] [Google Scholar]
- 55. Zhou BP, et al. 2004. Dual regulation of Snail by GSK-3beta-mediated phosphorylation in control of epithelial-mesenchymal transition. Nat. Cell Biol. 6: 931– 940 [DOI] [PubMed] [Google Scholar]
- 56. Zhu Z, Kirschner M. 2002. Regulated proteolysis of Xom mediates dorsoventral pattern formation during early Xenopus development. Dev. Cell 3: 557– 568 [DOI] [PubMed] [Google Scholar]
Associated Data
This section collects any data citations, data availability statements, or supplementary materials included in this article.