


Abstract
Small RNAs (sRNAs) and proteins acting as transcription factors (TFs) are the principal components of gene networks. These two classes of signaling molecules have distinct mechanisms of action; sRNAs control mRNA translation, whereas TFs control mRNA transcription. Here, we directly compare the properties of sRNA and TF signaling using mathematical models and synthetic gene circuits in Escherichia coli. We show the abilities of sRNAs to act on existing target mRNAs (as opposed to TFs, which alter the production of future target mRNAs) and, without needing to be first translated, have surprisingly little impact on the dynamics. Instead, the dynamics are primarily determined by the clearance rates, steady-state concentrations and response curves of the sRNAs and TFs; these factors determine the time delay before a target gene’s expression can maximally respond to changes in sRNA and TF transcription. The findings are broadly applicable to the analysis of signaling in gene networks, and we demonstrate that they can be used to rationally reprogram the dynamics of synthetic circuits.
INTRODUCTION
In Escherichia coli, small non-coding RNAs (sRNAs) and transcription factors (TFs) are the major components of gene networks, and they have fundamentally different mechanisms (Figure 1A and B). Most sRNAs are trans-acting and anneal to cognate target mRNAs via a series of reaction steps requiring the Hfq protein and culminating in a sRNA-target mRNA duplex [reviewed in (1)]. Duplex formation commonly decreases the translation of target mRNAs and increases their degradation, but it can also have the opposite effects [reviewed in (2)]. In contrast to the post-transcriptional action of sRNAs, TFs bind at the regulatory DNA sequences of target genes to increase or decrease transcription. While sRNAs and TFs have different mechanisms of action, they do not typically function independently but work together to regulate gene expression (3).
Figure 1.

sRNA and transcription factor (TF) regulation in a simple genetic circuit. (A, B) sRNAs bind to target mRNAs resulting in a duplex which decreases (sRNA silencer) or increases (sRNA activator) mRNA translation. For sRNA silencers, it is the target mRNA that is translated, whereas for sRNA activators, it is the duplex that is translated. TFs bind to sequences at or near the promoter of the target gene to increase or decrease its transcription. αS, αM, αP, αTFM, αTFP, αD, k and KD are rate constants as defined in the main text. Degradation reactions, which are included in the models, are not shown. (C, D) Experimental system for characterizing the response curves and dynamics (see the main text).
The aim of this study is to characterize how the different mechanisms of TFs and sRNAs affect the dynamics of target gene expression in gene networks. A detailed understanding of the dynamics is essential to understand why these two distinct classes of signaling molecules have evolved, their functional advantages and disadvantages, and to be able to optimize their properties in synthetic gene circuits. Previous theoretical work indicates that the dynamics of sRNA regulation and TF regulation may be very different (4–7); in particular, it has been proposed that sRNAs may enable faster response times in gene networks due to their faster turn-over rates (8). We sought to experimentally verify these predictions using synthetic gene circuits that allow the dynamics of sRNA and TF regulation to be directly compared. The advantages of synthetic gene circuits are as follows: (i) sRNAs and TFs can be compared in identical networks; (ii) sRNA, TF and target mRNA transcription rates can be precisely controlled; (iii) the properties of sRNAs and TFs (e.g. their binding affinity) are more easily manipulated and (iv) signaling can be decoupled (at least partly) from physiological control mechanisms such as feedforward loops (9,10).
Our study characterized the dynamics using sRNAs that decrease and increase target gene translation (‘sRNA silencers’ and ‘sRNA activators’, respectively) and TFs that decrease and increase target gene transcription (‘TF repressors’ and ‘TF activators’, respectively). In the first part of this study, we modeled and measured how target gene expression changes in response to varying levels of sRNA or TF transcription (i.e. ‘response curves’). We demonstrated that the response curves for sRNAs tend to be linear, whereas the response curves for TFs are nonlinear. In the second part of this study, we simulated and measured the dynamics of sRNA and TF regulation. We identified three important factors for the dynamics: (i) the clearance rates of sRNAs and TFs; (ii) the steady-state sRNA and TF concentrations and (iii) the ‘shape’ of the response curves for sRNA and TF regulation. These three factors determine the time delay before target gene expression can maximally respond to changes in sRNA and TF transcription. In the third part of the study, we demonstrated that the response curve and steady-state concentration of TFs can be altered so the dynamics of sRNA and TF regulation are very similar.
MATERIALS AND METHODS
Models and parameter values
sRNA and TF regulation was modeled using sets of differential equations, which were similar to that previously described (5,7). The differential equations and their steady-state solutions are provided in the Supplementary Methods. Our model differs from reported models by one or more of the following: (i) the inclusion of activation of gene expression as well as silencing and repression by sRNAs and TFs; (ii) target protein concentrations are the measured output (as opposed to target mRNA concentrations) and (iii) sRNA and TF transcription levels are the variable input instead of target mRNA transcription.
The transcription rates of the sRNA and TF mRNA (αS and αTFM, respectively, with units of nM min−1) were initially varied from 10−3-to 103-fold that of the target mRNA (αM = 1 nM min−1) (7). The translation rate of the TF mRNA, target mRNA and duplex (αTFP, αP and αD, respectively) was 5 protein nM (mRNA nM)−1 min−1 based on a measurement of the burst size for LacI (11). The rate constant for duplex formation (k) was assigned a relatively high value (5 nM−1 min−1) so that it was not a rate-limiting step. The sRNAs, target mRNAs, duplexes and TF mRNAs were all assumed to have a half-life of 5 min (12), which equates to their degradation rate constants (βS, βM, βD and βTFM, respectively) being equal to 0.14 min−1 [−ln(0.5)/(5 min)] (see comments on sRNA degradation in the Supplementary Methods). All proteins were assumed to be primarily removed by the dilution associated with cell growth (13). MG1655 in mid-exponential growth was measured, and the doubling time was 20.9 min ± 1.1 min which corresponds to a degradation constant of ∼0.03 min−1 [−ln(0.5)/(21 min)]. In vivo measurements of the dissociation constant (KD) range from 0.2 to 100 nM (14); therefore, an intermediate value of 10 nM was used. Most TFs have a Hill coefficient of ∼2 (15–19); therefore, this value was used in the models.
Plasmids and strains
Details of the strains, plasmids and oligonucleotide sequences are described in Supplementary Tables S1–S3. The structure of the plasmids and their construction has been reported (20). The source or sequences of the DsrA, MicC, ompC, rpoS, mCherry, gfp and the PLlacO-1 and PLtetO-1 promoters has also been reported (20). The Plar promoter was synthesized (21). The AAV-tag was added to gfp by PCR (22). araC was PCR amplified from the genomic DNA of E. coli MG1655. tetR was obtained from pJM31 (23), and a frameshift mutation in the gene was corrected to match the published sequence in pIKE107 (24). micC, dsrA and araC were deleted from the chromosome by the λ-Red method (25).
Measurements of gene expression
Cells were cultured in LB-Luria media with 100 µg/mL of ampicillin at 37°C and 200 rpm. GFP measurements for the response curves were performed during early exponential growth (OD600nm ∼ 0.04) by flow cytometry as previously reported (20). Dynamics experiments were performed as follows: 1/1000 dilution of overnight culture was inoculated into LB-Luria media with 0 or 1 mM IPTG for 2.5–3 h (final OD600nm ∼0.3). A further 1/1000 dilution of the culture (or 1/100 dilution for measuring time points <30 min) was inoculated into fresh media with 0 or 1 mM IPTG. For strains with the TF activator (AraC), the media also contained 10 mM l-arabinose unless otherwise stated. Of culture, 1 mL was removed at the specified time points and placed on ice. GFP fluorescence for the dynamics samples was also measured by flow cytometry (20).
RESULTS
Modeling the sRNA and TF circuits
The regulation of a target gene by sRNAs and TFs was examined in mathematical models that describe the synthetic circuits used in our experiments (below). In the circuits, sRNA and TF transcription is varied by an external input (isopropyl-β-d-thiogalactopyranoside, IPTG), and the protein concentration of the target gene (‘target gene expression’) is the output (Figure 1C and D). The target protein concentration depends on the free target mRNA concentration for sRNA silencers, TF repressors and TF activators, and it depends on the duplex concentration for sRNA activators. The circuits were modeled using sets of differential equations, and general parameter values were obtained from the literature with the exception of the rate constant for duplex formation (k) which was assigned a relatively high value so that it was not rate limiting (see ‘Materials and Methods’ section and Supplementary Methods). We did not adjust parameters to ‘fit’ the experimental data.
For sRNAs, we used a ‘basic’ model where duplex formation is treated as a single, irreversible bimolecular reaction between the sRNA and its target mRNA. With the specified parameter values, the basic model generated results that were similar to a more complex ‘extended’ model that explicitly included Hfq and the intermediate Hfq complexes (sRNA-Hfq, target mRNA-Hfq and sRNA-Hfq–target mRNA complexes) that are often required for duplex formation (Supplementary Methods) (26). The basic and extended models yielded similar results with biologically relevant parameters (Supplementary Figure S1). Since there was no clear advantage to using the more computationally intensive, extended model, we used the basic model for simulating the response curves and dynamics. For TFs, we modeled their effect on target gene transcription using standard Hill-type functions for repression and activation (13) (Supplementary Methods).
Experimental system
The predictions of the model were tested using a fluorescence reporter system (Figure 1C and D). Transcription of the sRNA or TF genes was controlled by the PLlacO-1 promoter (27), which is repressed by LacI. IPTG, which enters the cell and binds to LacI, was added to the media to alter the amount of repression and consequently the sRNA and TF mRNA transcription rates. The sRNA and TF circuits were placed in wild-type MG1655 with lacIq as well as the native lacI. This background strain also has the native lacZYA operon, and therefore, IPTG can increase its own uptake into the cell by inducing LacY expression resulting in a steeper induction curve (28). However, the steepness of the IPTG induction curve does not affect the direct comparison of sRNA and TF regulation because it is present in both the sRNA and TF circuits. Furthermore, the shape of the IPTG induction curve is not important because we account for it when we determined the relative levels of sRNA and TF transcription at different IPTG concentrations by placing gfp under the direct control of PLlacO-1 (Supplementary Figure S2).
TFs and sRNAs act on target genes which have both binding sites for the TF at the promoter and for the sRNA at target sequences fused to the gfp gene. The relative level of target protein (GFP) is quantified by the GFP fluorescence level (i.e. ‘target gene expression’) (7,20,29). We chose MicC and DsrA, which act on target sequences from ompC and rpoS, respectively, as the sRNA silencer and sRNA activator because they are well characterized and have minimal toxicity when overexpressed (20). The tetracycline repressor (TetR) and arabinose activator (AraC), which act at the PLtetO-1 and Plar promoters, respectively, were chosen as the TF repressor and TF activator (21,27). AraC is only able to bind to the I1-I2 regulatory elements in Plar and activate transcription in the presence of l-arabinose which binds and causes a conformational change in AraC (30).
sRNA and TF circuits have different response curves
The first step in the study was to characterize the response curves for the sRNA and TF genes; that is, how target gene expression is altered by varying levels of sRNA and TF transcription. The response curves were obtained by solving the dynamics equations at steady state and substituting general parameter values from the literature (see ‘Materials and Methods’ section). We did not perform ‘curve-fitting’ to modify the appearance of the functions. Initially, the sRNA and TF transcription rates were varied from 0.001- to 1000-fold the transcription rate of the target gene (Figure 2A and B). The response curves showed that most biologically relevant regulation of target gene expression, which we define as within 1% and 99% of maximum target gene expression (the ‘regulatory range’), occurs when sRNA and TF transcription is less than or equal to the target gene’s transcription rate (green line, Figure 2A–D). Furthermore, the response curves indicated that TFs cause a greater decrease or increase in target gene expression than sRNAs at any transcription level (Figure 2C and D).
Figure 2.

Theoretical and experimental response curves. Error bars indicate the SEM of duplicate measurements. Yellow shading indicates the approximate bounds of the regulatory region. Transcription rates of the sRNA and TF genes are normalized to the target gene transcription rate which is 1 nM min−1 (which is 0 on the log10 scale) (green line). (A, B) Theoretical response curves with relative sRNA and TF transcription rates from 0.001- to 1000-fold the target mRNA rate. Equations and parameters are listed in the Supplementary Methods and ‘Materials and Methods’ section. (C, D) Linear plot of the data from panels A and B where sRNA and TF transcription is limited to a rate equal to the target gene. (E) Experimental response curve for MicC (sRNA silencer) acting on the ompC target sequence (HL1085). (F) Experimental response curve for tetracycline repressor, TetR (TF repressor) acting at the PLtetO-1 promoter (HL1082). Note: The data were not fitted to a Hill function (see below) because only part of the response curve can be measured due to ‘leaky’ TetR. (G) Experimental response curve for DsrA (sRNA activator) acting on the rpoS target sequence (HL1299). (H) Experimental response curves for AraC (TF activator) acting on the Plar promoter in the presence of 10 mM l-arabinose with either the rpoS target sequence in a ΔdsrA background [plus constitutive transcription of DsrA under the control of PLtetO-1 (HL1449)] or the ompC target sequence in a ΔmicC background (HL1289). Data were fitted to a Hill-type function  , where α is the maximum expression due to induction (units: fluorescence, a.u.), TF* is the TF transcription rate which is presumed to be proportional to the TF concentration (units: relative transcription, a.u.), K is the TF transcription rate that results in half the maximal level of induced expression (units: relative transcription, a.u.), n is the Hill coefficient (unitless) and c is the level of expression before IPTG is added (units: fluorescence, a.u.). The fit values for AraC-rpoS are: R2 = 0.98, reduced χ2 = 44.9, α = 3.43 ± 0.61 a.u., K = 0.34 ± 0.17 a.u., n = 0.57 ± 0.10, c = 0.99 ± 0.08 a.u. The fit values for AraC-ompC are: R2 > 0.99, reduced χ2 = 3.24, α = 7.47 ± 0.46 a.u., K = 0.05 ± 0.004 a.u., n = 0.81 ± 0.08, c = 0.55 ± 0.21 a.u.
The response curves were then measured experimentally using our sRNA and TF circuits. As predicted, we observed different response curves for the sRNA and TF regulation. Increasing transcription of the sRNA silencer (MicC) caused a linear decrease in target gene expression, whereas increasing transcription of the TF repressor (TetR) caused a steep, nonlinear decrease in target gene expression (Figure 2E and F). The TF repressor was so potent that small amounts of ‘leaky’ TF transcription were sufficient to decrease the target gene expression by 10-fold compared to the sRNA at 0 µM IPTG (compare y-intercepts). Different response curves were also observed for the sRNA activator (DsrA) and TF activator (AraC) (Figure 2G and H). Increasing the transcription of the sRNA activator resulted in an approximately linear increase in target gene expression with a small offset (the offset may be related to the interaction of many types of sRNAs at the rpoS target sequence) (31,32). In contrast, increasing transcription of the TF activator produced a steep, nonlinear increase in target gene expression after which further transcription produced minimal increases in expression.
The basis for the linear decrease in the mRNA concentration with increasing sRNA transcription has been described (7) and is due to each sRNA being able to silence or activate only one target mRNA under conditions where the sRNA concentration < target mRNA concentration. In contrast, TFs have nonlinear response curves because there are a limited number of promoter binding sites, and there is increasing competition for those sites as the TF concentration increases. Arabinose-bound AraC can increase the expression of arabinose transporters, leading to increased intracellular arabinose (note: AraC does not regulate its own transcription (19) in our system because araC is controlled by the PLlacO-1 promoter). This positive feedback may have increased the steepness of the response curve (33), but it did not produce bistable gene expression (Supplementary Figure S3) as has been observed with the ParaBAD promoter (34).
In summary, the predicted and experimental response curves showed major differences between sRNAs and TFs. The sRNA response curves are linear, whereas the TF responses curves are nonlinear with a greater relative effect at low transcription rates. We show below that these differences in the sRNA and TF response curves have an impact on the dynamics of sRNA and TF regulation.
Predicted dynamics of sRNA and TF regulation
We next predict the dynamics of target gene expression after sRNA and TF transcription is turned on and off. The differential equation for the target protein concentration [P] (Supplementary Methods) was solved to yield:
| (1) |
[P](0) is the initial target protein concentration [units: nM], αP is the translation rate of P [units: proteins nM (mRNA nM)−1 min−1], βP is the degradation rate of P [units: min−1], and [Y] is the target gene mRNA or duplex mRNA concentration [units: nM]. Note: we measure the protein concentration by the fluorescence (a.u) which is assumed to be directly proportional to the protein concentration by a factor of f [units: (fluorescence, a.u.) (protein nM)−1].
Equation (1) shows that once the target mRNA or duplex reaches steady state (i.e. [Y] is constant), the target protein concentration converges to the new steady-state concentration at a maximum rate determined by the degradation constant (βP) (Figure 3A). Prior to the target mRNA or duplex reaching steady state [Y], the target protein concentration changes at a lower rate. This is clearly shown in Figure 3A which compares the dynamics following a change in sRNA and TF transcription between a system where the sRNA, TF and Y concentrations reach steady state instantaneously (green solid and dash curves) and a system where there is a time delay while the sRNA, TF and Y concentrations reach their new steady state (black solid and dash curves). The time delay results in a rate of response that is initially < βP (note the slope of the black solid curve is less steep than the green solid curve in Figure 3A at time points <<1 a.u.). As the sRNA, TF and Y concentrations reach steady state, the rate of response approaches βP (note the parallel slopes of the black solid and green solid curves in Figure 3A at time points >>1 a.u.). In other words, the time required by target mRNAs or duplexes to reach steady state causes a delay (τ) in target gene expression achieving its maximum rate of change (Figure 3A) (note: theoretically the steady state can only be reached after an infinite amount of time, but in practice a value that is indistinguishable from steady state can be attained when the difference is small compared to the measurement error and the amplitude of the stochastic fluctuations).
Figure 3.

Predicted dynamics of sRNA and TF regulation. (A) Target protein concentration as a function of time with and without the delay due to the target mRNA or duplex taking time to reach steady state (Equation 1). Parameter values were chosen to best illustrate the effect of the degradation rate on the dynamics and the time delay (values are not necessarily those used in the model). For turning on transcription with no delay, the parameters values are: αP = proteins nM (mRNA nM)−1 min−1, βP = 0.05 min−1, P[0] = 0 nM, [Y] = 1 nM with [Y] reaching steady state immediately. For turning off transcription with no delay, the parameters values are the same except that [Y] = 0 nM and P[0] = 1 nM. Simulations with the delay are identical except that [Y] does not reach steady state immediately but approaches its steady state according to the same function and with the same parameter values as [P]. 0* indicates an actual value of zero not 100. (B–E) Simulated dynamics following the turning on or off of sRNA and TF transcription (parameters are listed in ‘Materials and Methods’ section).
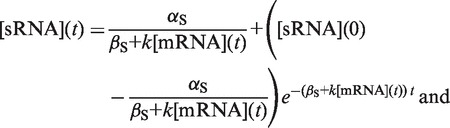
When comparing sRNA and TF regulation, the same target protein (GFP fusion) is used, and therefore βP is the same. Consequently, any differences in the dynamics of sRNA and TF regulation must be due to differences in the time the target mRNAs and duplexes (i.e. [Y]) take to reach steady state, which will appear as a time delay in target gene expression responding to changes in sRNA and TF transcription. The time delay in the target mRNAs and duplexes reaching steady state in turn depends on the dynamics of the sRNA and TF concentrations and their impact on target mRNA and duplex concentrations. We, therefore, solved the dynamics equations for the sRNA and TF concentrations [(sRNA) and (TF)] (Supplementary Methods) which yielded:
 |
(2) |
 |
(3) |
αS is the sRNA transcription rate [units: nM min−1], αTFP is the TF translation rate [units: proteins nM·(mRNA nM)−1·min−1], βS and βTFP are the sRNA and TF degradation rates [units: min−1], k is the duplex formation rate constant [units: nM−1 min−1], [mRNA] is the target mRNA concentration [units: nM], [TF mRNA] is the TF mRNA concentration [units: nM] and [sRNA](0) and [TF](0) are the initial sRNA and TF concentrations [units: nM], respectively.
Two key points for sRNA and TF dynamics are apparent from Equations (2) and (3). First, sRNA and TF concentrations also increase or decrease at a rate that depends on their clearance (βS + k[mRNA] and βTFP, respectively). sRNAs usually have shorter half-lives than TFs (βS > βP, see Supplementary Methods) and are removed by duplex formation; therefore, their overall clearance rate is greater (note: ‘degradation’ refers to sRNA removal by mechanisms other than duplex formation). As a consequence, sRNAs approach their steady-state concentrations more rapidly than TFs. Second, the steady-state concentrations of sRNAs and TFs are αS/(βS + k[mRNA*]) and αTFP[TF mRNA*]/βTFP, respectively, (where [mRNA*] and [TF mRNA*] are the steady-state target mRNA and TF mRNA concentrations). The denominator of these expressions (containing the clearance parameters) is typically greater for sRNAs, whereas the numerator (containing the production parameters) can be much greater for TFs. Therefore, steady-state concentrations of TFs are likely to be greater than for sRNAs at any transcription level (Supplementary Figure S4).
The response curves showed that different relative concentrations of sRNAs and TFs are needed to regulate target gene expression over the regulatory range. TF concentrations corresponding to ∼0.001% and 8% of the relative TF transcription level are sufficient to achieve the upper and lower bounds of the regulatory range for target gene expression (Figure 2D). Therefore, TFs can exert close to maximal activity soon after their transcription is turned on (i.e. TFs don’t need to wait until they achieve a value close to their steady-state concentrations). At TF concentrations corresponding to >8% of the relative transcription level, there is minimal further increase in repression or activation; however, these ‘excess’ TFs can cause a time delay before target gene expression responds to TF transcription being turned off. For example, at a TF concentration corresponding to 100% of the relative transcription level, >92% of the TFs must be removed before a significant change in target gene expression will occur after TF transcription is turned off (Figure 2D). Furthermore, the excess TFs are removed slowly due to their low degradation rate. When compared, sRNAs do not exceed (or minimally exceed) the concentration needed to achieve the upper and lower bounds of the regulatory range for target gene expression (Figure 2C) and have high clearance rates. Therefore, target gene expression changes with minimal delay when sRNA transcription is turned on or off.
Simulations were performed to demonstrate the predicted behaviors. As expected, when transcription of the sRNA silencer and sRNA activator were turned on and off, target gene expression changed with minimal delay (Figure 3B and C). Similarly, when transcription of the TF repressor and TF activator were turned on, target gene expression responded with minimal delay (Figure 3D). However, when transcription of the TF activator and TF repressor genes were turned off, there was a long period before target gene expression responded. During this delay, TF activity can continue and produce a ‘dip’ in target gene expression as was observed with the TF repressor (Figure 3E).
In summary, the theory and simulations show that (i) differences in sRNA and TF dynamics affect the time delay before target gene expression responds maximally to changes in sRNA and TF transcription; (ii) this time delay depends on the concentrations, clearance rates and response curves of sRNAs and TFs and (iii) there may be a long time delay before target gene expression responds to TF transcription being turned off.
Experimental dynamics of sRNA and TF regulation
The predicted dynamics of sRNA and TF regulation were measured by turning on and off the transcription of the sRNA or TF genes by placing cells in media with or without 1 mM IPTG, respectively. We show that in a system where LacI directly regulates target gene transcription without any intermediate sRNA and TF signaling, changing the IPTG concentration alters target gene expression without any delay (τ <30 min) (Figure 4A). Turning on and off the transcription of the sRNA silencer (MicC) and sRNA activator (DsrA) changed target gene expression with minimal delay (Figure 4B and C). In addition, turning on the transcription of the TF repressor (tetR with the st7 RBS) and TF activator (araC with the st7 RBS), genes produced an immediate change in target gene expression (Figure 4D). In contrast, there was a delay before target gene expression responded to the turning off of TF activator (AraC) and TF repressor (TetR) transcription (Figure 4E).
Figure 4.

Experimental dynamics following the turning on or off of sRNA and TF transcription. The sRNAs are MicC and DsrA, and the TFs are TetR (st7) and AraC. Strains are the same as used in Figure 2. sRNAs and TFs are turned on and off by the addition or removal of IPTG from the media. Error bars are the SEM of duplicate measurements. (A) The direct turning on and off of target gene transcription without sRNA and TF regulation (HL1178). (B) sRNA transcription turned on. (C) sRNA transcription turned off. (D) TF transcription turned on. (E) TF transcription turned off.
For the TF repressor (TetR) circuit, we showed the delay was due to continued TetR binding by demonstrating that the delay disappears when aTc, which prevents TetR binding to the operator sequences, is added to the media (see below). For the TF activator (AraC), we show the delay is due to the continued binding of arabinose-bound AraC at the target gene’s promoter by demonstrating that the delay disappears when arabinose, which is necessary for AraC binding to Plar, is removed from the media. The continued activation of gene expression at Plar after IPTG was removed (i.e. the delay) also indicates that LacI and IPTG do not inhibit AraC activity as has been observed in some other systems (21,35); otherwise, the removal of IPTG from the media would have caused Plar expression to turn off immediately as in Figure 4A. It should also be noted that if arabinose transport is rapidly shut off and intracellular arabinose is rapidly metabolized after araC transcription is turned off, then the time delay for turning off target gene expression would be decreased compared to a system where the intracellular arabinose concentration is constant.
Together the experiments show a delay in turning off the TF repressor (TetR) and TF activator (AraC) activity which is consistent with being due to their slow rate of removal from the cell as previously proposed (8) and their higher concentrations. These experimental findings are in qualitative agreement with the predictions of the model (compare Figures 3B–E and 4); there are some quantitative differences, but this is unsurprising, given that general parameter values were used in the models.
Reprogramming response curves and dynamics
We sought to modify the dynamics of TF regulation to make it more similar to sRNA regulation. In particular, we wanted to shorten the time delay in turning off TF activity by two simple modifications. First, we reduced the TF concentration by decreasing its translation rate (i.e. decrease αTFP so less TF is produced from each TF mRNA). Second, we decreased TF binding affinity (i.e. increased KD), thereby shifting the response curve so that higher TF concentrations are required to affect target gene expression. We did not change the degradation rate because it has both direct and indirect effects (i.e. it also alters the TF concentration) on the dynamics.
We simulated a 50-fold decrease in TF mRNA translation or a 50-fold decrease in TF binding affinity (Figure 5A); these modifications had equivalent effects on the TF repressor’s response curve. The modifications increased the relative levels of TF transcription needed to obtain the upper and lower bounds of the regulatory range. Since the response curve of the modified TF repressor was more similar to the sRNA silencer, we expected its dynamics to also be more similar to the sRNA (i.e. a short time delay after TF transcription is turned off). The simulations confirmed the predicted dynamics (compare Figures 3E and 5B). It is noteworthy that while the delay was decreased relative to the unmodified TetR, it was still greater for the sRNA despite their similar response curves (compare Figures 3C and 5B). The remaining difference in the time delay is due to the lower clearance rate of the modified TF repressor compared to the sRNA silencer.
Figure 5.

Reprogramming response curves and dynamics. Errors bars indicate the SEM of duplicate measurements. (A) Theoretical response curves for the TF repressor with decreased translational efficiency or decreased binding affinity (note: the two curves are identical and overlay each other). sRNA silencer and TF repression curves from Figure 2C and D are shown for comparison. (B) Theoretical dynamics for TF repression with decreased translation or decreased binding affinity. (C, D) Experimental response curve and dynamics with decreased translation of the TF repressor (TetR). The highly efficient RBS (st7) was replaced with the less-efficient RBS (st3) (HL1176). Response curves for MicC and TetR (st7) from Figure 2E and F are shown for comparison. (E, F) Experimental response curve and dynamics with decreased binding affinity of the TF repressor (TetR). The binding affinity of TetR (st7) was reduced by adding 1 µM aTc to the media (HL1082). Response curves for MicC and TetR (st7) without aTc from Figure 2E and F are shown for comparison.
The predictions and simulations were tested experimentally using TetR. TetR translation was decreased by replacing the original, highly efficient RBS (st7) with a less-efficient RBS (st3) (36). TetR (st3) required a much greater level of transcription than the original TetR (st7) to achieve complete repression (although the level of transcription needed was still much less than for the sRNA) (Figure 5C). Based on this response curve, target gene expression was expected to respond with less delay in the presence of the less efficiently translated TetR (st3) than with the original TetR (st7) and our dynamics measurements confirmed this (Figure 5D). A dip occurred in the dynamics curve after tetR transcription was turned off due to continued TetR (st3) activity during the delay (Figure 5D), which was also seen in the model, because TetR had not reached steady state before being turned off (Figure 3E). Decreasing the binding affinity for TetR (st7) by adding 1 µM aTc to the media also resulted in response curves (Figure 5E) and dynamics (Figure 5F) that were more similar to that of the sRNA silencer with no detectable delay in target gene expression after tetR transcription was turned off. Together these experiments show that ‘excess’ TF concentrations contribute to the time delay, and therefore decreasing the TF concentration or modulating the response curve decreases the time delay.
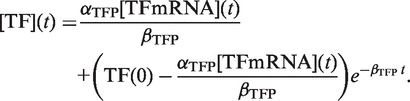
In our experiments and models, there was no difference in the time delay following sRNA and TF transcription being turned on. However, other theoretical studies predicted that there should be a difference with sRNAs having a shorter delay (5) (note: our theoretical calculations, which are shown in the Supplementary Methods, indicate that any reduction in the time delay for turning on would be very small). The lack of a detectable difference in the delay for sRNAs and TFs is unlikely to be due to the low degradation rate of the target protein (GFP) because the time delay is independent of the degradation rate of the target protein as shown by Equations (1–3). This was experimentally confirmed by attaching an AAV degradation tag to the GFP protein (22) which decreased its half-life from ∼25 to ∼6 min (determined by the relative change in mean expression). We also decreased the time from induction to the first measurement from 30 to 5 min. With the AAV-tagged target protein, we again found no difference in the time delay before target gene expression responds to the transcription of the sRNA silencer and TF repressor [TetR (st3)] being turned on (Figure 6). These experiments showed that any difference that exists in the time delay following the induction of sRNA and TF transcription is very small (<<5 min).
Figure 6.
Dynamics with GFPAAV following the turning on or of sRNA silencer (MicC) and TF repressor [TetR (st3)] transcription. *The PMT voltage for these flow cytometry measurements was increased to compensate for low-GFP concentrations; therefore, values in the plot should not be compared to values in other experiments. Strains are HL4870 (MicC-GFPAAV) and HL4872 (TetR (st3) GFPAAV).
DISCUSSION
In this study, we characterized how the different mechanisms of sRNAs and TFs affect signaling. We showed the dynamics of sRNA and TF regulation are primarily determined by their clearance rates, steady-state response curves and whether their concentrations exceed the amount needed to achieve the upper and lower bounds of a biologically relevant regulatory range for target gene expression (defined as being between 1% and 99% of the maximum). These three factors determine the time delay before target gene expression can maximally respond to changes in sRNA and TF transcription.
The models and experiments were designed so that sRNA and TF regulation could be meaningfully compared over the same range of transcription rates. Under these conditions, a long delay occurred before target gene expression responded to TF transcription being turned off due to their low clearance rates as previously postulated (8) and high concentrations. However under physiological conditions, sRNA and TF regulation may not occur at similar transcription rates. sRNA concentrations of 1500–3000 molecules/cell have been reported (37,38), whereas TF mRNAs are typically less than two molecules/cell (39). This large difference in RNA concentrations is due to different transcription rates rather than different sRNA and mRNA degradation rates (Supplementary Methods). As a result of the different transcription levels, TF concentrations are typically low (<100 molecules/cell) (39,40), despite multiple TFs arising from each TF mRNA. Therefore under physiological conditions, the time delays for sRNA and TF regulation are expected to be more similar than observed in this study. In addition, cells can rapidly inactivate TF activity by mechanisms including altering their phosphorylation state (41) and via the binding or unbinding of small molecules (e.g. l-arabinose) to reduce the time delay for TF signaling.
Intuitively, one might expect the time delay before target gene expression responds to the turning on of transcription to be shorter for sRNAs than TFs (5,42) for at least three reasons. First, sRNAs have the ability to inhibit or activate the translation of existing target mRNAs in contrast to TFs which only alter the production of future target mRNAs. However, this ability of sRNAs only decreases the time delay by a minimal amount because target mRNAs rapidly turnover. That is, the time saved by acting on existing target mRNAs compared to simply waiting for the target mRNAs to be degraded or created (as occurs with TFs) is small. Second, sRNAs are generally shorter than TFs and therefore require less time to be transcribed. While this theoretically reduces the time delay, the decrease is minimal because transcription is relatively fast (43). For example, a 1000 nucleotide TF mRNA takes only 20 s longer to transcribe than a 100 nucleotide sRNA; this difference is small compared to the half-lives of RNAs and proteins, and it only applies to the first sRNA created (Supplementary Methods). Third, sRNAs do not need to wait until they are translated to act. Again, the reduction in the time delay would be very small because translation occurs during transcription, and therefore, TFs are generated soon after transcription is completed. Our experiments confirmed that these differences in the production and action of sRNAs and TFs do not substantially affect the time delay.
We demonstrated that the dynamics and the response curves of TFs can be tuned and made to be more similar to that of sRNAs. This has direct applications for designing sRNAs and TFs to work seamlessly together in hybrid synthetic circuits. The potential differences in sRNA and TF regulation can be exploited in the construction of synthetic circuits; sRNAs are well suited for graded control of gene expression, whereas TFs are ideal for creating switches with a unidirectional time delay as we showed. Another advantage of sRNAs is that novel interacting sRNA-target mRNA pairs can be readily generated by introducing a mutation in a sRNA and a complementary mutation in its target mRNA sequence (44). These mutated pairs have minimal cross-talk with native sRNAs and target mRNAs (44) and thus little effect on cell physiology. The disadvantages of sRNAs include their relative inefficiency and the limited availability of Hfq (20,37). Unfortunately, a major limitation for the quantitative prediction of sRNA and TF signaling in synthetic and native gene circuits is the lack of measured parameter values for specific sRNAs and TFs; however, this is likely to improve with increasing emphasis on quantitative characterization of biological systems (45–50).
In conclusion, the results of this study are very general and are necessary to understand the dynamics of signal propagation in gene networks in prokaryotes and potentially also in eukaryotes (51,52). Furthermore, our findings have direct applications for the construction of synthetic circuits especially those incorporating sRNAs or where specific dynamic behaviors are desired.
SUPPLEMENTARY DATA
Supplementary Data are available at NAR Online: Supplementary Tables 1–3, Supplementary Figures 1–5, Supplementary Methods and Supplementary References [53–60].
FUNDING
University of California, Berkeley and the Hellman Family Faculty Fund. Funding for open access charge: University of California, Berkeley Research Impact Initiative.
Conflict of interest statement. None declared.
Supplementary Material
ACKNOWLEDGEMENTS
R.H. constructed the strains and performed the experiments. H.N.L. designed the study, analyzed the data, performed the modeling and simulations and wrote the paper. We thank David N. Adamson for comments on the manuscript and models.
REFERENCES
- 1.Vogel J, Luisi BF. Hfq and its constellation of RNA. Nat. Rev. Microbiol. 2011;9:578–589. doi: 10.1038/nrmicro2615. [DOI] [PMC free article] [PubMed] [Google Scholar]
- 2.Repoila F, Darfeuille F. Small regulatory non-coding RNAs in bacteria: physiology and mechanistic aspects. Biol. Cell. 2009;101:117–131. doi: 10.1042/BC20070137. [DOI] [PubMed] [Google Scholar]
- 3.Modi SR, Camacho DM, Kohanski MA, Walker GC, Collins JJ. Functional characterization of bacterial sRNAs using a network biology approach. Proc. Natl Acad. Sci. USA. 2011;108:15522–15527. doi: 10.1073/pnas.1104318108. [DOI] [PMC free article] [PubMed] [Google Scholar]
- 4.Mehta P, Goyal S, Wingreen NS. A quantitative comparison of sRNA-based and protein-based gene regulation. Mol. Syst. Biol. 2008;4:221. doi: 10.1038/msb.2008.58. [DOI] [PMC free article] [PubMed] [Google Scholar]
- 5.Shimoni Y, Friedlander G, Hetzroni G, Niv G, Altuvia S, Biham O, Margalit H. Regulation of gene expression by small non-coding RNAs: a quantitative view. Mol. Syst. Biol. 2007;3:138. doi: 10.1038/msb4100181. [DOI] [PMC free article] [PubMed] [Google Scholar]
- 6.Legewie S, Dienst D, Wilde A, Herzel H, Axmann IM. Small RNAs establish delays and temporal thresholds in gene expression. Biophys. J. 2008;95:3232–3238. doi: 10.1529/biophysj.108.133819. [DOI] [PMC free article] [PubMed] [Google Scholar]
- 7.Levine E, Zhang Z, Kuhlman T, Hwa T. Quantitative characteristics of gene regulation by small RNA. PLoS Biol. 2007;5:e229. doi: 10.1371/journal.pbio.0050229. [DOI] [PMC free article] [PubMed] [Google Scholar]
- 8.Levine E, Hwa T. Small RNAs establish gene expression thresholds. Curr. Opin. Microbiol. 2008;11:574–579. doi: 10.1016/j.mib.2008.09.016. [DOI] [PMC free article] [PubMed] [Google Scholar]
- 9.Beisel CL, Storz G. The base-pairing RNA spot 42 participates in a multioutput feedforward loop to help enact catabolite repression in Escherichia coli. Mol. Cell. 2011;41:286–297. doi: 10.1016/j.molcel.2010.12.027. [DOI] [PMC free article] [PubMed] [Google Scholar]
- 10.O'Shaughnessy EC, Palani S, Collins JJ, Sarkar CA. Tunable signal processing in synthetic MAP kinase cascades. Cell. 2011;144:119–131. doi: 10.1016/j.cell.2010.12.014. [DOI] [PMC free article] [PubMed] [Google Scholar]
- 11.Yu J, Xiao J, Ren X, Lao K, Xie XS. Probing gene expression in live cells, one protein molecule at a time. Science. 2006;311:1600–1603. doi: 10.1126/science.1119623. [DOI] [PubMed] [Google Scholar]
- 12.Bernstein JA, Khodursky AB, Lin PH, Lin-Chao S, Cohen SN. Global analysis of mRNA decay and abundance in Escherichia coli at single-gene resolution using two-color fluorescent DNA microarrays. Proc. Natl Acad. Sci. USA. 2002;99:9697–9702. doi: 10.1073/pnas.112318199. [DOI] [PMC free article] [PubMed] [Google Scholar]
- 13.Alon U. An Introduction to Systems Biology: Design Principles of Biological Circuits. Boca Raton, Florida, USA: Chapman and Hall/CRC; 2007. [Google Scholar]
- 14.Bintu L, Buchler NE, Garcia HG, Gerland U, Hwa T, Kondev J, Kuhlman T, Phillips R. Transcriptional regulation by the numbers: applications. Curr. Opin. Genet. Dev. 2005;15:125–135. doi: 10.1016/j.gde.2005.02.006. [DOI] [PMC free article] [PubMed] [Google Scholar]
- 15.Kelley-Loughnane N, Biolsi SA, Gibson KM, Lu G, Hehir MJ, Phelan P, Kantrowitz ER. Purification, kinetic studies, and homology model of Escherichia coli fructose-1,6-bisphosphatase. Biochim. Biophys. Acta. 2002;1594:6–16. doi: 10.1016/s0167-4838(01)00261-8. [DOI] [PubMed] [Google Scholar]
- 16.Ahn SK, Tahlan K, Yu Z, Nodwell J. Investigation of transcription repression and small-molecule responsiveness by TetR-like transcription factors using a heterologous Escherichia coli-based assay. J. Bacteriol. 2007;189:6655–6664. doi: 10.1128/JB.00717-07. [DOI] [PMC free article] [PubMed] [Google Scholar]
- 17.Xu W, Pitts MA, Middleton SA, Kelleher KS, Kantrowitz ER. Propagation of allosteric changes through the catalytic-regulatory interface of Escherichia coli aspartate transcarbamylase. Biochemistry. 1988;27:5507–5515. doi: 10.1021/bi00415a018. [DOI] [PubMed] [Google Scholar]
- 18.Yagil G, Yagil E. On the relation between effector concentration and the rate of induced enzyme synthesis. Biophys. J. 1971;11:11–27. doi: 10.1016/S0006-3495(71)86192-1. [DOI] [PMC free article] [PubMed] [Google Scholar]
- 19.Madar D, Dekel E, Bren A, Alon U. Negative auto-regulation increases the input dynamic-range of the arabinose system of Escherichia coli. BMC Syst. Biol. 2011;5:111. doi: 10.1186/1752-0509-5-111. [DOI] [PMC free article] [PubMed] [Google Scholar]
- 20.Hussein R, Lim HN. Disruption of small RNA signaling caused by competition for Hfq. Proc. Natl Acad. Sci. USA. 2010;108:1110–1115. doi: 10.1073/pnas.1010082108. [DOI] [PMC free article] [PubMed] [Google Scholar]
- 21.Lutz R, Lozinski T, Ellinger T, Bujard H. Dissecting the functional program of Escherichia coli promoters: the combined mode of action of Lac repressor and AraC activator. Nucleic Acids Res. 2001;29:3873–3881. doi: 10.1093/nar/29.18.3873. [DOI] [PMC free article] [PubMed] [Google Scholar]
- 22.Andersen JB, Sternberg C, Poulsen LK, Bjorn SP, Givskov M, Molin S. New unstable variants of green fluorescent protein for studies of transient gene expression in bacteria. Appl. Environ. Microbiol. 1998;64:2240–2246. doi: 10.1128/aem.64.6.2240-2246.1998. [DOI] [PMC free article] [PubMed] [Google Scholar]
- 23.Pedraza JM, van Oudenaarden A. Noise propagation in gene networks. Science. 2005;307:1965–1969. doi: 10.1126/science.1109090. [DOI] [PubMed] [Google Scholar]
- 24.Gardner TS, Cantor CR, Collins JJ. Construction of a genetic toggle switch in Escherichia coli. Nature. 2000;403:339–342. doi: 10.1038/35002131. [DOI] [PubMed] [Google Scholar]
- 25.Datsenko KA, Wanner BL. One-step inactivation of chromosomal genes in Escherichia coli K-12 using PCR products. Proc. Natl Acad. Sci. USA. 2000;97:6640–6645. doi: 10.1073/pnas.120163297. [DOI] [PMC free article] [PubMed] [Google Scholar]
- 26.Adamson DN, Lim HN. Essential requirements for robust signaling in Hfq-dependent small RNA networks. PLoS Comput. Biol. 2011;7:e1002138. doi: 10.1371/journal.pcbi.1002138. [DOI] [PMC free article] [PubMed] [Google Scholar]
- 27.Lutz R, Bujard H. Independent and tight regulation of transcriptional units in Escherichia coli via the LacR/O, the TetR/O and AraC/I1-I2 regulatory elements. Nucleic Acids Res. 1997;25:1203–1210. doi: 10.1093/nar/25.6.1203. [DOI] [PMC free article] [PubMed] [Google Scholar]
- 28.Kuhlman T, Zhang Z, Saier MH, Jr, Hwa T. Combinatorial transcriptional control of the lactose operon of Escherichia coli. Proc. Natl Acad. Sci. USA. 2007;104:6043–6048. doi: 10.1073/pnas.0606717104. [DOI] [PMC free article] [PubMed] [Google Scholar]
- 29.Urban JH, Vogel J. Translational control and target recognition by Escherichia coli small RNAs in vivo. Nucleic Acids Res. 2007;35:1018–1037. doi: 10.1093/nar/gkl1040. [DOI] [PMC free article] [PubMed] [Google Scholar]
- 30.Schleif R. Regulation of the l-arabinose operon of Escherichia coli. Trends Genet. 2000;16:559–565. doi: 10.1016/s0168-9525(00)02153-3. [DOI] [PubMed] [Google Scholar]
- 31.McCullen CA, Benhammou JN, Majdalani N, Gottesman S. Mechanism of positive regulation by DsrA and RprA small noncoding RNAs: pairing increases translation and protects rpoS mRNA from degradation. J. Bacteriol. 2010;192:5559–5571. doi: 10.1128/JB.00464-10. [DOI] [PMC free article] [PubMed] [Google Scholar]
- 32.Repoila F, Majdalani N, Gottesman S. Small non-coding RNAs, co-ordinators of adaptation processes in Escherichia coli: the RpoS paradigm. Mol. Microbiol. 2003;48:855–861. doi: 10.1046/j.1365-2958.2003.03454.x. [DOI] [PubMed] [Google Scholar]
- 33.Xiong W, Ferrell JE., Jr A positive-feedback-based bistable ‘memory module’ that governs a cell fate decision. Nature. 2003;426:460–465. doi: 10.1038/nature02089. [DOI] [PubMed] [Google Scholar]
- 34.Siegele DA, Hu JC. Gene expression from plasmids containing the araBAD promoter at subsaturating inducer concentrations represents mixed populations. Proc. Natl Acad. Sci. USA. 1997;94:8168–8172. doi: 10.1073/pnas.94.15.8168. [DOI] [PMC free article] [PubMed] [Google Scholar]
- 35.Lee SK, Chou HH, Pfleger BF, Newman JD, Yoshikuni Y, Keasling JD. Directed evolution of AraC for improved compatibility of arabinose- and lactose-inducible promoters. Appl. Environ. Microbiol. 2007;73:5711–5715. doi: 10.1128/AEM.00791-07. [DOI] [PMC free article] [PubMed] [Google Scholar]
- 36.Vellanoweth RL, Rabinowitz JC. The influence of ribosome-binding-site elements on translational efficiency in Bacillus subtilis and Escherichia coli in vivo. Mol. Microbiol. 1992;6:1105–1114. doi: 10.1111/j.1365-2958.1992.tb01548.x. [DOI] [PubMed] [Google Scholar]
- 37.Moon K, Gottesman S. Competition among Hfq-binding small RNAs in. Escherichia coli. Mol. Microbiol. 2011;82:1545–1562. doi: 10.1111/j.1365-2958.2011.07907.x. [DOI] [PMC free article] [PubMed] [Google Scholar]
- 38.Altuvia S, Weinstein-Fischer D, Zhang A, Postow L, Storz G. A small, stable RNA induced by oxidative stress: role as a pleiotropic regulator and antimutator. Cell. 1997;90:43–53. doi: 10.1016/s0092-8674(00)80312-8. [DOI] [PubMed] [Google Scholar]
- 39.Taniguchi Y, Choi PJ, Li GW, Chen H, Babu M, Hearn J, Emili A, Xie XS. Quantifying E. coli proteome and transcriptome with single-molecule sensitivity in single cells. Science. 2010;329:533–538. doi: 10.1126/science.1188308. [DOI] [PMC free article] [PubMed] [Google Scholar]
- 40.Gilbert W, Muller-Hill B. Isolation of the lac repressor. Proc. Natl Acad. Sci. USA. 1966;56:1891–1898. doi: 10.1073/pnas.56.6.1891. [DOI] [PMC free article] [PubMed] [Google Scholar]
- 41.Igo MM, Ninfa AJ, Stock JB, Silhavy TJ. Phosphorylation and dephosphorylation of a bacterial transcriptional activator by a transmembrane receptor. Genes Dev. 1989;3:1725–1734. doi: 10.1101/gad.3.11.1725. [DOI] [PubMed] [Google Scholar]
- 42.Beisel CL, Storz G. Base pairing small RNAs and their roles in global regulatory networks. FEMS Microbiol. Rev. 2010;34:866–882. doi: 10.1111/j.1574-6976.2010.00241.x. [DOI] [PMC free article] [PubMed] [Google Scholar]
- 43.Gotta SL, Miller OL, Jr, French SL. rRNA transcription rate in Escherichia coli. J. Bacteriol. 1991;173:6647–6649. doi: 10.1128/jb.173.20.6647-6649.1991. [DOI] [PMC free article] [PubMed] [Google Scholar]
- 44.Kawamoto H, Koide Y, Morita T, Aiba H. Base-pairing requirement for RNA silencing by a bacterial small RNA and acceleration of duplex formation by Hfq. Mol. Microbiol. 2006;61:1013–1022. doi: 10.1111/j.1365-2958.2006.05288.x. [DOI] [PubMed] [Google Scholar]
- 45.Hasty J, Isaacs F, Dolnik M, McMillen D, Collins JJ. Designer gene networks: Towards fundamental cellular control. Chaos. 2001;11:207–220. doi: 10.1063/1.1345702. [DOI] [PubMed] [Google Scholar]
- 46.Oates AC, Gorfinkiel N, Gonzalez-Gaitan M, Heisenberg CP. Quantitative approaches in developmental biology. Nat. Rev. Genet. 2009;10:517–530. doi: 10.1038/nrg2548. [DOI] [PubMed] [Google Scholar]
- 47.Tomlin CJ, Axelrod JD. Biology by numbers: mathematical modelling in developmental biology. Nat. Rev. Genet. 2007;8:331–340. doi: 10.1038/nrg2098. [DOI] [PubMed] [Google Scholar]
- 48.Mogilner A, Wollman R, Marshall WF. Quantitative modeling in cell biology: what is it good for? Dev. Cell. 2006;11:279–287. doi: 10.1016/j.devcel.2006.08.004. [DOI] [PubMed] [Google Scholar]
- 49.Karlebach G, Shamir R. Modelling and analysis of gene regulatory networks. Nat. Rev. Mol. Cell. Biol. 2008;9:770–780. doi: 10.1038/nrm2503. [DOI] [PubMed] [Google Scholar]
- 50.Canton B, Labno A, Endy D. Refinement and standardization of synthetic biological parts and devices. Nat. Biotechnol. 2008;26:787–793. doi: 10.1038/nbt1413. [DOI] [PubMed] [Google Scholar]
- 51.Waters LS, Storz G. Regulatory RNAs in bacteria. Cell. 2009;136:615–628. doi: 10.1016/j.cell.2009.01.043. [DOI] [PMC free article] [PubMed] [Google Scholar]
- 52.Romby P, Wagner EG. Exploring the complex world of RNA regulation. Biol. Cell. 2008;100:e1–3. doi: 10.1042/BC20070146. [DOI] [PubMed] [Google Scholar]
- 53.Hopkins JF, Panja S, Woodson SA. Rapid binding and release of Hfq from ternary complexes during RNA annealing. Nucleic Acids Res. 2011;39:5193–5202. doi: 10.1093/nar/gkr062. [DOI] [PMC free article] [PubMed] [Google Scholar]
- 54.Repoila F, Gottesman S. Signal transduction cascade for regulation of RpoS: temperature regulation of DsrA. J. Bacteriol. 2001;183:4012–4023. doi: 10.1128/JB.183.13.4012-4023.2001. [DOI] [PMC free article] [PubMed] [Google Scholar]
- 55.Majdalani N, Chen S, Murrow J, St John K, Gottesman S. Regulation of RpoS by a novel small RNA: the characterization of RprA. Mol. Microbiol. 2001;39:1382–1394. doi: 10.1111/j.1365-2958.2001.02329.x. [DOI] [PubMed] [Google Scholar]
- 56.Pulvermacher SC, Stauffer LT, Stauffer GV. Role of the Escherichia coli Hfq protein in GcvB regulation of oppA and dppA mRNAs. Microbiology. 2009;155:115–123. doi: 10.1099/mic.0.023432-0. [DOI] [PubMed] [Google Scholar]
- 57.Moller T, Franch T, Hojrup P, Keene DR, Bachinger HP, Brennan RG, Valentin-Hansen P. Hfq: a bacterial Sm-like protein that mediates RNA-RNA interaction. Mol. Cell. 2002;9:23–30. doi: 10.1016/s1097-2765(01)00436-1. [DOI] [PubMed] [Google Scholar]
- 58.Masse E, Escorcia FE, Gottesman S. Coupled degradation of a small regulatory RNA and its mRNA targets in Escherichia coli. Genes Dev. 2003;17:2374–2383. doi: 10.1101/gad.1127103. [DOI] [PMC free article] [PubMed] [Google Scholar]
- 59.Lacroute F, Stent GS. Peptide chain growth of galactosidase in Escherichia coli. J. Mol. Biol. 1968;35:165–173. doi: 10.1016/s0022-2836(68)80044-0. [DOI] [PubMed] [Google Scholar]
- 60.Young R, Bremer H. Polypeptide-chain-elongation rate in Escherichia coli B/r as a function of growth rate. Biochem. J. 1976;160:185–194. doi: 10.1042/bj1600185. [DOI] [PMC free article] [PubMed] [Google Scholar]
Associated Data
This section collects any data citations, data availability statements, or supplementary materials included in this article.