

Abstract
The extremely slow α-helix/β-sheet transition of proteins is a crucial step in amylogenic diseases and represents an internal rearrangement of local contacts in an already folded protein. These internal structural rearrangements within an already folded protein are a critical aspect of biological action and are a product of conformational flow along unknown metastable local minima of the energy landscape of the compact protein. We use a diffusional IR mixer with time-resolved Fourier transform IR spectroscopy capable of 400-μs time resolution to show that the trifluoroethanol driven β-sheet to α-helix transition of β-lactoglobulin proceeds via a compact β-sheet intermediate with a lifetime of 7 ms, small compared with the overall folding time of β-lactoglobulin.
The rough energy landscape of a protein includes not only the steep free energy funnel that guides the unfolded protein into its compact native state (1, 2) but also traps of misfolded intermediates. In some cases, this rough surface can lead to distinct conformations of the same protein that consist of either an α-helix or β-sheet structure. An erroneous transition from α-helix to β-sheet structures has fatal consequences in prion and other amylogenic diseases. Because these distinct conformations are both highly compact, an important question is the size of the energy barriers and the interconversion times for α-helix to β-sheet structural changes. β-Lactoglobulin (BLG) is an important model system to study helix/sheet transitions, because it represents a protein that would be predicted by modeling to be α-helix rather than β-sheet. However, the structure of BLG-A in aqueous solution consists of nine antiparallel β-strands (51%) and one α-helix (7%) in its native state (Fig. 1) (3). However, this high β-sheet content sharply contrasts with secondary structure predictions for the amino acid sequence that indicate a distribution of 48% helix and 13% sheet (4). An indication of the metastability of the BLG-A structure is fact that BLG can refold to 80% helical content under the influence of the water-soluble fluorinated alcohol trifluoroethanol (TFE) (5, 6). The transition occurs cooperatively between 15 and 20% TFE. Thus, BLG represents an interesting model system to study internal structural pathways in proteins as opposed to folding pathways from the denatured state. BLG is known to be a “slow-folding” protein, characterized by multisecond folding and unfolding times (7, 8) into and from the basin of native states with fast submillisecond transitions within the folding core representing hierarchical folding pathways (9), but little is known about the more interesting structural intermediates that represent rearrangements of the local interactions between different folded conformations.
Figure 1.

Backbone representation of BLG-A (3). Regions with high helical preference are red (4).
UV/Vis, fluorescence and circular dichroism (CD) spectroscopies, as well as NMR spectroscopy have mostly probed the more dramatic changes in structure seen in protein folding studies. Each one of these techniques probes different structural changes. UV/Vis and fluorescence spectroscopies monitor the interactions of a prosthetic group or a fluorophore like tryptophan with its microenvironment. CD spectroscopy is mainly sensitive to helical secondary structure. NMR spectroscopy can provide residue-resolved information (10, 11), but spectra of denatured states are difficult to interpret and the time resolution in real-time measurements is low. Fourier-transform IR (FTIR) spectroscopy, on the other hand, is able to clearly distinguish between all types of secondary structure (12); it is sensitive to tertiary structure (13) and capable of detecting single residue reactions on a nanosecond time scale (14, 15). The most frequent approaches to initiate folding reactions in kinetic experiments have been rapid mixing techniques in either stopped-flow or continuous-flow operation mode (16, 17). FTIR spectroscopy, despite its sensitivity, has been used only rarely for kinetic mixing experiments. The main obstacle has been the necessity to mix solutions in samples a few microns thick (18), to keep the background absorption of water and guanidine low. These thin layers make it impossible to generate turbulent flow, the phenomenon utilized by macroscopic mixers to facilitate mixing (16). Here, we overcome this problem by silicon microfabrication of a diffusional IR mixer, which allows microsecond mixing in thin films.
Materials and Methods
Silicon micromachining has great potential to establish FTIR spectroscopy as a new method for microsecond mixing experiments, because silicon is transparent in the midinfrared. When the dimensions of liquid channels are reduced to a few microns, the flow has a Reynolds number much less than 1 and thus is laminar at velocities up to several meters per second (19). Therefore, there are no turbulent vortices to enhance mixing, and diffusion is the only way reactants can be mixed. The flow pattern has to be designed such that diffusion length scales are kept small enough for mixing diffusion to occur on the microsecond time scale (19–21). On the basis of the idea of Brody et al., we have designed a continuous-flow mixing chip for FTIR microscopy shown in Fig. 2. Continuous-flow mixing chips are microfabricated in silicon by using undoped silicon wafers (resistivity > 20 Ω cm−1) by using photolithography and reactive ion etching at the Cornell University Center for Nanofabrication Facility. The etched wafers are sealed with a CaF2 cover window by using a submicron-thick gasket material of silicone elastomer and mounted on a holder to feed in the fluids. An air pneumatic system drives the flow. The fluid flow speed is extrapolated from the streak length of fluorescent latex beads (Interfacial Dynamics, Portland, OR) in epifluorescence images. Spectra are recorded at 180-μm spot size with a Bruker (Billerica, MD) IRscope II coupled to a Bruker IFS66 FTIR spectrometer (17). A computer-controlled xy-stage moves the chip along the observation channel. Five hundred scans are averaged at every position.
Figure 2.

Design of the mixing chip. (a) Top view of the chip. The 80-μm-deep inlet channels are shown in green, and the 8-μm-deep outlet channel is shown in red. (b) Two-dimensional fluid dynamics simulation with false color representation of the TFE concentration. A jet of the center (protein) solution between two layers of buffer solution is formed. The TFE concentration is computed by adding the advective term to the diffusion equation.
Spectra of the initial and final states were measured “on chip” before the merger of the inlet channels and after stopping the flow, respectively. BLG (40 mg/ml; Sigma) in 10% TFE (volume)/20 mM DCl/D2O was flowed in the center channel and 60% TFE in 20 mM DCl/D2O in the side channels. The protein backbone amide protons do not exchange for deuterons under these conditions. The time-resolved spectra were analyzed by singular value decomposition and nonlinear least-square fitting by using matlab (Mathworks, Natick, MA). matlab was also used to compute the two-dimensional fluid dynamics simulation and the diffusion of TFE in the jet. We assumed a diffusion coefficient of 0.67 μm2 ms−1 for TFE (18).
Results and Discussion
The protein solution in the center and two streams of mixing buffer enter through 80-μm-deep inlet channels (Fig. 2a, green), which intersect with the 8-μm-deep observation channel (Fig. 2a, red). Because the three inlet channels are a factor of 10 deeper than the observation channel, at the merger there is almost equal pressure over the whole width of the observation channel. Because of the viscosity determined laminar flow, no turbulence is induced when the second and third channels merge in, but a layer of the center (protein) solution between two buffer layers over the whole width of the observation channel results. A fluid dynamics simulation was performed to verify the desired flow pattern. Fig. 2b shows a side view of the intersection of the channels. By approximating the observation channel as “infinitely wide”, we can make a two-dimensional model of the fluid flow. At a low Reynolds number, the stream function for this thin sheet flow, which is deep in the transverse direction, must obey the biharmonic equation (22). The resulting flow pattern (Fig. 2b) verifies the desired formation of a protein layer between two layers of buffer solution. The protein layer is so thin that reactant molecules diffuse from the buffer into the protein jet, and thus mixing is fast. Time resolution is achieved by scanning along the observation channel with the focused beam of an FTIR microscope (17). Because the protein moves only in about the center one-third of the observation channel, only marginal blurring of the time axis because of the parabolic flow profile occurs. The flow pattern is visualized by a fluorescein solution flowing in the center inlet channel and buffer in the two side channels (Fig. 3a). The fluorescence cross section of the observation channel (Fig. 3b) shows the formation of a homogeneous jet over a width of about 180 μm. In the top 20%, the formation of the jet is distorted, which can be explained by the velocity component in the direction of the inlet channels.
Figure 3.
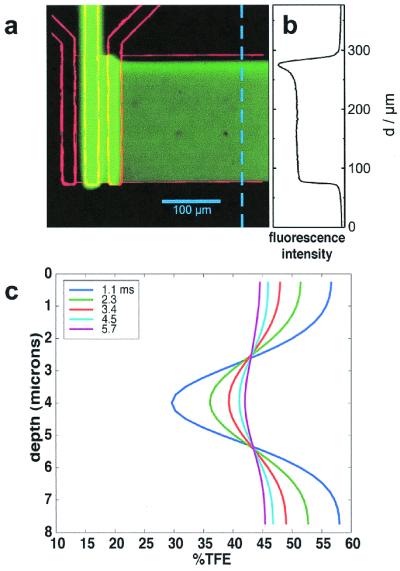
Epifluorescence image of the flow pattern with superimposed contour. Fluorescein solution is flowed in the center channel and nonstained buffer in the side inlet channels. The fluorescence cross section (b) shows a homogeneous jet over 180 μm wide. The peak in intensity in the upper part results from the small flow velocity component in the direction of the in let channels. (c) TFE concentration profiles through the observation channel as extracted from Fig. 2b.
A BLG protein solution containing 10% TFE (below the refolding transition) entered the center channel and mixed with 60% TFE in the side channels in the structural dynamics experiments. Mixing time was estimated by using a numerical solution of the flow and diffusion equations. The advective term is added to the diffusion equation and solved for the concentration of TFE everywhere in the jet. The TFE concentration is depicted in false color in Fig. 2b. When the three inlet streams have combined, the TFE profile gradually relaxes to a constant level as the jet travels down the observation channel. The evolution of the TFE concentration, as a function of channel depth, is pictured in Fig. 3c. At the first data point (taken at 100 μm/1.1 ms), the TFE concentration in the middle of the channel exceeds 30%, which is well above the cooperative transition threshold of 15–20%. The characteristic mixing time, extracted from the simulation, is 0.4 ms.
Fig. 4a shows the time-resolved FTIR spectra of BLG after mixing with TFE between 1,600 and 1,700 cm−1, where the amide I band (the protein backbone carbonyl groups) absorb. The amide I spectrum is sensitive to the secondary structure of the protein. In the time course of the reaction, the maximum of the amide I band shifts from 1,632 to 1,652 cm−1. To resolve the overlapping bands of secondary structure elements, the second derivative spectra are calculated (Fig. 4b). Absorbance maxima correspond to negative peaks in the second derivative spectra. The initial state spectrum (black) shows bands at 1,632 (strong) and 1,692 cm−1 (weak). These are characteristic of β-sheet structures (9), as expected. In the course of the transition, the signal at 1,632 cm−1 decreases in favor of the more intense peak at 1,652 cm−1, which is assigned to α-helices (9). Additionally, the weak band at 1,692 cm−1 first shifts to 1,686 cm−1 and finally disappears. The spectrum of the final state indicates an almost complete loss of β-sheet structure, consistent with circular dichroism and NMR results (4, 23, 24). There is no isosbestic point between the two bands at 1,632 and 1,652 cm−1 in Fig. 4b, revealing the population of at least one intermediate state along the conformational pathway.
Figure 4.
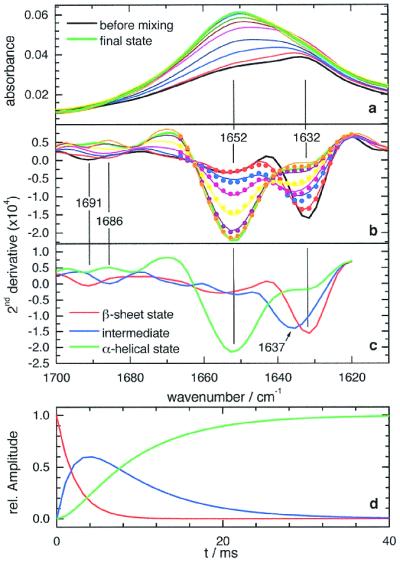
Time-resolved FTIR spectra and kinetic analysis. (a) Time-resolved absorbance spectra taken along the observation channel. Time-resolved spectra at 1.1, 3.4, 5.7, 10.2, 21.6, and 103 ms. Spectrum before mixing (black line) and final state spectrum (green line). (b) Second derivative spectra of a (solid lines) and results of a three-state exponential fit (dots, plotted only up to 1,670 cm−1). Line coloring is the same as in a. (c) The three basic spectra, resulting from the fit. (d) Time course of the three states as deduced by the fit.
The dataset was kinetically analyzed by two methods: singular-value decomposition (SVD) and least-squares curve fitting. SVD of the spectra between 1,620 and 1,700 cm−1 resulted in three linear independent basis spectra. Similarly, least-squares fits yielded at least three spectral states necessary to model the data adequately. The kinetic analysis provided no clear preference for either an exponential stretched exponential or exponential model, which includes back reactions for the time dependence of the states. The result of the three-state fit with two simple exponential functions is shown in Fig. 4 b–d. Fig. 4c depicts the three basis spectra: the β-sheet state spectrum (maximum at 1,632 cm−1), the helical state spectrum (maximum at 1,652 cm−1), and the intermediate state spectrum. The amide I peak of the intermediate is centered at 1,637 cm−1 (Fig. 4c), and the high-wavenumber β-sheet peak has shifted to 1,686 cm−1. These wavenumbers are within the typical range of antiparallel β-sheet structures (12). The intermediate clearly is not unfolded, which would correspond to an amide I band centered at 1,645 cm−1 (25). However, an upshift from 1,632 to 1,637 cm−1 points in the direction of a more loosely packed β-sheet structure.
Although we suspect that the intermediate structure is β-sheet-like, the extent to which local contacts of the native β-sheet exist in this intermediate state is not known. A similar amide I frequency is observed for the molten globule of pressure-denatured RNase A, another predominantly β-sheet protein (26). This suggests a possible molten β-sheet structure of the intermediate. In this model, the frequency upshift can be explained by penetration of TFE into the hydrophobic core of the protein and weakening of the backbone hydrogen bonding. The structure of the kinetic intermediate differs from the structure of the equilibrium intermediate detected by circular dichroism spectroscopy (23), which was proposed to have 53% helical and only 2% sheet content. However, in the equilibrium intermediate detected by heteronuclear NMR, about half of the β-sheet structure persists (24). The kinetic intermediate-state structure deduced from our FTIR measurements more closely resembles the NMR intermediate.
The intermediate state is formed with a time constant of (2.2 ± 0.1) ms and disappears with a time constant of (7.7 ± 0.1) ms. Thus, the β-to-α transition of BLG is more than three orders of magnitude faster than the BLG unfolding time in 4 M guanidine hydrochloride or the BLG refolding to the native state (27, 28). The disparity between the folding/unfolding times and the β-to-α structural change times is surprising, because the change in free energy from the native (β-sheet) state to the (helical) TFE state almost equals the free energy change from the guanidine denatured state (29). Hence, similar rates would be expected (30). However, the β-to-α transition proceeds via a compact state where local interactions are already present, in contrast to the folding pathway, where it is believed that a folding core must be first formed (9). The internal structural transition studied here might in fact proceed much faster than the folding transition simply on the basis of a restricted phase space search argument (31), so that although the enthalpy barriers are large, the entropic barriers are reduced relative to the folding transition.
We use TFE to drive this transition, and the question must be asked: How does TFE reshape the energy landscape to facilitate an interconversion between compact structures without unfolding the protein? The well known equilibrium effect of TFE is the weakening of the relative stability of hydrophobic in the core of the protein and the enhancement of α-helical structures (32). The basic mechanism of TFE stabilization of exposed hydrophobic residues comes from the formation of TFE hydrophobic clusters in water, providing a hydrophobic microenvironment (33). This facilitates a movement of hydrophobic groups from the hydrophobic inside to the outside of the protein. By providing a hydrophobic microenvironment and by favoring helical structures, the protein seems able to rearrange itself quickly within a rather compact state with low activation barriers. Taking together our results and data from equilibrium measurements, a picture of the energy surface arises (Fig. 5) showing explicitly the local roughness of the energy surface because of conformational substates (34) and the deep-lying metastable intermediate folded states that this work addresses.
Figure 5.

A schematic of the free energy surface of BLG-A as deduced by this work and extrapolated from other work on the local conformational distribution of barrier heights (35) and radii of gyration of protein structures of similar molecular weight (21).
The continuous-flow mixing chips presented in this work open up new dimensions for FTIR spectroscopy of protein reactions. The time resolution of 400 μs is about 1,000 times faster than recent IR stopped-flow devices (25). Additionally, the miniaturization reduces the sample consumption by an even higher magnitude. For a reactant with a higher diffusion coefficient than TFE, the time resolution can be further improved by using a smaller IR focus spot and a higher flow velocity. With the current design and the 10-μm spot of a synchrotron IR source (35), a time resolution on the order of 50 μs is feasible. Our results with this technology indicate that specific changes in the (micro)environment can make the transition between compact structures much more likely because the protein does not have to unfold. From this finding, it may be postulated that a hydrophobic microenvironment is generally a crucial factor in helix/sheet transitions. It is known that chaperones like GroEL expose hydrophobic side chains in their cavity to allow for rearrangement of misfolded structures (36). One may speculate further that a yet-unknown microenvironment might be the missing link to explain the formation of prion β-sheet structure.
Acknowledgments
E.K. was supported by a Ph.D. fellowship of the Boehringer Ingelheim Fonds. Microfabrication was performed at the Cornell Nanofabrication Facility, Ithaca, NY. This work was supported by European Union TMR network grant ERBFMRXCT 980230, by National Institutes of Health Grant HG 01606, and in part by the New Jersey Science and Technology Council.
Abbreviations
- FTIR
Fourier transform infrared
- BLG
β-lactoglobulin
- TFE
trifluoroethanol
References
- 1.Onuchic J N, Luthey-Schulten Z, Wolynes P G. Annu Rev Phys Chem. 1997;48:545–600. doi: 10.1146/annurev.physchem.48.1.545. [DOI] [PubMed] [Google Scholar]
- 2.Ladurner A G, Itzhaki L S, Daggett V, Fersht A R. Proc Natl Acad Sci USA. 1998;95:8473–8478. doi: 10.1073/pnas.95.15.8473. [DOI] [PMC free article] [PubMed] [Google Scholar]
- 3.Brownlow S, Cabral J H M, Cooper R, Flower D R, Yewdall S J, Polikarpov I, North A C T, Sawyer L. Structure (London) 1997;5:481–495. doi: 10.1016/s0969-2126(97)00205-0. [DOI] [PubMed] [Google Scholar]
- 4.Shiraki K, Nishikawa K, Goto Y. J Mol Biol. 1995;245:180–194. doi: 10.1006/jmbi.1994.0015. [DOI] [PubMed] [Google Scholar]
- 5.Hamada D, Kuroda Y, Tanaka T, Goto Y. J Mol Biol. 1995;254:737–746. doi: 10.1006/jmbi.1995.0651. [DOI] [PubMed] [Google Scholar]
- 6.Hamada D, Segawa S, Goto Y. Nat Struct Biol. 1996;3:868–873. doi: 10.1038/nsb1096-868. [DOI] [PubMed] [Google Scholar]
- 7.Arai M, Ikura T, Semisotnov G V, Kihara H, Amemiya Y, Kuwajima K. J Mol Biol. 1998;275:149–162. doi: 10.1006/jmbi.1997.1456. [DOI] [PubMed] [Google Scholar]
- 8.Kuwajima K, Yamaya H, Sugai S. J Mol Biol. 1996;264:806–822. doi: 10.1006/jmbi.1996.0678. [DOI] [PubMed] [Google Scholar]
- 9.Kuwata K, Shastry R, Cheng H, Hoshino M, Batt C A, Goto Y, Roder H. Nat Struct Biol. 2001;8:151–155. doi: 10.1038/84145. [DOI] [PubMed] [Google Scholar]
- 10.Bhuyan A K, Udgaonkar J B. Curr Sci. 1999;77:942–950. [Google Scholar]
- 11.Dyson H J, Wright P E. Annu Rev Phys Chem. 1996;47:369–395. doi: 10.1146/annurev.physchem.47.1.369. [DOI] [PubMed] [Google Scholar]
- 12.Arrondo J L, Muga A, Castresana J, Goni F M. Prog Biophys Mol Biol. 1993;59:23–56. doi: 10.1016/0079-6107(93)90006-6. [DOI] [PubMed] [Google Scholar]
- 13.Reinstadler D, Fabian H, Backmann J, Naumann D. Biochemistry. 1996;35:15822–15830. doi: 10.1021/bi961810j. [DOI] [PubMed] [Google Scholar]
- 14.Gerwert K, Souvignier G, Hess B. Proc Natl Acad Sci USA. 1990;87:9774–9778. doi: 10.1073/pnas.87.24.9774. [DOI] [PMC free article] [PubMed] [Google Scholar]
- 15.Gerwert K. Curr Opin Struct Biol. 1993;3:769–773. [Google Scholar]
- 16.Roder H, Shastry M C R. Curr Opin Struct Biol. 1999;9:620–626. doi: 10.1016/s0959-440x(99)00015-9. [DOI] [PubMed] [Google Scholar]
- 17.Rammelsberg R, Boulas S, Chorongiewski H, Gerwert K. Vibr Spectrosc. 1999;19:143–149. [Google Scholar]
- 18.Harris K R, Newitt P J, Derlacki Z J. J Chem Soc Faraday Trans. 1998;94:1963–1970. [Google Scholar]
- 19.Brody J P, Yager P, Goldstein R E, Austin R H. Biophys J. 1996;71:3430–3441. doi: 10.1016/S0006-3495(96)79538-3. [DOI] [PMC free article] [PubMed] [Google Scholar]
- 20.Knight J B, Vishwanath A, Brody J P, Austin R H. Phys Rev Lett. 1998;80:3863–3866. [Google Scholar]
- 21.Pollack L, Tate M W, Darnton N C, Knight J B, Gruner S M, Eaton W A, Austin R H. Proc Natl Acad Sci USA. 1999;96:10115–10117. doi: 10.1073/pnas.96.18.10115. [DOI] [PMC free article] [PubMed] [Google Scholar]
- 22.Darnton, N., Bakajin, O., Huang, R., Tegenfeld, J. O., Cox, E. C., Sturm, J. & Austin, R. H. (2001) J. Phys. Liquids, in press.
- 23.Mendieta J, Folque H, Tauler R. Biophys J. 1999;76:451–457. doi: 10.1016/S0006-3495(99)77212-7. [DOI] [PMC free article] [PubMed] [Google Scholar]
- 24.Kuwata K, Hoshino M, Era S, Batt C A, Goto Y. J Mol Biol. 1998;283:731–739. doi: 10.1006/jmbi.1998.2117. [DOI] [PubMed] [Google Scholar]
- 25.Troullier A, Reinstadler D, Dupont Y, Naumann D, Forge V. Nat Struct Biol. 2000;7:78–86. doi: 10.1038/71286. [DOI] [PubMed] [Google Scholar]
- 26.Takeda N, Kato M, Taniguchi Y. Biochemistry. 1995;34:5980–5987. doi: 10.1021/bi00017a027. [DOI] [PubMed] [Google Scholar]
- 27.Buck M. Quart Rev Biophys. 1998;31:297–355. doi: 10.1017/s003358359800345x. [DOI] [PubMed] [Google Scholar]
- 28.Plaxco K W, Simons K T, Ruczinski I, Baker D. Biochemistry. 2000;39:11177–11183. doi: 10.1021/bi000200n. [DOI] [PubMed] [Google Scholar]
- 29.Lu H, Buck M, Radford S E, Dobson C M. J Mol Biol. 1997;265:112–117. doi: 10.1006/jmbi.1996.0715. [DOI] [PubMed] [Google Scholar]
- 30.Hamada D, Chiti F, Guijarro J I, Kataoka M, Taddei N, Dobson C M. Nat Struct Biol. 2000;7:58–61. doi: 10.1038/71259. [DOI] [PubMed] [Google Scholar]
- 31.Hong D P, Hoshino M, Kuboi R, Goto Y. J Am Chem Soc. 1999;121:8427–8433. [Google Scholar]
- 32.Frauenfelder H, Wolynes P, Austin R. In: More Things in Heaven and Earth. Bederson B, editor. New York: Springer; 1999. pp. 706–725. [Google Scholar]
- 33.Miller L M, Carlson C S, Carr G L, Chance M R. Cell Mol Biol. 1998;44:117–127. [PubMed] [Google Scholar]
- 34.Horovitz A. Curr Opin Struct Biol. 1998;8:93–100. doi: 10.1016/s0959-440x(98)80015-8. [DOI] [PubMed] [Google Scholar]
- 35.Austin R H, Beeson K W, Eisenstein L, Frauenfelder H, Gunsalus I C. Biochemistry. 1975;13:5355–5373. doi: 10.1021/bi00695a021. [DOI] [PubMed] [Google Scholar]