

Abstract
Disruption of glandular architecture associates with poor clinical outcome in high grade colorectal cancer (CRC). PTEN regulates morphogenic growth of benign MDCK cells through effects on the Rho-like GTPase cdc42. This study investigates PTEN-dependent morphogenesis in a CRC model. Stable short hairpin RNA (shRNA) knockdown of PTEN in Caco-2 cells influenced expression or localization of cdc42 guanine nucleotide exchange factors (GEFs) and inhibited cdc42 activation. Parental Caco-2 cells formed regular hollow gland-like structures (glands) with a single central lumen, in three dimensional (3D) cultures. Conversely, PTEN-deficient Caco-2 ShPTEN cells formed irregular glands with multiple abnormal lumens as well as intra- and/or inter-cellular vacuoles evocative of the high grade CRC phenotype. Effects of targeted treatment were investigated. Phosphatidinylinositol 3-kinase (PI3K) modulating treatment did not affect gland morphogenesis but did influence gland number, gland size and/or cell size within glands. Since PTEN may be regulated by the nuclear receptor PPARγ, cultures were treated with the PPARγ ligand rosiglitazone. This treatment enhanced PTEN expression, cdc42 activation and rescued dysmorphogenesis by restoring single lumen formation in Caco-2 ShPTEN glands. Rosiglitazone effects on cdc42 activation and Caco-2 ShPTEN gland development were attenuated by cotreatment with GW 9662, a PPARγ antagonist. Taken together, these studies show PTEN-cdc42 regulation of lumen formation in a 3D model of human colorectal cancer glandular morphogenesis. Treatment by the PPARγ ligand rosiglitazone but not PI3K modulators rescued colorectal glandular dysmorphogenesis of PTEN deficiency.
Keywords: PTEN, cdc42, epithelium, morphogenesis
Introduction
The tumour suppressor PTEN (phosphatase and tensin homologue deleted on chromosome ten) regulates three-dimensional (3D) morphogenesis in a benign MDCK (Madin Darby Canine Kidney) model of polycystic kidney disease, through effects on the Rho GTPase cdc42 (1). Cdc42 partitions between cytosol and cell membrane fractions (2) and can be activated for distinct functions at separate subcellular loci, by specific guanine nucleotide exchange factors (GEFs) (3). In a SiRNA screen of 70 GEFs, the cdc42 GEFs Tuba and intersectin 2 (ITSN2) were shown to have a key role in 3D MDCK epithelial morphogenesis (4). Tuba promotes apical enrichment and activation of cdc42 (4) while ITSN2 colocalizes with cdc42 close to the apical membrane (5). Once activated, cdc42 binds a protein complex containing Par3, Par6 and atypical protein kinase C (aPKC) (6-8) to regulate polarized growth (9). The cdc42/Par/aPKC polarity complex promotes GSK3β phosphorylation at serine 9 (10) and triggers actomyosin flow (11). Suppression of cdc42 induces spindle misorientation in adherent cells (12), disorganized apical membrane positioning and formation of multiple irregular lumens or inter- or intra-cellular vacuoles in three-dimensional (3D) epithelial cultures (13,14). PTEN regulates 3D epithelial morphogenesis by recruitment and activation of cdc42 at the apical membrane (1) but associations between PTEN, “morphogenic” GEFs and cdc42 activation remain unclear.
PTEN mutation or deficiency distorts glandular architecture during early neoplastic progression (15) and associates with highly dysmorphic CRC phenotypes (16). However, effective treatment of cancer dysmorphogenesis is lacking. While PTEN-deficient human CRC (17) may represent a suitable target for phosphoinositide 3-kinase (PI3K) inhibitory therapy (18,19), PTEN also has crucial phosphatase-independent tumour suppressor functions (20-22). PTEN expression may be upregulated by peroxisome proliferator-activated receptor γ (PPARγ), through PPAR responsive elements (PPREs) within the PTEN promoter (23,24). The present study has used wild type (wt) Caco-2 CRC cells and a subclone rendered PTEN deficient by stable transfection with short hairpin RNA (ShRNA; Caco-2 ShPTEN cells), to investigate PTEN-dependent morphogenic signaling and test effects of targeted treatment. This system models the incomplete post-transcriptional suppression of PTEN by targeting miRNAs that characterizes human sporadic CRC (25).
Here we show that PTEN deficiency in neoplastic colorectal epithelium is associated with impairment of cdc42-dependent morphogenic signaling. Stable knockdown of PTEN inhibited expression and membrane localization of Tuba and promoted cytoplasmic retention of ITSN2. While PI3K activating treatment enhanced membrane recruitment of Vav2 in Caco-2 ShPTEN cells, ITSN2 and Tuba were unaffected. In 3D cultures, PTEN-deficient (Caco-2 ShPTEN) cells formed gland-like structures (glands) with irregular apical membrane positioning with respect to gland centres, multiple abnormal lumens and/or inter- or intra-cellular vacuoles. Transfection of cdc42 rescued Caco-2 ShPTEN gland morphogenesis. Pharmacological modulation of phosphatidinylinositol 3-kinase (PI3K) signaling had limited effects on cdc42 activity, influenced gland number and size as well as cell size within glands but did not affect the multilumen/vacuolar phenotype of PTEN-deficient glands. Conversely, treatment of cells with the PPARγ ligand rosiglitazone (26) enhanced PTEN expression, increased cdc42 activity and rescued Caco-2 ShPTEN gland morphogenesis.
Taken together, these data indicate that PTEN has a key role in spatiotemporal coordination of specific GEFs and cdc42, crucial for colorectal glandular morphogenesis. Since PPARγ-targeted treatment but not PI3K modulators rescue defective gland formation, PPARγ ligands may represent attractive candidates for further preclinical development as therapy for CRC glandular dysmorphogenesis.
Results
PTEN deficiency impairs cdc42-signaling
To investigate effects of PTEN deletion or deficiency on cdc42 activity we used isogenic PTEN expressing parental colorectal cells vs null or deficient subclones. PTEN−/−HCT116 cells were previously generated from parental PTEN+/+HCT116 cells using a high-efficiency promoterless PTEN targeting vector (27). We generated a PTEN-deficient Caco-2 subclone by stable transfection of Caco-2 cells with PTEN ShRNA (28), then selected, characterized and pooled PTEN deficient clones to generate the Caco-2 ShPTEN cell line (Fig S1). Full activation of Akt requires phosphorylation on threonine 308 (Thr308) and serine 473 (Ser473) residues (29) and we therefore assessed phosphorylation at both sites. Parental PTEN+/+HCT116 and Caco-2 cells had lower Akt Thr308 and Ser 473 phosphorylation (pAkt) than PTEN−/−HCT116 or Caco-2 ShPTEN cells (Fig 1a), consistent with PTEN suppression of PtdIns (3,4,5) P3 and PI3K-Akt signalling (30). Cdc42 activation was greater in the parental lines than in PTEN-null or -deficient subclones (Figs 1a-c).
Fig 1a. Cdc42 signaling in PTEN expressing and deficient HCT116 and Caco-2 clones.

PTEN+/+HCT116 and Caco-2 cells show higher active cdc42 levels, higherGSK3β phosphorylation but lower Akt phosphorylation than PTEN−/−HCT116 or Caco-2 ShPTEN cells. GAPDH loading control.
Fig 1b. Cdc42 activation in PTEN+/+HCT116 and PTEN−/−HCT116 cells.

Cdc42 activation was greater in PTEN+/+HCT116 vs PTEN−/−HCT116 cells = 0.78 ± 0.04 vs 0.19 ± 0.01 arbitrary densitometry units (adu;*p=0.003; ANOVA; n=3). Data for PTEN-deficient cells are denoted in the grey bar.
Fig 1c. Cdc42 activation in wt Caco-2 and Caco-2 ShPTEN cells.
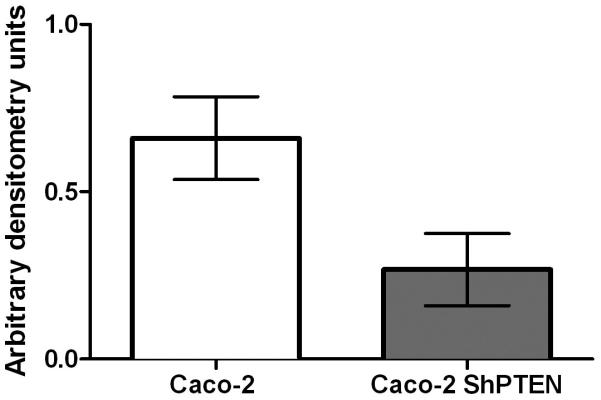
Cdc42 activation was greater in Caco-2 vs Caco-2 ShPTEN = 0.66 ± 0.06 vs 0.26 ± 0.05 (adu;*p=0.003; ANOVA; n=4). Data for PTEN-deficient cells are denoted in the grey bar.
Once activated, cdc42 forms a polarity complex with Par6 and aPKC that promotes GSK3β serine 9 phosphorylation (10). GSK3β phosphorylation (pGSK3β) was greater in the parental PTEN+/+HCT116 and Caco-2 lines than in PTEN-null or -deficient subclones, consistent with the greater cdc42 activity in those cells (Fig 1a). Cdc42 may be activated by wounding (31) and PTEN+/+HCT116 cells maintained consistently higher cdc42 activity and pGSK3β after monolayer wounding than PTEN−/−HCT116 cells (Fig 1d). To investigate the cell-specificity of PTEN regulation of cdc42, we conducted PTEN SiRNA knockdown studies in A-549 human lung and MDA -MB 235S human mammary epithelial cells. PTEN SiRNA transfection suppressed cdc42 activity vs non-targeting (NT) SiRNA in these cells (Fig S2). Hence, PTEN may enhance cdc42 activity in various epithelial cell types despite its capacity for suppression of PtdIns (3,4,5)P3.
Fig 1d. Temporal cdc42 activation after monolayer wounding.
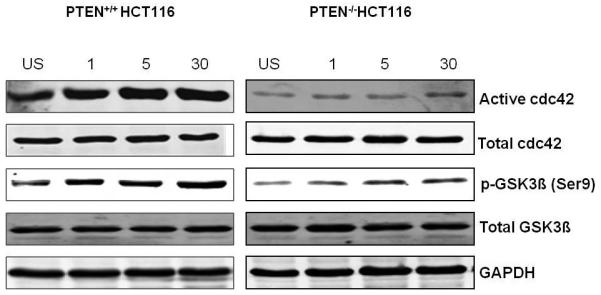
Time-dependent cdc42 activation in unscratched (US) PTEN+/+HCT116 and PTEN−/−HCT116 cells and at intervals (in minutes) after monolayer wounding (n=5). Levels of phospho-GSK3β (Ser 9) and GTP bound cdc42 increase in tandem.
Effects of PI3K modulating treatment on cdc42 signaling
To further investigate the role of PI3K-Akt signaling on cdc42 activity, we assessed effects of PI3K activators or inhibitors. Background pAkt was greater in PTEN-deficient PTEN−/−HCT116 cells or Caco-2 ShPTEN than parental cells and was modulated by EGF or wortmannin treatment. The pre-treatment cdc42 activation state was greater in PTEN-expressing cells. Taking this factor into account, quantitative effects of EGF on cdc42 activation appeared similar in presence or absence of PTEN (Figs 2a-2c). Treatment by different PI3K-Akt activators or inhibitors (IGF vs LY294002) produced broadly similar results (Fig 2d). These data indicate that cdc42 may be activated by PTEN and PI3K-Akt signaling. pGSK3β serine 9 was also enhanced or suppressed by EGF/IGF or wortmannin/LY294002 treatment respectively, in tandem with effects on cdc42 activation (Figs 2a-2d).
Fig 2a. Treatment effects on cdc42 signaling in parental and PTEN-deficient cells.

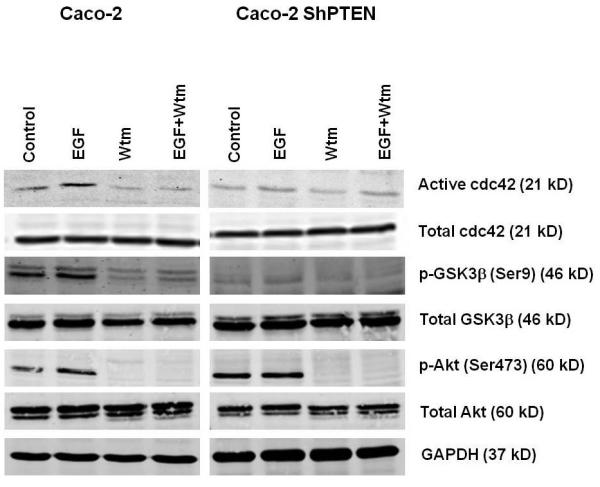
EGF treatment enhanced while wortmannin suppressed cdc42 activation in PTEN+/+HCT116 and PTEN−/−HCT116 cells (upper panel) and Caco-2 and Caco-2 ShPTEN cells (lower panel). Constitutive Akt phosphorylation was lower in parental cells. Corresponding changes in GSK3β serine 9 phosphorylation paralleled cdc42 activity; (n=3).
Fig 2b. Treatment effects on cdc42 signaling in PTEN+/+HCT116 and PTEN−/−HCT116 cells.

Densitometry assays of GTP-cdc42 after PI3K modulating treatment in HCT116 clones. EGF enhanced while wortmannin (wtm) treatment suppressed cdc42 activation in both cell types. Treatment effects were greater in PTEN+/+HCT116 cells (Control vs EGF vs wortmannin (wtm) vs EGF + wtm = 0.76 ± 0.04 vs 1.62 ± 0.12 vs 0.33 ± 0.02 vs 0.55 ± 0.03 in PTEN+/+HCT116 cells and 0.27 ± 0.01 vs 0.52 ± 0.02 vs 0.12 ± 0.01 vs 0.21 ± 0.01; p<0.001 for effects of treatment and cell type on cdc42 activation;Two way ANOVA; n=3). Data for PTEN-deficient cells are denoted in grey filled bars.
Fig 2c. Treatment effects on cdc42 signaling in Caco-2 and Caco-2 ShPTEN cells.

Densitometry assays of GTP-cdc42 after PI3K modulating treatment in Caco-2 clones. EGF enhanced while wortmannin (wtm) treatment suppressed cdc42 activation in both cell types. Treatment effects were greater in Caco-2 cells (Control vs EGF vs wtm vs EGF+wtm = 0.69 ± 0.08 vs 1.6 ± 0.23 vs 0.39 ± 0.04 vs 0.47 ± 0.05 in Caco-2 cells and 0.21 ± 0.05 vs 0.72 ± 0.14 vs 0.13 ± 0.02 vs 0.2 ± 0.05 in Caco-2 ShPTEN cells; p<0.001 for effects of treatment and cell type on cdc42 activation;Two way ANOVA; n=3). Data for PTEN-deficient cells are denoted in grey filled bars.
Fig 2d. IGF/LY294002 effects on cdc42 signaling in PTEN+/+HCT116 and PTEN−/− HCT116 cells.

Effects of IGF and LY294002 on cdc42 and GSK3β Ser 9 phosphorylation in PTEN+/+HCT116 and PTEN−/−HCT116 cells (n=3).
PTEN negative regulation of PtdIns (3,4,5)P3 (32) impedes plasma membrane recruitment of the cdc42 GEF Vav2 (33). To investigate the role of PTEN and PI3K signaling in membrane recruitment of “morphogenic” vs “non-morphogenic” GEFs represented by Tuba and ITSN2 vs Vav2 respectively (4), we conducted cell fractionation experiments. Membrane and cytosolic localization of GEFs were assessed in Caco-2 and Caco-2 ShPTEN cells treated by vehicle only (VO) or PI3K modulating agents. Membrane accumulation of “morphogenic” GEFs Tuba and ITSN2 was greater than that of the “non-morphogenic” GEF Vav2. Caco-2 cells showed greater expression of Tuba in both membrane and cytosolic fractions than Caco-2 ShPTEN cells, after VO treatment. Caco-2 ShPTEN cells showed greater cytoplasmic retention of ITSN2 than Caco-2 cells. For clarity, localization of Tuba and ITSN2 GEFs are presented in separate membrane and cytoplasmic panels representing both cell types, in Fig S2b. PI3K modulating treatment by EGF or wortmannin respectively promoted or inhibited pAkt. EGF stimulation increased membrane recruitment of the “non-morphogenic” GEF Vav2 in Caco-2 ShPTEN cells although ITSN2 and Tuba were unaffected (Fig 2e). Taken together these findings show quantitative and localization differences of cdc42 GEFs between Caco-2 and Caco-2 ShPTEN isogenic cells. Furthermore, our findings show EGF mediated membrane localization of Vav2 in Caco-2 ShPTEN cells, but not of ITSN2 or Tuba (Fig 2e).
Fig 2e. Expression/localization of cdc42 GEFs in Caco-2 and Caco-2 ShPTEN cells.

Effects of PTEN expression and PI3K modulating treatment on expression and subcellular localization of “morphogenic” and non-morphogenic” cdc42 GEFs (n=3). E-cadherin and GAPDH were used as membrane and cytosolic markers respectively.
PTEN regulates 3D colorectal epithelial morphogenesis through cdc42
To investigate the role of PTEN in epithelial morphogenesis, we raised 3D organotypic cultures of Caco-2 and Caco-2 ShPTEN cells, in “Matrigel”. Caco-2 and Caco-2 ShPTEN cells formed gland-like structures. Assessment by confocal microscopy was carried out through gland midsections in over 10 fields in each experiment. Apical membranes and basolateral margins/adherens junctions were identified by aPKC or E-cadherin immunolabelling respectively. Caco-2 and Caco-2 ShPTEN cultures formed 3D glands that showed apical and basolateral localization of aPKC and E-cadherin (Fig 3a, Fig S3a,S3b). Caco-2 glands predominantly comprised regular hollow spheres with a single central lumen surrounded by an epithelial monolayer of uniform cells. Conversely, substantive dysmorphogenesis was observed in Caco-2 ShPTEN glands. These contained multiple abnormal lumens, inter- and/or intra-cellular vacuoles, showed irregular orientation of the aPKC apical membrane marker in relation to gland centres and were formed from large-sized epithelial cells (Figs 3a, 3b). We investigated the role of cdc42 in 3D morphogenesis by transfection studies. As anticipated, transient transfection of Caco-2 or Caco-2 ShPTEN cells in monolayer culture with wild type (wt) or constitutively active (CA) cdc42 constructs upregulated cdc42 activity (Fig 3c). We then stably transfected Caco-2 ShPTEN cells with GFP-labeled cdc42 constructs, for 3D culture. Transfection of wt cdc42 restored formation of a single central lumen in >70% Caco-2 ShPTEN glands vs 43% and 37% for empty vector (EV) or DN cdc42 transfections respectively (Figs 3d, 3e). Orientation of aPKC or E-cadherin markers in relation to cell apices or basolateral regions was unaffected by cdc42 transfections (Fig 3d). Since effects of cdc42 knockdown upon 3D Caco-2 morphogenesis were shown in a previous study (13), those experiments were not repeated. Taken together, these findings show a mechanistic link between PTEN, cdc42 and 3D morphogenesis in a colorectal cancer model system.
Fig 3a. Glandogenesis in Caco-2 and Caco-2 ShPTEN clones.

Confocal midsections of glands imaged for DAPI (nucleus; blue), E-cadherin (basolateral membrane; green) and aPKC (apical membrane; red) after 12 days of culture. White arrows indicate irregular localization of the apical aPKC marker relative to gland centres, abnormal lumen outlines and/or intracellular vacuoles in Caco-2 ShPTEN glands. 63x magnification;oil immersion objective. Cell size was greater in Caco-2 ShPTEN glands (Cell surface area assessed in all cells around periphery of 3 randomly selected Caco-2 ShPTEN and Caco-2 glands; Mean cell surface area = 274 ± 7.9 vs 160 ± 20 μm2 Caco-2 ShPTEN vs Caco-2 glands; p=0.007;ANOVA;Scale bars = 10.0μM).
Fig 3b. Lumen formation in Caco-2 and Caco-2 ShPTEN glands.

Single lumens developed in 79.3 ± 2.7 % Caco-2 vs 52.3 ± 1.7% Caco-2 ShPTEN glands (p<0.001;ANOVA; n=3). Assays conducted in triplicate with 127 ± 24 Caco-2 and 147 ± 33 glands per experiment. Data for PTEN-deficient cells are denoted in the grey bar.
Fig 3c. Effects of cdc42 transfections on cdc42 activation.

Effects of EV, wt, CA or DN cdc42 transfections on cdc42 activation. GFP-labelled transfected cdc42 activity is shown. While WT and CA cdc42 transfections enhanced GFP tagged cdc42 activity, differences in endogenous cdc42 were not statistically significant (Quantitative densitometric analysis - Caco-2 EV vs WT, vs CA vs DN = 0.51 ± 0.13 vs 0.49 ±0.045 vs 0.433 ± vs 0.41 ± 0.16; Caco-2 ShPTEN EV vs WT, vs CA vs DN cdc42 = 0.13 ± 0.02 vs 0.08 ± 0.045 vs 0.11 ± 0.03 vs 0.12 ± 0.05. p=NS).
Fig 3d. Effects of cdc42 transfections on Caco-2 ShPTEN glandogenesis.

Confocal midsections of glands raised from Caco-2 ShPTEN cells transfected with EV, wt cdc42 or DN cdc42 imaged for DAPI (nucleus; blue), E-cadherin (basolateral membrane; cyan), GFP (reporter for stable cdc42 transfection; green), aPKC (apical membrane;red) after 12 days of culture. White arrows indicate multiple lumens or intercellular vacuoles in EV or DN cdc42 transfected Caco-2 ShPTEN glands. 63x magnification; oil immersion objective. Scale bar = 10μM
Fig 3e. Lumen formation in Caco-2 ShPTEN glands after cdc42 transfections.

Transfection of wt cdc42 rescued single lumen formation in Caco-2 ShPTEN glands (EV vs wt cdc 42 vs DN cdc42= 44.3 ± 5.6 vs 74.7 ± 6.9 vs 37 ± 2.6%;p=0.002; ANOVA; n=3).
Effects of PI3K modulating treatment on 3D epithelial morphogenesis
The structural morphology of colorectal cancer has major prognostic significance (34) and its molecular regulatory framework could represent a novel target for therapy. Hence, we assessed effects of PI3K activating or inhibitory treatment on 3D morphogenesis. Caco-2 and Caco-2 ShPTEN cells were incubated with EGF or wortmannin. Treatment was applied either from the first day of 3D culture or after 10 days of culture. Neither regimen influenced Caco-2 or Caco-2 ShPTEN gland lumen formation or orientation of the apical aPKC marker with respect to gland centres (Figs 4a,4b). However, these PI3K activating or suppressive treatments enhanced or suppressed epithelial cell size within Caco-2 and Caco-2 ShPTEN glands (Fig S4a). We then tested a PI3K inhibitor with longer half life (PI-103) vs EGF or medium only control. Treatment was administered from the first day of culture and renewed every 48 hours. PI-103 treatment reduced the total number of Caco-2 and Caco-2 ShPTEN glands formed (to 29% or 39% of control values), reduced gland size (Fig S4b) but did not influence aberrant morphogenesis of Caco-2 ShPTEN glands (Fig 4c). Single lumen formation was observed in 40% vs 40% vs 37% in Caco-2 ShPTEN glands treated by PI-103 vs EGF vs medium only control (Fig 4d).
Fig 4a. Treatment effects on glandogenesis in Caco-2 clones.
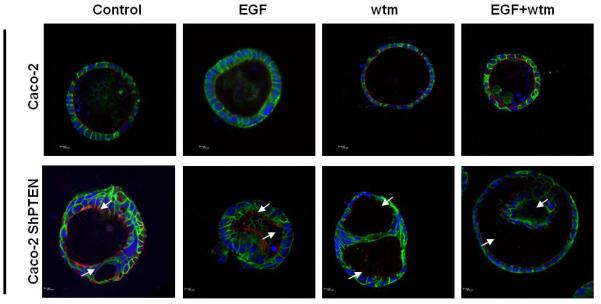
Overlay images of Caco-2 (upper panel) or Caco-2 ShPTEN (lower panel) 3D cultures after EGF, wortmannin (Wtm) or combined EGF+ Wtm treatment vs control. White arrows indicate irregular or intercellular distribution of the apical aPKC marker and abnormal lumen outlines. 63× 1.40 oil immersion objective at 1x magnification. Scale bar=10μM.
Fig 4b. Effects of treatment on formation of single lumen glands in Caco-2 clones.

Treatment by EGF or wortmannin (wtm) did not influence single lumen formation in Caco-2 or Caco-2 ShPTEN glands (Caco-2 control [medium only] vs EGF vs wtm vs EGF + wtm = 82 ± 8.1% vs 76 ± 6.4 % vs 85 ± 2.6% vs 87 ± 3.2%; Caco-2 ShPTEN control vs EGF vs wtm vs EGF + wtm = 43 ± 6.8% vs 54 ± 4.4% vs 47.3 ± 4.3% vs 56.0 ± 8.9%; p=NS; n=3). Data for PTEN-deficient cells are denoted in grey filled bars.
Fig 4c. Effects of PI-103 treatment on gland morphogenesis.

Caco-2 or Caco-2 ShPTEN 3D cultures after treatment with PI-103. Morphogenesis of Caco-2 ShPTEN glands was unaffected by PI-103 treatment. Regular single lumen outlines in Caco-2 glands contrast with multiple abnormal lumens or vacuoles in Caco-2 ShPTEN glands. White arrows indicate irregular or intercellular distribution of the apical aPKC marker and abnormal lumen outlines. 12 days of culture. 63× 1.40 oil immersion objective at 1x magnification.Scale bar=20μM.
Fig 4d. Lumen formation in Caco-2 and Caco-2 ShPTEN glands after PI-103 treatment.

Caco-2 and Caco-2 ShPTEN gland morphogenesis. Single lumen formation was significantly greater in Caco-2 vs Caco-2 ShPTEN cultures p=0.008, but was unaffected by treatment (Two way ANOVA; Caco-2 medium only vs EGF vs PI-103 = 69.4 ± 2.9 vs 53.9 ± 1.0 vs 49.0 ± 1.8; Caco-2 ShPTEN medium only vs EGF vs PI-103 37.6 ± 5.6 vs 39.9 ± 2.0 vs 40.5 ± 1.0).
Effects of rosiglitazone treatment on PTEN expression, cdc42 activation and 3D epithelial morphogenesis
PTEN contains two peroxisome proliferator-activated receptor γ (PPARγ) responsive elements within its promoter region (23). In the present study, treatment with the PPARγ ligand rosiglitazone (10 μM) enhanced expression of PTEN protein in a time-dependent manner in both Caco-2 and Caco-2 ShPTEN cells. Effects were greater in the former (Fig 5a). The study dose was optimised in dose-response studies (Fig S5a). Rosiglitazone treatment also enhanced cdc42 activation in both Caco-2 and Caco-2 ShPTEN cells although these effects were inhibited by cotreatment with GW9662, a specific PPARγ antagonist (26) (Fig 5b). Rosiglitazone treatment had a dramatic effect on lumen formation in Caco-2 ShPTEN glands, restoring a single central lumen in 60% Caco-2 ShPTEN glands vs 33% for vehicle only treated controls (Fig 5c). Rosiglitazone rescue of lumen formation in Caco-2 ShPTEN glands was blocked by cotreatment with GW9662 (Fig 5d). In addition to effects on morphogenesis, rosiglitazone treatment also suppressed the size of developing Caco-2 ShPTEN glands by 12 days of culture vs control (Fig S5b).
Fig 5a. Effects of Rosiglitazone treatment on PTEN expression in Caco-2 clones.

Treatment of cells with Rosiglitazone (10 μM) enhanced PTEN expression in a time –dependent manner. Treatment effects were greater in PTEN expressing Caco-2 cells but also upregulated PTEN in Caco-2 ShPTEN cells.
Fig 5b. Effects of Rosiglitazone treatment on cdc42 activation in Caco-2 clones.

Treatment of cells with Rosiglitazone (10 μM) promoted cdc42 activation in both Caco-2 and Caco-2 ShPTEN cells. These effects were inhibited by cotreatment with GW 9662 (10 μM).
Fig 5c. Effects of Rosiglitazone treatment on formation of single lumen glands in Caco-2 clones.

Overlay images of Caco-2 or Caco-2 ShPTEN 3D cultures after vehicle only control, Rosiglitazone 10μM or Rosiglitazone (10μM) and GW 9662 (10μM) in combination. White arrows indicate irregular or intercellular distribution of the apical aPKC marker and abnormal lumen outlines. 12 days of culture. 63× 1.40 oil immersion objective at 1x magnification. Scale bar = 20μM.
Fig 5d. Effects of Rosiglitazone treatment on formation of single lumen glands in Caco-2 clones.

Neither Rosiglitazone nor GW9662 treatment affected lumen formation in caco-2 glands. In Caco-2 ShPTEN glands, treatment by Rosiglitazone (Rosi) enhanced single lumen formation although these effects were ameliorated by GW treatment (control vs Rosi vs Rosi +GW = 35 ± 3.7 vs 61 ± 3.7 vs 39.0 ± 1.8). Effects of cell type and drug treatment on single lumen formation were significant (p<0.001; Two way ANOVA).
Discussion
In the present study, PTEN expressing PTEN+/+HCT116 and Caco-2 parental cells had low Akt phosphorylation at both Thr308 and Ser473 sites but greater cdc42 activity and greater GSK3β Ser9 phosphorylation than PTEN-null or -deficient subclones, in resting and scratch-activated conditions. PTEN expression invoked higher cdc42 activity than PTEN knockdown in various cell types. Previous studies have shown seemingly paradoxical effects of PTEN on cdc42 signaling. PTEN dephosphorylates PtdIns (3,4,5) P3 (32) that promotes plasma membrane recruitment of the cdc42-activating GEF Vav2 (33) and inhibits GTP-bound cdc42 in murine fibroblasts (35). Conversely, PTEN promotes membrane recruitment and activation of cdc42 during 3D MDCK epithelial morphogenesis and PTEN SiRNA knockdown suppresses cdc42 activity in MDCK epithelial monolayers (1). Sophisticated technologies have helped resolve this paradox and brought a new conceptual framework for GTPAse function. As opposed to traditional concepts of a single polarization event governed by total intracellular GTPAse activity, it is now recognised that spatially-restricted GTPAse activity is regulated by specific GEFs for different functions, during cellular and multicellular morphogenesis (3).
GSK3β Ser9 phosphorylation can be enhanced by the cdc42/Par/aPKC polarity complex (10) as well as Akt (36). Our findings suggest dominance of the former mechanism in our model system. Although we cannot exclude some cell-specificity in these effects, our findings accord with previous studies that identified a cooperative PTEN/GSK3β feedback loop (37). GSK3β phosphorylates and destabilizes PTEN (37). Conversely, pharmacological inhibition of GSK3β function by phosphorylation at serine 9 (38) may enhance PTEN expression (39, 40). Hence, high GSK3β Ser9 phosphorylation may permit high PTEN expression. Furthermore, the well-characterized GSK3β inhibitor lithium chloride (LiCl) (41), enhances PTEN expression (40) and may promote GSK3β Ser9 phosphorylation by pAkt-independent mechanisms (42,43). Taken together, these studies are consistent with PTEN-associated, pAkt-independent mechanisms of GSK3β Ser9 phosphorylation, in accord with our findings.
To explore PTEN-targeted therapy, we assessed effects of PI3K activation by growth factors (EGF or IGF) (44) or inhibition by wortmannin or LY294002 treatment (29). EGF/IGF vs wortmannin/LY294002 treatment respectively enhanced or suppressed cdc42 activation and pGSK3β levels. Quantitative differences between parental PTEN+/+HCT116 and Caco-2 cells vs PTEN deficient subclones suggest cdc42 activation by both PI3K signaling and PTEN expression. Growth factors and other upstream signals recruit cdc42 GEFs to convert the GDP-bound form to active GTP-cdc42 (45). Specific GEFs can coordinate spatio-temporal cdc42 activity during a morphogenic response (3) by targeting the GTPAse within macromolecular complexes, to key cellular subdomains (46). Rho-family GEFs have pleckstrin- (PH) (46) and Dbl-homology (DH) domains (47) that mediate signal-dependent membrane recruitment and GTPAse activation. For example, binding of the Vav2 PH domain to membrane PtdIns(3,4,5)P3 promotes PH-DH domain interactions (48) that catalyze guanine nucleotide exchange and GTPAse activation (49). ITSN2 and Tuba are dependent upon their DH domain function for cdc42 activation (50,4) but they differ from other Dbl family Rho-GTPAse, in terms of their PH-DH domain interactions. The ITSN2 PH domain does not directly contact cdc42-substrate complexes, nor influence intrinsic DH domain catalytic activity and its activation of cdc42 is PtdIns(3,4,5)P3-and PI3K-independent (51). Tuba does not possess a PH domain (52) but instead contains an evolutionarily conserved Bin/amphiphysin/Rvs (BAR) domain (52) that binds phosphatidylserine within the plasma membrane lipid bilayer (53, 54).
To investigate co-dependencies between PTEN, PI3K signaling and subcellular localization of “morphogenic” and “non-morphogenic” GEFs, we conducted cell treatment and fractionation studies. We found quantitative, localization and phosphatidylinositide-affinity differences between specific cdc42 GEFs that could provide a rationale for our finding of dual activation of cdc42 by both PTEN and PI3K signaling. Greater membrane and cytosolic accumulation of Tuba and Vav2 associated with PTEN expression could thus enhance total cdc42 activity in Caco-2 vs Caco-2 ShPTEN cells. Conversely, greater cytosolic retention of ITSN2 in Caco-2 ShPTEN cells could impede ITSN2 colocalization with and activation of cdc42 at the plasma membrane. PI3K activating treatment enhanced membrane recruitment of Vav2 in Caco-2 ShPTEN cells but had no discernible effects on ITSN2 or Tuba. Hence, the present study is consistent with PTEN dual regulation of cdc42 by phosphatase-dependent and -independent effects on expression and membrane localization of specific cdc42 GEFs
Elucidation of regulatory mechanisms of glandular dysmorphogenesis in high grade CRC has been hampered by the scarcity of suitable model systems. Caco-2 cells retain the capacity for 3D cell-cell interactions implicated in glandular architecture and provide a suitable colorectal cancer morphogenesis model (55). In the present study, we found that Caco-2 cells formed regular gland-like structures with a single central lumen, surrounded by a uniform monolayer of polarized epithelial cells in 3D organotypic culture. Cell-cell adhesion was maintained through adherens junctions identified by E-cadherin expression. Furthermore, the aPKC apical membrane marker (56) formed a homogeneous continuous interface with the gland lumen, in agreement with previous reports (13, 55). We found that PTEN knockdown provoked a dramatic change in the organization of these gland-like structures. Caco-2 ShPTEN glands formed multiple lumens, intra- and/or inter-cellular vacuoles whose surfaces were positive for aPKC. Our findings resembled those induced by SiRNA cdc42 knockdown in Caco-2 glands (13) although in our study, Caco-2 ShPTEN glands were formed from large sized epithelial cells consistent with PTEN cell size regulation (57,58).
Cdc42 has a central role in coordination of Caco-2 epithelial morphogenesis (13). SiRNA knockdown of cdc42 disrupts mitotic spindle orientation, leading to inappropriate positioning of apical membranes and secretion-driven development of multiple abnormal lumens or vacuoles (13). Conversely, transfection of constitutively active (CA) cdc42 reverses the multilumen phenotype of cdc42-deficiency (4). In the present study, we show that Caco-2 ShPTEN cells have low cdc42 activity that can be rescued by wt or CA cdc42 transfection. Furthermore, transfection of Caco-2 ShPTEN cells with wt cdc42 but not EV or DN cdc42 also rescued 3D gland morphogenesis, restoring a single central lumen. Since PTEN recruitment of cdc42 to the apical membrane is central to 3D morphogenesis (1), our data suggests that PTEN could have a role in juxtapositioning of cdc42 with Tuba and ITSN2, to promote cdc42 activation, spindle orientation and aPKC activation (4). In accord with a previous report (13), we found that modulation of cdc42 activity did not affect aPKC and E-cadherin localization in apical and basolateral cellular domains.
To assess effects of PI3K-Akt targeted treatment on 3D morphogenesis, we treated Caco-2 and Caco-2 ShPTEN cultures initially with EGF or wortmannin. Because of concerns about cell survival effects of PI3-Akt modulating treatment (59), we applied treatment both at day 1 and after 10 days of culture. This treatment affected epithelial cell size within glands but did not affect the single or multilumen phenotypes of Caco-2 and Caco-2 ShPTEN glands. Wortmannin has a relatively short half-life in cell cultures (60) that could influence the effectiveness of PI3K/Akt blockade. To address this concern, we repeated morphogenesis experiments using PI-103, a longer acting potent inhibitor of class I phosphatidylinositide 3-kinase (61). Addition of PI-103 every 48 hours effectively suppresses PI3K signalling in cell cultures (61). In the present study we found that PI-103 treated glands were significantly smaller and fewer than control, in line with suppression of the growth-promoting effects of the PI3K/Akt pathway (32). However, we found that PI-103 did not rescue the abnormal multilumen phenotype of Caco-2 ShPTEN glands.
In our Caco-2 ShPTEN model, PTEN suppression was incomplete and thus potentially amenable to drug treatment. In this study, the PPARγ ligand rosiglitazone enhanced PTEN expression and cdc42 activation in Caco-2 and Caco-2 ShPTEN cells, although effects were greater in the former. Rosiglitazone treatment also rescued Caco-2 ShPTEN glandular morphogenesis, restoring a single central lumen in 60% glands. While the PTEN level induced in Caco-2 ShPTEN cells by rosiglitazone remained lower than in vehicle only treated Caco-2 cells, subtle variations in PTEN level can have important biological consequences in PTEN deficiency states (62). For example, low level PTEN can rescue defective fetal tissue morphogenesis and embryonic lethality as effectively as normal expression levels (63). To explore the PPARγ-dependence of rosiglitazone effects in our model system, cells were cotreated with the PPARγ antagonist GW9662 (26). This step effectively blocked rosiglitazone-mediated activation of cdc42 and rescue of Caco-2 ShPTEN glandular morphogenesis. Taken together, our findings are compatible with rosiglitazone promotion of PTEN expression and enhanced PTEN-cdc42 mediated 3D morphogenesis. While we cannot exclude PTEN-independent effects, rosiglitazone merits further investigation as a targeted therapy for glandular dysmorphogenesis in cancer states.
Materials and methods
Reagents and antibodies
All laboratory chemicals including EGF, IGF, wortmannin and LY294002 were purchased from Sigma-Aldrich, Dorset, England unless otherwise stated. PI-103 was a generous gift from Dr James Murray, CCRCB, Belfast. Rosiglitazone and GW9662 were purchased from Cambridge Bioscience, Cambridge UK. Genejuice transfection reagent was purchased from Novagen, Gibbstown, NJ, USA. The antibodies used in this study were rabbit anti-PTEN, -p-Akt (Thr 308),-Total Akt, -p-GSK3β (Ser9). - GSK3β (Cell Signaling Technology, New England Biolabs Hitchin, Herts, UK), -aPKCζ, (Abcam); and mouse anti-p-Akt (Ser473), -HA and -GFP (Cell Signaling Technology), -cdc42, -E-cadherin (BD), -GAPDH (Abcam, Cambridge, MA, USA), -Vav2 (Abcam), -ITSN2 (Abcam), -Tuba (a generous gift from Dr Pietro De Camilli, Yale). These primary antibodies were used where appropriate in conjunction with Li-Cor IRDye 680 (anti-rabbit) and IRDye800 (anti-mouse) secondary antibodies, for use with the Li-Cor Infra-Red imaging systems (Li-Cor Biosciences, Lincoln, Nebraska, USA) in Western blots or with Alexa Fluor 568 (anti-rabbit) and Alexa Fluor 488 (anti-mouse) (Molecular probes, Invitrogen, Carslbas, CA, USA) and/or anti-mouse CY5 (Jackson Immunoresearch, Newmarket, Suffolk, UK) for fluorescence microscopy. Sepharose 4B beads were purchased from GE Healthcare, Bucks, UK. Plasmids, pcDNA3EGFP-cdc42-WT (No. 12599), pcDNA3EGFP-cdc42 Q61L (CA; No. 12600), pcDNA3EGFP-cdc42 T17N (DN;No.12601) pMKO.1 puro PTEN shRNA (No. 10669) and pMKO.1 puro empty vector (No. 8452) were obtained from Addgene Inc, Cambridge, MA, USA. Dharmacon SmartPool PTEN siRNA oligonucleotides and non targeting control siRNAs were purchased from Fisher Scientific, Dublin, Ireland.
Cell culture
PTEN+/+HCT116 and PTEN−/−HCT116 colorectal epithelial cells were a generous gift from Dr Tod Waldman, Georgetown (27) and were cultured in McCoys 5A media supplemented with 10% FCS, 1mM L-glutamine and 1mM sodium pyruvate and Caco-2 (American Type Culture Collection, Manassas, VA) and Caco-2 ShPTEN cells were cultured in MEM supplemented 10%FCS, 1mM Non Essential Amino Acids and 1mM L-Glutamine at 37°C in 5% CO2.
For glands, Caco-2, Caco-2 ShPTEN cells and subclones stably transfected with EV-EGFP, wt cdc42 or DN cdc42 were cultured embedded in a “Matrigel” (BD Biosciences, Oxford, UK) matrix, similar to that previously described (13) with modifications. In brief, 6 × 10⁴ trypsinized cells were mixed with Hepes (20 mM), and “Matrigel” (40%) in a final volume of 100 μl, which was plated into each well of an 8 well chamber slide, allowed to solidify for 30 min at 37°C and subsequently overlayed with 400 μl of media/well. Glands were cultured for intervals up to 14 days as previously described (13) but without cholera toxin because of possible concerns about effects on GTPase activity (64). In treatment studies, PI3K activators EGF (20 ng/ul), IGF (20 ng/ul) or inhibitors wortmannin (2 nM), LY294002 (5 μmol/L) or PI-103 (1.0 μM) were used. Rosiglitazone or GW9662 were used at concentrations of 10μM each. Since the generation of glands by the above method was relatively inefficient, signalling assays were conducted in Caco-2 and Caco-2 ShPTEN cell monolayers.
Cell transfection
Mammalian plasmid transfections were carried out using Genejuice transfection reagent. Cells were plated at 2×10⁵ cells/35 mm or at 1×10⁶/90mm dish 24 h before transfection, then transfected with 500ng DNA/2×105 cells for all constructs. Transfections were carried out according to the manufacturer’s protocols. Cells were incubated with DNA-Genejuice complexes for 48 h, before lysis and probing as described in Protein extraction and Western blotting or antibiotic selection for stable transfections. Stable transfection of Caco-2 cells with the previously validated PTEN ShRNA [pMKO.1 ShPTEN or pMKO.1 EV control; (28) was carried out as previously described (28), with replication defective retroviruses generated using the Phoenix™ retroviral expression system (Orbigen, San Diego, CA USA). Briefly, Caco-2 cells were transfected with viral supernatant on 3 occasions, then incubated in 1μg/ml puromycin for selection of ShPTEN positive subclones. Colonies surviving puromycin selection were subcultured to 60-70% confluence, lysed and probed for PTEN against GAPDH loading control. Clones deficient in PTEN expression were further characterized in terms of AKT signaling and cdc42 activation. Five PTEN deficient clones were pooled to generate the Caco-2 ShPTEN cell line (Fig S1). Caco-2 ShPTEN cells stably transfected with pEGFP EV, -wt cdc42 and DN-cdc42 constructs were selected in 500 μg/ml G418.
GST PAK cdc42-GTP pulldown
Cells were grown on 90mm dishes then lysed in buffer comprising 50 mM Tris-HCl (pH 7.5), 1% Triton X-100, 100 mM NaCl, 10 mM MgCl2, 5% glycerol, 1 mM Na3VO4 and protease inhibitor cocktail (Roche) and centrifuged at 12,500g for 10 min. p21 activated kinase (PAK) binds specifically to active cdc42 and Rac. The GTP bound form of cdc42 was assayed by adding GST-PAK fusion protein coupled with gluthathione sepharose 4B beads to 1mg of cell lysate. Beads were collected after 1 hr by centrifugation, washed x3 and resuspended in Laemmli buffer with 1 mM DTT. Cdc42 activity was then assayed by Western blotting, as outlined below. Experiments were repeated in triplicate.
Cell fractionation
Cells were removed from culture dishes in detergent free lysis buffer (50mmol/L HEPES, pH7.4) containing 50mmol/L NaCl, 1mmol/L MgCl2, 2mmol/L EDTA and 1mmol/L Na3VO4 and protease inhibitors and sonicated (3 times 10 seconds each round). The cell lysate was then centrifuged at 13000g for 15 minutes and the supernatant retained as the cytosolic fraction. The pellets were resuspended in the same buffer, with 1% Triton X-100 and 0.1% SDS added and incubated for 1 hour at 4°C. Membrane fractions were then obtained by centrifugation at 13,000g for 15 minutes and the insoluble pellets discarded.
Protein extraction and Western blotting
Proteins were resolved using gel electrophoresis, followed by blotting onto nitrocellulose membranes. Membranes were probed using antibodies as indicated in the text.
Immunofluorescence microscopy
Embedded glands were fixed in 2% paraformaldehyde for 20 minutes and processed for immunofluorescence as previously described for MCF10A glands (65), with the following modifications. Glands were incubated without the F(ab)2 fragment for secondary antibody blocking and during immunolabelling with secondary antibodies. DNA was stained and chamber slides mounted using Vectashield mounting medium containing DAPI (Vector Scientific, Belfast, NI). Sequential scan images were taken the midsection of glands at room temperature using a Leica SP5 confocal microscope on a HCX PL APO lambda blue 63× 1.40 oil immersion objective at 1x or 2x zoom as indicated in the figure legends. Images were collected and scale bars added using LAS AF confocal software (Leica). In stably transfected Caco-2 glands, four colour confocal microscopy was used when the fluorescent emission spectrum used for E-cadherin (secondary antibody label of Alexa Fluor 488) overlapped with EGFP/tag fluorescence. The secondary label for E-cadherin was changed to Cy5 antibody conjugate under these circumstances.
Image processing and statistical analysis
Fluorescence microscopy images were processed using Leica Fw4000 Imaging software and cropped using Adobe photoshop (CS2). Confocal images were processed, merged and mean area quantified using LAS AF Leica Imaging Software. Data analysis was carried out by one or two way ANOVA using PASW statistics 18 and graphs drawn using Graphpad Prism 5.0. Descriptive statistics were expressed as the mean ± sem.
Online supplement
The online supplement shows characterization of Caco-2 ShPTEN cell line (Fig S1), effects of PTEN siRNA transfection on Cdc42 activity in MDA-MB 235S and A-549 cells (Fig S2a), expression and subcellular localization of “morphogenic” GEFs Tuba and ITSN2 after vehicle only (VO), EGF or wortmannin (Wtm) treatment (Fig S2b) Videos (Figs S3a and S3b) show temporal confocal Z stacks of single Caco-2 or Caco-2 ShPTEN glands. Supplement S4 show effects of cell type and PI3K modulating treatment (EGF/Wortmannin) on cell size within glands (Fig S4a) while Fig S4b shows effects of PI-103 treatment on size of Caco-2 and Caco-2 ShPTEN glands. Fig S5a shows the rosiglitazone dose-response assay against PTEN expression in Caco-2 and Caco-2 ShPTEN cells. Fig S5b shows effects of rosiglitazone treatment of Caco-2 and Caco-2 ShPTEN gland size. Supplementary methods for SiRNA knockdown of PTEN are also included.
Supplementary Material
Acknowledgements
The authors gratefully acknowledge the support of the Wellcome Trust (WT081232MA) and the Department for Education and Learning, Northern Ireland for financial support. We are greatly indebted to Dr T Waldman, Georgetown University, USA for supply of PTEN+/+ HCT116 and PTEN−/− HCT116 cells, to Dr Pietro DiCamilli, Howard Hughes Medical Institute, Yale, for his generous provision of anti-human Tuba antibody, to Dr Estelle McLean for technical help, to Dr James Murray for the gift of PI-103 and to Mr S Church for assistance with all imaging.
Abbreviations list
- aPKC
Atypical protein kinase C
- CA
constitutively active
- cdc42
Cell division cycle 42
- Co-IP
coimmunoprecipitation
- Cy
Cyanine
- DN
dominant negative
- EGF
epidermal growth factor
- EV
empty vector
- GEFs
Guanine nucleotide exchange factors
- GSK3 β
Glycogen synthase kinase 3 beta
- IGF
insulin-like growth factor
- L-Glut
L-Glutamine
- MMC
Mouse monoclonal
- mg
milligram
- NEAA
Non Essential Amino Acids
- PAK
p21 activated kinase
- Par3, Par6
Partitioning defective polarity protein
- PDK1
phosphoinositide dependent kinase 1
- PI3K
Phosphatidylinositol 3-kinase
- PtdIns
Phosphatidylinositol
- PTEN
Phosphatase and tensin homologue deleted on chromosome ten
- Ser
serine
- ShRNA
Short hairpin RNA
- SiRNA
Small interfering RNA
- Thr
threonine
- Wt
wild type
Footnotes
Conflict of interest - The authors declare no conflict of interest in relation to the work described.
References
- 1.Martin-Belmonte F, Gassama A, Datta A, Yu W, Rescher U, Gerke V, et al. PTEN-mediated apical segregation of phosphoinositides controls epithelial morphogenesis through Cdc42. Cell. 2007;128(2):383–97. doi: 10.1016/j.cell.2006.11.051. [DOI] [PMC free article] [PubMed] [Google Scholar]
- 2.Michaelson D, Silletti J, Murphy G, D’Eustachio P, Rush M, Philips MR. Differential localization of Rho GTPases in live cells: regulation by hypervariable regions and RhoGDI binding. J Cell Biol. 2001 Jan 8;152(1):111–26. doi: 10.1083/jcb.152.1.111. [DOI] [PMC free article] [PubMed] [Google Scholar]
- 3.Pertz O. Spatio-temporal Rho GTPase signaling - where are we now? J Cell Sci. 2010 Jun 1;123(Pt 11):1841–50. doi: 10.1242/jcs.064345. [DOI] [PubMed] [Google Scholar]
- 4.Qin Y, Meisen WH, Hao Y, Macara IG. Tuba, a Cdc42 GEF, is required for polarized spindle orientation during epithelial cyst formation. J Cell Biol. 2010 May 17;189(4):661–9. doi: 10.1083/jcb.201002097. [DOI] [PMC free article] [PubMed] [Google Scholar]
- 5.Rodriguez-Fraticelli AE, Vergarajauregui S, Eastburn DJ, Datta A, Alonso MA, Mostov K, et al. The Cdc42 GEF Intersectin 2 controls mitotic spindle orientation to form the lumen during epithelial morphogenesis. The Journal of cell biology. 2010;189(4):725–38. doi: 10.1083/jcb.201002047. [DOI] [PMC free article] [PubMed] [Google Scholar]
- 6.Noda Y, Takeya R, Ohno S, Naito S, Ito T, Sumimoto H. Human homologues of the Caenorhabditis elegans cell polarity protein PAR6 as an adaptor that links the small GTPases Rac and Cdc42 to atypical protein kinase C. Genes Cells. 2001 Feb;6(2):107–19. doi: 10.1046/j.1365-2443.2001.00404.x. [DOI] [PubMed] [Google Scholar]
- 7.Joberty G, Petersen C, Gao L, Macara IG. The cell-polarity protein Par6 links Par3 and atypical protein kinase C to Cdc42. Nat Cell Biol. 2000 Aug;2(8):531–9. doi: 10.1038/35019573. [DOI] [PubMed] [Google Scholar]
- 8.Etienne-Manneville S, Hall A. Cell polarity: Par6, aPKC and cytoskeletal crosstalk. Curr Opin Cell Biol. 2003 Feb;15(1):67–72. doi: 10.1016/s0955-0674(02)00005-4. [DOI] [PubMed] [Google Scholar]
- 9.Etienne-Manneville S. Cdc42--the centre of polarity. J Cell Sci. 2004;117(Pt 8):1291–300. doi: 10.1242/jcs.01115. [DOI] [PubMed] [Google Scholar]
- 10.Etienne-Manneville S, Hall A. Cdc42 regulates GSK-3beta and adenomatous polyposis coli to control cell polarity. Nature. 2003;421(6924):753–6. doi: 10.1038/nature01423. [DOI] [PubMed] [Google Scholar]
- 11.Tan I, Yong J, Dong JM, Lim L, Leung T. A tripartite complex containing MRCK modulates lamellar actomyosin retrograde flow. Cell. 2008;135(1):123–36. doi: 10.1016/j.cell.2008.09.018. [DOI] [PubMed] [Google Scholar]
- 12.Mitsushima M, Toyoshima F, Nishida E. Dual role of Cdc42 in spindle orientation control of adherent cells. Mol Cell Biol. 2009 May;29(10):2816–27. doi: 10.1128/MCB.01713-08. [DOI] [PMC free article] [PubMed] [Google Scholar]
- 13.Jaffe AB, Kaji N, Durgan J, Hall A. Cdc42 controls spindle orientation to position the apical surface during epithelial morphogenesis. The Journal of cell biology. 2008;183(4):625–33. doi: 10.1083/jcb.200807121. [DOI] [PMC free article] [PubMed] [Google Scholar]
- 14.Durgan J, Kaji N, Jin D, Hall A. Par6B and atypical PKC (aPKC) regulate mitotic spindle orientation during epithelial morphogenesis. J Biol Chem. 2011 Feb 7; doi: 10.1074/jbc.M110.174235. [DOI] [PMC free article] [PubMed] [Google Scholar]
- 15.Shao J, Washington MK, Saxena R, Sheng H. Heterozygous disruption of the PTEN promotes intestinal neoplasia in APCmin/+ mouse: roles of osteopontin. Carcinogenesis. 2007 Dec;28(12):2476–83. doi: 10.1093/carcin/bgm186. [DOI] [PubMed] [Google Scholar]
- 16.Sawai H, Yasuda A, Ochi N, Ma J, Matsuo Y, Wakasugi T, et al. Loss of PTEN expression is associated with colorectal cancer liver metastasis and poor patient survival. BMC Gastroenterol. 2008;8:56. doi: 10.1186/1471-230X-8-56. [DOI] [PMC free article] [PubMed] [Google Scholar]
- 17.Nassif NT, Lobo GP, Wu X, Henderson CJ, Morrison CD, Eng C, et al. PTEN mutations are common in sporadic microsatellite stable colorectal cancer. Oncogene. 2004;23(2):617–28. doi: 10.1038/sj.onc.1207059. [DOI] [PubMed] [Google Scholar]
- 18.Wong KK, Engelman JA, Cantley LC. Targeting the PI3K signaling pathway in cancer. Curr Opin Genet Dev. 2010 Feb;20(1):87–90. doi: 10.1016/j.gde.2009.11.002. [DOI] [PMC free article] [PubMed] [Google Scholar]
- 19.Grant S. Cotargeting survival signaling pathways in cancer. J Clin Invest. 2008 Sep;118(9):3003–6. doi: 10.1172/JCI36898. [DOI] [PMC free article] [PubMed] [Google Scholar]
- 20.Song MS, Carracedo A, Salmena L, Song SJ, Egia A, Malumbres M, et al. Nuclear PTEN Regulates the APC-CDH1 Tumor-Suppressive Complex in a Phosphatase-Independent Manner. Cell. 2011 Jan 21;144(2):187–99. doi: 10.1016/j.cell.2010.12.020. [DOI] [PMC free article] [PubMed] [Google Scholar]
- 21.Wang H, Karikomi M, Naidu S, Rajmohan R, Caserta E, Chen HZ, et al. Allele-specific tumor spectrum in pten knockin mice. Proc Natl Acad Sci U S A. 2010 Mar 16;107(11):5142–7. doi: 10.1073/pnas.0912524107. [DOI] [PMC free article] [PubMed] [Google Scholar]
- 22.Gunaratne J, Goh MX, Swa HL, Lee FY, Sanford E, Wong LM, et al. Protein interactions of phosphatase and tensin homologue (PTEN) and its cancer-associated G20E mutant compared by using stable isotope labeling by amino acids in cell culture-based parallel affinity purification. J Biol Chem. 2011 May 20;286(20):18093–103. doi: 10.1074/jbc.M111.221184. [DOI] [PMC free article] [PubMed] [Google Scholar]
- 23.Patel L, Pass I, Coxon P, Downes CP, Smith SA, Macphee CH. Tumor suppressor and anti-inflammatory actions of PPARgamma agonists are mediated via upregulation of PTEN. Curr Biol. 2001 May 15;11(10):764–8. doi: 10.1016/s0960-9822(01)00225-1. [DOI] [PubMed] [Google Scholar]
- 24.Teresi RE, Planchon SM, Waite KA, Eng C. Regulation of the PTEN promoter by statins and SREBP. Hum Mol Genet. 2008 Apr 1;17(7):919–28. doi: 10.1093/hmg/ddm364. [DOI] [PubMed] [Google Scholar]
- 25.Poliseno L, Salmena L, Zhang J, Carver B, Haveman WJ, Pandolfi PP. A coding-independent function of gene and pseudogene mRNAs regulates tumour biology. Nature. 2010 Jun 24;465(7301):1033–8. doi: 10.1038/nature09144. [DOI] [PMC free article] [PubMed] [Google Scholar]
- 26.Seargent JM, Yates EA, Gill JH. GW9662, a potent antagonist of PPARgamma, inhibits growth of breast tumour cells and promotes the anticancer effects of the PPARgamma agonist rosiglitazone, independently of PPARgamma activation. Br J Pharmacol. 2004 Dec;143(8):933–7. doi: 10.1038/sj.bjp.0705973. [DOI] [PMC free article] [PubMed] [Google Scholar]
- 27.Lee C, Kim JS, Waldman T. PTEN gene targeting reveals a radiation-induced size checkpoint in human cancer cells. Cancer Res. 2004 Oct 1;64(19):6906–14. doi: 10.1158/0008-5472.CAN-04-1767. [DOI] [PMC free article] [PubMed] [Google Scholar]
- 28.Boehm JS, Hession MT, Bulmer SE, Hahn WC. Transformation of human and murine fibroblasts without viral oncoproteins. Molecular and cellular biology. 2005;25(15):6464–74. doi: 10.1128/MCB.25.15.6464-6474.2005. [DOI] [PMC free article] [PubMed] [Google Scholar]
- 29.Alessi DR, Andjelkovic M, Caudwell B, Cron P, Morrice N, Cohen P, et al. Mechanism of activation of protein kinase B by insulin and IGF-1. Embo J. 1996;15(23):6541–51. [PMC free article] [PubMed] [Google Scholar]
- 30.Stokoe D, Stephens LR, Copeland T, Gaffney PR, Reese CB, Painter GF, et al. Dual role of phosphatidylinositol-3,4,5-trisphosphate in the activation of protein kinase B. Science (New York, NY) 1997;277(5325):567–70. doi: 10.1126/science.277.5325.567. [DOI] [PubMed] [Google Scholar]
- 31.Etienne-Manneville S, Hall A. Integrin-mediated activation of Cdc42 controls cell polarity in migrating astrocytes through PKCzeta. Cell. 2001;106(4):489–98. doi: 10.1016/s0092-8674(01)00471-8. [DOI] [PubMed] [Google Scholar]
- 32.Sun H, Lesche R, Li DM, Liliental J, Zhang H, Gao J, et al. PTEN modulates cell cycle progression and cell survival by regulating phosphatidylinositol 3,4,5,-trisphosphate and Akt/protein kinase B signaling pathway. Proceedings of the National Academy of Sciences of the United States of America. 1999;96(11):6199–204. doi: 10.1073/pnas.96.11.6199. [DOI] [PMC free article] [PubMed] [Google Scholar]
- 33.Aoki K, Nakamura T, Fujikawa K, Matsuda M. Local phosphatidylinositol 3,4,5-trisphosphate accumulation recruits Vav2 and Vav3 to activate Rac1/Cdc42 and initiate neurite outgrowth in nerve growth factor-stimulated PC12 cells. Mol Biol Cell. 2005;16(5):2207–17. doi: 10.1091/mbc.E04-10-0904. [DOI] [PMC free article] [PubMed] [Google Scholar]
- 34.Cho YB, Chun HK, Yun HR, Kim HC, Yun SH, Lee WY. Histological grade predicts survival time associated with recurrence after resection for colorectal cancer. Hepato-gastroenterology. 2009;56(94-95):1335–40. [PubMed] [Google Scholar]
- 35.Liliental J, Moon SY, Lesche R, Mamillapalli R, Li D, Zheng Y, et al. Genetic deletion of the Pten tumor suppressor gene promotes cell motility by activation of Rac1 and Cdc42 GTPases. Curr Biol. 2000 Apr 6;10(7):401–4. doi: 10.1016/s0960-9822(00)00417-6. [DOI] [PubMed] [Google Scholar]
- 36.Cross DA, Alessi DR, Cohen P, Andjelkovich M, Hemmings BA. Inhibition of glycogen synthase kinase-3 by insulin mediated by protein kinase B. Nature. 1995;378(6559):785–9. doi: 10.1038/378785a0. [DOI] [PubMed] [Google Scholar]
- 37.Al-Khouri AM, Ma Y, Togo SH, Williams S, Mustelin T. Cooperative phosphorylation of the tumor suppressor phosphatase and tensin homologue (PTEN) by casein kinases and glycogen synthase kinase 3beta. The Journal of biological chemistry. 2005;280(42):35195–202. doi: 10.1074/jbc.M503045200. [DOI] [PubMed] [Google Scholar]
- 38.ter Haar E, Coll JT, Austen DA, Hsiao HM, Swenson L, Jain J. Structure of GSK3beta reveals a primed phosphorylation mechanism. Nat Struct Biol. 2001 Jul;8(7):593–6. doi: 10.1038/89624. [DOI] [PubMed] [Google Scholar]
- 39.Maccario H, Perera NM, Davidson L, Downes CP, Leslie NR. PTEN is destabilized by phosphorylation on Thr366. The Biochemical journal. 2007;405(3):439–44. doi: 10.1042/BJ20061837. [DOI] [PMC free article] [PubMed] [Google Scholar]
- 40.Deevi R, Fatehullah A, Jagan I, Nagaraju M, Bingham V, Campbell FC. PTEN regulates colorectal epithelial apoptosis through Cdc42 signalling. Br J Cancer. 2011 Oct 25;105(9):1313–21. doi: 10.1038/bjc.2011.384. [DOI] [PMC free article] [PubMed] [Google Scholar]
- 41.Orena SJ, Torchia AJ, Garofalo RS. Inhibition of glycogen-synthase kinase 3 stimulates glycogen synthase and glucose transport by distinct mechanisms in 3T3-L1 adipocytes. J Biol Chem. 2000 May 26;275(21):15765–72. doi: 10.1074/jbc.M910002199. [DOI] [PubMed] [Google Scholar]
- 42.Summers SA, Kao AW, Kohn AD, Backus GS, Roth RA, Pessin JE, et al. The role of glycogen synthase kinase 3beta in insulin-stimulated glucose metabolism. J Biol Chem. 1999 Jun 18;274(25):17934–40. doi: 10.1074/jbc.274.25.17934. [DOI] [PubMed] [Google Scholar]
- 43.De Sarno P, Li X, Jope RS. Regulation of Akt and glycogen synthase kinase-3 beta phosphorylation by sodium valproate and lithium. Neuropharmacology. 2002 Dec;43(7):1158–64. doi: 10.1016/s0028-3908(02)00215-0. [DOI] [PubMed] [Google Scholar]
- 44.Kong M, Mounier C, Wu J, Posner BI. Epidermal growth factor-induced phosphatidylinositol 3-kinase activation and DNA synthesis. Identification of Grb2-associated binder 2 as the major mediator in rat hepatocytes. The Journal of biological chemistry. 2000;275(46):36035–42. doi: 10.1074/jbc.M005621200. [DOI] [PubMed] [Google Scholar]
- 45.Sinha S, Yang W. Cellular signaling for activation of Rho GTPase Cdc42. Cell Signal. 2008;20(11):1927–34. doi: 10.1016/j.cellsig.2008.05.002. [DOI] [PubMed] [Google Scholar]
- 46.Fuentes EJ, Karnoub AE, Booden MA, Der CJ, Campbell SL. Critical role of the pleckstrin homology domain in Dbs signaling and growth regulation. J Biol Chem. 2003 Jun 6;278(23):21188–96. doi: 10.1074/jbc.M211792200. [DOI] [PubMed] [Google Scholar]
- 47.Schmidt A, Hall A. Guanine nucleotide exchange factors for Rho GTPases: turning on the switch. Genes Dev. 2002 Jul 1;16(13):1587–609. doi: 10.1101/gad.1003302. [DOI] [PubMed] [Google Scholar]
- 48.Han J, Luby-Phelps K, Das B, Shu X, Xia Y, Mosteller RD, et al. Role of substrates and products of PI 3-kinase in regulating activation of Rac-related guanosine triphosphatases by Vav. Science. 1998 Jan 23;279(5350):558–60. doi: 10.1126/science.279.5350.558. [DOI] [PubMed] [Google Scholar]
- 49.Whitehead IP, Campbell S, Rossman KL, Der CJ. Dbl family proteins. Biochim Biophys Acta. 1997 Feb 22;1332(1):F1–23. doi: 10.1016/s0304-419x(96)00040-6. [DOI] [PubMed] [Google Scholar]
- 50.Hussain NK, Jenna S, Glogauer M, Quinn CC, Wasiak S, Guipponi M, et al. Endocytic protein intersectin-l regulates actin assembly via Cdc42 and N-WASP. Nat Cell Biol. 2001;3(10):927–32. doi: 10.1038/ncb1001-927. [DOI] [PubMed] [Google Scholar]
- 51.Pruitt WM, Karnoub AE, Rakauskas AC, Guipponi M, Antonarakis SE, Kurakin A, et al. Role of the pleckstrin homology domain in intersectin-L Dbl homology domain activation of Cdc42 and signaling. Biochim Biophys Acta. 2003 Apr 7;1640(1):61–8. doi: 10.1016/s0167-4889(03)00002-8. [DOI] [PubMed] [Google Scholar]
- 52.Salazar MA, Kwiatkowski AV, Pellegrini L, Cestra G, Butler MH, Rossman KL, et al. Tuba, a novel protein containing bin/amphiphysin/Rvs and Dbl homology domains, links dynamin to regulation of the actin cytoskeleton. J Biol Chem. 2003 Dec 5;278(49):49031–43. doi: 10.1074/jbc.M308104200. [DOI] [PubMed] [Google Scholar]
- 53.Itoh T, De Camilli P. BAR, F-BAR (EFC) and ENTH/ANTH domains in the regulation of membrane-cytosol interfaces and membrane curvature. Biochim Biophys Acta. 2006 Aug;1761(8):897–912. doi: 10.1016/j.bbalip.2006.06.015. [DOI] [PubMed] [Google Scholar]
- 54.Lemmon MA. Membrane recognition by phospholipid-binding domains. Nat Rev Mol Cell Biol. 2008 Feb;9(2):99–111. doi: 10.1038/nrm2328. [DOI] [PubMed] [Google Scholar]
- 55.Guruswamy S, Swamy MV, Choi CI, Steele VE, Rao CV. S-adenosyl L-methionine inhibits azoxymethane-induced colonic aberrant crypt foci in F344 rats and suppresses human colon cancer Caco-2 cell growth in 3D culture. Journal international du cancerInternational journal of cancer. 2008;122(1):25–30. doi: 10.1002/ijc.23031. [DOI] [PubMed] [Google Scholar]
- 56.Johnson K, Wodarz A. A genetic hierarchy controlling cell polarity. Nat Cell Biol. 2003 Jan;5(1):12–4. doi: 10.1038/ncb0103-12. [DOI] [PubMed] [Google Scholar]
- 57.Goberdhan DC, Paricio N, Goodman EC, Mlodzik M, Wilson C. Drosophila tumor suppressor PTEN controls cell size and number by antagonizing the Chico/PI3-kinase signaling pathway. Genes Dev. 1999;13(24):3244–58. doi: 10.1101/gad.13.24.3244. [DOI] [PMC free article] [PubMed] [Google Scholar]
- 58.Backman S, Stambolic V, Mak T. PTEN function in mammalian cell size regulation. Current opinion in neurobiology. 2002;12(5):516–22. doi: 10.1016/s0959-4388(02)00354-9. [DOI] [PubMed] [Google Scholar]
- 59.Donev IS, Wang W, Yamada T, Li Q, Takeuchi S, Matsumoto K, et al. Transient PI3K Inhibition Induces Apoptosis and Overcomes HGF-mediated Resistance to EGFR-TKIs in EGFR Mutant Lung Cancer. Clin Cancer Res. 2011 Jan 10; doi: 10.1158/1078-0432.CCR-10-1993. [DOI] [PubMed] [Google Scholar]
- 60.Balciunaite E, Kazlauskas A. Early phosphoinositide 3-kinase activity is required for late activation of protein kinase Cepsilon in platelet-derived-growth-factor-stimulated cells: evidence for signalling across a large temporal gap. Biochem J. 2001 Sep 1;358(Pt 2):281–5. doi: 10.1042/0264-6021:3580281. [DOI] [PMC free article] [PubMed] [Google Scholar]
- 61.Raynaud FI, Eccles SA, Patel S, Alix S, Box G, Chuckowree I, et al. Biological properties of potent inhibitors of class I phosphatidylinositide 3-kinases: from PI-103 through PI-540, PI-620 to the oral agent GDC-0941. Mol Cancer Ther. 2009 Jul;8(7):1725–38. doi: 10.1158/1535-7163.MCT-08-1200. [DOI] [PMC free article] [PubMed] [Google Scholar]
- 62.Carracedo A, Alimonti A, Pandolfi PP. PTEN level in tumor suppression: how much is too little? Cancer Res. 2011 Feb 1;71(3):629–33. doi: 10.1158/0008-5472.CAN-10-2488. [DOI] [PMC free article] [PubMed] [Google Scholar]
- 63.Trotman LC, Niki M, Dotan ZA, Koutcher JA, Di Cristofano A, Xiao A, et al. Pten dose dictates cancer progression in the prostate. PLoS Biol. 2003;1(3):E59. doi: 10.1371/journal.pbio.0000059. [DOI] [PMC free article] [PubMed] [Google Scholar]
- 64.Pelz C, Matsumoto T, Molski TF, Becker EL, Sha’afi RI. Characterization of the membrane-associated GTPase activity: effects of chemotactic factors and toxins. Journal of cellular biochemistry. 1989;39(2):197–206. doi: 10.1002/jcb.240390211. [DOI] [PubMed] [Google Scholar]
- 65.Debnath J, Muthuswamy SK, Brugge JS. Morphogenesis and oncogenesis of MCF-10A mammary epithelial acini grown in three-dimensional basement membrane cultures. Methods (San Diego, Calif) 2003;30(3):256–68. doi: 10.1016/s1046-2023(03)00032-x. [DOI] [PubMed] [Google Scholar]
Associated Data
This section collects any data citations, data availability statements, or supplementary materials included in this article.