Abstract
Pendrin is a Cl−/HCO3− exchanger, expressed in the apical regions of some intercalated cell subtypes, and is critical in the pressor response to angiotensin II. Since angiotensin type 1 receptor inhibitors reduce renal pendrin protein abundance in mice in vivo through a mechanism that is dependent on nitric oxide (NO), we asked if NO modulates renal pendrin expression in vitro and explored the mechanism by which it occurs. Thus we quantified pendrin protein abundance by confocal fluorescent microscopy in cultured mouse cortical collecting ducts (CCDs) and connecting tubules (CNTs). After overnight culture, CCDs maintain their tubular structure and maintain a solute gradient when perfused in vitro. Pendrin protein abundance increased 67% in CNT and 53% in CCD when NO synthase was inhibited (NG-nitro-l-arginine methyl ester, 100 μM), while NO donor (DETA NONOate, 200 μM) application reduced pendrin protein by ∼33% in the CCD and CNT. When CNTs were cultured in the presence of the guanylyl cyclase inhibitor 1H-[1,2,4] oxadiazolo[4,3-a]quinoxalin-1-one (10 μM), NO donors did not alter pendrin abundance. Conversely, pendrin protein abundance rose when cAMP content was increased by the application of an adenylyl cyclase agonist (forskolin, 10 μM), a cAMP analog (8-bromo-cAMP, 1 mM), or a phosphodiesterase inhibitor (BAY60-7550, 50 μM). Since NO reduces cellular cAMP in the CNT, we asked if NO reduces pendrin abundance by reducing cAMP. With blockade of cGMP-stimulated phosphodiesterase II, NO did not alter pendrin protein abundance. We conclude that NO acts through cAMP to reduce pendrin total protein abundance by enhancing cAMP degradation.
Keywords: chloride, nitric oxide, pendrin
pendrin is a Cl−/HCO3− exchanger that is critical to Cl− absorption in the cortical collecting duct (CCD). Our laboratory and others (27, 30) have observed that both cAMP and nitric oxide (NO) regulate Cl− absorption in the CCD. Moreover, we have observed that administration of a NO synthase inhibitor [NG-nitro-l-arginine methyl ester (l-NAME)] in vivo increases pendrin protein abundance, although pendrin subcellular distribution is unchanged (35). Therefore, we asked if cAMP and NO have a direct effect on pendrin expression in vitro and explored the mechanism by which this occurs.
NO might modulate pendrin protein abundance in vivo through a direct effect on pendrin translation and/or pendrin protein turnover. However, systemic changes in NO may also modulate pendrin protein abundance through indirect effects such as changes in blood pressure or endocrine/paracrine function (21, 24). Resolving this issue requires study of the effects of NO on pendrin abundance in a cell culture model. However, since no cell culture model is available that faithfully recapitulates intercalated cell function in vivo, we developed a method of culturing native mouse connecting tubules (CNTs) and CCDs overnight, which allowed us to explore the direct effect of NO on pendrin abundance in vitro in native tissue. Since pendrin mRNA (23) and apical plasma membrane pendrin abundance (3) increase with cAMP application in vitro, and since NO reduces vasopressin-stimulated cAMP in rat CCDs (9), we hypothesized that NO acts through cyclic nucleotide signaling to directly stimulate pendrin protein abundance in kidney, without changing subcellular distribution. Thus the purpose of this study was to determine if NO reduces pendrin protein abundance in vitro and to determine the signaling mechanism by which this occurs.
METHODS
Animals
129S6/SvEvTac mice were bred and maintained in a pathogen-free animal facilty at Emory University. For all in vitro studies, mice were maintained for 5–7 days on a diet prepared as a gel that contained 24.8% Zeigler Brothers no. 53881300 rodent chow, 74.6% water, and 0.6% agar. Furosemide and NaCl were added to the gelled diet to give mice 0.8 meq/day NaCl and 3 mg/day furosemide (Hospira, Lake Forest, IL). All treatment protocols were approved by the Animal Use Committee at Emory University.
Tubule Dissection and Culture
To dissect CNTs (39), mice were anesthetized with 1–2% isofluorane/100% O2 at 1 l/min and then perfused in situ with 10 ml of ice-cold solution containing the following (in mM): 144 NaCl, 5 KCl, 1 Na2HPO43−, 1.2 MgSO42−, 2 CaCl2, 5.5 glucose, and 10 HEPES, pH 7.4. Mice were then perfused with 20 ml of the same solution but containing 1 mg/ml collagenase B (0.2 U/mg; Roche, Indianapolis, IN). After death, the kidneys were removed and placed in dissecting solution on ice and sliced transversely into thin strips, which were then incubated in the collagenase-containing solution for 4 min at 37°C. Tissue was then placed in collagenase-free dissection solution containing (in mM): 125 NaCl, 5 KCl, 24 NaHCO3−/5%CO2, 1 Na2HPO43−, 2 CaCl2, 1.2 MgSO4, and 5.5 glucose. BSA (Sigma, 1 mg/ml) was added to the dissection solution to neutralize residual collagenase activity. CNTs were then dissected under a stereo zoom microscope at 11°C.
To dissect CCDs (29), mice were anesthetized with 1–2% isofluorane/100% O2 and killed and the kidneys were removed. Coronal slices of kidneys were placed in a dissection dish containing the dissection solution given above. CCDs were dissected from medullary rays, without collagenase, under a stereo zoom microscope at 11°C.
Dissected CCDs and CNTs were transferred into 35-mm diameter glass-bottom dishes (collagen coated, Mattek) that were coated with Cell-Tak following the manufacturer's instructions. Culture media contained DMEM/Ham's F12 (GIBCO, Invitrogen, cat. no. 12400–024), with the addition of 100 U/ml penicillin, 100 μg/ml streptomycin, 2 mM HEPES acid, 2 mM l-glutamine, 12.4 mM glucose, and 30 mM NaHCO3−. Tubules were incubated at 37°C with 5% CO2 for up to 22 h and then fixed and labeled for pendrin.
Immunofluorescence
Tubules were fixed in 2% paraformaldehyde-lysine-periodate for 4 h at 4°C, rinsed with PBS (pH 7.4), and then permeabilized by incubation in PBS containing 0.3% Triton X-100 for 15 min. Tissue was washed quickly in PBS three times and then incubated for 30 min in PBS containing 1% BSA, 0.05% saponin, and 0.2% gelatin, with the solution being changed every 10 min. Tubules were then incubated overnight at 4°C with an affinity-purified polyclonal rabbit, anti-human pendrin antibody (29) or a polyclonal rabbit, and anti-rat pendrin antibody (15) in PBS. Tubules were then rinsed in PBS, labeled with an FITC-conjugated goat anti-rabbit antibody (Jackson Immunoresearch), diluted in PBS for 2 h and then washed three times in PBS, washed once with double distilled water, and then mounted with VECTASHIELD mounting medium (Vector Labs).
Quantitative Analysis of Immunofluorescence in Isolated Tubules
For all experiments, each slide contained one to three tubules from the same mouse, all of which were studied and the results were averaged.
Method 1.
For each tubule, we randomly selected three to seven pendrin-positive cells that were positioned in the middle of the tubule along its long axis. Cells were selected that did not lie above or below other pendrin-positive cells in the focal plane. Optical Z sections of the pendrin-positive cells were acquired using a Zeiss LSM 510 META laser scanning confocal microscope with either a ×20 (NA 0.8) objective or a ×63 (NA 1.4) oil immersion objective using an argon laser. Each group of images had the same acquisition settings. Pendrin labeling was inscribed as regions of interest. Fluorescence intensities were quantified on maximum intensity projection images using Zeiss ZEN software.
Method 2.
In some experiments, pendrin immunolabel was analyzed by an additional quantitative procedure to assay immunolabel abundance and subcellular distribution. Pendrin immunoreactivity was quantified as described previously (35) using immunofluorescence micrographs of isolated CCD and CNT segments described above and converted to 200-ppi gray scale micrographs using Adobe Photoshop CS3 (Adobe Systems, San Jose, CA). Pixel intensity across a line drawn from the tubule lumen through the center of an individual cell was quantified with NIH ImageJ, version 1.34s software. Background pixel intensity was calculated as the mean pixel intensity in the basal 30% of the cell, where pendrin is not expressed, and subtracted from the pixel intensity at each point. Total cellular expression was determined by integrating net pixel intensity across the entire cell. Cell height was determined as the distance in pixels between the apical and the basolateral edges of the cell. Immunoreactivity expressed at the apical 10, 20, and 25% of the cell was determined by integrating pixel intensity at this region. Pendrin label was measured in all cells with a discernible apical edge.
For both approaches, two conditions were studied in tubules taken from each mouse. For each condition, measurements were made in 3–11 cells taken from 1–2 tubules. Data from all cells from each condition were averaged for each animal. The pooled data were used in the statistical analysis.
Quantifying Pendrin-Positive Cells Per Millimeter Tubule Length
We compared the number of pendrin-positive cells per millimeter tubule length in fluorescence micrographs of tubules taken from the same mouse that were cultured overnight (18–22 h) in the presence or absence of l-NAME. To quantify the abundance of B cells under each condition, the number of pendrin-positive cells showing a clear nucleus in the focal plane was divided by the length of tubule measured when calibrated using Imgepro software (MediaCybernetics).
Measurement of cAMP in CNT
For each sample, 2–6 mm of CNTs were dissected, as described above. Tubules were then transferred to a 1.5-ml Eppendorf tube and incubated for 10 min at 37°C in a 20-μl solution containing the following (in mM): 135 NaCl, 5 KCl, 1.0 NaH2PO43−, 1.2 MgSO42−, 2.0 CaCl2, 5.5 glucose, and 10 HEPES, pH 7.4. An additional 20 μl of the same solution were added, which contained (Z)-1-[N-(3-aminopropyl)-N-(3-ammoniopropyl)amino]diazen-1-ium-1,2-diolate (DPTA; Enzo Life Sciences) or vehicle to give a final DPTA concentration of 150 or 0 μM. In other experiments that tested the effect of forskolin on cAMP levels, 20 μl of solution were added that contained either forskolin or vehicle to give a final forskolin concentration of 10 or 0 μM. Tubules were then incubated at 37°C for an additional 20–30 min. The reaction was stopped by addition of 50 μl 0.1 N HCl and incubation for 10 min at 37°C. The suspension was then centrifuged for 5 min at 13,000 g. The supernatant was then removed and stored in a glass tube at −80°C. cAMP was assayed by ELISA using a kit (catalogue no. 900–163; Enzo Life Sciences, Plymouth Meeting, PA) following the manufacturer's instructions.
Measurement of Urea Permeability in Cultured CCDs
CCDs were dissected from furosemide-treated mice and cultured overnight. Tubules were then removed from the culture dish and perfused in vitro as described previously (38). The bath contained 5 mM urea, whereas urea was substituted with raffinose in the perfusate (38) Urea permeability was calculated as described previously (38) based on urea concentration measured in collected fluid samples with a continuous-flow fluorimeter (38).
Statistics
When comparing results of two conditions measured in tubules taken from the same mouse, a paired Students t-test was used. P < 0.05 indicated statistical significance. Data are expressed as means ± SE.
RESULTS
Culturing Native CNTs and CCDs Provides a Way to Study the Regulation of Pendrin Abundance In Vitro
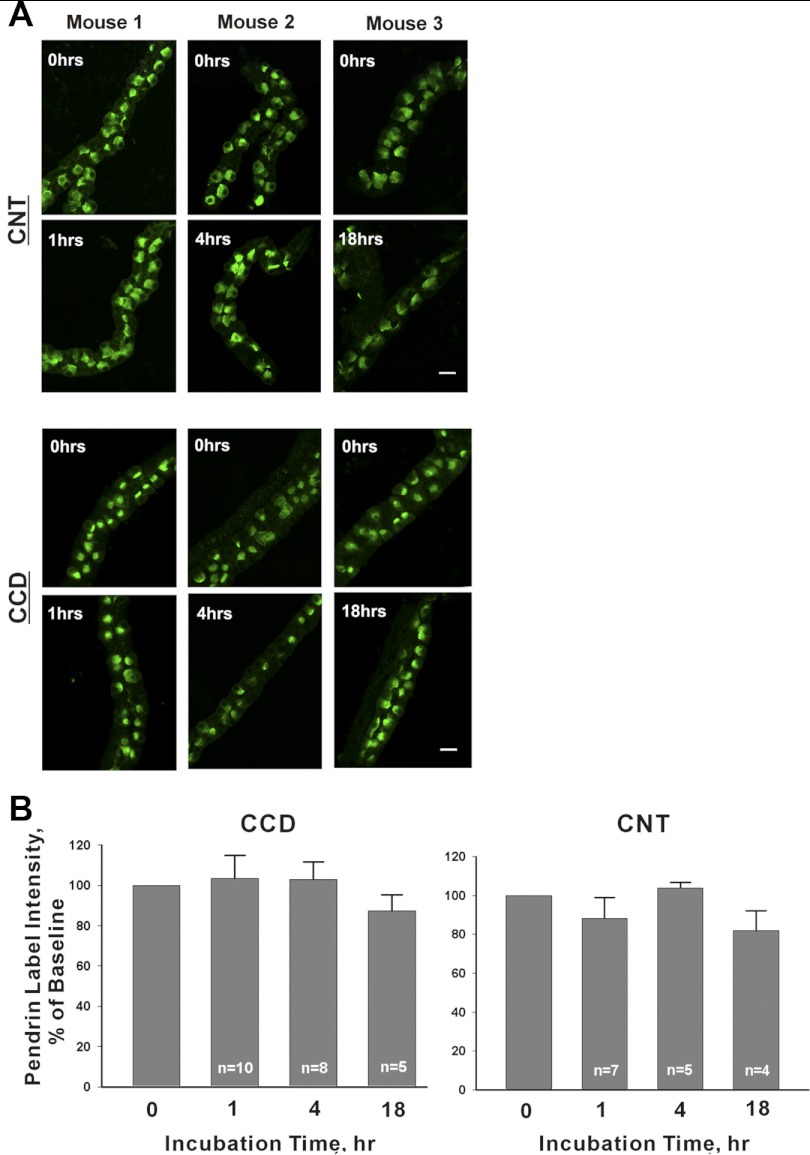
To examine the regulation of pendrin expression in vitro, we cultured native CNTs and CCDs in vitro. Pendrin fluorescence intensity was quantified in serial sections through pendrin-positive regions of interest in tubules following culture for 1, 4, or 18–22 h (Fig. 1, method 1) and compared with tubules from the same mouse that were fixed immediately after dissection (0 time point). Figure 1 also shows that CCDs and CNTs maintain their tubular structure for up to 22 h. Since there were no statistically significant differences at any time points tested, pendrin protein abundance remained relatively stable for 18–22 h in culture (overnight).
Fig. 1.
Time-dependent changes in pendrin label intensity in untreated cultured connecting tubules (CNTs) and cortical collecting ducts (CCDs). A: representative tubules are shown that were cultured for 0, 1, 4, or 18 h. For each time point, a tubule taken from the same mouse is shown that was fixed immediately after plating (0 h). Top: CNTs; bottom: CCDs. B: mean pendrin label intensity in labeled cells in isolated tubules after 0, 1, 4, and 18 h of culture. Data are expressed as label intensity relative to tubules from the same mouse that were fixed immediately after plating (0 incubation time).
Further experiments explored whether CCDs maintain their tubule structure with a tight epithelium after overnight culture. To answer this question, we measured urea permeability in CCDs that were perfused in vitro following overnight culture (38). With 5 mM urea in the bath and no urea in the perfusate, the mean collected urea concentration taken from four separate CCDs was 0.34 ± 0.06 mM, giving a urea permeability of 3.7 ± 0.4 × 10⁻⁵ cm/s (n = 4), which compares to 0.5 ± 0.1 × 10⁻⁵ cm/s measured in rat CCDs perfused in vitro immediately after dissection (16). These data demonstrate that cultured CCDs maintain a solute gradient and tubular structure.
NO Reduces Pendrin Abundance In Vitro
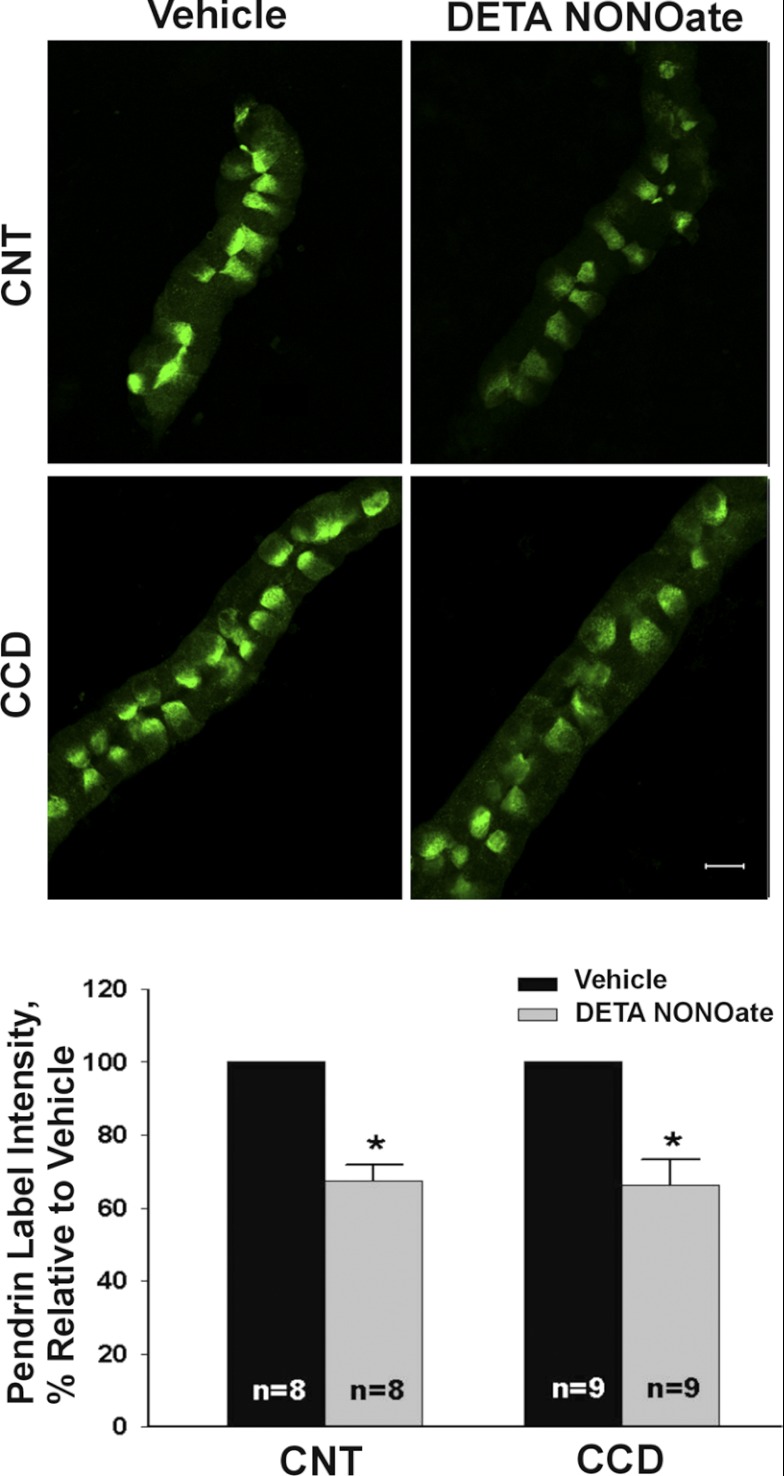
Further experiments explored the effect of an NO donor on pendrin abundance. Thus tubules were cultured overnight with the long-acting NO donor (Z)-1-[2-(2-aminoethyl)-N-(2-ammonioethyl)amino]diazen-1-ium-1,2diolate (DETA NONOate, 200 μM) or vehicle (Fig. 2). As shown, in both the CCD and the CNT, mean cellular pendrin abundance assessed by quantitative immunofluorescence was ∼40% lower in tubules exposed to the NO donor relative to those receiving vehicle (method 1). Thus NO donors reduce pendrin abundance.
Fig. 2.
Nitric oxide (NO) donors reduce pendrin protein abundance in vitro. CCDs or CNTs were cultured overnight either in the presence of the NO donor (Z)-1-[2-(2-aminoethyl)-N-(2-ammonioethyl)amino]diazen-1-ium-1,2-diolate (DETA NONOate, 200 μM) or vehicle and then fixed and labeled for pendrin. Top: representative CCDs (or CNTs) from the same mouse following culture in the presence of DETA or vehicle. Bottom: effect of DETA on mean pendrin label intensity. *P < 0.05.
To confirm these findings, pendrin immunolabeling was assessed using alternative criteria for cell selection and quantifying pendrin abundance in these cells. Fluorescence was measured in a linear axis from the apical to the basal side of the cell, based on previously published methods (method 2) (35). This method confirmed that NO donors reduce pendrin abundance in the CCD and CNT without changing pendrin subcellular distribution (Table 1). Since both methods of assessing pendrin immunolabel indicate that an NO donor reduces pendrin abundance in vitro without changing subcellular distribution in the mouse CNT and CCD, subsequent experiments quantified mean cellular abundance through quantitative immunofluorescence (method 1), unless otherwise indicated.
Table 1.
Effect of NO donor (DETA) for 18 h on pendrin abundance and subcellular distribution
| Segment | Parameter | Vehicle | DETA |
|---|---|---|---|
| CNT (n = 8) | Cell height (arbitrary units) | 227 ± 11 | 223 ± 10 |
| Total cell expression (pixel intensity, arbitrary units) | 14,091 ± 1,895 | 8,467 ± 1,104* | |
| Apical expression ratio (expression in the apical 10% of the cell, relative to total expression, %) | 0.162 ± 0.012 | 0.166 ± 0.013 | |
| Inner CCD (n = 5) | Cell height (arbitrary units) | 215 ± 2.9 | 207 ± 15 |
| Total cell expression (pixel intensity, arbitrary units) | 8,724 ± 1,521 | 7,441 ± 1,217* | |
| Apical expression ratio (expression in apical 10% relative to total expression, %) | 0.243 ± 0.019 | 0.235 ± 0.030 |
Values are means ± SE. NO, nitric oxide; DETA, (Z)-1-[2-(2-aminoethyl)-N-(2-ammonioethyl)amino]diazen-1-ium-1,2-diolate; CNT, connexting tubule; CCD, cortical collecing duct.
P < 0.05.
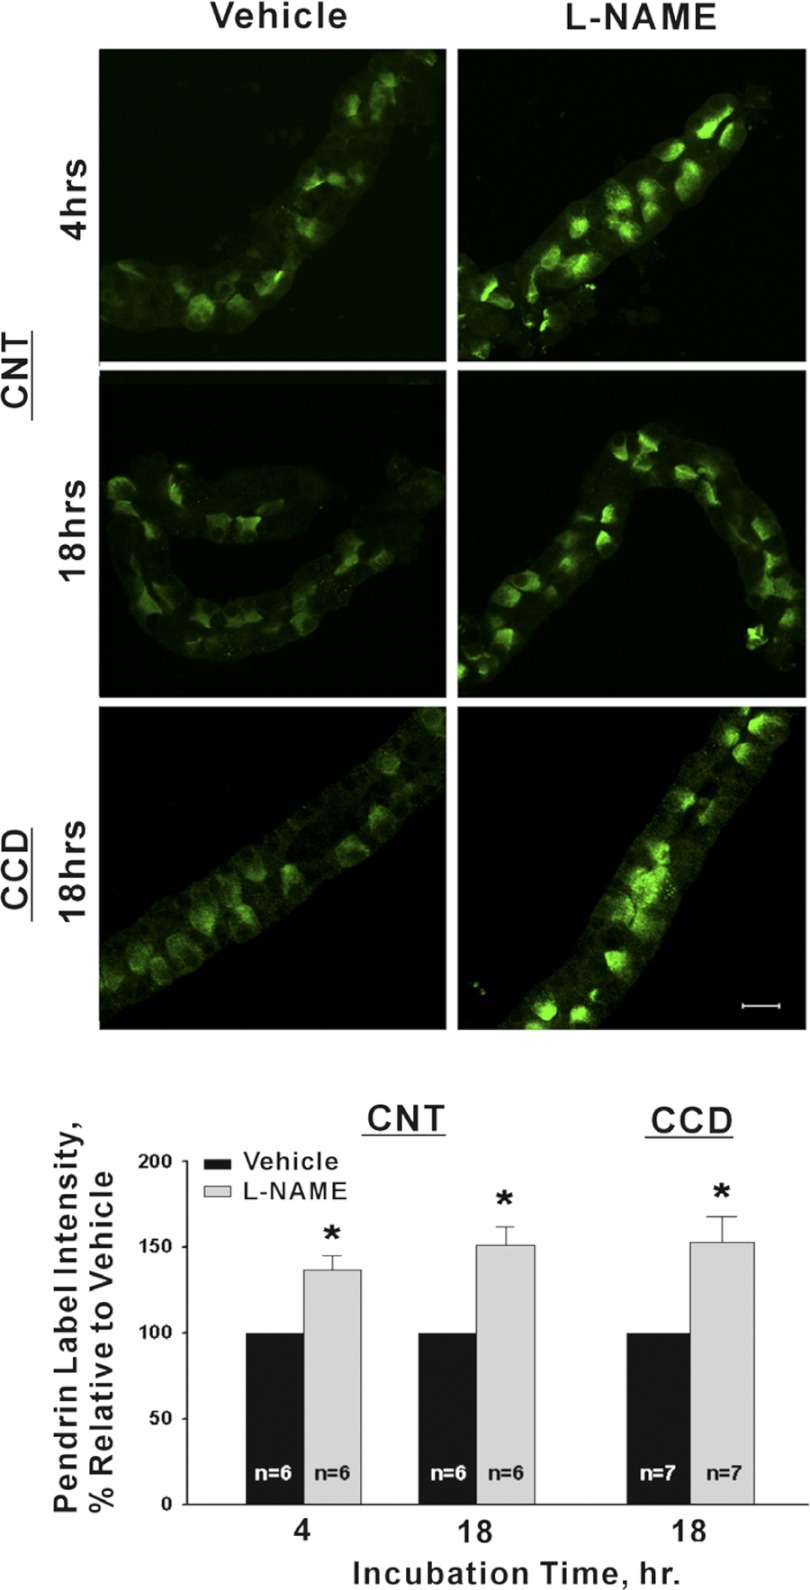
We asked if pendrin abundance increases when endogenous NO is reduced. Therefore, tubules were cultured overnight in the presence of the NO synthase inhibitor l-NAME (100 μM; Fig. 3) or vehicle. As shown, in both CCDs and CNTs, 1 day of l-NAME application increased pendrin abundance by ∼50%. However, no marked difference in pendrin subcellular distribution was observed with l-NAME application, consistent with in vivo observations (35). Further experiments asked if l-NAME treatment changes the relative abundance of intercalated cell subtypes, such as through interconversion of type A and type B intercalated cells. To explore this possibility we quantified the number of pendrin-positive cells per millimeter tubule length in CNTs and CCDs. Following overnight treatment with l-NAME, we observed no change in the number of pendrin-positive cells in either the CCD (vehicle, 37 ± 5 vs. l-NAME, 36 ± 7.4 pendrin-positive cells/mm tubule length; n = 3; P = NS) or the CNT (vehicle, 56 ± 8 vs. l-NAME, 59 ± 6 pendrin-positive cells/mm tubule length; n = 4; P = NS). We conclude that the abundance of pendrin-positive cells, i.e., type B and non-A, non-B intercalated cells, does not change significantly in response to treatment with l-NAME overnight.
Fig. 3.
Inhibiting NO synthase in vitro increases pendrin label intensity. Top: micrographs of representative CCD (or CNTs) taken from the same mouse that were cultured in the presence of either NG-nitro-l-arginine methyl ester (l-NAME; 100 μM) or vehicle. Bottom: mean pendrin label intensity in CNTs and in CCDs cultured overnight in the presence of the NO synthase inhibitor l-NAME vs. vehicle. *P < 0.05.
NO Reduces Pendrin Abundance Through cGMP
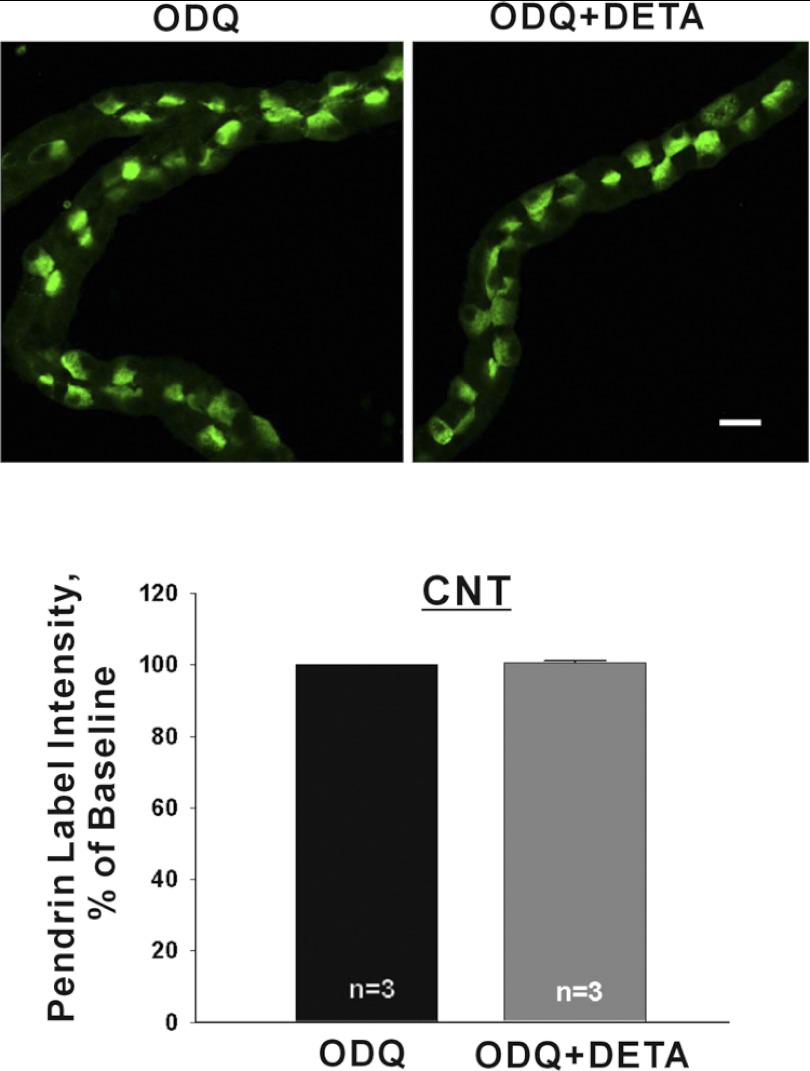
Further experiments asked if NO alters pendrin abundance through cyclic nucleotide signaling. Since phosphodiesterase activity is higher in the CNT than the CCD (17), we explored the role of cyclic nucleotide signaling in the fall in pendrin abundance observed with NO donors in the CNT. We asked if inhibiting guanylyl cyclase prevents NO-induced changes in pendrin abundance. To do so, CNTs were incubated in the presence of the guanylyl cyclase inhibitor, 1H-[1,2,4] oxadiazolo[4,3-a]quinoxalin-1-one (ODQ, 10 μM) or ODQ plus NO donor (DETA NONOate, Fig. 4). As shown, in the presence of ODQ, NO did not change mean cellular pendrin abundance. Thus NO modulates pendrin abundance through a cGMP-dependent effect.
Fig. 4.
When guanylyl cyclase is inhibited, NO donors do not reduce pendrin protein abundance in the CNT. CNTs were incubated overnight in the presence of the guanylyl cyclase inhibitor, 1H-[1,2,4] oxadiazolo[4,3-a]quinoxalin-1-one (ODQ, 10 μM) or ODQ and DETA (200 μM) and then fixed and labeled for pendrin. Top: representative images of pendrin label in CNTs taken from the same mouse that were cultured in the presence of ODQ alone or ODQ and DETA. Bottom: mean pendrin label density in CNTs cultured in the presence of ODQ or ODQ and DETA.
cAMP Increases Pendrin Protein Abundance
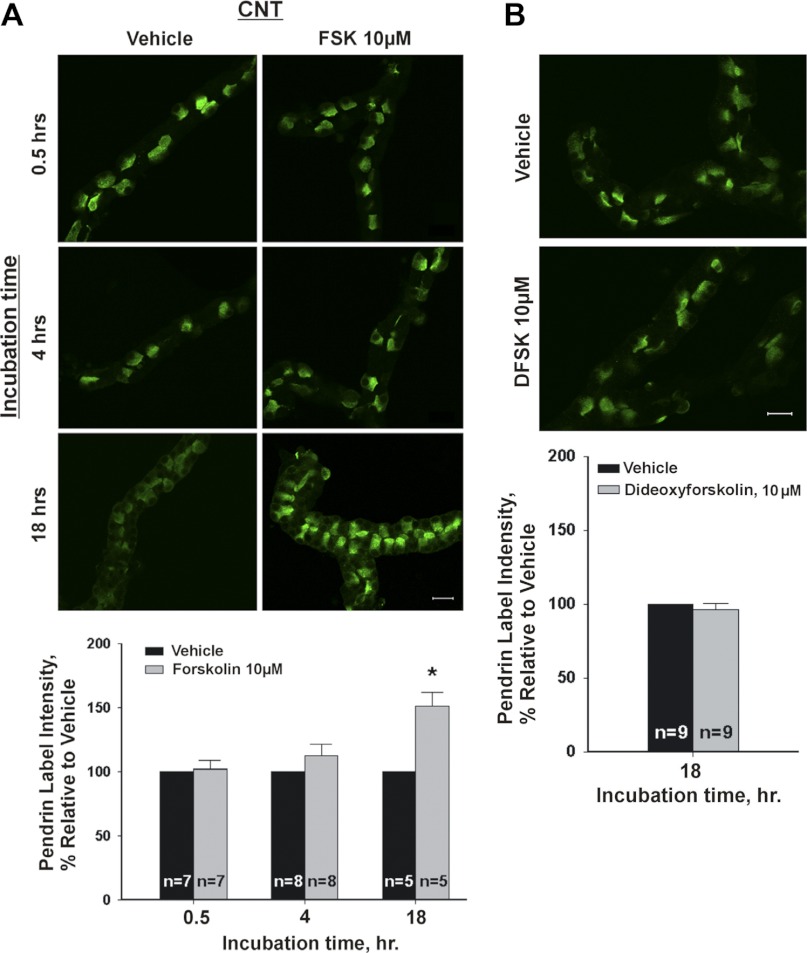
Since cAMP increases pendrin function and pendrin mRNA in thyroid cells (23), we explored the effect of cAMP on pendrin abundance. Figure 5 shows that in the CNT, pendrin abundance rose when cellular cAMP was increased with the application of an adenylyl cyclase agonist (forskolin, 10 μM) overnight, although overnight application of forskolin's inactive enantiomer, d-forskolin, had no effect (Fig. 5). Since stimulation of pendrin abundance by forskolin took >4 h, we asked if this occurred due to a lag in forskolin-induced stimulation of cAMP production. Thus cellular cAMP was measured in CNTs following 20 min of exposure to either vehicle or forskolin (10 μM). We observed that cAMP was 23.1 fmol/mm tubule length in vehicle-treated CNTs but 2,114 fmol/mm in forskolin-treated CNTs (n = 3; P < 0.05). We conclude that our inability to detect a change in pendrin abundance after 4 h of exposure to forskolin was not because cAMP production had not yet risen by that time point.
Fig. 5.
Stimulating adenylyl cyclase increases pendrin protein abundance in the CNT. A, top: pendrin immunolabel is shown in representative CNTs that were cultured in the presence of forskolin or vehicle for 0.5, 4, or 18 h. A, bottom: means ± SE of pendrin label intensity in CNTs cultured in the presence of forskolin (10 μM) or vehicle for each of the times given. At each of these time points, we compared the effect of vehicle and forskolin on pendrin label intensity in tubules taken from the same mouse. B, top: pendrin label intensity in CNTs cultured overnight (i.e., 18–22 h) in the presence of forskolin's inactive enantomer, dideoxyforskolin (dFSK, 10 μM), or vehicle. B (top) shows representative CNTs taken from the same mouse that received dFKS or vehicle. B, bottom: means ± SE of pendrin label intensity under both of these conditions. *P < 0.05.
In heterologous expression systems, cAMP increases plasma membrane pendrin expression through subcellular redistribution (3). Therefore, we employed quantitative immunofluorescence (method 2) to explore the effect of 30 min of forskolin exposure on pendrin trafficking. As shown (Table 2), we could not detect a change in either pendrin protein abundance or subcellular distribution following 30 min of treatment with this adenylyl cyclase agonist. We conclude that short-term increases in cellular cAMP do not alter pendrin subcellular distribution in native CNTs.
Table 2.
Effect of 30 min of forskolin on pendrin abundance and subcellular distribution
| Segment | Parameter | Vehicle | Forskolin |
|---|---|---|---|
| CNT (n = 4) | Cell height (arbitrary units) | 241 ± 11 | 227 ± 12 |
| Total cell expression (pixel intensity, arbitrary units) | 16,282 ± 2715 | 13,828 ± 1,012 | |
| Apical expression ratio (expression in the apical 10% of the cell, relative to total expression, %) | 0.1276 ± 0.0054 | 0.1447 ± 0.0105 |
Values are means ± SE.
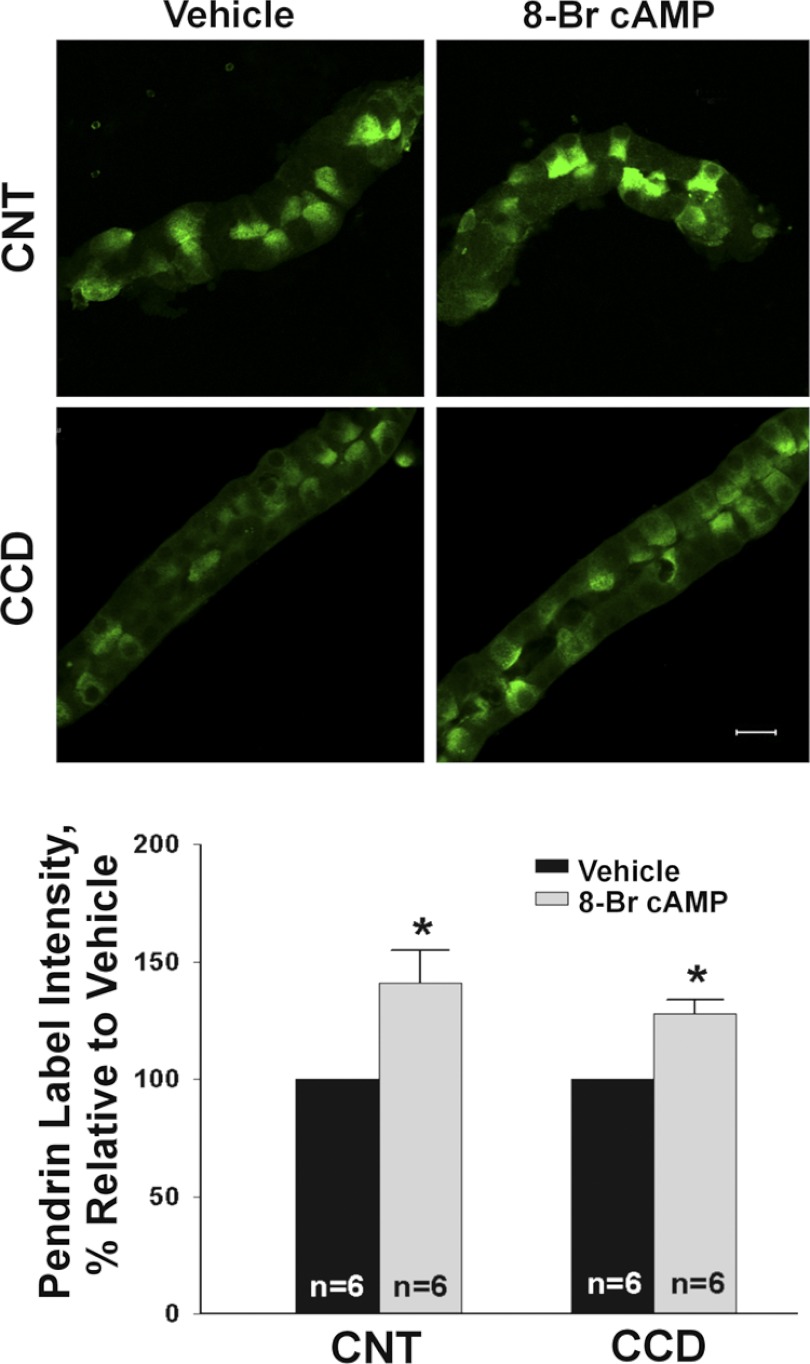
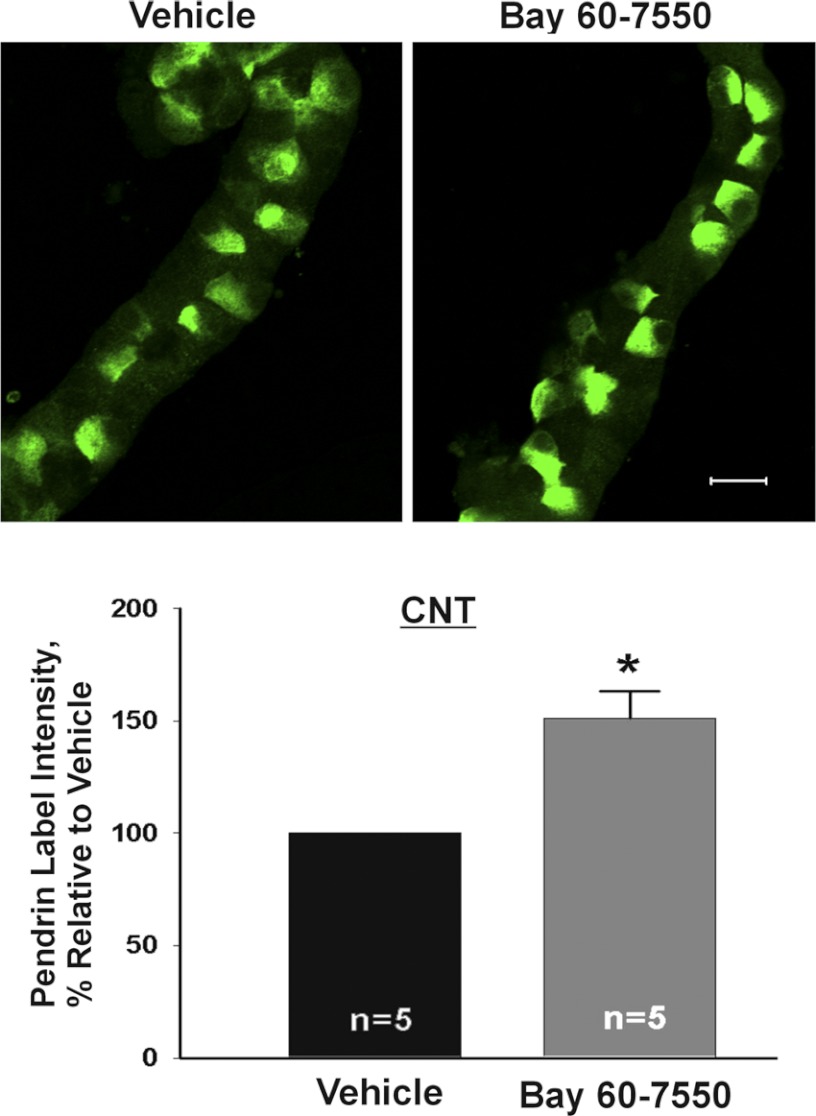
Further experiments explored the effect of cAMP analogs and phosphodiesterase inhibitors on pendrin protein abundance. We observed that mean cellular pendrin abundance increased when CCDs or CNTs were cultured overnight in the presence of 8 bromo-cAMP (1 mM; Fig. 6) or when cAMP degradation was reduced by inhibiting phosphodiesterase II (2) (BAY60-7550, 50 μM; Fig. 7). We conclude that raising cAMP content increases pendrin abundance in both the CCD and in the CNT.
Fig. 6.
Increasing cAMP increases pendrin abundance in the CCD and CNT. CCDs and CNTs were cultured overnight in the presence of 1 mM 8-bromo (Br)-cAMP or vehicle. For each segment, we compared the effect of cAMP or vehicle on pendrin immunolabel in tubules taken from the same mouse. Top: representative tubules labeled for pendrin taken following culture with 8-Br-cAMP or vehicle. Bottom: effect of cAMP on the means ± SE of pendrin label intensity in each segment. *P < 0.05.
Fig. 7.
Inhibiting cGMP-stimulated phosphodiesterase increases pendrin protein abundance. CNTs were incubated overnight in the presence of the phosphodiesterase II inhibitor (BAY60-7550, 50 μM) or vehicle and then fixed and labeled for pendrin. Top: representative images of pendrin label in CNTs that received vehicle or BAY60-7550. Bottom: pendrin label density (mean ± SE) under each condition. *P < 0.05.
NO Reduces Pendrin Abundance Through a cAMP-Dependent Mechanism
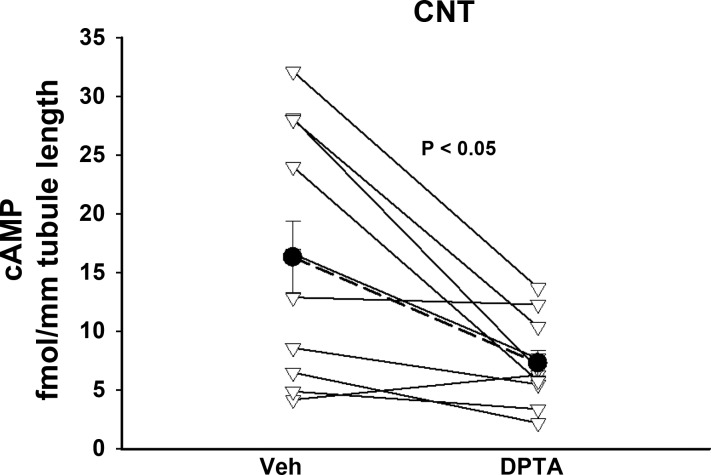
Since NO reduces cAMP in many tissues, such as the CCD (9), and since cAMP stimulates pendrin expression, we asked if NO reduces pendrin abundance by stimulating cAMP hydrolysis. To answer this question, we examined the effect of an NO donor on CNT cAMP content. As shown (Fig. 8), when CNTs were incubated for 30 min in the presence of a shorter acting NO donor DPTA NONOate (150 μM), cAMP content fell by 55%. We conclude that NO donors reduce cAMP in the mouse CNT.
Fig. 8.
NO donors reduce cAMP in the CNT. CNTs were incubated for 20 min in the presence of the NO donor (Z)-1-N-(3-aminopropyl)-N-(3-ammoniopropyl)amino]diazen-1-ium-1,2-diolate (DPTA; 150 μM) or vehicle and then assayed for cAMP content. Tubules isolated from each mouse were treated and analyzed as a pair. Triangles show the effect of DPTA in tubules from each mouse. Solid circles show means ± SE of these experiments.
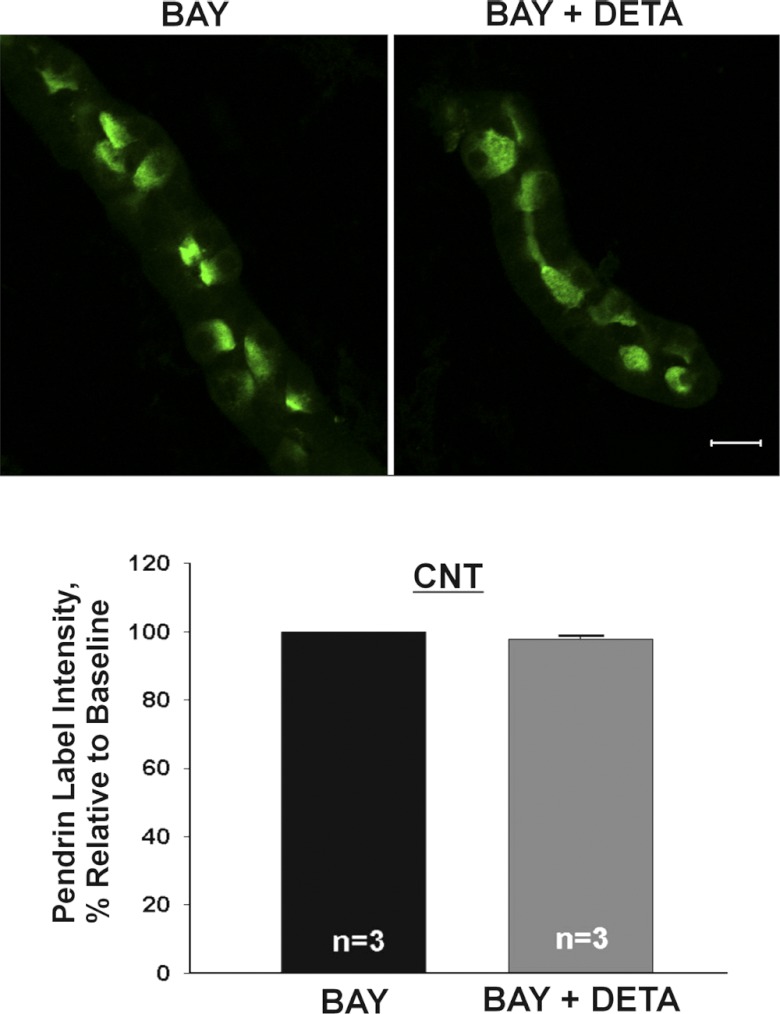
Since NO donors reduce cAMP in the CNT and since NO stimulates cGMP-sensitive phosphodiesterase II downstream, subsequent experiments asked if phosphodiesterase II blockade eliminates the fall in pendrin abundance observed with NO donor application. Figure 9 shows that with phosphoesterase II blockade, NO donors do not change mean cellular pendrin protein abundance. We conclude that NO reduces pendrin protein abundance, at least in part, through a phosphodiesterase II-dependent mechanism.
Fig. 9.
When phosphodiesterase II is inhibited, NO does not reduce pendrin abundance. CNTs were incubated overnight with either phosphodiesterase II inhibitor (BAY60-7550, 50 μM) or phosphodiesterase inhibitor and NO donor (BAY60-7550 + DETA, 200 μM) and then fixed and labeled for pendrin. Top: pendrin label in representative CNTs. Bottom: mean pendrin label density (means ± SE) in CNTs under each condition.
DISCUSSION
The cortical collecting duct and connecting tubule are critical to a number of physiological functions, such as K+ homeostasis, blood pressure regulation, and acid-base balance. This is accomplished by multiple cell types within these segments. The various cell types found in these segments accomplish these physiological roles, in part, through interaction with one another. For example, pendrin modulates epithelial sodium channel abundance and function, although these transporters localize to different cell types within the CNT and CCD (14). Moreover, K+ secretion by intercalated cells is dependent on the lumen-negative transepithelial voltage generated by the epithelial sodium channel (18). Therefore, study of a pure culture of principal intercalated cells may not fully reflect the function of these segments in vivo since CCD and CNT function depends in part of the interaction between intercalated and principal cells.
While intercalated cells are critical to a number of physiological roles, there have been no in vitro cell models developed to date that effectively recapitulate intercalated cell function in vivo (8, 33). Instead, many studies have used heterologous expression systems to characterize intercalated cell transporters. However, proteins that are overexpressed proteins in heterologous expression systems may suffer from functional changes due to protein misfolding, protein aggregation (37), or functional changes that follow the introduction of fluorescent tags (36). Since physiological differences might exist between continuous cell lines and native tissue (19), we cultured native mouse CNT and CCDs, which allowed us to study pendrin physiology in vitro in native tissue. Mouse CCDs have been cultured previously over 14 days (6), which results in a cell monolayer, thereby enabling physiological measurements (6). However, it is unclear if intercalated cells are expressed in this cell culture system and whether the CCD maintains normal function in the absence of a tubular structure. Thus we chose to culture CCDs and CNTs for up to 22 h. Following overnight culture, CCDs express both principal cells and pendrin-positive intercalated cells. Moreover, they maintain a relatively tight epithelium and their tubular structure. We have exploited this approach to explore whether NO regulates pendrin expression in native tissue independent of secondary effects that can occur in vivo such as changes in blood pressure or changes in systemic hormonal concentrations.
We observed previously that pendrin abundance increases in vivo with systemic inhibition of NO synthase. Moreover the change in pendrin abundance observed in vivo with angiotensin type 1 receptor (Agtr1) inhibition occurs through angiotensin type 2 receptor (Agtr2)- and NO-dependent signaling downstream of Agtr1 (35). Since the action of the Agtr2 in renal tissue is mediated largely through NO (31), we hypothesized that the Agtr1 modulates pendrin total protein abundance in vivo through the action of NO. This hypothesis was supported by the observation that the effect of the Agtr1 receptor on pendrin total protein abundance was abolished in mice with genetic disruption of the Agtr2 or with chemical inhibitors of NO synthase (l-NAME) given in vivo (35). Moreover, previous studies (1, 13, 20, 25, 41, 42) in both vascular and renal tissue have shown that effects of angiotensin II are often mediated by O2·−/H2O2 excess or NO depletion. Study of these native tubule segments enabled us to examine the direct effect of NO on pendrin expression and to explore the downstream signaling mechanism by which this occurs. The present study demonstrates that NO reduces pendrin abundance in vitro through a mechanism that is dependent on guanylyl cyclase and phosphodiesterase activity.
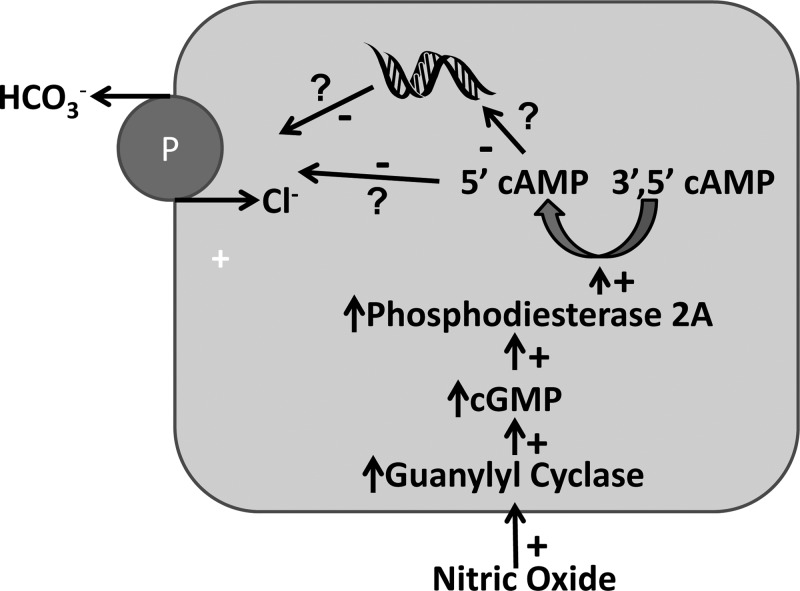
Although NO has cGMP-dependent and cGMP-independent effects, the cellular effects of NO are primarily cGMP-mediated (43). In this signaling cascade, NO activates guanylyl cyclase, which increases cGMP. cGMP affects three downstream pathways: cyclic nucleotide-gated cation channels, cGMP-regulated phosphodiesterases, and cGMP-dependent kinases (7, 12). In this study, we observed that the fall in pendrin abundance observed with 18–22 h of NO exposure is abolished in the presence of the gyanylyl cyclase inhibitor ODQ and in the presence of the cGMP-sensitive phosphodiesterase II inhibitor BAY60-7550. The most likely interpretation of these data (Fig. 10), therefore, is that exposure to NO overnight stimulates cGMP production by soluble guanylate cyclase (9), thereby stimulating phosphodiesterase II (7), which facilitates the conversion of 3′,5′-cAMP to the inactive 5′-AMP. Whether cAMP alters pendrin abundance through changes in transcription or through a posttranslational event remains to be determined. Moreover, since the time required for stimulation of pendrin abundance differed with cAMP and NO, we cannot exclude the possibility that shorter periods of NO exposure alter pendrin abundance through a cAMP-independent mechanism.
Fig. 10.
How NO modulates pendrin abundance. NO stimulates guanylyl cyclase, which increases cGMP. cGMP stimulates phosphodiesterase 2A, thereby reducing pendrin protein abundance through increased cAMP degradation. Whether NO reduces pendrin abundance by reducing transcription or by increasing protein degradation, remains to be determined.
Pendrin is expressed in type B and non-A, non-B intercalated cells in the distal convoluted tubule, the CNT, and the CCD (29, 39), which are the nephron segments with the highest levels of cGMP-stimulated phosphodiesterase in the rodent kidney (17). In particular, the highest level of cAMP hydrolysis by phosphodiesterases in the mouse kidney is found in the CNT (17). Mouse CNT and CCD also express high levels of cGMP-stimulated phosphodiesterase transcripts, such as phosphodiesterase IIa (28). Since aldosterone reduces phosphodiesterase action (17), this steroid hormone may increase pendrin expression in the CCD and CNT (17, 34), at least in part, by changing phosphodiesterase activity.
In addition to stimulating phosphodiesterases, NO can also reduce cAMP by directly inhibiting adenylyl cyclase isoforms I, V, and VI (10, 11, 26), independent of cGMP (4, 5, 11, 22, 26, 32, 40). However, since the effect of NO on pendrin abundance observed in this study was blocked by guanylyl cyclase inhibitors and by inhibitors of phosphodiesterase II, this NO effect appears to be cGMP dependent and does not likely occur through direct inhibition of adenylyl cyclase by NO.
In conclusion, NO reduces pendrin protein abundance without changing pendrin subcellular distribution. This is accomplished by a cGMP- and phosphodiesterase-dependent signaling mechanism. NO increases cGMP production, which stimulates cAMP hydrolysis, thereby reducing pendrin protein abundance.
GRANTS
This study was supported by National Institute of Diabetes and Digestive and Kidney Diseases Grant DK-46493 (to S. M. Wall).
DISCLOSURES
No conflicts of interest, financial or otherwise, are declared by the author(s).
AUTHOR CONTRIBUTIONS
Author contributions: M.T., V.P., O.F., D.A., X.H.W., J.W.V., and Y.H.K. performed experiments; M.T., J.W.V., Y.H.K., and S.M.W. analyzed data; M.T., O.F., J.W.V., Y.H.K., and S.M.W. interpreted results of experiments; M.T., D.A., Y.H.K., and S.M.W. prepared figures; M.T., V.P., J.W.V., Y.H.K., and S.M.W. edited and revised manuscript; M.T., V.P., O.F., D.A., J.W.V., Y.H.K., and S.M.W. approved final version of manuscript; S.M.W. conception and design of research; S.M.W. drafted manuscript.
ACKNOWLEDGMENTS
We thank Dr. Hiroshi Nonoguchi for helpful suggestions.
REFERENCES
- 1. Adler S, Huang H. Oxidant stress in kidneys of spontaneously hypertensive rats involves both oxidase overexpression and loss of extracellular superoxide dismutase. Am J Physiol Renal Physiol 287: F907–F913, 2004 [DOI] [PubMed] [Google Scholar]
- 2. Ares GR, Caceres P, Alvarez-Leefmans FJ, Ortiz PA. cGMP decreases surface NKCC2 levels in the thick ascending limb: role of phosphodiesterase 2 (PDE2). Am J Physiol Renal Physiol 295: F877–F887, 2008 [DOI] [PMC free article] [PubMed] [Google Scholar]
- 3. Azroyan A, Morla L, Crambert G, Laghmani K, Ramakrishnan S, Edwards A, Doucet A. Regulation of pendrin by cAMP: possible involvement in β-adrenergic-dependent NaCl retention. Am J Physiol Renal Physiol 302: F1180–F1187, 2012 [DOI] [PubMed] [Google Scholar]
- 4. Bassil M, Anand-Srivastava MB. Nitric oxide modulates Gi-protein expression and adenylyl cyclase signaling in vascular smooth muscle cells. Free Radic Biol Med 41: 1162–1173, 2006 [DOI] [PubMed] [Google Scholar]
- 5. Bassil M, Li Y, Anand-Srivastava MB. Peroxynitrite inhibits the expression of Giα protein and adenylyl cyclase signaling in vascular smooth muscle cells. Am J Physiol Heart Circ Physiol 294: H775–H784, 2008 [DOI] [PubMed] [Google Scholar]
- 6. Chang CT, Bens M, Hummler E, Boulkroun S, Schild L, Teulon J, Rossier BC, Vandewalle A. Vasopressin-stimulated CFTR Cl- currents are increased in the renal collecting duct cells of a mouse model of Liddle's syndrome. J Physiol 562.1: 271–284, 2005 [DOI] [PMC free article] [PubMed] [Google Scholar]
- 7. Feil R, Lohmann SM, de Jonge H, Walter U, Hofmann F. Cyclic GMP-dependent protein kinases and the cardiovascular system: insights from genetically modified mice. Circ Res 93: 907–916, 2003 [DOI] [PubMed] [Google Scholar]
- 8. Fejes-Toth G, Chen WR, Rusvai E, Moser T, Naray-Fejes-Toth A. Differential expression of AE1 in renal HCO3− secreting and -reabsorbing intercalated cells. J Biol Chem 269: 16717–26721, 1994 [PubMed] [Google Scholar]
- 9. Garcia NH, Stoos BA, Carretero OA, Garvin JL. Mechanism of the nitric oxide-induced blockade of collecting duct water permeability. Hypertension 27: 679–683, 1996 [DOI] [PubMed] [Google Scholar]
- 10. Goldstein J, Silberstein C, Ibarra C. Adenlyly cyclase types I and VI but not II and V are selectively inhibited by nitric oxide. Braz J Med Biol Res 35: 145–151, 2002 [DOI] [PubMed] [Google Scholar]
- 11. Hill J, Howlett A, Klein C. Nitric oxide selectively inhibits adenylyl cyclase isoforms 5 and 6. Cell Signal 12: 233–237, 2000 [DOI] [PubMed] [Google Scholar]
- 12. Hoenderop JG, Vaandrager AB, Dijkink L, Smolenski A, Gambaryan S, Lohmann SM, DeJonge HR, Willems PH, Bindels RJ. Atrial natriuretic peptide-stimulated Ca2+ reabsorption in rabbit kidney requires membrane-targeted, cGMP-dependent protein kinase type II. Proc Natl Acad Sci USA 96: 6084–6089, 1999 [DOI] [PMC free article] [PubMed] [Google Scholar]
- 13. Jin L, Beswick RA, Yamamoto T, Palmer T, Taylor TA, Pollock JS, Pollock DM, Webb RC. Increased reactive oxygen species contributes to kidney injury in mineralocorticoid hypertensive rats. J Physiol Pharmacol 57: 343–357, 2006 [PubMed] [Google Scholar]
- 14. Kim YH, Pech V, Spencer KB, Beierwaltes WH, Everett LA, Green ED, Shin WK, Verlander JW, Sutliff RL, Wall SM. Reduced ENaC expression contributes to the lower blood pressure observed in pendrin null mice. Am J Physiol Renal Physiol 293: F1314–F1324, 2007 [DOI] [PubMed] [Google Scholar]
- 15. Knauf F, Yang CL, Thomson RB, Mentone SA, Giebisch G, Aronson PS. Identification of a chloride-formate exchanger expressed on the brush border membrane of renal proximal tubule cells. Proc Natl Acad Sci USA 98: 9425–9430, 2001 [DOI] [PMC free article] [PubMed] [Google Scholar]
- 16. Knepper MA. Urea transport in isolated thick ascending limbs and collecting ducts from rats. Am J Physiol Renal Fluid Electrolyte Physiol 245: F634–F639, 1983 [DOI] [PubMed] [Google Scholar]
- 17. Kusano E, Yoshida I, Takeda S, Homma S, Yusufi ANK, Dousa TP, Asano Y. Nephron distribution of total low Km cyclic AMP phosphodiesterase in mouse, rat and rabbit kidney. Tohoku J Exp Med 193: 207–220, 2001 [DOI] [PubMed] [Google Scholar]
- 18. Liu W, Schreck C, Coleman RA, Wade JB, Henandez Y, Zavilowitz B, Warth R, Kleyman TR, Satlin LM. Role of NKCC in BK channel-mediated net K+ secretion in the CCD. Am J Physiol Renal Physiol 301: F1088–F1097, 2011 [DOI] [PMC free article] [PubMed] [Google Scholar]
- 19. Loffing J, Korbmacher C. Regulated sodium transport in the renal connecting tubule (CNT) via the epithelial sodium channel (ENaC). Pflügers Arch 458: 111–135, 2009 [DOI] [PubMed] [Google Scholar]
- 20. Lopez B, Garcia Salom M, Arregui B, Valero F, Fenoy FJ. Role of superoxide in modulating the renal effects of angiotensin II. Hypertension 42: 1150–1156, 2003 [DOI] [PubMed] [Google Scholar]
- 21. Mattson DL, Meister CJ. Sodium sensitivity of arterial blood pressure in l-NAME hypertensive but not eNOS knockout mice. Am J Hypertens 19: 327–329, 2006 [DOI] [PubMed] [Google Scholar]
- 22. McVey M, Hill J, Howlett A, Klein C. Adenylyl cyclase, a coincidence detector for nitric oxide. J Biol Chem 274: 18887–18892, 1999 [DOI] [PubMed] [Google Scholar]
- 23. Muscella A, Marsigliante S, Verri T, Urso L, Dimitri C, Botta G, Paulmichl M, Beck-Peccoz P, Fugazzola L, Storelli C. PKC-ε-dependent cytosol-to-membrane translocation of pendrin in rat thyroid PC C13 cells. J Cell Physiol 217: 103–112, 2008 [DOI] [PubMed] [Google Scholar]
- 24. Navarro J, Sanchez A, Saiz J, Ruilope LM, Garcia-Estan J, Romero JC, Moncada S, Lahera V. Hormonal, renal and metabolic alterations during hypertension induced by chronic inhibition of NO in rats. Am J Physiol Regul Integr Comp Physiol 267: R1516–R1521, 1994 [DOI] [PubMed] [Google Scholar]
- 25. Nishiyama A, Yao L, Nagai Y, Miyata K, Yoshizumi M, Kagami S, Kondo S, Kiyomoto H, Shokoji T, Kohno M, Abe Y. Possible contributions of reactive oxygen species and mitogen-activated protein kinase to renal injury in aldosterone/salt-induced hypertensive rats. Hypertension 24: 841–848, 2004 [DOI] [PubMed] [Google Scholar]
- 26. Ostrom RS, Bundey RA, Insel PA. Nitric oxide inhibition of adenylyly cyclase type 6 activity is dependent upon lipid rafts and caveolin signaling complexes. J Biol Chem 279: 19846–19853, 2004 [DOI] [PubMed] [Google Scholar]
- 27. Pech V, Hong S, Wall SM. NO reduces chloride absorption in mouse cortical collecting duct (Abstract). J Am Soc Nephrol F-PO1602, 2010 [Google Scholar]
- 28. Pradervand S, Mercier AZ, Centeno G, Bonny O, Firsov D. A comprehensive analysis of gene expression profiles in distal parts of the mouse renal tubule. Pflügers Arch 460: 925–952, 2010 [DOI] [PubMed] [Google Scholar]
- 29. Royaux IE, Wall SM, Karniski LP, Everett LA, Suzuki K, Knepper MA, Green ED. Pendrin, encoded by the pendred syndrome gene, resides in the apical region of renal intercalated cells and mediates bicarbonate secretion. Proc Natl Acad Sci USA 98: 4221–4226, 2001 [DOI] [PMC free article] [PubMed] [Google Scholar]
- 30. Schuster VL, Stokes JB. Chloride transport by the cortical and outer medullary collecting duct. Am J Physiol Renal Fluid Electrolyte Physiol 253: F203–F212, 1987 [DOI] [PubMed] [Google Scholar]
- 31. Siragy HM, de Gasparo M, Carey RM. Angiotensin type 2 receptor mediates valsartan-induced hypotension in conscious rats. Hypertension 35: 1074–1077, 2000 [DOI] [PubMed] [Google Scholar]
- 32. Spirli C, Fabris L, Duner E, Fiorotto R, Ballardini G, Roskams T, Larusso NF, Sonzogni A, Okolicsanyi L, Strazzabosco M. Cytokine-stimulated nitric oxide production inhibits adenylyl cyclase and cAMP-dependent secretion in cholangiocytes. Gastroenterology 124: 737–753, 2003 [DOI] [PubMed] [Google Scholar]
- 33. van Adelsberg JS, Edwards JC, Al-Awqati Q. The apical Cl/HCO3− exchanger of β intercalated cells. J Biol Chem 268: 11283–11289, 1993 [PubMed] [Google Scholar]
- 34. Verlander JW, Hassell KA, Royaux IE, Glapion DM, Wang ME, Everett LA, Green ED, Wall SM. Deoxycorticosterone upregulates Pds (Slc26a4) in mouse kidney: role of pendrin in mineralocorticoid-induced hypertension. Hypertension 42: 356–362, 2003 [DOI] [PubMed] [Google Scholar]
- 35. Verlander JW, Hong S, Pech V, Bailey JL, Agazatian D, Matthews SW, Coffman TM, Le T, Inagami T, Whitehill FM, Weiner ID, Farley DB, Kim YH, Wall SM. Angiotensin II acts through the angiotensin 1a receptor to upregulate pendrin. Am J Physiol Renal Physiol 301: F1314–F1325, 2011 [DOI] [PMC free article] [PubMed] [Google Scholar]
- 36. Viallet PM, Vo-Dinh T. Monitoring intracellular proteins using fluorescence techniques: from protein synthesis and localization to activity. Curr Protein Pept Sci 4: 375–388, 2003 [DOI] [PubMed] [Google Scholar]
- 37. Wall JG, Pluckthun A. Effects of overexpressing folding modulators on the in vivo folding of heterologous proteins in Escherichia coli. Curr Opin Biotechnol 6: 507–516, 1995 [DOI] [PubMed] [Google Scholar]
- 38. Wall SM, Han JS, Chou CL, Knepper MA. Kinetics of urea and water permeabiity activation by vasopressin in rat terminal IMCD. Am J Physiol Renal Fluid Electrolyte Physiol 262: F989–F998, 1992 [DOI] [PubMed] [Google Scholar]
- 39. Wall SM, Hassell KA, Royaux IE, Green ED, Chang JY, Shipley GL, Verlander JW. Localization of pendrin in mouse kidney. Am J Physiol Renal Physiol 284: F229–F241, 2003 [DOI] [PubMed] [Google Scholar]
- 40. Watson EL, Singh JC, Jacobson KL, Ott SM. Nitric oxide inhibition of cAMP synthesis in parotid acini: Role in regulation of type 5/6 adenylyl cyclase. Cell Signal 13: 755–763, 2001 [DOI] [PubMed] [Google Scholar]
- 41. Welch WJ, Blau J, Xie H, Chabrashvilli T, Wilcox CS. Angiotensin-induced defects in renal oxygenation: role of oxidative stress. Am J Physiol Heart Circ Physiol 288: H22–H28, 2005 [DOI] [PubMed] [Google Scholar]
- 42. Wilcox CS. Oxidative stress and nitric oxide deficiency in the kidney: a critical link to hypertension? Am J Physiol Regul Integr Comp Physiol 289: R913–R935, 2005 [DOI] [PubMed] [Google Scholar]
- 43. Yang T, Zhang A, Pasumarthy A, Zhang L, Warnock Z, Schnermann J. Nitric oxide stimulates COX-2 expression in cultured collecting duct cells through MAP kinases and superoxide but not cGMP. Am J Physiol Renal Physiol 291: F891–F895, 2006 [DOI] [PubMed] [Google Scholar]


