Abstract
Telomere length (TL) has been implicated in the pathogenesis of age-related disorders. However, there are no prospective studies directly investigating the role of TL and relevant genes in diabetes development. In the multiethnic Women’s Health Initiative, we identified 1,675 incident diabetes case participants in 6 years of follow-up and 2,382 control participants matched by age, ethnicity, clinical center, time of blood draw, and follow-up duration. Leukocyte TL at baseline was measured using quantitative PCR, and Mendelian randomization analysis was conducted to test whether TL is causally associated with diabetes risk. After adjustment for matching and known diabetes risk factors, odds ratios per 1-kilobase increment were 1.00 (95% CI 0.90–1.11) in whites, 0.95 (0.85–1.06) in blacks, 0.96 (0.79–1.17) in Hispanics, and 0.88 (0.70–1.10) in Asians. Of the 80 single nucleotide polymorphisms (SNPs) in nine genes involved in telomere regulation, 14 SNPs were predictive of TL, but none were significantly associated with diabetes risk. Using ethnicity-specific SNPs as randomization instruments, we observed no statistically significant association between TL and diabetes risk (P = 0.52). Although leukocyte TL was weakly associated with diabetes risk, this association was not independent of known risk factors. These prospective findings indicate limited clinical utility of TL in diabetes risk stratification among postmenopausal women.
Capping both ends of a chromosome, telomeres are DNA-protein complexes fundamental to the maintenance of genome integrity and stability (1,2). Because the gradual loss of telomeric DNA in dividing somatic cells contributes to senescence, apoptosis, and neoplastic transformation (3), telomere length (TL) may serve as an important biomarker for cell aging (4). Individual variation in TL is large with strong correlations across different tissues, indicating that both TL at birth and the rate of TL shortening may be genetically determined (5,6). Emerging data indicate that telomere shortening may contribute to the pathogenesis of several age-dependent complex disorders. In several cross-sectional studies, various measures of TL have been linked to diabetes risk (7–9) and insulin resistance (7,10–13). However, there are as yet no prospective studies directly examining the predictive role of TL and relevant candidate genes in the development of clinical diabetes. Thus, we conducted a case-control study of postmenopausal women nested in the multiethnic Women’s Health Initiative Observational Study Cohort (WHI-OS). We also evaluated whether single nucleotide polymorphisms (SNPs) in nine candidate genes coding for telomere binding proteins and telomerase may explain the individual variability in TL and clinical diabetes risk. To provide further evidence minimizing residual confounding and reverse causation that could explain the association between TL and diabetes risk, we used a Mendelian randomization analysis using TL-related polymorphisms as instruments (14).
RESEARCH DESIGN AND METHODS
Study participants.
Details regarding our study design have been described elsewhere (15–17). In brief, of the 93,676 postmenopausal women enrolled in the WHI-OS (18), 82,069 had no prior history of cardiovascular disease and/or diabetes at baseline. During a follow-up of 6 years, 1,675 incident diabetes case participants were identified among 82,069 WHI-OS participants without apparent cardiovascular disease and/or diabetes at baseline (15). A total of 1,675 incident diabetes case participants were individually matched with 2,382 control participants on age (±2.5 years), ethnicity, clinical center, time of blood draw (±0.10 h), and length of follow-up. This study included whites (n = 2,035), blacks (n = 1,219), Hispanics (n = 493), and Asians/Pacific Islanders (n = 308). All study participants provided informed consent prior to study enrollment in the Women’s Health Initiative. The Institutional Review Board at UCLA approved the current study.
Assays for leukocyte TL.
We adapted a quantitative PCR method originally proposed by O’Callaghan et al. (19) using an Applied Biosystems high-throughput 7900HT PCR System (Life Technologies Corporation, Carlsbad, CA). This method has the advantage of measuring TL in kilobases (kb) by incorporating standard oligonucleotides of known lengths. In short, 10 ng of buffy coat–derived genomic DNA was dried in a 384-well plate and then resuspended in 10 μL of either the telomere (TEL) or single-copy-gene (36B4) PCR reaction mixture. The TEL reaction mixture consisted of 1× Faststart Universal SYBR Green Master Mix (Roche Applied Science, Indianapolis, IN), 200 nmol/L telomere forward primer (CGGTTTGTTTGGGTTTGGGTTTGGGTTTGGGTTTGGGTT), and 200 nmol/L telomere reverse primer (GGCTTGCCTTACCCTTACCCTTACCCTTACCCTTACCCT). The 36B4 reaction consisted of 1× Roche Faststart Universal SYBR Green Master Mix, 200 nM 36B4U primer (CAGCAAGTGGGAAGGTGTAATCC), and 200 nM 36B4D primer (CCCATTCTATCATCAACGGGTACAA). Both reactions proceeded for 10 min at 95°C, followed by 40 cycles at 95°C for 15 s and at 56°C for 1 min. The standard curve of TEL contained 30 pg of the TTAGGG repeat 84-oligomer oligonucleotide at serial dilutions of 10−1 to 10−6. The number of repeats in each standard was calculated as follows: 30 pg 84-oligomer TEL standard = (30 × 10−12 g) ÷ (26,667.2[MW]/6.02 × 1023[Avogadro’s number]) × 84 ÷ 1,000 = 5.69 × 10⁷ kb of telomere sequence in the 1× telomere standard. The standard curve of 36B4 contained 100 pg of the 36B4 75-oligomer oligonucleotide at a serial dilution of 10−1 to 10−6. The number of repeats in each standard was calculated as follows: 100 pg 36B4 75-oligomer standard = (100 × 10−12 g) ÷ (23,268.1[MW]/6.02 × 1023[Avogadro’s number]) ÷ 2 = 1.29 × 10⁹ diploid genome copies in the 1× (100 pg) 36B4 standard. Carrier RNA (Qiagen, Inc., Valencia, CA) was added to each standard to maintain a constant 10 ng of total DNA per reaction. Average TL per chromosome was calculated using the following formula: (TL ÷ copies of diploid genome) ÷ 46. All samples for TEL and 36B4 reactions, as well as standard curves, were performed in duplicate on the same plates. As part of routine quality control, 10% of the samples were blind duplicate samples. The overall intraplate coefficient of variation was 0.8%, and the interplate coefficients of variation of the telomere and 36B4 assays were 5.7 and 3.4%, respectively.
SNP genotyping.
We identified genes coding for proteins involved in telomere regulation, including those directly associated with telomere structure (TRF1, TRF2, POT1, RAP1, TIN2, and TPP1) and those involved in TL maintenance (TERT, TERC, and TEP1). As described in details previously (20,21), we chose haplotype-tagging SNPs (tSNPs) using the National Center for Biotechnology Information database SNP supplemented by the HapMap database (22) to capture the majority of common variation in the genetic region covering 30 kb upstream and 30 kb downstream of each telomere-related gene. The initial set of SNPs was selected based on the following criteria: 1) functional priority (nonsynonymous SNPs > splice site SNPs > synonymous SNPs > 5′ untranslated region SNPs > 3′ untranslated region SNPs > intronic SNPs); 2) minor allele frequency ≥5% in at least one ethnic group; and 3) tSNPs evenly spaced across the gene region (23). In total, we selected 82 SNPs in 9 gene regions for genotyping. Additionally, we included rs2487999 (OBFC1), which was associated with leukocyte TL in a recent genome-wide association study of leukocyte TL (24). For these 82 SNPs, genotyping was performed in all samples using TaqMan SNP genotyping assays. Specific primers and probes were custom designed by Applied Biosystems. All samples were genotyped using the 96.96 Dynamic Array on the Biomark system (Fluidigm, San Francisco, CA) according to standard procedures. Two SNPs, rs4092743 of TRF1 and rs11556639 of RAP1 (selected because they were tSNPs with nonsynonymous variation), were not polymorphic in our samples and were therefore excluded in the final analysis. The average undetermined genotype rate was <0.5%, and the concordance rate was >99% in the duplicate samples.
Statistical analysis.
TLs in our samples approximated a normal distribution. We thus conducted analysis with the TL variable treated as either continuous or categorical (quartiles). The distributions of diabetes risk factors were examined by case-control status across race/ethnicity. Generalized linear models (GLMs) were used to conduct tests for trend of continuous variables. Unconditional logistic models were used to test for trend across quartiles of TL. Differences in mean TL (kb) according to ethnic groups and case-control status were examined using GLMs. To account for the correlation within matched case-control sets, we used mixed-effects regression modeling case-control clusters as a random effect.
To examine the prospective association between TL and clinical diabetes risk, conditional logistic regression was used to estimate the odds ratio (OR) and 95% CI for clinical diabetes in each TL quartile using the lowest quartile as the reference category. To test for log-linear trends, we modeled the median TL within each quartile as a continuous variable. Finally, we estimated the OR of developing diabetes risk per 1-kb increase in TL in each race/ethnic group. Our base model used conditional logistic regression to account for matching factors (age, ethnicity, clinical center, duration of follow-up, and time of blood draw). In the full model, we further adjusted for potential confounders, including BMI (modeled as a continuous covariate), smoking (never, past, and current smokers), alcohol intake (never, past, and current drinkers), physical activity (quintiles), and current postmenopausal hormone use (yes or no).
To determine the associations between genetic variants and TLs, we calculated the mean differences of leukocyte TL according to SNP genotypes by fitting GLMs, treating TL as a dependent variable and SNPs as independent variables. The additive inheritance model was used in the single SNP analysis, resulting in the mean change in TL per each additional copy of the minor allele. Conditional logistic regression models were used to estimate the OR for diabetes risk associated with each additional copy of the minor allele for each SNP. Multivariable models were adjusted for matching factors (age, clinical center, time of blood draw, duration of follow-up, and ethnicity) and other potential confounders, including BMI, physical activity, current postmenopausal hormone use, alcohol consumption, and cigarette smoking. To account for potential false positives due to multiple comparisons, we calculated the false discovery rate by incorporating all P values from multiple tests performed for SNPs in the GLM analysis (25). The PROC MULTTEST procedure in SAS 9.2 was used to obtain the multiple testing-adjusted P values.
To further evaluate whether the association between TL and risk of clinical diabetes was causal, we conducted instrumental variable analyses using genetic instruments (i.e., Mendelian randomization analysis) (14,26). As described previously (14), SNPs had to satisfy three classical assumptions in order to be considered for use as instrumental variables: 1) robustly associated with TL, 2) independent of diabetes factors, and 3) affected diabetes only through their effects on TL. Instrumental variables were selected separately for each racial/ethnic group to account for potential allelic heterogeneity. In total, we selected six instruments for whites (rs34368910, rs4888444, rs4975605, rs938886, rs2228041, and rs12880583), four for blacks (rs872072, rs938886, rs1713458, and rs4387287), seven for Hispanics (rs35276863, rs729421, rs11972248, rs4635969, rs2853669, rs2736098, and rs2853676), and two for Asians (rs11556640 and rs2297613). The predicted OR of diabetes per kb increase in TL was estimated from the joint contributions of the ethnicity-specific instrumental variables. We subsequently pooled the ethnicity-specific OR via a random-effects model. All other analyses were performed with SAS software, version 9.2 (SAS Institute, Cary, NC).
RESULTS
Baseline characteristics according to diabetes case status.
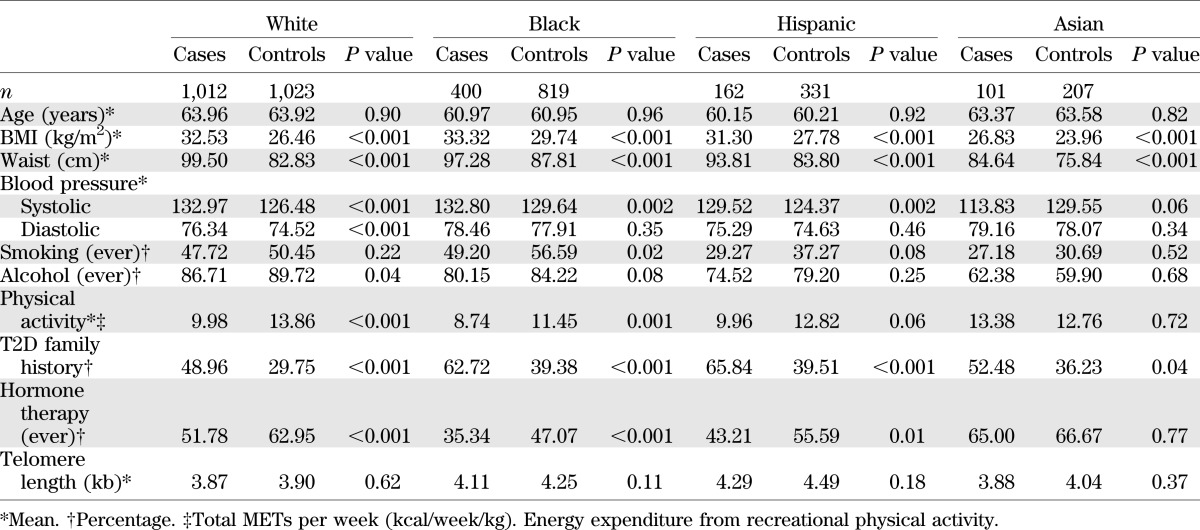
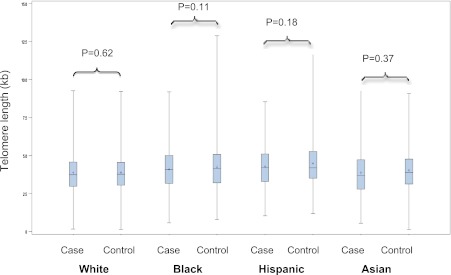
The mean TL was 3.97 kb (SD = 1.37 kb) among diabetic case participants and 4.12 kb (SD = 1.40 kb) among control participants who remained free of the disease. As expected, case participants generally had higher BMI, larger waist circumference, higher systolic blood pressure, higher percentage of current or former smokers, less physical activity, higher proportion with a family history of diabetes, and lower proportion with past use of hormone therapy (Table 1). Mean TL also varied across ethnic groups in both case participants and control participants (Fig. 1). Within each ethnic group, diabetes case participants appeared to have consistently shorter baseline TL (30–200 base pairs [bp]) than control participants, but this difference was modest. Black and Hispanic participants had relatively longer TLs compared with whites and Asians, even after adjusting for age.
TABLE 1.
Baseline characteristics according to race/ethnicity and diabetes case-control status in 4,057 postmenopausal women
FIG. 1.
TL (kb) by clinical diabetes status and race/ethnicity. The boxplots show the mean (+), median, and interquartile range. The vertical line indicates the minimum and maximum value of TL in each group. (A high-quality color representation of this figure is available in the online issue.)
Baseline characteristics according to TL quartiles.
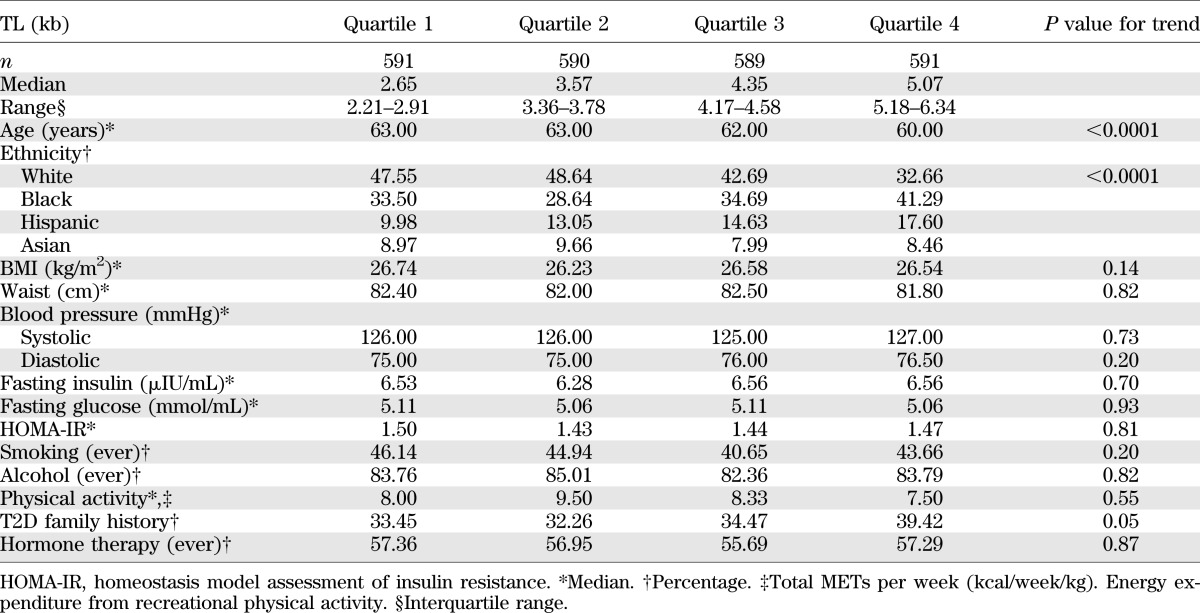
Table 2 shows the distribution of diabetes-related characteristics by TL quartiles in controls. As expected, there were significant TL differences by age in that older women had shorter TLs than their younger counterparts (P < 0.0001 for linear trend). TLs also appeared to differ by ethnicity but not by other traditional diabetes risk factors such as BMI, waist circumference, fasting glucose, fasting insulin, homeostasis model assessment of insulin resistance, alcohol, smoking, hormone therapy, or physical activity level.
TABLE 2.
Baseline characteristics according to leukocyte TL among 2,382 (control participants) postmenopausal women
Prospective association between TL and clinical diabetes risk.
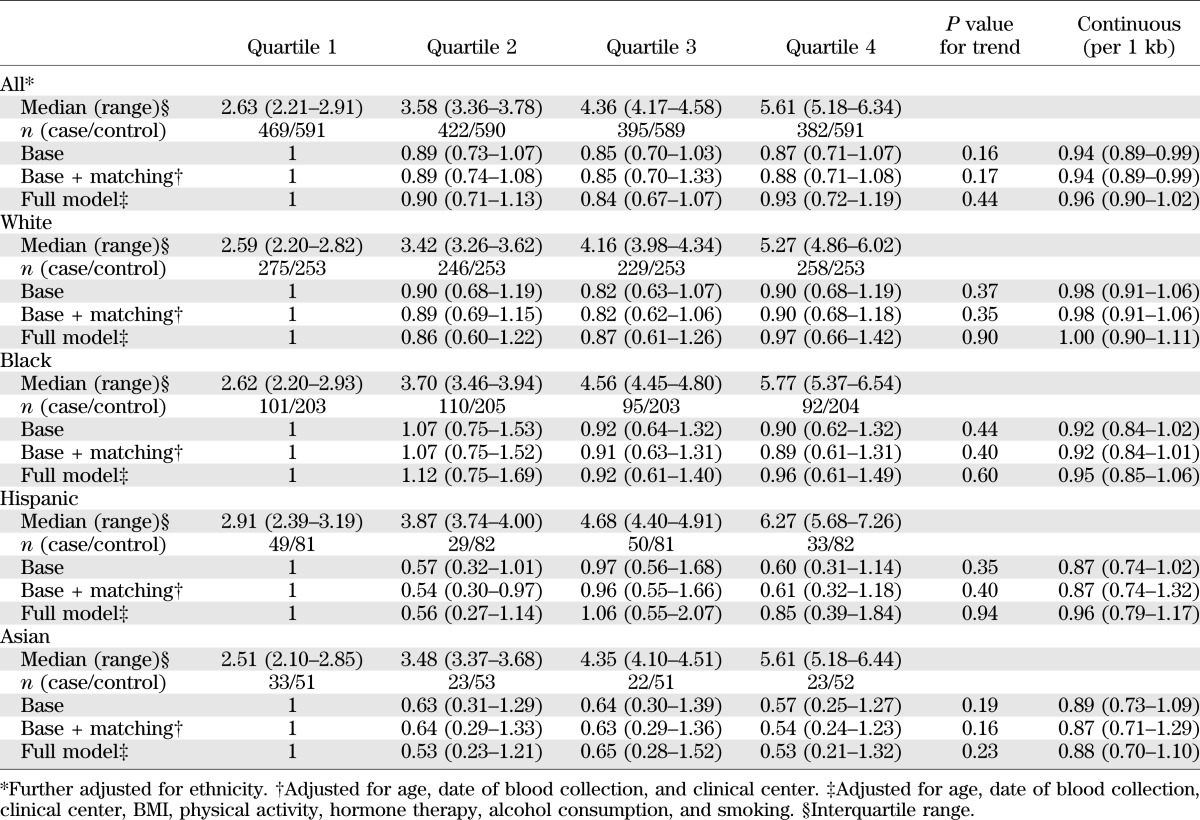
In pooled analysis combining samples from all ethnicities assuming a linear relation (Table 3), every 1-kb increase in the TL was associated with a decreased risk of clinical diabetes (OR 0.94 [95% CI 0.89–0.99]) after adjusting for matching variables (age, ethnicity, date of blood collection, duration of follow-up, and clinical center). The relation between TL and diabetes risk was attenuated in multivariable analysis after further adjustment for known diabetes risk factors. Moreover, there was no significant relation between TL and diabetes in stratified analysis by race/ethnicity. ORs for diabetes risk (95% CI) per 1-kb increment in TL were 1.00 (0.90–1.11) in whites, 0.95 (0.85–1.06) in blacks, 0.96 (0.79–1.17) in Hispanics, and 0.88 (0.70–1.10) in Asians.
TABLE 3.
Adjusted OR (95% CI) of diabetes risk according to leukocyte TL in 4,057 postmenopausal women
Associations between SNPs, TL, and risk of clinical diabetes.
Of the 80 SNPs genotyped, 29 SNPs were associated with leukocyte TL levels in pooled samples combining all ethnic groups (Supplementary Table 1). For 16 of 29 SNPs, each additional copy of the minor allele was associated with decreased TL (the mean per-allele decrease ranged from 0.07 to 0.33 kb; all P < 0.05). Eight SNPs (rs2981084, rs2975852, rs6979, rs1865493, rs1760904, rs1760897, rs1713458, and rs3772190) remained significantly associated with decreased TL after accounting for multiple comparisons. In contrast, the minor alleles of the remaining 13 SNPs were associated with increased TL, with the mean per-allele increase ranging from 0.07 to 2.04 kb (all P < 0.05). Six SNPs (rs34368910, rs10244817, rs938886, rs1288583, rs17111188, and rs4387287) remained significantly associated with increased TL. The minor allele frequencies of the SNPs that were associated with TLs also appeared to vary by ethnicity. However, no significant associations were observed between these 29 SNPs and the risk of developing clinical diabetes, except rs4387287 on OBFC1 (OR 0.88 [95% CI 0.78–1.00]) (Supplementary Table 2).
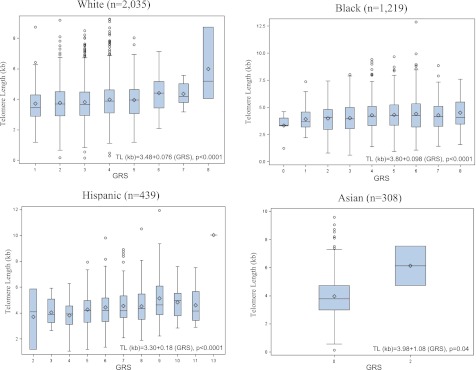
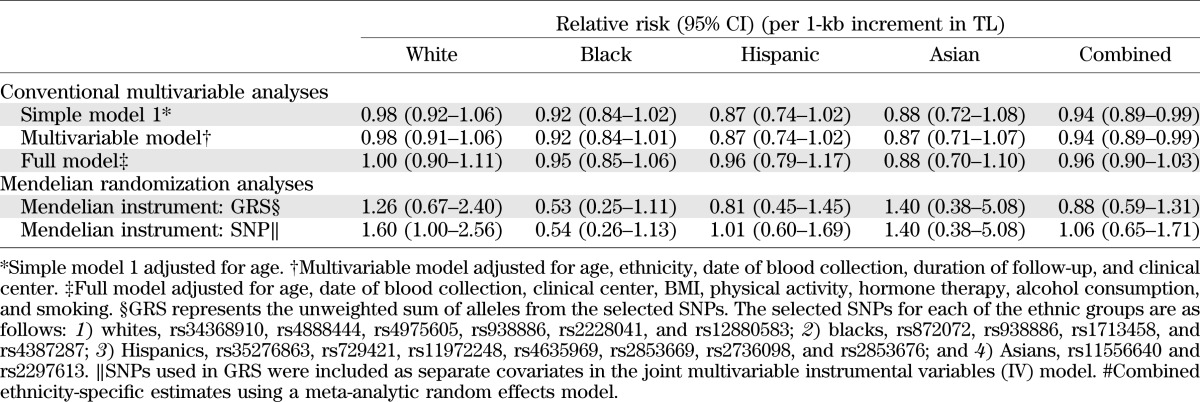
Genomic risk score (GRS) based on SNPs identified was directly associated with TL, indicating a strong instrument (Fig. 2). Genetic instruments were selected independently across each ethnic group. The pooled results from the ethnicity-specific Mendelian randomization analysis did not support a causal role of TL in the development of clinical diabetes, using either multiple instruments in a joint model (P = 0.82) or as a GRS (P = 0.52) (Table 4).
FIG. 2.
TL by GRS according to race/ethnicity. The boxplots show the mean (◇), median, and interquartile range. The vertical line indicates the minimum and maximum value >1.5 times the upper quartile of TL in each group. Outliers (○) are displayed when the individual TL is >1.5 times the interquartile range of the upper quartile value. GRS represents the unweighted sum of alleles from the selected SNPs. The selected SNPs for each of the ethnic groups are as follows: 1) whites, rs34368910, rs4888444, rs4975605, rs938886, and rs12880583; 2) blacks, rs872072, rs938886, rs1713458, and rs4387287; 3) Hispanics, rs35276863, rs729421, rs11972248, rs4635969, rs2853669, rs2736098, and rs2853676; and 4) Asians, rs11556640 and rs2297613. (A high-quality color representation of this figure is available in the online issue.)
TABLE 4.
Evaluation of potential casual relation between TL and diabetes risk via Mendelian randomization analysis in 4,057 postmenopausal women
DISCUSSION
In this large multiethnic cohort of postmenopausal women followed for an average of 6 years, leukocyte TL was modestly associated with risk of clinical diabetes. However, the modest association between TL and diabetes risk could be explained by traditional diabetes risk factors. Mendelian randomization analysis showed no significant association between genetically elevated TL levels and risk of clinical diabetes.
To date, six proteins, including telomeric repeat binding factor 1 and 2 (TRF1 and TRF2), human TRF2-interacting telomeric protein (hRap1), TRF1-interacting nuclear factor 2 (TIN2), TIN2- and POT1-organizing protein (TPP1), and protection of telomeres 1 (POT1), have been identified, forming the so-called shelterin complex, a constitutive component of telomeres (27). Mutations in these telomere-regulating proteins may disrupt telomere structure, leading to chromosome instability (28). Previous studies have identified the crucial role of TRF2 in protecting chromosomal ends in that TRF1 appears to serve as a negative regulator of TL (29,30). In addition, POT1 is known to bind specifically to telomeric overhangs and regulates the access of telomerase to the repeats that affect telomerase activity (31–34). Thus, POT1 is thought to be the major regulator of TL (35,36). More recently, TPP1, a newly identified telomeric protein, was identified as a regulator of POT1 for telomeric targeting (36). However, the exact mechanistic functions by which these proteins interact in telomere homeostasis remain unknown, though mutually reinforcing mechanisms seem likely to involve both telomere-associated proteins and telomerase activity (37). In a meta-analysis of genome-wide association studies (24), the region containing OBFC1 (rs4387287) was identified to show significant associations with leukocyte TL, which was confirmed by a subsequent study that also identified TERC (rs3772190) to be significantly associated with TL (38). Consistent with these previous reports, we observed that each copy of the A allele (rs4387287 in OBFC1) was associated with a TL increment of 0.08 kb. Further, we found that each additional copy of the T allele for rs3772190 (TERC) was associated with a 0.09-kb decrease in TL. Despite ethnic differences, several common genetic variants in the telomere and telomerase regulating proteins were robustly associated with TL. However, these SNPs were not associated with risk of clinical diabetes in these women.
Findings from previous studies directly relating TL to diabetes risk have been mixed and limited by their cross-sectional design. In a study of 74 patients with type 2 diabetes, Jeanclos et al. (39) found that age-adjusted leukocyte TLs were not significantly different from age-matched nondiabetic controls (P = 0.1). In contrast, five other cross-sectional studies (7–9,40,41) reported that diabetes case participants had shorter TLs than control participants. Notably, telomere shortening is accelerated in human premature-aging syndromes (i.e., Werner syndrome, ataxia telangiectasia, and dyskeratosiscongenita) (37) and positively associated with mitochondrial DNA content (41). It is estimated that humans on average lose 20–60 bp of telomere DNA per year (5,42,43). However, such estimates for rates of shortening are not precise as they were not done prospectively but rather in cross-sectional studies where TLs were simply compared in different age-groups. For example, among 383 adults (291 men and 92 women) from 173 families comprising 258 sibling pairs, Vasa-Nicotera et al. (4) found a mean TL shortening of 29.9 ± 5.6 bp per year in men and 16.8 ± 9.9 bp per year in women (mean age, 65.8 ± 6.4 years; range, 47–82 years). In this prospective cohort, we observed an average TL decrease of 24.6 ± 4.25 bp per year. However, there were no statistically significant differences in TL between case participants and control participants after adjustment of traditional risk factors. One possible limitation may be that the follow-up time was not long enough to detect a potential inverse relation between TL and diabetes risk. As such, we cannot completely exclude the possibility that the magnitude of effects on diabetes risk due to TL, if any, may be greater if more case participants were identified during a longer period of follow-up.
Nevertheless, to further examine whether any modest TL-diabetes association previously observed was due to residual confounding and/or reverse causation, we used genetic variants that were associated with changes in TL and tested whether the effect of TL on diabetes risk is causal. Previous simulation work has shown that combining multiple genetic variants into a single instrument can improve the strength and power of the instrument (44). Thus, we assessed both allele counts (GRS) and multiple variables as separate covariates in the same regression model as instruments in the Mendelian randomization analysis. However, our instrumental analysis did not detect any significant association between genetically determined TLs and diabetes risk.
In summary, although baseline leukocyte TL was weakly associated with diabetes risk in this large multiethnic cohort of postmenopausal women followed for 6 years, this association was not independent of known risk factors. These prospective data do not support the utility of TL in risk stratification for clinical diabetes among postmenopausal women.
ACKNOWLEDGMENTS
The Women’s Health Initiative program is funded by the National Heart, Lung, and Blood Institute, National Institutes of Health, U.S. Department of Health and Human Services, through contracts N01-WH-22110, -24152, -32100-2, -32105-6, -32108-9, -32111-13, -32115, -32118, -32119, -32122, -42107-26, -42129-32, and -44221. This ancillary study was supported by a grant from the National Institute of Diabetes and Digestive and Kidney Diseases (R21-DK-084452).
No potential conflicts of interest relevant to this article were reported.
N.-c.Y.Y. and S.L. wrote the manuscript and analyzed research data. B.H.C., Y.S., X.L., and Y.C. analyzed research data. J.E.M., M.K., B.V.H., K.L.M., J.D.C., L.S.P., M.L.S., and L.F.T. contributed to discussion and reviewed and edited the manuscript. N.-c.Y.Y. and S.L. are the guarantors of this work and, as such, had full access to all the data in the study and take responsibility for the integrity of the data and the accuracy of the data analysis.
The authors thank the staff and investigators from all WHI centers as well as WHI participants; without their effort, this study would not be possible.
Footnotes
This article contains Supplementary Data online at http://diabetes.diabetesjournals.org/lookup/suppl/doi:10.2337/db12-0241/-/DC1.
REFERENCES
- 1.von Zglinicki T. Role of oxidative stress in telomere length regulation and replicative senescence. Ann N Y Acad Sci 2000;908:99–110 [DOI] [PubMed] [Google Scholar]
- 2.von Zglinicki T. Oxidative stress shortens telomeres. Trends Biochem Sci 2002;27:339–344 [DOI] [PubMed] [Google Scholar]
- 3.Cawthon RM, Smith KR, O’Brien E, Sivatchenko A, Kerber RA. Association between telomere length in blood and mortality in people aged 60 years or older. Lancet 2003;361:393–395 [DOI] [PubMed] [Google Scholar]
- 4.Vasa-Nicotera M, Brouilette S, Mangino M, et al. Mapping of a major locus that determines telomere length in humans. Am J Hum Genet 2005;76:147–151 [DOI] [PMC free article] [PubMed] [Google Scholar]
- 5.Takubo K, Izumiyama-Shimomura N, Honma N, et al. Telomere lengths are characteristic in each human individual. Exp Gerontol 2002;37:523–531 [DOI] [PubMed] [Google Scholar]
- 6.Slagboom PE, Droog S, Boomsma DI. Genetic determination of telomere size in humans: a twin study of three age groups. Am J Hum Genet 1994;55:876–882 [PMC free article] [PubMed] [Google Scholar]
- 7.Adaikalakoteswari A, Balasubramanyam M, Mohan V. Telomere shortening occurs in Asian Indian type 2 diabetic patients. Diabet Med 2005;22:1151–1156 [DOI] [PubMed] [Google Scholar]
- 8.Sampson MJ, Winterbone MS, Hughes JC, Dozio N, Hughes DA. Monocyte telomere shortening and oxidative DNA damage in type 2 diabetes. Diabetes Care 2006;29:283–289 [DOI] [PubMed] [Google Scholar]
- 9.Fitzpatrick AL, Kronmal RA, Gardner JP, et al. Leukocyte telomere length and cardiovascular disease in the cardiovascular health study. Am J Epidemiol 2007;165:14–21 [DOI] [PubMed] [Google Scholar]
- 10.Demissie S, Levy D, Benjamin EJ, et al. Insulin resistance, oxidative stress, hypertension, and leukocyte telomere length in men from the Framingham Heart Study. Aging Cell 2006;5:325–330 [DOI] [PubMed] [Google Scholar]
- 11.Nakajima T, Moriguchi M, Katagishi T, et al. Premature telomere shortening and impaired regenerative response in hepatocytes of individuals with NAFLD. Liver Int 2006;26:23–31 [DOI] [PubMed] [Google Scholar]
- 12.Aviv A, Valdes A, Gardner JP, Swaminathan R, Kimura M, Spector TD. Menopause modifies the association of leukocyte telomere length with insulin resistance and inflammation. J Clin Endocrinol Metab 2006;91:635–640 [DOI] [PubMed] [Google Scholar]
- 13.Gardner JP, Li S, Srinivasan SR, et al. Rise in insulin resistance is associated with escalated telomere attrition. Circulation 2005;111:2171–2177 [DOI] [PubMed] [Google Scholar]
- 14.Ding EL, Song Y, Manson JE, et al. Sex hormone-binding globulin and risk of type 2 diabetes in women and men. N Engl J Med 2009;361:1152–1163 [DOI] [PMC free article] [PubMed] [Google Scholar]
- 15.Liu S, Tinker L, Song Y, et al. A prospective study of inflammatory cytokines and diabetes mellitus in a multiethnic cohort of postmenopausal women. Arch Intern Med 2007;167:1676–1685 [DOI] [PubMed] [Google Scholar]
- 16.Song Y, Manson JE, Tinker L, et al. Insulin sensitivity and insulin secretion determined by homeostasis model assessment and risk of diabetes in a multiethnic cohort of women: the Women’s Health Initiative Observational Study. Diabetes Care 2007;30:1747–1752 [DOI] [PMC free article] [PubMed] [Google Scholar]
- 17.Song Y, Manson JE, Tinker L, et al. Circulating levels of endothelial adhesion molecules and risk of diabetes in an ethnically diverse cohort of women. Diabetes 2007;56:1898–1904 [DOI] [PMC free article] [PubMed] [Google Scholar]
- 18.The Women’s Health Initiative Study Group Design of the Women’s Health Initiative clinical trial and observational study. Control Clin Trials 1998;19:61–109 [DOI] [PubMed] [Google Scholar]
- 19.O’Callaghan N, Dhillon V, Thomas P, Fenech M. A quantitative real-time PCR method for absolute telomere length. Biotechniques 2008;44:807–809 [DOI] [PubMed] [Google Scholar]
- 20.Hao K, Liu S, Niu T. A sparse marker extension tree algorithm for selecting the best set of haplotype tagging single nucleotide polymorphisms. Genet Epidemiol 2005;29:336–352 [DOI] [PMC free article] [PubMed] [Google Scholar]
- 21.Lee CC, You NC, Song Y, et al. Relation of genetic variation in the gene coding for C-reactive protein with its plasma protein concentrations: findings from the Women’s Health Initiative Observational Cohort. Clin Chem 2009;55:351–360 [DOI] [PMC free article] [PubMed] [Google Scholar]
- 22.International HapMap Consortium A haplotype map of the human genome. Nature 2005;437:1299–1320 [DOI] [PMC free article] [PubMed] [Google Scholar]
- 23.Wang L, Liu S, Niu T, Xu X. SNPHunter: a bioinformatic software for single nucleotide polymorphism data acquisition and management. BMC Bioinformatics 2005;6:60. [DOI] [PMC free article] [PubMed] [Google Scholar]
- 24.Levy D, Neuhausen SL, Hunt SC, et al. Genome-wide association identifies OBFC1 as a locus involved in human leukocyte telomere biology. Proc Natl Acad Sci USA 2010;107:9293–9298 [DOI] [PMC free article] [PubMed] [Google Scholar]
- 25.Benjamini Y, Drai D, Elmer G, Kafkafi N, Golani I. Controlling the false discovery rate in behavior genetics research. Behav Brain Res 2001;125:279–284 [DOI] [PubMed] [Google Scholar]
- 26.Thomas DC, Conti DV. Commentary: the concept of “Mendelian Randomization”. Int J Epidemiol 2004;33:21–25 [DOI] [PubMed] [Google Scholar]
- 27.de Lange T. Shelterin: the protein complex that shapes and safeguards human telomeres. Genes Dev 2005;19:2100–2110 [DOI] [PubMed] [Google Scholar]
- 28.Wu X, Zhao H, Suk R, Christiani DC. Genetic susceptibility to tobacco-related cancer. Oncogene 2004;23:6500–6523 [DOI] [PubMed] [Google Scholar]
- 29.van Steensel B, de Lange T. Control of telomere length by the human telomeric protein TRF1. Nature 1997;385:740–743 [DOI] [PubMed] [Google Scholar]
- 30.van Steensel B, Smogorzewska A, de Lange T. TRF2 protects human telomeres from end-to-end fusions. Cell 1998;92:401–413 [DOI] [PubMed] [Google Scholar]
- 31.Lei M, Podell ER, Cech TR. Structure of human POT1 bound to telomeric single-stranded DNA provides a model for chromosome end-protection. Nat Struct Mol Biol 2004;11:1223–1229 [DOI] [PubMed] [Google Scholar]
- 32.Colgin LM, Baran K, Baumann P, Cech TR, Reddel RR. Human POT1 facilitates telomere elongation by telomerase. Curr Biol 2003;13:942–946 [DOI] [PubMed] [Google Scholar]
- 33.Kelleher C, Kurth I, Lingner J. Human protection of telomeres 1 (POT1) is a negative regulator of telomerase activity in vitro. Mol Cell Biol 2005;25:808–818 [DOI] [PMC free article] [PubMed] [Google Scholar]
- 34.Loayza D, De Lange T. POT1 as a terminal transducer of TRF1 telomere length control. Nature 2003;423:1013–1018 [DOI] [PubMed] [Google Scholar]
- 35.O’Connor MS, Safari A, Xin H, Liu D, Songyang Z. A critical role for TPP1 and TIN2 interaction in high-order telomeric complex assembly. Proc Natl Acad Sci USA 2006;103:11874–11879 [DOI] [PMC free article] [PubMed] [Google Scholar]
- 36.Liu D, Safari A, O’Connor MS, et al. PTOP interacts with POT1 and regulates its localization to telomeres. Nat Cell Biol 2004;6:673–680 [DOI] [PubMed] [Google Scholar]
- 37.Serrano AL, Andrés V. Telomeres and cardiovascular disease: does size matter? Circ Res 2004;94:575–584 [DOI] [PubMed] [Google Scholar]
- 38.Codd V, Mangino M, van der Harst P, et al. Wellcome Trust Case Control Consortium Common variants near TERC are associated with mean telomere length. Nat Genet 2010;42:197–199 [DOI] [PMC free article] [PubMed] [Google Scholar]
- 39.Jeanclos E, Krolewski A, Skurnick J, et al. Shortened telomere length in white blood cells of patients with IDDM. Diabetes 1998;47:482–486 [DOI] [PubMed] [Google Scholar]
- 40.Shen Q, Zhao X, Yu L, et al. Association of leukocyte telomere length with type 2 diabetes in mainland chinese populations. J Clin Endocrinol Metab 2012;97:1371–1374 [DOI] [PubMed] [Google Scholar]
- 41.Monickaraj F, Aravind S, Gokulakrishnan K, et al. Accelerated aging as evidenced by increased telomere shortening and mitochondrial DNA depletion in patients with type 2 diabetes. Mol Cell Biochem 13 March 2012 [Epub ahead of print] [DOI] [PubMed]
- 42.Allsopp RC, Vaziri H, Patterson C, et al. Telomere length predicts replicative capacity of human fibroblasts. Proc Natl Acad Sci USA 1992;89:10114–10118 [DOI] [PMC free article] [PubMed] [Google Scholar]
- 43.Harley CB, Futcher AB, Greider CW. Telomeres shorten during ageing of human fibroblasts. Nature 1990;345:458–460 [DOI] [PubMed] [Google Scholar]
- 44.Pierce BL, Ahsan H, Vanderweele TJ. Power and instrument strength requirements for Mendelian randomization studies using multiple genetic variants. Int J Epidemiol 2011;40:740–752 [DOI] [PMC free article] [PubMed] [Google Scholar]


