

Abstract
Alzheimer’s disease (AD) is a neurodegenerative aging disorder characterized by extracellular Aβ plaques and intraneuronal neurofibrillary tangles. We conducted longitudinal studies to examine the effects of Aβ on brain amino acid metabolism in lentiviral Aβ1-42 gene transfer animals and transgenic AD mice. We also performed lentiviral parkin gene delivery to determine the effects of Aβ clearance in AD models. Aβ1-42 activated mTOR signaling, and increased 4E-BP phosphorylation. Aβ1-42 increased the synthesis of glutamate and aspartate, but not glutamine, leucine and isoleucine, but an increase in leucine and isoleucine levels was concurrent with diminution of neurotransmitters. Additionally, Aβ1-42 attenuated mitochondrial TCA cycle activity and decreased synthesis of its by-products. Glutamate levels increased prior to lactate accumulation, suggesting oxidative stress. Importantly, parkin reversed the effects of Aβ1-42 on amino acid levels, prevented TCA cycle impairment and protected against glutamate toxicity. Cortical atrophy was observed in aged 3xTg-AD mice, while parkin expression was associated with reduced atrophy. Similarly, Aβ1-42 resulted in significant cell loss, pronounced astrogliosis and cortical atrophy and parkin reduced astrogliosis and reversed Aβ1-42 effects on cell loss and cortical atrophy. Taken together these data suggest that parkin prevents amyloid-induced alteration of brain metabolism and may be used as a therapeutic target to limit neuronal loss in AD.
Keywords: Amyloid, brain metabolism, amino acids, mitochondria, atrophy, parkin
Introduction
Alzheimer’s disease (AD) pathology is characterized by deposition of intraneuronal hyper-phosphorylated Tau and extracellular β-amyloid (Aβ plaques (Hardy and Selkoe, 2002). Cleavage of amyloid precursor protein (APP) by the β-site APP cleaving enzyme (BACE1) near the C-terminus results in the formation of APP C-terminal fragment (CTFβ) C99. Subsequent cleavage of CTFβ by γ-secretase generates Aβ40 or Aβ42 (Jarrett et al., 1993), which are produced intracellularly (Cook et al., 1997, Xu et al., 1997, Lee et al., 1998, Skovronsky et al., 1998, Greenfield et al., 1999) and deposited in amyloid plaques in AD brains (Wilson et al., 1999, Gouras et al., 2000). Accumulation of intracellular Aβ contributes to deposition of extracellular plaques (Gouras et al., 2000, D’Andrea et al., 2001). Intracellular Aβ plays an important role in AD pathogenesis (Cataldo et al., 1997) as accumulation of intraneuronal Aβ precedes the onset of cognitive symptoms (Cataldo et al., 2000). Parkin is a ubiquitin E3 ligase involved in proteasomal degradation of misfolded proteins (Shimura et al., 2000). Mutations in Park-2 gene result in loss of parkin function and are associated with autosomal-recessive juvenile onset Parkinson’s Disease (ARJPD) (Kitada et al., 1998, Lucking et al., 2000). The most reproducible function of parkin is its pan-protective activity in proteasomal degradation and defense against mitochondrial insults and oxidative stress (Shimura et al., 2000). Parkin ubiquitinates intracellular Aβ1-42 and stimulates its removal via the proteasome or the autophagy-lysosome system (Burns et al., 2009, Rosen et al., 2010, Khandelwal et al., 2011b).
Kinase signaling via the mammalian target of rapamycin (mTOR) regulates mRNA translation through phosphorylation of downstream kinases such as eukaryotic initiation factor 4E (eIF-4E) binding protein (4E-BP) and p70S6k (Shima et al., 1998, Gingras et al., 2001, Grolleau et al., 2002, Mamane et al., 2004). mTOR promotes the phosphorylation and activation of p70S6k and the hierarchical phosphorylation of 4E-BPs (Gingras et al., 2001, Jacinto and Hall, 2003, Kim et al., 2003, Ruggero and Pandolfi, 2003, Kim and Sabatini, 2004). 4E-BP interacts with its downstream effector eIF-4E (Marcotrigiano et al., 1999). Hypo-phosphorylated 4E-BP strongly binds to eIF-4E, whereas hyper-phosphorylation leads to 4E-BP release from eIF-4E and subsequent activation of cap dependent translation (Gingras et al., 1999, Gingras et al., 2001). 4E-BP is phosphorylated at multiple sites in a hierarchical manner (first Thr37 and Thr46, then Thr70 and last Ser65) (Gingras et al., 1999, Gingras et al., 2001). Rapamycin treatment inhibits 4E-BP phosphorylation, increases the interaction between eIF-4E and 4E-BP, and consequently inhibits cap-dependent translation (Gingras et al., 2001, Grolleau et al., 2002). eIF-4E is phosphorylated at Ser209 by MAP kinase signaling (Fukunaga and Hunter, 1997, Waskiewicz et al., 1997).
To determine the effects of parkin on metabolic and anatomical brain changes in expressing animals, we expressed parkin and conducted longitudinal high frequency 13C NMR and MRI studies in triple transgenic AD (3xTg-AD) mice, which over-express APP(Swe), Tau(P301L) and harbor the PS1(M146V) knock-in mutation and gene transfer rat models expressing lentiviral Aβ1-42. The 3xTg-AD mice show little cell death and progressive accumulation of Aβ and Tau (Oddo et al., 2003a, Billings et al., 2005, Oddo et al., 2006), whereas the lentiviral Aβ1-42 model displays faster degeneration and Tau accumulation (Rebeck et al., 2010), enabling us to compare the early versus progressive effects of Aβ on brain metabolism and morphometric changes. These studies provide an insight into the mechanisms of parkin-mediated restoration of brain metabolism and prevention of atrophy in AD models.
Experimental procedures
Stereotaxic surgery was performed to inject 1×10¹² m.o.i lentiviral parkin into the right, and 1×10¹² m.o.i lentiviral LacZ into the left CA1 region of the hippocampus of 1-1.5 year old 3xTg-AD mice (Khandelwal et al., 2011b). We also injected 1×10¹² m.o.i lentiviral Aβ1-42+1×10¹² m.o.i lentiviral LacZ into the left M1 primary motor cortex of 2-month old Sprague Dawley rats, and 1×10¹² m.o.i lentiviral β1-42+1×10¹² m.o.i lentiviral parkin into the right hemisphere as previously described (Burns et al., 2009). A total of 84 mice were injected and sacrificed 3 months post-injection and 86 rats were injected and sacrificed 2–12 weeks post-injection. All animal surgery and handling was approved by Georgetown University Animal Care and Use Committee (GUACUC).
Mammalian Target of Rapamycin (mTOR) activity assay
To assess the activity of mTOR in cortical brain lysates, we used a colorimetric Enzyme-linked immunosorbent assay (ELISA)-based activity, utilizing a p70S6K GST fusion protein as a specific mTOR substrate. mTOR was immuno-precipitated using a rabbit polyclonal antibody (1:100) for total mTOR (Cell Signaling Inc) and the kinase activity was measured in immunoprecipitated brain lysates according to manufacturer’s protocol (EMD Millipore, Cat # CBA055).
Western blot analysis
The cortex was dissected out and homogenized in 1xSTEN buffer then centrifuged at 5.000g and the supernatant was collected. Rabbit polyclonal antibodies for total 4E-BP1 (1:1000), Thr 37/46 phosphorylated 4E-BP1 (1:500), Ser 209 phosphorylated eIF-4E (1:500) and Thr 389 phospho-p70S6K (1:500) were used (Translational control sampler kit, Cell Signaling Technology). Rabbit polyclonal antibodies for total mTOR (1:1000) and Ser 2448 phosphorylated mTOR (1:1000) were used (Translational control sampler kit, Cell Signaling Technology). Tumor necrosis factor-β (TNF-α) was probed with (1:1000) anti-TNF-α rabbit antibody (Serotec), inducible nitric oxide synthase (iNOS) was probed with (1:1000) anti-iNOS rabbit antibody (BD Transduction Laboratories, USA). Western blots were quantified by densitometry using Quantity One 4.6.3 software (Bio Rad). Densitometry was obtained as arbitrary numbers measuring band intensity. Data were analyzed as mean±Standard deviation, using ANOVA, with Mann Whiney comparison between treatment groups.
Immunohistochemistry
Animals were deeply anesthetized with a mixture of Xylazine and Ketamine (1:8), washed with 1X saline for 1 min and then perfused with 4% paraformaldehyde (PFA) for 15–20 min. Brains were quickly dissected out and immediately stored in 4% PFA for 24h at 4°C, and then transferred to 30% sucrose at 4°C for 48h. Immunohistochemistry was performed on 20 micron-thick sections. Astrocytes were probed (1:200) with monoclonal anti-glial fibrillary acid protein (GFAP) antibody (Millipore Corporation, USA). Cresyl violet (Nissl) staining was performed according to manufacturer’s instructions (Sigma).
Stereological methods were applied by a blinded investigator using stereological counting (Stereologer, Systems Planning and Analysis, Chester, MD) of cresyl violet or GFAP stained cells. To determine the total positive cell counts in the rat, 20 cortical fields were assessed from at least 10 brain sections (~400 positive cells per animal) from each animal. In the rat, stereological counting was performed within the area of viral distribution across 2.5 mm radius from the point of injection within the cortex. All values were averaged to account for the gradient of staining across 2.5 mm radius and compared to control or other treatments. An optical fractionator sampling method was used to estimate the total number of positive cells with multi-level sampling design. Cells were counted within the sampling frame determined optically by the fractionator and cells that fell within the counting frame were counted as the nuclei came into view while focusing through the z-axis.
High frequency 13C/1H Nuclear Magnetic Resonance (NMR) Spectroscopy
Animals were fasted overnight with free access to tap water and were intra-perotenially (I.P) injected with [1-13C] glucose solution (0.5 mol/L) over 10s (0.3 ml/25–30 g body weight; 200 mg/kg). 45 min later, animals were sacrificed by cervical dislocation and hemispheres were isolated and immediately homogenized in 6% ice-cold perchloric acid, 50 mM NaH2PO4. After homogenization and lyophilization, extracts were re-suspended in 0.65 ml D2O containing 2 mM sodium [13C]formate as internal intensity and chemical shift reference (δ 171.8). Metabolite pool size was identified on 1H {13C-decoupled} NMR spectra. Peak areas were adjusted for nuclear Overhauser effect, saturation and natural abundance effects and quantified by reference to [13C] formate. Metabolite pool sizes were determined by integration of resonances in fully relaxed 400 MHz {13C-decoupled} 1H spectra using N-acetylaspartate as internal intensity reference. Incorporation of 13C into isotopomers was measured in reference to [13C]formate. All data were collected on a 9.7 Tesla Varian Spectrometer with dual 13C/1H probe. {13C-decoupled}-1H spectra were acquired with 3000 scans, pulse width 45°, relaxation delay 1s, line broadening 0.5 Hz, acquired data points 13.132 and transformation size 32K at room temperature. {1H-decoupled}-13C spectra were acquired with 24000 scans and 31875 data points. Spectra were integrated and quantified using MestReNova software (Master Lab Research).
Brain MRI in vivo was performed on a 7-T Bruker BioSpec 20cm horizontal bore (Bruker Biospin, Bellerica, MA). All animals were placed in a probe with a stereotaxic holder to ensure that the MRI scans are perfectly perpendicular to the animal brain. To obtain MRI scans of the brain, the 1H frequency (300 Mega-Hertz) was used to find the center frequency and the magnetic field was linearized (shimmed) over the whole animal brain. 1H scout images are obtained in transverse, coronal, sagittal and 3D magnetic resonance images were acquired. The MRI template set was created from multi-slice T2-weighted images of the rat brain acquired using a Rapid Acquisition with Refocused Echoes (RARE) sequence with the following acquisition parameters: matrix 256 × 256; Field-of-view (FOV) 40 mm3, slice thickness 1 mm, 16 contiguous coronal slices; with Echo Time (TE) = 11-milliseconds; Repetition Time = 7 seconds; Receiver Band width 7 kilohertz, Points acquired were 1024. A 72-mm birdcage resonator was used for RF transmit and the Bruker quadrature ‘RatBrain’ coil was used for RF receive. The images were acquired in the coronal plane, centered 10 mm caudal from the posterior edge of the olfactory bulb. The parameters used in the mouse brain scans were T2-weighted, RARE sequence, FOV = 12 × 12 × 24 mm and matrix size = 200 × 200, slice thickness 300 m, 10 contiguous coronal slices; with Echo Time (TE) = 11-milliseconds; Repetition Time = 7 seconds Receiver Band width 7 kilohertz. To perform MRS in mouse brains, a voxel size was set to 7 mm× 5.5 mm×10 mm. Shimming was performed on this volume element until the full-width half maximum H2O line width is 5 Hz or smaller. MRS was conducted just prior to the imaging experiment. At the onset of the experiment the 1H frequency is used to find the center frequency and the magnetic field is shimmed over the brain region of the animal. The PRESS (Point-RESolved Spectroscopy) sequence used had echo time (TE) = 13.77 ms, repetition time (TR) = 1.5 s, spectral width = 3472.22 Hz, number of points acquired were 1024, number of averages (NA) = 512, gradient spoiling time = 0.5 ms, excitation pulse length 10 μs, refocusing pulse length 1000 ms. Spectra were obtained after localizing the voxel 2×2×2 mm3 on cortical brain region, the field is shimmed and spectra were acquired. Spectra were processed with 6 Hz line broadening. Automatic baseline adjustment was performed using XWINMR Version 6.2 software (Bruker BioSpin, Bellerica, MA), the NAA/NAAG peak was calibrated to 1 and set as an internal reference, and all other peaks were integrated relative to NAA/NAAG. Volumetric evaluation and segmentation of brain images were performed using NIH Image J and Insight ITK-SNAP computer software, which implement 3D active contour segmentation methods. Spherical bubbles were placed inside the ventricles as starting points for the snake evolution, and the software was allowed to run 50–60 iterations until the bubbles fully fill the ventricles or the intracranial space, which is defined as the area between the skull and the brain. The software recorded data in cm3 and the values were converted into percentage control.
Results
Lentiviral Aβ1-42 activates mTOR and 4E-BP signaling
We previously showed lentiviral expression of Aβ1-42 in gene transfer animal models and demonstrated its effects on cell death, autophagy and inflammation (Burns et al., 2009, Rebeck et al., 2010). In the present studies we examined the effects of lentiviral Aβ1-42 on markers of the mTOR signaling pathway. ELISA measurements showed that lentiviral expression of Aβ1-42 in the rat cortex significantly increased (61%, N=8) the activity of mTOR compared to LacZ injected brains four weeks post-injection (Fig. 1A). We pursued another approach to examine the effects of Aβ1-42 on mTOR signaling using Western blot analysis. Lentiviral Aβ1-42 significantly increased (41%, by densitometry, N=8) total mTOR levels (Fig. 1B, 1st blot) and phosphorylation at Ser 2448 (Fig. 1B, 54%, 2nd blot) compared to LacZ injected motor cortex. To confirm the effects of Aβ1-42, we determined the phosphorylation of p70S6k. No changes in the levels of total p70S6k were observed (Fig. 1B, 3rd blot), but lentiviral Aβ1-42 significantly increased (36%, by densitometry) the p70S6k phosphorylation at Thr389 (Fig. 1B 4th blot) relative to actin. Further examination of kinase levels revealed no significant changes in total 4E-BP (Fig. 1C, 1st blot) relative to actin (4th blot). However, we observed a significant increase in the levels of Thr 37/46 phosphorylated (38%, N=8) 4E-BP1 (Fig. 1C, 2nd blot), indicating increased kinase activity in Aβ1-42 over-expressing animals. A significant decrease (65%, by densitometry, N=8) in the phosphorylation level of eIF-4E at Ser 209 was observed downstream of 4E-BP1, suggesting that Aβ1-42 increases 4E-BP1 phosphorylation and decreases eIF-4E phosphorylation.
Figure 1. Aβ1-42 expression activates mTOR 4E-BP signaling.
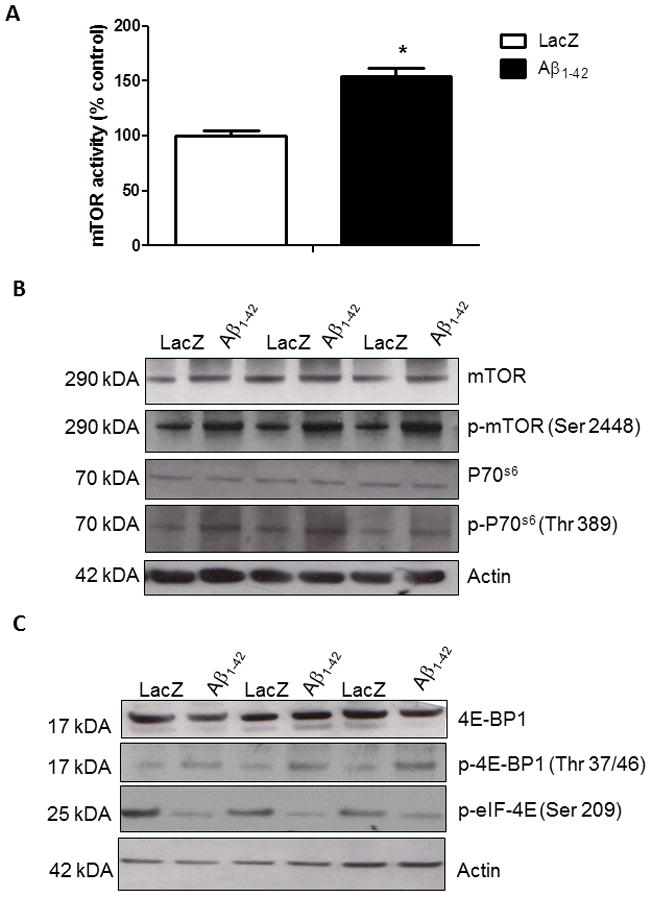
A). Histograms represent ELISA measurement of mTOR activity in immunoprecipitated cortical lysates. B). Western blot analysis of cortical brain lysates on 10% SDS NuPAGE gel showing total mTOR levels (1st blot) phosphorylated mTOR at Ser 2448 (2nd blot) and total p70S6k (3rd blot) and phosphorylated p70S6k levels at Thr 389 (4th blot) compared to actin control. C). Western blot analysis of cortical brain lysates on 4–12% SDS NuPAGE gel showing total 4E-BP1 levels (1st blot) phosphorylated 4E-BP1 at Thr 37/46 (2nd blot) and phosphorylated eIF-4E at Ser 209 (3rd blot) compared to actin control. Asterisk indicates significantly different, ANOVA, Mann Whitney, P<0.05, N=8.
Aβ1-42 increases amino acid levels and parkin reverses these effects
Because we observed alterations in translational control in the presence of lentiviral Aβ1-42 four weeks post-injection, we examined the levels of amino acids including leucine, isoleucine, glutamate, glutamine and aspartate. We co-injected lentiviral parkin and Aβ1-42 (Khandelwal et al., 2011b) and performed longitudinal studies to determine metabolic changes in gene transfer animal models. We performed high frequency 13C/1H NMR spectroscopy in brain extracts to compare Aβ1-42, LacZ, parkin and parkin+Aβ1-42 injected hemispheres at 2 and 4 weeks post-injection. No differences in the flux of 13C label into leucine C4 and isoleucine C4 (Fig. 2A), and no changes in amino acid pool sizes (Fig. 2B) were observed between Aβ1-42 and LacZ injected cortex two weeks post-injection. However, flux into leucine C4 and isoleucine C4 (Fig. 2A), and amino acid pool sizes (Fig. 2B) were significantly increased (N=5) between Aβ1-42 and LacZ injected brains four weeks post-injection. We previously showed that parkin alone did not change brain metabolism compared to LacZ (Khandelwal et al., 2011b), but co-injection of lentiviral parkin+Aβ1-42 reversed the changes in leucine and isoleucine levels back to control four weeks post-injection (Fig. 2A&B).
Figure 2. High frequency 13C/1H NMR spectroscopy shows alterations of amino acid levels and parkin restores neurotransmitter balance.
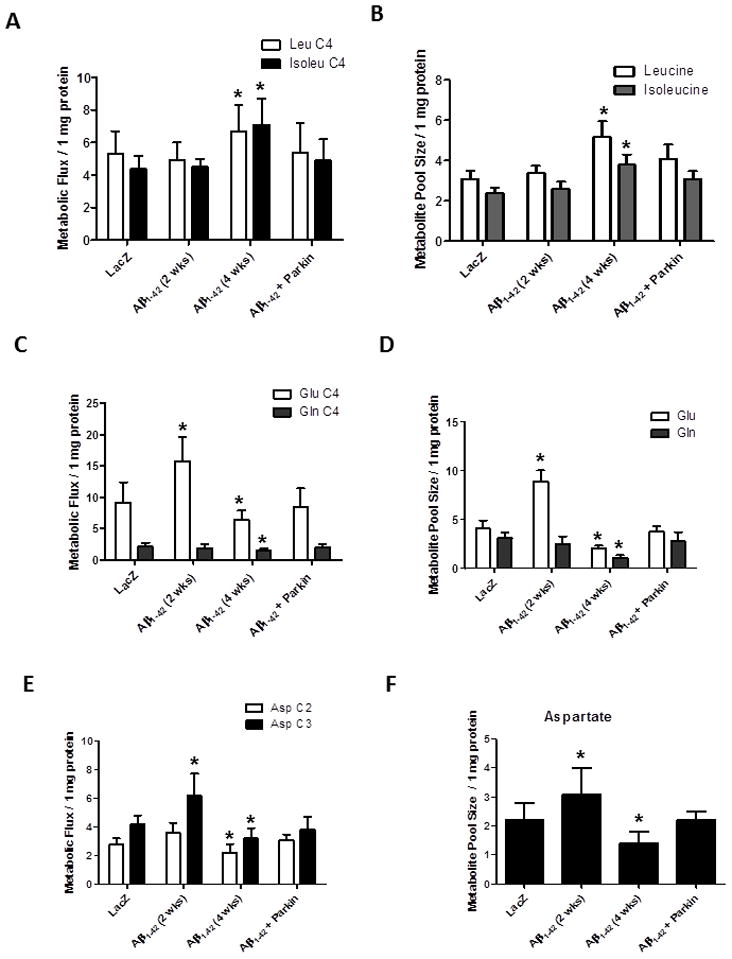
Histograms represent A). Flux of 13C label from glucose into leucine C4 (Leu) and isoleucine C4 (Isoleu) and B). Pool size of total leucine and isoleucine in rat hemispheres injected with lentiviral parkin, parkin+Aβ1-42, Aβ1-42 or LacZ. C). Flux of 13C label into glutamate C4 (Glu) and glutamine C4 (Gln) and D). Pool size of total glutamate and glutamine. E). Flux of 13C label into aspartate C2 and C3 (Asp) and F). Pool size of total aspartate. * indicates significantly different, ANOVA, Mann Whitney, P<0.05, N=5.
The flux of 13C label into glutamate C4 was significantly increased (P<0.05, N=5) two weeks but decreased four weeks post-injection with Aβ1-42 compared to LacZ (Fig. 2C), however, parkin co-expression with Aβ1-42 reversed the changes in C4 glutamate levels (Fig. 2C). The total level of glutamate was also significantly increased at two weeks, and decreased four weeks post-injection (Fig. 2D), in agreement with metabolic flux. Parkin expression prevented changes in glutamate levels four weeks post-injection (Fig. 2D), consistent with our previous findings in 3xTg-AD mice (Khandelwal et al., 2011b). No significant differences were observed in metabolic flux into glutamine C4 (Fig. 2C) or total glutamine levels (Fig. 2D) two weeks post-injection, suggesting that the increase in glutamate levels are independent of the glutamate-glutamine cycle. 13C flux into glutamine C4 was significantly decreased four weeks post-injection with Aβ1-42 (Fig. 2C), along with the total level of glutamine (Fig. 2D) in Aβ1-42 compared to LacZ injected animals. Parkin reversed glutamine decrease back to control (Fig. 2C&D), suggesting that Aβ1-42 increases glutamate levels two weeks post-injection but at four weeks both glutamate and glutamine levels are decreased.
We detected a significant increase in 13C flux into aspartate C3 (Fig. 2E) two weeks post-injection with Aβ1-42, but flux into both aspartate C2 and C3 was significantly decreased four weeks post-injection (Fig. 2E) compared to LacZ. Total aspartate levels were increased two weeks and decreased four weeks post-injection with Aβ1-42 (Fig. 2F), indicating similar patterns of changes in both glutamate and aspartate. Parkin reversed the effects of Aβ1-42 on metabolic flux into aspartate isotopomers (Fig. 2E) and total pool size (Fig. 4F) compared to LacZ.
Figure 4. Parkin reduces brain atrophy in 3xTg-AD mice.

A). MRI brain scans of 1 year old 3xTg-AD mice and, B). and 1 year old non-Tg (control) mice. C). MRI brain scans of 3xTg-AD mice injected with lentiviral parkin in the right hemisphere, compared to LacZ-injected left hemisphere. Arrowheads indicate cortical brain atrophy. D). MRI brain scans of 1.5 year old non-Tg control mice. Histograms represent quantification by segmentation of E). ventricular and F). intracranial volumes. G). Spectra obtained by MRS showing Taurine (Tau) levels. Bars are mean+/−SD, N=11 each treatment, P<0.05, ANOVA Mann Whitney. Lv: Lentivirus. Asterisk indicates significantly different to all other conditions.
Lentiviral Aβ1-42 decreases GABA levels and induces oxidative stress
We further examined whether the changes in the excitatory amino acid neurotransmitter glutamate are associated with changes in inhibitory neurotransmitters, including β-amino butyric acid (GABA). Flux into GABA C2 was significantly decreased both two and four weeks post-injection with Aβ1-42 (Fig. 3A) compared to LacZ, but parkin reversed the decrease in flux back to control. Similarly, the total pool size of GABA was significantly decreased two and four weeks post-injection (Fig. 3B), while parkin reversed these effects.
Figure 3. High frequency 13C/1H NMR spectroscopy shows decreased GABA and TCA cycle activity and parkin counteracts oxidative stress.

Histograms represent A). Flux of 13C label from glucose into GABA C2 and B). Pool size of total GABA in rat hemispheres injected with lentiviral parkin, parkin+Aβ1-42, Aβ1-42 or LacZ. C). Flux of 13C label into lactate C3 (Lac), succinate C3 (Succ) and citrate C2 (Cit) and D). Pool size of total lactate, succinate and citrate. * indicates significantly different, ANOVA, Mann Whitney, P<0.05, N=4.
To examine whether the changes in excitotoxic glutamate induce oxidative stress we determined whether Aβ1-42 expression results in lactate accumulation. No changes were observed in the flux of 13C label into lactate C3 two weeks post-injection, but flux was significantly increased (P<0.05, N=5) four weeks post-injection (Fig. 3C). The total level of lactate was also significantly increased at four, but not two weeks, post-injection (Fig. 3D), suggesting that lentiviral Aβ1-42 expression induces lactate accumulation, indicative of oxidative stress. However, parkin expression completely reversed flux into lactate C3 (Fig. 3C) and prevented lactate accumulation (Fig. 3D), indicating that parkin counteracts Aβ1-42-induced oxidative stress. Interestingly, glutamate levels were significantly increased prior to lactate accumulation, suggesting that glutamate toxicity may underlie Aβ1-42-induced oxidative damage even before other changes in amino acid levels.
To ascertain whether the changes in the level of by-products of the TCA cycle, including glutamate, glutamine, aspartate and GABA are associated with alteration in mitochondrial TCA cycle activity, we examined the levels of TCA intermediates succinate and citrate. No changes in metabolic flux into succinate C2/C3 or citrate C2 (Fig. 3C) were observed two weeks post-injection with lentiviral Aβ1-42, however, flux into citrate C2 was significantly decreased (P<0.05, N=5) four weeks post-injection. Similarly, no changes in total levels of TCA intermediates were observed at two weeks, but the levels of both succinate and citrate were significantly decreased four weeks (Fig. 3D), post-injection compared to LacZ control. Importantly, parkin expression reversed the decrease in metabolic flux into citrate C2 (Fig. 3C) and restored succinate and citrate levels (Fig. 3D) four weeks post-injection with Aβ1-42+parkin, suggesting that parkin protects against oxidative stress and mitochondrial impairment. These data suggest that parkin may protect against glutamate toxicity and mitochondrial impairment either via Aβ1-42 degradation (Burns et al., 2009, Khandelwal et al., 2011a) and/or by direct mitochondrial repair.
Parkin protects against brain atrophy in aged 3xTg-AD mice
To determine whether Aβ expression results in anatomical changes or atrophy in 3xTg-AD mice, we performed MRI and compared 1 year old non-Tg C57BL/6 (Fig. 4A) with age-matched 3xTg-AD mice (Fig. 4B). All animals were injected with lentiviral LacZ in the left hippocampus or parkin in the right hippocampus. No anatomical lesions or morphometric differences were observed in these mice at one year of age. To quantify changes in brain volume we performed brain segmentation, which showed no noticeable differences in ventricular volume (Fig. 4E, N=11) and intracranial space (Fig. 4F, N=11) in 1 year old 3xTg-AD mice compared to age-matched control (Fig. 4E&F, N=17). However, 1.5 year old 3xTg-AD mice injected with lentiviral Lac-Z into the hippocampus showed observable cortical atrophy (Fig. 4C, arrowheads) and a significant increase (21%, N=11) in ventricular volume (Fig. 4C&E), but a non-significant increase (14%, P<0.05) in intracranial volume (Fig. 4C&F), compared to control (Fig. 4D, E and F). Importantly, expression of lentiviral parkin (N=11) for 3 months in the right hippocampus of 3xTg-AD mice was associated with absence of cortical atrophy and lack of changes in ventricular or intracranial volumes (Fig. 4C, E &F), suggesting that parkin protects against brain atrophy. To ascertain that the change in ventricular volume was not due to edema induced by parkin expression in these mice, we performed voxel localized MRS in vivo in the entire hemisphere to detect changes in osmo-regulatory molecules (i.e. taurine). No changes were observed in the levels of taurine (N=11) in un-injected hemispheres compared to parkin-injected hemispheres (Fig. 4G), or between young and old 3xTg-AD mice (data not shown), suggesting absence of brain swelling.
Parkin decreases cortical atrophy in lentiviral Aβ1-42 injected rat models
To determine whether parkin expression protects against amyloid-induced effects, we imaged rat brains injected with lentiviral Aβ1-42 in the left side of the M1 primary motor cortex and parkin+Aβ1-42 in the right side (Burns et al., 2009). Expression of Aβ1-42 led to obvious cortical atrophy around the injected brain region (Fig. 5A, arrowheads) 3 months post-injection. Quantification of changes in brain volume via segmentation showed that lentiviral expression of Aβ1-42 was associated with a significant increase (27%, N=6) in intracranial volume (Fig. 5A&B). Changes in ventricular volume were also apparent as the Aβ1-42 injected brain hemisphere showed a significant decrease (74%, P<0.05, N=6) in ventricular volume compared to LacZ or parkin+Aβ1-42 Co-injection of lentiviral Aβ1-42+lentiviral parkin (Fig. 5A) prevented cortical atrophy and reversed intracranial and ventricular volume back to control levels (Fig. 5B), suggesting that parkin counteracts the effects of Aβ1-42 on brain atrophy in gene transfer animal models. The cortical atrophy observed was localized to the vicinity of lentiviral Aβ1-42 injection and evident in the frontal but not caudal side of the brain.
Figure 5. Parkin reverses cortical atrophy in Aβ1-42 gene transfer animal models.

A). MRI scans of rat brain injected with lentiviral Aβ1-42+lentiviral LacZ in the left hemisphere and lentiviral Aβ1-42+lentiviral parkin in the right hemisphere. Arrowheads indicate cortical atrophy. B). Histograms represent quantification of intracranial and ventricular volume. C). Western blot analysis of the levels of inflammatory markers TNF-β and iNOS in the cortex of gene transfer animal models (N=6). Cortical 20m thick sections showing cresyl violet (Nissl) staining in lentiviral D). parkin, E). Aβ1-42, circle indicates cell loss and F). parkin+ Aβ1-42 injected brains. Higher view magnification show cell morphology in G). parkin, H). Aβ1-42 and I). parkin+Aβ1-42 injected brains. Anti-GFAP immunoreactivity in brains injected with lentiviral J). parkin, K). Aβ1-42 and L). Aβ1-42+parkin. Bars are mean+−/−SD, N=6 each treatment, P<0.05, ANOVA Mann Whitney. Lv: Lentivirus. Asterisk indicates significantly different to all other conditions.
To determine whether parkin protects against the toxic effects of Aβ1-42, we examined possible changes in cortical cell number using cresyl violet and GFAP staining and performed stereological counting. First we determined the effects of parkin on Aβ1-42 expressing brains three months post-injection, so we performed Western blot to measure the levels of TNF-β and iNOS as markers of inflammation. A significant increase (53%, by densitometry) in the levels of TNF-β was observed in Aβ1-42 expressing animals, compared to LacZ or parkin injected brains (Fig. 5C). Co-expression of parkin with Aβ1-42 was associated with decreased TNF-β levels back to control (LacZ). The levels of iNOS were also significantly increased (21% by densitometry, N=6) in Aβ1-42 injected animals compared to LacZ, parkin or parkin+Aβ1-42. We then performed immuno-histological staining to perform cell counting and ascertain whether brain atrophy is associated with cell loss in Aβ1-42 expressing cortex. Low view magnification showed decreased Cresyl violet staining (Fig. 5E, circle) in Aβ1-42 expressing cortex compared to parkin alone (Fig. 5D) or Aβ1-42+parkin (Fig. 6F). Stereological counting of cresyl violet positive cells revealed a significant (67%, P<0.05, N=11) decrease in cell count in Aβ1-42 injected cortical areas compared to both parkin and Aβ1-42+parkin. Higher view magnification show changes in cell morphology in Aβ1-42 injected cortex (Fig. 5H) compared to parkin (Fig. 5G) and Aβ1-42+parkin (Fig. 5I) injected animals. No differences were observed in the morphology and number of astrocytes in parkin-injected (Fig. 3C) compared to LacZ injected (data not shown) controls (Rebeck et al., 2010). Lentiviral injection of Aβ1-42 resulted in pronounced changes of astrocyte morphology, suggesting astrocytosis (Fig. 5K), compared to parkin (Fig. 5J) and Aβ1-42+parkin (Fig. 5L) injected animals. Stereological counting of GFAP stained astrocytes revealed a significant increase (54%, N=6) in the number of astrocytes in Aβ1-42 compared to parkin injected brains. Co-injection of parkin and Aβ1-42 reversed Aβ1-42 effects on astrocyte morphology (Fig. 5L) and decreased the number of astrocytes back to control levels.
Discussion
These studies demonstrate that Aβ1-42 activates mTOR signaling, leading to increased phosphorylation of 4E-BP and translational initiation, which is controlled by the interaction between eIF-4E and 4E-BPs (Gingras et al., 1999, Gingras et al., 2001). Once 4E-BP1 is phosphorylated, it dissociates from eIF-4E, hence permitting cap-dependent translation to take place (Holz et al., 2005, Peterson and Sabatini, 2005). These mechanistic effects of Aβ1-42 suggest that mTOR signaling may be regulated by amino acid synthesis, including leucine, isoleucine and glutamine (Avruch et al., 2006). Aβ1-42 increased the synthesis of glutamate and aspartate, but not glutamine, leucine and isoleucine two weeks post-injection when no mTOR activity was detected (data not shown), but leucine and isoleucine levels increased while glutamate, glutamine and aspartate levels decreased four weeks post-injection with Aβ1-42. The current studies also demonstrate that lentiviral Aβ1-42 impairs mitochondrial TCA cycle and leads to oxidative stress, attenuating TCA activity and synthesis of its by-products, including glutamate, GABA, glutamine and aspartate. Two weeks after Aβ1-42 injection excitatory amino acids glutamate and aspartate were increased, while inhibitory GABA was decreased suggesting perturbation of neurotransmitter balance. However, 4 weeks post-injection all amino acid neurotransmitters were decreased, suggesting decreased production via TCA cycle metabolism. Additionally, Aβ1-42 induced lactate production, indicating oxidative stress along with mitochondrial impairment and neurotransmitter imbalance four weeks post-injection. Impaired activities of TCA cycle enzyme complexes pyruvate dehydrogenase, isocitrate dehydrogenase, and β-ketoglutarate dehydrogenase are found in post-mortem AD brains (Bubber et al., 2005), and in cells from AD patients (Huang et al., 2003). APP over-expression increases reactive oxygen species (ROS) levels, decreases mitochondrial membrane potential, and reduces ATP production in APPwt and APPswe M17 cells (Wang et al., 2008). However, parkin reversed Aβ1-42 effects on TCA cycle in Aβ1-42-expressing animals, consistent with previous findings (Khandelwal et al., 2011a). The increase in glutamate levels prior to lactate accumulation suggests that glutamate toxicity may cause mitochondrial damage and lead to oxidative stress as a result of Aβ1-42 expression. Importantly, parkin reversed the effects of Aβ1-42 on amino acid levels, protected against glutamate toxicity and prevented mitochondrial TCA cycle impairment. Our data are consistent with previous findings suggesting that parkin expression reduces oxidative stress (Hyun et al., 2002), while blocking parkin expression increases oxidative damage (Palacino et al., 2004, Greene et al., 2005). The effects of parkin on markers of oxidative stress may be a result of parkin’s role in mitochondrial function as parkin knockout transgenic mice (Palacino et al., 2004) and flies (Greene et al., 2003) have deficient mitochondria. Furthermore, several findings demonstrate that parkin is associated with mitophagy following loss of mitochondrial membrane potential (Matsuda and Tanaka, 2009, Chin et al., 2010). Therefore, parkin may protect against Aβ1-42 effects on alterations of brain metabolism via proteasome-autophagy degradation of amyloid and modulation of mitochondrial dynamics.
The present data suggest that parkin expression can counter Aβ effects, which may result in brain atrophy in animal models of AD. The 3xTg-AD mice display accumulation of intraneuronal Aβ at 3 months, Tau accumulation at 6 months and extracellular plaques no earlier than 9 months of age (Oddo et al., 2003a, Billings et al., 2005, Oddo et al., 2006). Brain pathologies are also associated with cognitive defects in these mice (Oddo et al., 2003a, Oddo et al., 2003b). Despite the accumulation of several pathogenic proteins, 3xTg-AD mice do not have anatomical brain lesions or obvious morphological changes at least up to 1 year of age. Aging and protein accumulation result in overall brain atrophy, leading to increased ventricular volume and intracranial space. To determine the effects of amyloid proteins on brain atrophy, we injected lentiviral Aβ1-42, which contains a signal peptide directed to the endoplasmic reticulum to follow the secretary pathway of Aβ (Rebeck et al., 2010), and observed cortical atrophy 3 months post-injection. Amyloid expression was also associated with increased levels of inflammatory markers, neuronal loss and astrogliosis, suggesting cell death as we previously reported in gene transfer animal models (Burns et al., 2009, Rebeck et al., 2010, Khandelwal et al., 2011b). Parkin effects on Aβ levels may result in prevention of brain atrophy caused by amyloid accumulation in 3xTg-AD mice or Aβ1-42 expression in gene transfer animal models. Parkin protects against Aβ-induced cell death (Burns et al., 2009, Khandelwal et al., 2011b), and our current data show that parkin reverses the effects of Aβ on astrocytes and decreases the levels of inflammatory markers, including TNF-β and iNOS. Brain atrophy is largely recognized in AD in association with protein accumulation, which is progressively detected in the human brain, leading to transition from mild cognitive impairment (MCI) to advanced stages of disease pathology (Braak et al., 2006, Alafuzoff et al., 2008, Granic et al., 2010, Sabbagh et al., 2010, Murray et al., 2011). It is important to note the differential changes in ventricular volume in our animal models. The 3xTg-AD mice develop slow pathology with little cell loss and no measurable atrophy up 1 year of age compared to wild type controls. However, these mice develop observable cortical atrophy at 1.5 year of age, in association with significant ventricular enlargement while parkin abrogates atrophy, perhaps due to amyloid clearance (Khandelwal et al., 2011b). The lack of change in taurine levels, which is an osmo-regulator affected by brain swelling (Law, 2005, Ritz et al., 2006, Pascual et al., 2007), suggests that the difference between ventricular volumes is not due to edema caused by parkin expression, which also dampens gliosis. In contrast, the gene transfer animal models develop rapid degeneration due to expression of lentiviral Aβ1-42 and display Tau hyper-phosphorylation and gliosis within a focal region or the vicinity of lentiviral expression (Rebeck et al., 2010), suggesting that the atrophy observed in the frontal, not caudal part, of the cortex may lead to collapse of ventricles, while parkin clearance of Aβ1-42 prevents localized cortical atrophy and preserves ventricular integrity. In contract, the Aβ transgene was globally expressed in 3xTg-AD animals, leading to generalized atrophy and enlargement of the ventricles. The choice of two animal models, including 3xTg-AD and lentiviral gene transfer was very useful to delineate the effects of Aβ and Tau accumulation in later stages (3xTg-AD) of AD-pathology compared to the early effects of Aβ1-42 (lentiviral gene transfer) on brain metabolism and morphometric changes.
In conclusion, the longitudinal studies suggest that AD genes alter brain metabolism and may induce slow atrophy in the brain of 3xTg-AD mice and lentiviral delivery indicates that Aβ1-42 causes astrogliosis and localized morphometric changes in the cortex of gene transfer animal models. Parkin expression reverses the effects of AD genes on inflammation and brain atrophy. Taken together these data suggest that parkin activity may be used as an alternative strategy to facilitate Aβ clearance via cellular quality control systems, including both the ubiquitin-proteasome and the autophagy lysosome pathways, thus limiting neurodegenerative death and subsequent brain atrophy in AD.
Highlights.
-
1-
Aβ1-42 increases glutamate and aspartate, but not glutamine levels
-
3-
Glutamate levels increased prior to lactate accumulation
-
2-
Aβ1-42 attenuated mitochondrial TCA cycle and parkin reversed these effects
-
4-
Parkin protected against Aβ1-42 effects on amino acid and glutamate toxicity
-
5-
Parkin reduced astrogliosis and reversed cell loss and cortical atrophy
Acknowledgments
Norah Algarzae and Michaeline Hebron performed Western blot and assisted in the writing of the manuscript. Matthew Misseau performed the NMR experiments. Charbel Moussa designed the studies, performed MRI scanning, immunohistochemistry, data quantification and wrote the manuscript. The authors would like to thank Georgetown University Drug Discovery Program for processing the NMR experiments.
Funding: These studies were supported by NIH grant AG30378 to Charbel E-H Moussa and Georgetown University funding.
Abbreviations
- AD
Alzheimer’s disease
- APP
amyloid precursor protein
- Aβ
β-amyloid
- mTOR
mammalian target of Rapamycin
- TNF-α
tumor necrosis factor-α
- iNOS
inducible nitric oxide synthase
- GFAP
glial fibrillary acidic proteins
- eIF-4E
eukaryotic initiation factor 4E
- 4E-BP
eukaryotic initiation factor 4E binding protein
- Glu
glutamate
- Gln
glutamine
- Cit
citrate
- GABA
γ-amino butyric acid
- Asp
aspartate
- Leu
Leucine
- Isoleuc
Isoleucine
- Succ
succinate
- Lac
Lactate
- Lv
lentivirus
- 3xTg-AD
triple transgenic AD
- ROS
reactive oxygen species
Footnotes
Conflicts of interest and sources of funding. The authors declare no conflict of interest in association with this manuscript.
Publisher's Disclaimer: This is a PDF file of an unedited manuscript that has been accepted for publication. As a service to our customers we are providing this early version of the manuscript. The manuscript will undergo copyediting, typesetting, and review of the resulting proof before it is published in its final citable form. Please note that during the production process errors may be discovered which could affect the content, and all legal disclaimers that apply to the journal pertain.
References
- Alafuzoff I, Arzberger T, Al-Sarraj S, Bodi I, Bogdanovic N, Braak H, Bugiani O, Del-Tredici K, Ferrer I, Gelpi E, Giaccone G, Graeber MB, Ince P, Kamphorst W, King A, Korkolopoulou P, Kovacs GG, Larionov S, Meyronet D, Monoranu C, Parchi P, Patsouris E, Roggendorf W, Seilhean D, Tagliavini F, Stadelmann C, Streichenberger N, Thal DR, Wharton SB, Kretzschmar H. Staging of neurofibrillary pathology in Alzheimer’s disease: a study of the BrainNet Europe Consortium. Brain Pathol. 2008;18:484–496. doi: 10.1111/j.1750-3639.2008.00147.x. [DOI] [PMC free article] [PubMed] [Google Scholar]
- Avruch J, Hara K, Lin Y, Liu M, Long X, Ortiz-Vega S, Yonezawa K. Insulin and amino-acid regulation of mTOR signaling and kinase activity through the Rheb GTPase. Oncogene. 2006;25:6361–6372. doi: 10.1038/sj.onc.1209882. [DOI] [PubMed] [Google Scholar]
- Billings LM, Oddo S, Green KN, McGaugh JL, LaFerla FM. Intraneuronal Abeta causes the onset of early Alzheimer’s disease-related cognitive deficits in transgenic mice. Neuron. 2005;45:675–688. doi: 10.1016/j.neuron.2005.01.040. [DOI] [PubMed] [Google Scholar]
- Braak H, Alafuzoff I, Arzberger T, Kretzschmar H, Del Tredici K. Staging of Alzheimer disease-associated neurofibrillary pathology using paraffin sections and immunocytochemistry. Acta Neuropathol. 2006;112:389–404. doi: 10.1007/s00401-006-0127-z. [DOI] [PMC free article] [PubMed] [Google Scholar]
- Bubber P, Haroutunian V, Fisch G, Blass JP, Gibson GE. Mitochondrial abnormalities in Alzheimer brain: mechanistic implications. Ann Neurol. 2005;57:695–703. doi: 10.1002/ana.20474. [DOI] [PubMed] [Google Scholar]
- Burns MP, Zhang L, Rebeck GW, Querfurth HW, Moussa CE. Parkin promotes intracellular Abeta1-42 clearance. Hum Mol Genet. 2009;18:3206–3216. doi: 10.1093/hmg/ddp258. [DOI] [PMC free article] [PubMed] [Google Scholar]
- Cataldo AM, Barnett JL, Pieroni C, Nixon RA. Increased neuronal endocytosis and protease delivery to early endosomes in sporadic Alzheimer’s disease: neuropathologic evidence for a mechanism of increased beta-amyloidogenesis. J Neurosci. 1997;17:6142–6151. doi: 10.1523/JNEUROSCI.17-16-06142.1997. [DOI] [PMC free article] [PubMed] [Google Scholar]
- Cataldo AM, Peterhoff CM, Troncoso JC, Gomez-Isla T, Hyman BT, Nixon RA. Endocytic pathway abnormalities precede amyloid beta deposition in sporadic Alzheimer’s disease and Down syndrome: differential effects of APOE genotype and presenilin mutations. Am J Pathol. 2000;157:277–286. doi: 10.1016/s0002-9440(10)64538-5. [DOI] [PMC free article] [PubMed] [Google Scholar]
- Chin LS, Olzmann JA, Li L. Parkin-mediated ubiquitin signalling in aggresome formation and autophagy. Biochem Soc Trans. 2010;38:144–149. doi: 10.1042/BST0380144. [DOI] [PMC free article] [PubMed] [Google Scholar]
- Cook DG, Forman MS, Sung JC, Leight S, Kolson DL, Iwatsubo T, Lee VM, Doms RW. Alzheimer’s A beta(1-42) is generated in the endoplasmic reticulum/intermediate compartment of NT2N cells. Nat Med. 1997;3:1021–1023. doi: 10.1038/nm0997-1021. [DOI] [PubMed] [Google Scholar]
- D’Andrea MR, Nagele RG, Wang HY, Peterson PA, Lee DH. Evidence that neurones accumulating amyloid can undergo lysis to form amyloid plaques in Alzheimer’s disease. Histopathology. 2001;38:120–134. doi: 10.1046/j.1365-2559.2001.01082.x. [DOI] [PubMed] [Google Scholar]
- Fukunaga R, Hunter T. MNK1, a new MAP kinase-activated protein kinase, isolated by a novel expression screening method for identifying protein kinase substrates. EMBO J. 1997;16:1921–1933. doi: 10.1093/emboj/16.8.1921. [DOI] [PMC free article] [PubMed] [Google Scholar]
- Gingras AC, Gygi SP, Raught B, Polakiewicz RD, Abraham RT, Hoekstra MF, Aebersold R, Sonenberg N. Regulation of 4E-BP1 phosphorylation: a novel two-step mechanism. Genes Dev. 1999;13:1422–1437. doi: 10.1101/gad.13.11.1422. [DOI] [PMC free article] [PubMed] [Google Scholar]
- Gingras AC, Raught B, Gygi SP, Niedzwiecka A, Miron M, Burley SK, Polakiewicz RD, Wyslouch-Cieszynska A, Aebersold R, Sonenberg N. Hierarchical phosphorylation of the translation inhibitor 4E-BP1. Genes Dev. 2001;15:2852–2864. doi: 10.1101/gad.912401. [DOI] [PMC free article] [PubMed] [Google Scholar]
- Gouras GK, Tsai J, Naslund J, Vincent B, Edgar M, Checler F, Greenfield JP, Haroutunian V, Buxbaum JD, Xu H, Greengard P, Relkin NR. Intraneuronal Abeta42 accumulation in human brain. Am J Pathol. 2000;156:15–20. doi: 10.1016/s0002-9440(10)64700-1. [DOI] [PMC free article] [PubMed] [Google Scholar]
- Granic I, Masman MF, Luiten PG, Eisel UL. Braak staging in mouse models of Alzheimer’s disease. Am J Pathol. 2010;177:1603–1605. doi: 10.2353/ajpath.2010.100656. [DOI] [PMC free article] [PubMed] [Google Scholar]
- Greene JC, Whitworth AJ, Andrews LA, Parker TJ, Pallanck LJ. Genetic and genomic studies of Drosophila parkin mutants implicate oxidative stress and innate immune responses in pathogenesis. Hum Mol Genet. 2005;14:799–811. doi: 10.1093/hmg/ddi074. [DOI] [PubMed] [Google Scholar]
- Greene JC, Whitworth AJ, Kuo I, Andrews LA, Feany MB, Pallanck LJ. Mitochondrial pathology and apoptotic muscle degeneration in Drosophila parkin mutants. Proc Natl Acad Sci U S A. 2003;100:4078–4083. doi: 10.1073/pnas.0737556100. [DOI] [PMC free article] [PubMed] [Google Scholar]
- Greenfield JP, Tsai J, Gouras GK, Hai B, Thinakaran G, Checler F, Sisodia SS, Greengard P, Xu H. Endoplasmic reticulum and trans-Golgi network generate distinct populations of Alzheimer beta-amyloid peptides. Proc Natl Acad Sci U S A. 1999;96:742–747. doi: 10.1073/pnas.96.2.742. [DOI] [PMC free article] [PubMed] [Google Scholar]
- Grolleau A, Bowman J, Pradet-Balade B, Puravs E, Hanash S, Garcia-Sanz JA, Beretta L. Global and specific translational control by rapamycin in T cells uncovered by microarrays and proteomics. J Biol Chem. 2002;277:22175–22184. doi: 10.1074/jbc.M202014200. [DOI] [PubMed] [Google Scholar]
- Hardy J, Selkoe DJ. The amyloid hypothesis of Alzheimer’s disease: progress and problems on the road to therapeutics. Science. 2002;297:353–356. doi: 10.1126/science.1072994. [DOI] [PubMed] [Google Scholar]
- Holz MK, Ballif BA, Gygi SP, Blenis J. mTOR and S6K1 mediate assembly of the translation preinitiation complex through dynamic protein interchange and ordered phosphorylation events. Cell. 2005;123:569–580. doi: 10.1016/j.cell.2005.10.024. [DOI] [PubMed] [Google Scholar]
- Huang HM, Zhang H, Xu H, Gibson GE. Inhibition of the alpha-ketoglutarate dehydrogenase complex alters mitochondrial function and cellular calcium regulation. Biochim Biophys Acta. 2003;1637:119–126. doi: 10.1016/s0925-4439(02)00222-3. [DOI] [PubMed] [Google Scholar]
- Hyun DH, Lee M, Hattori N, Kubo S, Mizuno Y, Halliwell B, Jenner P. Effect of wild-type or mutant Parkin on oxidative damage, nitric oxide, antioxidant defenses, and the proteasome. J Biol Chem. 2002;277:28572–28577. doi: 10.1074/jbc.M200666200. [DOI] [PubMed] [Google Scholar]
- Jacinto E, Hall MN. Tor signalling in bugs, brain and brawn. Nat Rev Mol Cell Biol. 2003;4:117–126. doi: 10.1038/nrm1018. [DOI] [PubMed] [Google Scholar]
- Jarrett JT, Berger EP, Lansbury PT., Jr The carboxy terminus of the beta amyloid protein is critical for the seeding of amyloid formation: implications for the pathogenesis of Alzheimer’s disease. Biochemistry. 1993;32:4693–4697. doi: 10.1021/bi00069a001. [DOI] [PubMed] [Google Scholar]
- Khandelwal PJ, Herman AM, Hoe HS, Rebeck GW, Moussa CE. Parkin mediates beclin-dependent autophagic clearance of defective mitochondria and ubiquitinated A{beta} in AD models. Hum Mol Genet. 2011a doi: 10.1093/hmg/ddr091. [DOI] [PMC free article] [PubMed] [Google Scholar]
- Khandelwal PJ, Herman AM, Hoe HS, Rebeck GW, Moussa CE. Parkin mediates beclin-dependent autophagic clearance of defective mitochondria and ubiquitinated Abeta in AD models. Hum Mol Genet. 2011b;20:2091–2102. doi: 10.1093/hmg/ddr091. [DOI] [PMC free article] [PubMed] [Google Scholar]
- Kim DH, Sabatini DM. Raptor and mTOR: subunits of a nutrient-sensitive complex. Curr Top Microbiol Immunol. 2004;279:259–270. doi: 10.1007/978-3-642-18930-2_15. [DOI] [PubMed] [Google Scholar]
- Kim DH, Sarbassov DD, Ali SM, Latek RR, Guntur KV, Erdjument-Bromage H, Tempst P, Sabatini DM. GbetaL, a positive regulator of the rapamycin-sensitive pathway required for the nutrient-sensitive interaction between raptor and mTOR. Mol Cell. 2003;11:895–904. doi: 10.1016/s1097-2765(03)00114-x. [DOI] [PubMed] [Google Scholar]
- Kitada T, Asakawa S, Hattori N, Matsumine H, Yamamura Y, Minoshima S, Yokochi M, Mizuno Y, Shimizu N. Mutations in the parkin gene cause autosomal recessive juvenile parkinsonism. Nature. 1998;392:605–608. doi: 10.1038/33416. [DOI] [PubMed] [Google Scholar]
- Law RO. Cerebrocellular swelling in the presence of uraemic guanidino compounds: ameliorative effects of taurine. Neurochem Res. 2005;30:1465–1470. doi: 10.1007/s11064-005-8823-y. [DOI] [PubMed] [Google Scholar]
- Lee SJ, Liyanage U, Bickel PE, Xia W, Lansbury PT, Jr, Kosik KS. A detergent-insoluble membrane compartment contains A beta in vivo. Nat Med. 1998;4:730–734. doi: 10.1038/nm0698-730. [DOI] [PubMed] [Google Scholar]
- Lucking CB, Durr A, Bonifati V, Vaughan J, De Michele G, Gasser T, Harhangi BS, Meco G, Denefle P, Wood NW, Agid Y, Brice A. Association between early-onset Parkinson’s disease and mutations in the parkin gene. N Engl J Med. 2000;342:1560–1567. doi: 10.1056/NEJM200005253422103. [DOI] [PubMed] [Google Scholar]
- Mamane Y, Petroulakis E, Rong L, Yoshida K, Ler LW, Sonenberg N. eIF4E--from translation to transformation. Oncogene. 2004;23:3172–3179. doi: 10.1038/sj.onc.1207549. [DOI] [PubMed] [Google Scholar]
- Marcotrigiano J, Gingras AC, Sonenberg N, Burley SK. Cap-dependent translation initiation in eukaryotes is regulated by a molecular mimic of eIF4G. Mol Cell. 1999;3:707–716. doi: 10.1016/s1097-2765(01)80003-4. [DOI] [PubMed] [Google Scholar]
- Matsuda N, Tanaka K. Does Impairment of the Ubiquitin-Proteasome System or the Autophagy-Lysosome Pathway Predispose Individuals to Neurodegenerative Disorders such as Parkinson’s Disease? J Alzheimers Dis. 2009 doi: 10.3233/JAD-2010-1231. [DOI] [PubMed] [Google Scholar]
- Murray ME, Graff-Radford NR, Ross OA, Petersen RC, Duara R, Dickson DW. Neuropathologically defined subtypes of Alzheimer’s disease with distinct clinical characteristics: a retrospective study. Lancet Neurol. 2011;10:785–796. doi: 10.1016/S1474-4422(11)70156-9. [DOI] [PMC free article] [PubMed] [Google Scholar]
- Oddo S, Caccamo A, Kitazawa M, Tseng BP, LaFerla FM. Amyloid deposition precedes tangle formation in a triple transgenic model of Alzheimer’s disease. Neurobiol Aging. 2003a;24:1063–1070. doi: 10.1016/j.neurobiolaging.2003.08.012. [DOI] [PubMed] [Google Scholar]
- Oddo S, Caccamo A, Shepherd JD, Murphy MP, Golde TE, Kayed R, Metherate R, Mattson MP, Akbari Y, LaFerla FM. Triple-transgenic model of Alzheimer’s disease with plaques and tangles: intracellular Abeta and synaptic dysfunction. Neuron. 2003b;39:409–421. doi: 10.1016/s0896-6273(03)00434-3. [DOI] [PubMed] [Google Scholar]
- Oddo S, Caccamo A, Tran L, Lambert MP, Glabe CG, Klein WL, LaFerla FM. Temporal profile of amyloid-beta (Abeta) oligomerization in an in vivo model of Alzheimer disease. A link between Abeta and tau pathology. J Biol Chem. 2006;281:1599–1604. doi: 10.1074/jbc.M507892200. [DOI] [PubMed] [Google Scholar]
- Palacino JJ, Sagi D, Goldberg MS, Krauss S, Motz C, Wacker M, Klose J, Shen J. Mitochondrial dysfunction and oxidative damage in parkin-deficient mice. J Biol Chem. 2004;279:18614–18622. doi: 10.1074/jbc.M401135200. [DOI] [PubMed] [Google Scholar]
- Pascual JM, Solivera J, Prieto R, Barrios L, Lopez-Larrubia P, Cerdan S, Roda JM. Time course of early metabolic changes following diffuse traumatic brain injury in rats as detected by (1)H NMR spectroscopy. J Neurotrauma. 2007;24:944–959. doi: 10.1089/neu.2006.0190. [DOI] [PubMed] [Google Scholar]
- Peterson TR, Sabatini DM. eIF3: a connecTOR of S6K1 to the translation preinitiation complex. Mol Cell. 2005;20:655–657. doi: 10.1016/j.molcel.2005.11.016. [DOI] [PubMed] [Google Scholar]
- Rebeck GW, Hoe HS, Moussa CE. Beta-amyloid1-42 gene transfer model exhibits intraneuronal amyloid, gliosis, tau phosphorylation, and neuronal loss. J Biol Chem. 2010;285:7440–7446. doi: 10.1074/jbc.M109.083915. [DOI] [PMC free article] [PubMed] [Google Scholar]
- Ritz MF, Schmidt P, Mendelowitsch A. Effects of isoflurane on glutamate and taurine releases, brain swelling and injury during transient ischemia and reperfusion. Int J Neurosci. 2006;116:191–202. doi: 10.1080/00207450500341555. [DOI] [PubMed] [Google Scholar]
- Rosen KM, Moussa CE, Lee HK, Kumar P, Kitada T, Qin G, Fu Q, Querfurth HW. Parkin reverses intracellular beta-amyloid accumulation and its negative effects on proteasome function. J Neurosci Res. 2010;88:167–178. doi: 10.1002/jnr.22178. [DOI] [PMC free article] [PubMed] [Google Scholar]
- Ruggero D, Pandolfi PP. Does the ribosome translate cancer? Nat Rev Cancer. 2003;3:179–192. doi: 10.1038/nrc1015. [DOI] [PubMed] [Google Scholar]
- Sabbagh MN, Cooper K, DeLange J, Stoehr JD, Thind K, Lahti T, Reisberg B, Sue L, Vedders L, Fleming SR, Beach TG. Functional, global and cognitive decline correlates to accumulation of Alzheimer’s pathology in MCI and AD. Curr Alzheimer Res. 2010;7:280–286. doi: 10.2174/156720510791162340. [DOI] [PMC free article] [PubMed] [Google Scholar]
- Shima H, Pende M, Chen Y, Fumagalli S, Thomas G, Kozma SC. Disruption of the p70(s6k)/p85(s6k) gene reveals a small mouse phenotype and a new functional S6 kinase. EMBO J. 1998;17:6649–6659. doi: 10.1093/emboj/17.22.6649. [DOI] [PMC free article] [PubMed] [Google Scholar]
- Shimura H, Hattori N, Kubo S, Mizuno Y, Asakawa S, Minoshima S, Shimizu N, Iwai K, Chiba T, Tanaka K, Suzuki T. Familial Parkinson disease gene product, parkin, is a ubiquitin-protein ligase. Nat Genet. 2000;25:302–305. doi: 10.1038/77060. [DOI] [PubMed] [Google Scholar]
- Skovronsky DM, Doms RW, Lee VM. Detection of a novel intraneuronal pool of insoluble amyloid beta protein that accumulates with time in culture. J Cell Biol. 1998;141:1031–1039. doi: 10.1083/jcb.141.4.1031. [DOI] [PMC free article] [PubMed] [Google Scholar]
- Wang X, Su B, Siedlak SL, Moreira PI, Fujioka H, Wang Y, Casadesus G, Zhu X. Amyloid-beta overproduction causes abnormal mitochondrial dynamics via differential modulation of mitochondrial fission/fusion proteins. Proc Natl Acad Sci U S A. 2008;105:19318–19323. doi: 10.1073/pnas.0804871105. [DOI] [PMC free article] [PubMed] [Google Scholar]
- Waskiewicz AJ, Flynn A, Proud CG, Cooper JA. Mitogen-activated protein kinases activate the serine/threonine kinases Mnk1 and Mnk2. EMBO J. 1997;16:1909–1920. doi: 10.1093/emboj/16.8.1909. [DOI] [PMC free article] [PubMed] [Google Scholar]
- Wilson CA, Doms RW, Lee VM. Intracellular APP processing and A beta production in Alzheimer disease. J Neuropathol Exp Neurol. 1999;58:787–794. doi: 10.1097/00005072-199908000-00001. [DOI] [PubMed] [Google Scholar]
- Xu H, Sweeney D, Wang R, Thinakaran G, Lo AC, Sisodia SS, Greengard P, Gandy S. Generation of Alzheimer beta-amyloid protein in the trans-Golgi network in the apparent absence of vesicle formation. Proc Natl Acad Sci U S A. 1997;94:3748–3752. doi: 10.1073/pnas.94.8.3748. [DOI] [PMC free article] [PubMed] [Google Scholar]