

Abstract
In vivo measurements of the mobility and binding kinetics of cellular components are essential to fully understand the biochemical processes occurring inside cells. Here, we describe a fluorescence recovery after photobleaching-based method that can be easily implemented to the study of reaction-diffusion processes in live bacteria despite their small size. We apply this method to provide new, to our knowledge, quantitative insight into multiple aspects of the bacterial translation cycle by measuring the binding kinetics and the micrometer-scale diffusive properties of the 50S ribosomal subunit in live Caulobacter cells. From our measurements, we infer that 70% of 50S subunits are engaged in translation and display, on average, limited motion on the micrometer scale, consistent with little mixing of transcripts undergoing translation. We also extract the average rate constants for the binding of 50S subunits to 30S initiation complexes during initiation and for their release from mRNAs when translation is completed. From this, we estimate the average time of protein synthesis and the average search time of 50S subunits before they engage in the next initiation event. Additionally, our experiments suggest that so-called free 50S subunits do not diffuse freely; instead their mobility is significantly slowed down, possibly through transient associations with mRNA.
Introduction
Decades of in vitro studies with purified cellular components or cell extracts have greatly contributed to our understanding of biological processes. However, although extremely valuable, studies in test tubes typically use well-mixed solutions that poorly resemble the cytoplasmic milieu. The cytoplasm is highly heterogeneous and spatially structured, including in bacteria (1). Furthermore, the cytoplasm is highly crowded, with a concentration of macromolecules up to 400 mg/ml in Escherichia coli (2). Macromolecular crowding causes space exclusion effects and reduces the effective diffusion of molecules. Furthermore, crowding can slow down cellular components through transient (electrostatic, hydrophobic, etc.) interactions with other components, which can also reduce biochemical reactions. Conversely, crowding can increase reactions by enhancing protein associations through attractive interactions (3–5). An additional level of complexity is added by constant metabolic activity in the cytoplasm, which makes the system operate far from thermodynamic equilibrium. Therefore, a complete understanding of any intracellular process requires measurements of both diffusion and interactions of the molecules of interest in live cells.
Fluorescence-based methods including fluorescence recovery after photobleaching (FRAP) microscopy have been successfully used to study reaction-diffusion processes in living systems. Methods of FRAP analysis generally rely on measuring fluorescence recovery at a specific spatial location in the cell (e.g., the photobleached region) over time following photobleaching; the data are then fitted with a theoretical recovery curve (6,7). These traditional methods are suitable for large cells such as most eukaryotic cells because cell geometry and spot location can be ignored (8). However, these methods of FRAP data analysis are unsuitable for small cells such as bacteria where cell geometry and bleaching location become relevant. Though FRAP-based methods have been used in bacteria for simple diffusion analysis of a single component such as free green fluorescent protein (GFP) or other fluorescent probes (5,9–15), most natural components of bacterial cells not only diffuse but also interact with other specific components to carry on their function. Hence, most molecules are present in distinct molecular states (free versus bound) in the cell, and the exchange kinetics between these states characterizes their activity. The current FRAP-based methods cannot reliably distinguish between different molecular states in live cells. This is especially problematic in bacterial cells, except in the relatively rare situation where these states are well separated in space (16).
Here, we describe a generalizable FRAP-based method to study reaction-diffusion processes in live bacteria. We applied this approach to gain new, to our knowledge, quantitative insight into the well-studied translation cycle. The translation cycle occurs in four phases—initiation, elongation, termination, and ribosome recycling. In bacteria, the initiation phase is a multistep process that includes the formation of the 30S initiation complex, followed by GTP hydrolysis-dependent irreversible docking of the 50S ribosomal subunit (17,18). The newly formed 70S initiation complex is then ready for the elongation phase during which protein synthesis occurs (19). Translation termination results in the release of the newly made protein. The 70S ribosome is then split into its subunits, which are recycled for new initiation events (20–22). Although there is a great deal of mechanistic understanding about the multiple steps in the translation cycle from genetic, in vitro, and structural studies, only the rate of protein synthesis during elongation has been measured in vivo (23–26). By examining the mobility and interactions of 50S ribosomal material in Caulobacter crescentus, we were able to extract the fraction of 50S subunits engaged in translation, the diffusive properties of the free and bound subunits on the micrometer scale, the binding rate constant of the 50S at initiation, and its release rate constant from the mRNA following termination. In turn, our live-cell measurements provide estimates of the average time of elongation and of the time spent by the free 50S subunits searching for the next 30S initiation complex. Our analysis also uncovers an unanticipated behavior for the free 50S subunits.
Material and Methods
Strains and mode of construction
Strain CJW3821 (CB15N ftsZ::pBJM rplA::pL1-GFPC-1) was constructed as follows. A ΦCR30 phage lysate carrying ftsZ::pBJM was obtained from strain YB1585 (27), and ftsZ::pBJM was transduced into strain CJW3365 (28). Strain CJW4005 (CB15N ftsZ::pBJM / pJS14PvanGFP) was generated as follows. The vanillate-inducible promoter (Pvan) was removed from plasmid pBlueSK-Pvan-long (gift from Dr. S. Hirano) by HindIII/NdeI digestion. In parallel, the gfp open reading frame was cut out from pGFPC-4 (29) by NdeI/NheI digestion. The Pvan and gfp DNA fragments were then triple-ligated with plasmid pJS14 digested with HindIII and XbaI. The resulting plasmid pJS14Pvan-gfp was introduced into YB1585 (CB15N ftsZ::pBJM) in which ftsZ is under xylose-inducible expression (27).
Growth conditions and cell synchronization
C. crescentus CJW3821 cells were grown at 30°C to exponential phase in peptone-yeast extract (PYE) medium containing 0.3% xylose to sustain expression of the cell division gene ftsZ. Synchronized populations of swarmer cells were obtained as described (30). Swarmer cells were resuspended in prewarmed PYE medium lacking xylose and grown at 30°C for 3–4 h to achieve FtsZ depletion and 10–20 μm long cell filaments. CJW4005 cells were grown in PYE medium containing 0.3% xylose and chloramphenicol (2 μg/ml). They were washed three times and incubated in prewarmed PYE medium lacking xylose for 3–4 h. One hour before the FRAP experiment, 0.5 mM vanillic acid was added to the culture to induce GFP synthesis. Where indicated, cell cultures were supplemented with 200 μg/ml rifampicin for 1–2 h to deplete the cells of mRNA.
Microscopy and photobleaching experiments
Filamentous cells were immobilized on 1.8–2% agarose pads with M2G + 2% PYE containing 500 μM DNP (which results in complete growth inhibition, data not shown), 50 μg/ml rifampicin and/or 100 μg/ml kasugamycin when appropriate. Cell imaging was performed at room temperature (∼22°C) using a Nikon E80i microscope equipped with 100X phase contrast objective and an Andor iXonEM+ DU-897 camera controlled by the Metamorph software. Fluorescence photobleaching was performed using a Photonic Instrument Micropoint laser system at the wavelength 488 nm. The cells were imaged once before photobleaching, bleached (for 0.33–0.67 s depending on the experiment), and imaged at equal intervals (0.129 to 1 s for 4–300 s depending on the experiment). Image analysis was performed using MicrobeTracker (31). To examine whether any fluorescence recovery was due to the maturation or the synthesis of L1-GFP during image acquisition, whole cells were photobleached by using repeated short laser pulses along the entire cell length, which was followed by time-lapse imaging.
Results and Discussion
A whole-cell simulation-based method for FRAP analysis
Although we developed our method to study complex dynamics (beyond a single diffusing species), we first validated the approach and examined the simple diffusive motion of free GFP (Fig. 1 A). Because GFP is not a natural component of the bacterial cytoplasm, it is not involved in any specific interactions and has therefore been used to evaluate the viscosity of the cytoplasm (15,32,33). In our experiments, we used filamentous (FtsZ-depleted) cells (34) producing GFP to extend the timescale of the process to a measurable level (9,12). We photobleached a small region (Fig. 1 B), and recorded the postbleaching fluorescence dynamics.
Figure 1.

FRAP analysis of GFP diffusion. (A) Schematic representation of the single-component diffusion model used for the analysis of GFP fluorescence dynamics. (B) Fluorescence micrographs of a representative FtsZ-depleted CJW4005 cell showing the dynamics of the GFP fluorescence signal in the cell after photobleaching. Selected images of the time-lapse sequence and a schematic representation of the process are shown. (C) Kymograph showing postbleaching fluorescence dynamics in the cell shown in (B). (D) Best-fit kymograph. (E) Residuals (errors) of the fit. Note that the scale of the heat map for the residuals is 10 times smaller than the scale for the kymograph in (C) and (D). (F) Distribution of DGFP values for all 31 cells analyzed.
For data analysis, we considered the fluorescence dynamics of the entire cell represented in the form of kymographs (Fig. 1 C, see the Supporting Material for their mode of construction). As mentioned previously, methods of FRAP data analysis often examine fluorescence information at single locations (e.g., the fluorescence recovery at the photobleached spot) over time, thereby discarding valuable information that could be exploited to reduce noise sensitivity and increase precision in parameter estimation (this becomes especially important in cases where the dynamics is more complex than simple diffusion; see below).
To estimate the parameter values of the model (such as the values of the diffusion coefficients and binding rate constants), we then simulated the postbleaching fluorescence pattern (see the Supporting Material). Simulations, unlike commonly used analytical solutions, automatically take into account the geometry of the cell as well as the shape and location of the photobleached spot. In the simulations, we described the underlying biological process with a system of reaction-diffusion partial differential equations and computed their time-dependent solutions using the finite difference method (35). We then performed fitting by minimizing the squared difference (fit score, see the Supporting Material) between the simulated and the experimental kymographs to obtain the parameter values that best approximate the experimental dynamics. The quality of the fit was additionally judged by plotting the map of residuals between simulated and experimental kymographs. In the simple case of GFP diffusion, the fluorescence recovery dynamics was simulated using a model consisting of a single diffusing component (Fig. 1 A, see the Supporting Material for equations—Eqs. S4–S6—and details). Simulations produced an optimal simulated kymograph (Fig. 1 D) that was very similar to the experimental one (Fig. 1 C) in both photobleached and nonphotobleached regions as well as over time, with the map of residuals showing uniformly low error across the field (Fig. 1 E, note that the heat-map scale for the residuals is 10-fold smaller than for the kymographs).
Our analysis provided a diffusion coefficient DGFP = 8.4 ± 1.3 μm2/s (mean ± standard deviation) in the C. crescentus cytoplasm. Note that because FRAP microscopy informs about the diffusive properties of a fluorescently labeled molecule at the micrometer scale, any diffusion coefficients deduced in this FRAP study will be hereafter referred to as micrometer-scale diffusion coefficients. Both the mean value and the degree of cell-to-cell variability (Fig. 1 F) of DGFP are in very good agreement with published values (6–12 μm2/s) for GFP and derivatives in E. coli (5,9–13,36). In E. coli, the DNA is confined within a region called nucleoid and the ribosomes are enriched outside the nucleoid, whereas in C. crescentus, the ribosomes and DNA spread throughout the cell (28,37–39). The similarities in mean values and cell-to-cell variability for DGFP in E. coli and C. crescentus indicate that despite major structural differences in nucleoid organization and ribosome distribution, the cytoplasmic viscosity is similar in these two bacterial species, at least on the micrometer scale.
Fraction of ribosomes engaged in translation
As mentioned previously, ribosomes have a dispersed distribution throughout the cytoplasm of C. crescentus (28,39). To track 50S subunits, we fluorescently tagged L1 ribosomal protein and expressed the L1-GFP fusion as the only copy of L1 from the native promoter in an FtsZ-depletion strain. The observations that the L1 protein is incorporated into 50S subunits, with the amount of freely diffusing form being very small (40), that the L1-GFP is functional (28), and that inhibition of cell division does not affect transcription or protein synthesis in bacteria (41,42) suggest that the dynamics of L1-GFP in cell filaments are likely to reflect the normal dynamics of 50S subunits.
The 50S subunits are present in the cells either as free, that is, not engaged in translation, or bound, that is, associated to mRNA as part of a translational complex. These two forms are expected to have very different mobility. On one hand, the free form, which consists of 50S subunits and any potentially free 70S ribosomes, is expected to display relatively fast diffusion and to rapidly mix in the cytoplasm based on their sizes. On the other hand, visualization of different mRNAs in C. crescentus revealed that these transcripts largely remain in the vicinity of their respective site of transcription for their lifetime (28), implying that translating ribosomes display restricted motion. This is in agreement with recent single-molecule experiments in E. coli that examined the motion of ribosomes at high spatial resolution (36,43). These studies showed that ribosomes move relatively fast at the nanometer scale, but that this motion remains spatially confined within microdomains. Thus, at the micrometer scale, which is the spatial scale of FRAP microscopy, these ribosomes are expected to display very little motion, especially in comparison to the free 50S subunits. Hence, as a first step, we used a two-component dynamical system to describe the 50S fluorescence dynamics, with a fast-diffusing component of free 50S form and a comparatively slower component that consists of bound 50S form. In this system, the process of translation depends on the micrometer-scale diffusion coefficients of both components (DF and DB, for the free and the bound 50S forms, respectively) and on the exchange rate constants between these two components (kB and kR, for the binding and release rate constants, respectively) (Fig. 2 A, see the Supporting Material for details, Eqs. S2, S4, and S5). The equilibrium between the two exchange rate constants determines the fraction of bound ribosomes FB = kB/(kR+kB), an important characteristic of the 50S ribosomal dynamics. The reaction parameters can therefore be replaced with FB and the combined reaction constant kR+B = kR+kB, resulting in a reaction-diffusion model that is characterized by four parameters: DF, DB, FB, and kR+B (Eqs. S3–S5).
Figure 2.
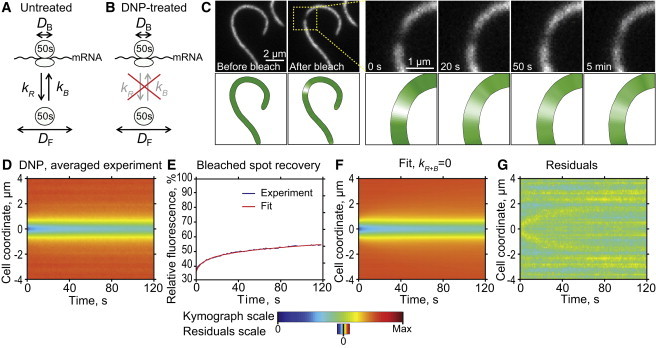
In situ estimation of the fraction of bound ribosomes (FB) in energy-depleted (DNP-treated) cells. (A) Schematics of the reaction-diffusion model describing 50S dynamics in untreated cells. (B) Schematics of the simplified model in which the exchange rate constants are considered null in DNP-treated cells. (C) Fluorescence micrographs of a representative DNP-treated CJW3821 cell filament showing selected frames of the FRAP experiment. Postbleaching time-lapse imaging shows that there is little recovery of L1-GFP fluorescence at the bleached spot after 5 min. (D) Experimental kymograph showing the averaged postbleaching fluorescence signal dynamics measured for 56 DNP-treated cell filaments. (E) Integrated fluorescence recovery at the photobleached spot (± 0.3 μm around the center of the spot). (F) Simulated best-fit kymograph with kR+B = 0. (G) Map of residuals of the fit.
Because of the noise in the experimental data and the nonlinear dependency between parameters (data not shown), it is, however, difficult to determine these four parameters simultaneously with great precision. We therefore implemented two approaches to address this problem. First, we reduced the noise in the experimental data by averaging the kymographs of multiple cells (see the Supporting Material and Fig. S1). Second, we reduced the number of parameters by simplifying the biological system. To do this, we treated cells with the oxidative phosphorylation uncoupling agent 2,4-dinitrophenol (DNP). DNP has been shown to deplete cellular GTP and ATP levels in bacteria (44). Because all phases of translation are dependent on cellular energy, DNP efficiently stalls the 50S subunits in their current state, whether they are free or bound (44–47). Hence, association and dissociation between ribosomal subunits and translational complexes are not expected in DNP-treated cells, reducing the system to independent diffusions of the two (free and bound) ribosomal subpopulations. Such dynamics can be represented by a model in which the exchange of ribosomes between the free and bound states is essentially eliminated (Fig. 2 B), whereas the fraction of bound ribosomes FB (determined by the equilibrium between the binding and release rate constants before DNP addition) remains unaffected. Therefore, the dynamics in DNP-treated cells can be modeled by setting kR+B = 0, reducing the model to three parameters: FB, DB, and DF (see the Supporting Material).
We performed FRAP experiments on cell filaments producing L1-GFP in the presence of DNP (Fig. 2 C). The imaging data were then used to construct an averaged kymograph to reflect the fluorescence dynamics for the cell population (Fig. 2 D). Strikingly, the kymograph showed that there was little fluorescence recovery occurring at the bleached spot during the postbleaching imaging. Some relatively small recovery did, however, happen at the early times (<30 s), which can be more easily seen on the integrated profiles at the bleached spot (Fig. 2 E). This likely reflects two ribosomal populations with different mobilities at the micrometer scale, the slow moving 50S-bound form (i.e., the mRNA-bound ribosomes engaged in translation), and the comparatively faster moving free 50S form (i.e., free 50S subunits plus free 70S ribosomes if present). As a control, we showed that any contribution from the maturation or the de novo synthesis of L1-GFP is negligible during image acquisition for up to 9 min (Fig. S2).
We fitted the experimental kymograph for DNP-treated cells with the simplified model in which kR+B = 0 (Fig. 2 B, see the Supporting Material). The best-fit simulated kymograph (Fig. 2 F) shows excellent similarity with the experimental kymograph (Fig. 2 D). This similarity can also be seen from the relatively flat map of residuals (Fig. 2 G). The obtained values of the parameters (Table S1) are FB = 0.70 ± 0.02 and DF = 0.018 ± 0.003 μm2/s (n = 56 cells), with the errors indicating 95% confidence intervals (see the Supporting Material and Fig. S3). DB was very low, with an upper bound of 0.0002 μm2/s (Fig. S3).
Our data show that FB is equal to 0.70 ± 0.02, suggesting that ∼70% of 50S ribosomal subunits are engaged in the translation process, whereas ∼30% of them constitute the pool of free subunits. This value is within the range of fractions of polyribosomes (50–85%) that have been estimated in E. coli from sucrose-gradient sedimentation experiments (48–52), which provides validation to our method. The large variability in estimates of polyribosome fraction in E. coli is thought to come from differences in extraction conditions (48,50–52). Our method provides an alternative, extraction-independent method for estimating the fraction of ribosomes engaged in translation in live cells.
Exchange rate constants and micrometer-scale diffusion coefficients of free 50S subunits and translating ribosomes in untreated cells
Next, we performed FRAP experiments on untreated cell filaments in which association and dissociation of 50S ribosomal subunits from mRNAs occur normally during the initiation and ribosome recycling phases. The resulting averaged kymograph showed that the postbleaching fluorescence dynamics in untreated cells (Fig. 3 A) was faster than the one observed in DNP-treated cells (Fig. 2 D), indicating that a large portion of the fluorescence dynamics derives from the exchange of the ribosomal subunits.
Figure 3.
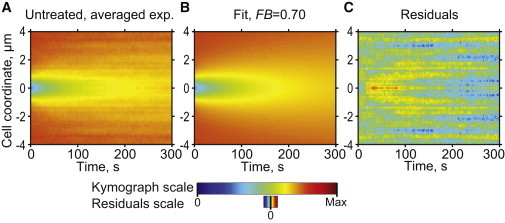
Ribosomal 50S dynamics in untreated cells. (A) Experimental kymograph showing the averaged postbleaching fluorescence signal dynamics measured for 21 untreated CJW3821 cells producing GFP-labeled 50S subunits. (B) Simulated best-fit kymograph when FB is fixed at 0.70 (DB, DF, and kR+B being optimized). (C) Residuals of the fit.
For the data analysis, we fixed the fraction of bound ribosomes at FB = 0.70, the average value estimated from the DNP experiments, and minimized the fit score by varying the rest of the parameters (DF, DB, and kR+B). Fixing at least one parameter helped solve the issue of parameter dependence and therefore increased the precision of parameter estimations. FB was fixed over DF and DB because the value of FB, unlike that of DF and DB, had a strong effect on the estimated values of the other parameters (data not shown) and the estimation of the FB value in the DNP experiments was more precise than that of DF and DB (Fig. S3). Additionally, fixing FB over DF and DB eliminated potential errors coming from the possibility that depletion of cellular energy by DNP treatment might alter the diffusive properties for the free and bound 50S forms, as recently shown for chromosomal loci (53). For FB fixed at 0.7, the best fit was obtained for DF = 0.042 ± 0.003 μm2/s and kR+B = 0.059 ± 0.013 s−1 (errors represent 95% confidence intervals; see the Supporting Material, Fig. S3, and Table S1; n = 21 cells). DB value was very low, with an upper bound value of 0.0011 μm2/s (Fig. S3). The simulated kymograph obtained with the best-fit values (Fig. 3 B) closely approximates the experimental kymograph (Fig. 3 A), as shown by the quality of the residual map (Fig. 3 C).
Because kR+B = kR + kB and FB = kB/ kR+B, each rate constant can be estimated separately as follows (see Table S1): kR = (1-FB)·kR+B = 0.018 ± 0.004 s−1 and kB = FB·kR+B = 0.041 ± 0.009 s−1. The release rate constant kR relates to the mean residence time τR of a ribosome on mRNA. Because τR = 1/ kR, we estimate τR = 57 ± 12 s, indicating that on average, ribosomes remain engaged in translation for ∼60 s before dissociating from their mRNA template. Most previous estimates (although not all (26)) reflect the translation time for particular mRNA species (e.g., lacZ mRNA), and it is unclear if these mRNAs are representative of the average because recent ribosome profiling experiments indicate that the rate of protein synthesis can vary over five orders of magnitude among transcripts (54). Our estimates, on the other hand, reflect the average of translational processes over all ribosomal subunits in a cell, properly weighted over all expressed mRNA species, which is most relevant for cellular physiology.
From our value for the average translation time and from the average transcript length in C. crescentus, we obtain a rough estimate of an average speed of translation in the range of 6–15 codons per second under our experimental condition (see the Supporting Material; note that a more precise determination of the average translation speed would require genome-wide measurements of mRNA levels and ribosome densities on each mRNA from transcriptome and ribosome profiling studies in C. crescentus). E. coli studies have reported rates of 13–22 codons per second depending on the experimental conditions and method used (55–58).
From the binding rate constant kB, we can infer that a 50S subunit spends on average ∼25 s (τB = 1/kB = 24 ± 5 s) searching for the next 30S initiation complex. Given the DF value in untreated cells (DF = 0.042 ± 0.003 μm2/s), 25 s is sufficient for the nontranslating 50S subunit to travel ∼1.4 μm, indicating that once released, 50S subunits rapidly mix and translate a different transcript after each round of translation rather than performing multiple rounds of protein synthesis on the same mRNA template.
Based on the measured values of the translation time and of DB, we calculate that translating ribosomes travel on average up to . The spatial confinement of translating ribosomes should limit the mixing of mRNA species being translated, which, in turn, may contribute to the previously proposed formation of functional microdomains in the cytoplasm where a local increase in concentration of newly synthesized proteins may promote rapid protein complex formation and affect the speed of biochemical reactions (5,28).
Is the mobility of the free 50S subunits restrained?
From the Einstein-Stokes equation, the diffusion coefficient is inversely proportional to particle size. The diffusion coefficient for free GFP in C. crescentus is ∼8 μm2/s (Fig. 1 F). Therefore, 50S subunits, which are ∼8 times bigger in linear dimensions than GFP molecules (59–61), would be expected to diffuse only 8 times slower, with a diffusion coefficient of ∼1 μm2/s or 25 times higher than the DF value determined from the FRAP data.
We considered two possible, nonexclusive possibilities for the difference between the expected and measured diffusion coefficients for the free 50S subunits. First, the crowded cytoplasm may act as a molecular sieve that disproportionally decreases diffusion coefficients with increasing particle sizes (5,11,62,63). Second, the mobility of free 50S subunits may be slowed down inside cells by transiently interacting with less mobile components, which, we speculated, might include mRNAs. To test this latter hypothesis, we performed FRAP experiments on cells depleted of mRNAs, obtained by pretreating cell filaments with rifampicin for 1–2 h. Because rifampicin inhibits the initiation of transcription, the pool of mRNAs is rapidly depleted by natural decay (64). Therefore, in rifampicin-treated cells, virtually all interactions of ribosomal subunits with mRNA are eliminated, and all 50S subunits are expected to diffuse freely, resulting in a one-component diffusion system (Fig. 4 A).
Figure 4.

Effect of rifampicin-treatment on the diffusion coefficient of free 50S ribosomal subunits. (A) Schematics of the simple diffusion model used for analyzing FRAP data of rifampicin-treated cell filaments (± DNP). (B) Experimental kymograph of a representative rifampicin-treated CJW3821 cell. (C) Simulated kymograph at optimum (DF = 0.36 μm2/s). (D) Residuals of the fit. (E) Integrated fluorescence recovery at the photobleached spot. (F) Histogram of DF values obtained for cells untreated with drugs (n = 21 cells), treated with DNP (n = 56 cells), treated with rifampicin (n = 21 cells), pretreated with rifampicin and then treated with DNP (n = 23 cells), and treated with kasugamycin (n = 14 cells). The errors indicate 95% confidence intervals. (G–I) Same as (C–E) except that simulation was done with DF fixed at 0.042 μm2/s (which is the DF value obtained for the untreated cells). (J) Fluorescence micrographs of representative DAPI-stained CJW3821 cell filaments before (left panels) and after treatment with rifampicin (right panels). (K–N) Same as (B–E) except for a rifampicin-treated cell spotted on a pad that contains DNP in addition to rifampicin.
The equilibration of fluorescence signal in rifampicin-treated cells was very rapid, with a characteristic timescale of seconds (Fig. 4 B). Because of the fast fluorescence dynamics, the cells were analyzed individually (see the Supporting Material). Fitting the FRAP data with a simple single-component diffusion model provided a good fit (Fig. 4, C–E), yielding an estimate for the micrometer-scale diffusion coefficient of the free ribosomal subunit, DF = 0.39 ± 0.09 μm2/s (error indicates 95% confidence interval; n = 21 cells, Table S2). This value is ∼10-fold higher than the DF value obtained for untreated cells (Fig. 4 F). Approximating the rifampicin data with the DF value obtained for untreated cells (DF = 0.042 μm2/s) failed by producing a very poor fit (Fig. 4 G–I), indicating that the 10-fold difference between untreated and rifampicin-treated cells cannot be explained by estimation errors.
In addition, this difference could not be explained by major changes in cytoplasmic viscosity because we observed little changes in the diffusion of free GFP in rifampicin-treated cells (see the Supporting Material and Fig. S4). We also verified by DAPI staining that the difference in mobility is unlikely to be due to a change in DNA localization. In E. coli, the DNA region (i.e., nucleoid) expands when the cells are treated with rifampicin (65). In contrast, in normal (66) or FtsZ-depleted (Fig. 4 J) C. crescentus cells, the DNA region already spreads throughout the cell body even without rifampicin treatment, as shown by DAPI staining. There was no discernible difference in DNA localization after rifampicin treatment (Fig. 4 J).
Additionally, the 10-fold increase in DF between untreated and rifampicin-treated cells cannot be explained by the detachment and free diffusion of L1-GFP whose expected diffusion coefficient is ∼17-fold higher than DF in rifampicin-treated cells (see the Supporting Material). Moreover, when we treated cells with kasugamycin, we obtained a DF value (DF = 0.36 ± 0.07 μm2/s, n = 14 cells, Table S2) comparable to the DF value obtained for rifampicin-treated cells (Fig. 4 F). Kasugamycin treatment, by inhibiting the initiation of translation, results in the instability and hence depletion of mRNAs (67,68) while keeping the 50S subunit intact (69).
These results suggest that in untreated cells, the nontranslating (free) 50S subunits may transiently interact with mRNAs (directly or indirectly), effectively slowing down their diffusion by ∼10-fold. The 10-fold reduction would then indicate that the so-called free 50S subunits (∼30% of the total 50S subunits) spend at most ∼1/10 of their time in free state and ∼9/10 of their time bound, probably to mRNAs.
The observation that the DF value in DNP-treated (depleted of cellular energy) cells was also over an order of magnitude lower than in rifampicin-treated (i.e., mRNA-depleted) cells (Fig. 4 F) suggests that the transient interactions causing the reduction in effective micrometer-scale diffusion coefficient do not require cellular energy. As a control, we showed that when cells were already depleted of mRNAs (i.e., pretreated with rifampicin for 1–2 h), addition of DNP had no significant effect on diffusion, with the DF value (0.31 ± 0.05 μm2/s, n = 23 cells, Fig. 4, K–N, Table S2) similar to that of rifampicin-treated cells (Fig. 4 F). These interactions would therefore be distinct from the energy-dependent association of 50S with the 30S initiation complex (which includes the mRNA) that results in the formation of the stable 70S initiation complex. Because we did not detect any fast dynamics in the first few frames after photobleaching (at 1 frame/s measurement rate, Figs. 2 D, 3 A) that were unexplained by the model, it implies that the typical residence time of these interactions would be below a few seconds. Such interactions are too transient for the complex to be maintained during the hour-long centrifugation of traditional sedimentation assays, which would explain why they went undetected in past studies (70,71). These transient interactions may reflect previously unseen GTP-independent reversible associations of the 50S with the mRNA at the 30S initiation complex or at nonspecific sequences, possibly through other factors. It is conceivable that such reversible interactions may help the 50S subunit interact with or search for the 30S initiation complex.
Considering a three-component model
Our interpretations are based on a two-component model that considers a fast moving free 50S form and a comparatively slower bound form, which would correspond to the nontranslating and translating 50S subunit material, respectively.
In this context, the obtained DF and DB values for each form reflect the average values of a distribution. For DB, we expect the distribution to be wide because it represents ribosomes translating nascent and full-length transcripts, both characterized by different sizes and carrying different numbers of ribosomes. It also includes ribosome-mRNA complexes encoding nascent trans-membrane proteins associated with the membrane.
Given this wide distribution, we wanted to assess the quality of our approximations and test if the same conclusions could be made if we increase the number of bound components in the model. We therefore consider a three-component model with one free form and two bound forms with different micrometer-scale diffusive properties. For example, one could envision one of the two bound forms to represent ribosomes translating nascent mRNAs, which are tethered to the DNA via the RNA polymerase, and the other, comparatively faster moving bound form to consist of ribosomes translating full-length mRNAs after their release upon completion of transcription. In this three-component model (see Eqs. S8–S10 for details) the free 50S subunit is characterized by DF and the two subpopulations of bound 50S involved in translation are characterized by different micrometer-scale diffusion coefficients, DB1 and DB2. Exchanges between the free form and the two bound forms are characterized by respective binding rate constants kB1, kB2, and a common release rate constant kR (assuming that the translation time is the same for both forms of translational mRNA-ribosome complexes). Similar to the two-component model, the parameters of the three-component model were converted to the fractions of two bound forms FB1 = kB1/kB1+B2+R and FB2 = kB2/kB1+B2+R, and the combined reaction rate constant kB1+B2+R = kB1 + kB2 + kR.
First, we considered the possibility that the DF value obtained for rifampicin-treated cells characterizes the free fraction of the 50S subunits even when mRNA are present, and that the lower DF values obtained for untreated and DNP-treated cells with the two-component model represent a diffusing 50S-bound form, instead of the free form. To test this possibility, we fitted the FRAP data with our three-component model in which DF was fixed at 0.4 μm2/s, the value obtained in rifampicin-treated cells. For the FRAP data of DNP-treated cells for which the combined reaction rate was fixed at kB1+B2+R = 0 because of the lack of exchange between ribosomal forms (Fig. 5, A and B), the best fit with DF = 0.4 μm2/s was characterized by DB1 = 0.00011 μm2/s, DB2 = 0.012 μm2/s, FB1 = 0.68, and FB2 = 0.29. The obtained value for the combined fraction of bound subunits (FB1 + FB2) means that virtually all (97%) 50S subunits would be engaged in translation. This would contradict the 50–85% range of active ribosomes reported in the literature (48–52). Indeed, sucrose gradient centrifugation experiments with C. crescentus extracts show a sizeable fraction of free 50S subunits (72), arguing against the possibility that the DF value obtained for rifampicin-treated cells characterizes the free fraction of the 50S subunits even when mRNA are present. For untreated cells (Fig. 5, C and D), the fit using the three-component model with DF = 0.4 μm2/s resulted in the following values: DB1 = 0 μm2/s, DB2 = 0.0013 μm2/s, FB1 = 0.13, FB2 = 0.83, and kB1+B2+R = 0.095 s−1. Again, the combined fraction of bound subunits (FB1 + FB2 = 96%) was too high to be plausible. These results argued against the possibility that the lower DF values obtained for untreated and DNP-treated cells were misrepresented by the two-component model.
Figure 5.

Analysis of the FRAP data using a three-component model. (A) Schematic representation of the three-component diffusion model for DNP-treated cells. (B) Experimental data for DNP-treated cells (same as Fig. 2D) and a fit with the fixed kR+B1+B2 and DF values. (C) Schematic representation of the three-component diffusion model for untreated cells. (D) Experimental data for untreated cells (same as Fig. 3A) and a fit with the fixed DF value. (E) Experimental data for DNP-treated cells (same as Fig. 2D) and a fit with the fixed kR+B1+B2 value. (F) Experimental data for untreated cells (same as Fig. 3A) and a fit with fixed FB1 and FB2 values.
Second, we fitted the FRAP data obtained for DNP-treated cells with the three-component model in which all parameters (including DF) were left free to vary except for kB1+B2+R = 0 because exchanges between 50S subpopulations are abrogated with DNP treatment (Fig. 5 E). The best fit resulted in the values DF = 0.019 μm2/s, DB1 = 0.0005 μm2/s, DB2 = 0 μm2/s, FB1 = 0.31, and FB2 = 0.40 (Table S3). Fitting the untreated cell data while fixing the fractions of the bound ribosomes (i.e., setting FB1 = 0.31 and FB2 = 0.40; Fig. 5 F) resulted in DF = 0.043 μm2/s, DB1 = 0.0047 μm2/s, DB2 = 0.00043 μm2/s, kB1+B2+R = 0.036 s−1 (Table S3). Thus, even when considering the existence of two distinguishable subpopulations of bound ribosomes, the DF value remained low comparatively to the DF value obtained in mRNA-depleted cells treated with rifampicin or kasugamycin. The micrometer-scale diffusion coefficients (DB1 and DB2) of the two bound forms of 50S were both low, and the combined fraction of bound 50S subunits (FB1 + FB2 = 0.71) remains similar to the one obtained with the two-component model (FB = 0.70). Thus, even if the population of bound 50S subunits engaged in translation is heterogeneous, its mobility is low, confirming our previous conclusions. The results with the three-component model show that adding a component does not help explain the experimental data and does not alter our conclusions.
A method for analysis of cellular dynamics
The bacterial translation cycle has been intensely studied for decades. Here, we provide new, to our knowledge, quantitative insight into this multiphasic cycle (Fig. 6 and Tables S1–S2) by examining the mobility and binding kinetics of 50S subunits in live C. crescentus cells. From our in situ measurements, we infer that 70% of 50S subunits are engaged in translation and that free 50S subunits are rapidly mixed in the cytoplasm in contrast to ribosomes undergoing translation, which display little long-range motion. Furthermore, we obtained, for the first time, to our knowledge, live-cell estimates of the rate constants for the binding of 50S subunits to 30S initiation complexes during initiation and for their release from mRNAs when translation is completed. From this, we determine the average time for mRNA translation and the average search time of 50S subunits before they engage in the next initiation event. In addition, our experiments suggest the possibility that contrary to common beliefs, the so-called “free” 50S subunits may not diffuse freely; instead their mobility is significantly slowed down, likely through transient (direct or indirect) associations with mRNAs.
Figure 6.

Schematic representation of the proposed 50S subunit pathway. The 50S ribosomal subunits are shown in three states based on their mRNA association: free (light gray), transiently associated with mRNA (medium gray), and stably associated with mRNA as part of a translational 70S complex (dark gray). The fraction of total 50S subunits involved in each stage is shown. During the nontranslating stage, the subunit transiently switches between free and associated states, slowing down its diffusion. These transient associations do not require cellular energy, and are proposed to involve mRNA. For example, these interactions may correspond to reversible associations with the 30S initiation complex at the RBS before the formation of the stable translation-competent 70S initiation complex (70SIC). It is also possible that 50S associates with mRNA elsewhere, possibly through an intermediate factor (X). The average lifetime of the nontranslating stage is τB = 1/kB ∼25 s. Stable association of 50S with the 30S initiation complex occurs at an average rate constant of kB ≈ 0.041 s−1; this irreversible step requires GTP hydrolysis and results in 70SIC formation. This is followed by mRNA translocation and protein synthesis for τR = 1/kR ∼60 s, after which the 50S subunit dissociates from posttermination complex at a rate constant of kR ≈ 0.018 s−1, restarting the cycle.
Our methodology is complementary to existing in vitro and in vivo methods by combining several characteristics particularly important for physiological studies in bacteria. It provides live-cell measures of multiple parameters of a reaction-diffusion process in the same experiment and therefore under the same experimental conditions. Although our FRAP-based methodology is not able to resolve spatial scales below the diffraction limit of light microscopy, it is useful for examining diffusive properties on the bacterial cell dimension (i.e., micrometer) scale and on longer time scales than, for example, single-molecule tracking approaches. On the other hand, single-molecule approaches are more effective in investigating short-range motion while being generally limited to a certain timescale (<0.5 s) because the fluorophore rapidly photobleaches and increasing the time intervals between images decreases the reliability of tracking. For very fast diffusing components (e.g., metabolites), pulsed-FRAP may be more effective than the more conventional FRAP microscopy (14). Hence, FRAP and single-molecule methods are complementary by providing information at different spatial and temporal scales. Our FRAP-based approach is also efficient in measuring kinetics of binding reactions, and it can be applied to study both slow and fast processes. Importantly, the parameter values reflect the average (and therefore physiologically relevant) behavior of the molecules involved in the reaction-diffusion system. For example, in our study, all ribosomes and all mRNAs present in the cells are being automatically considered. One limitation, however, is that when the number of reaction-diffusion parameters increases, our approach requires averaging data in multiple cells to obtain reliable estimates, and therefore does not inform about cell-to-cell variability.
Our methodology can be implemented for the study of virtually any reaction-diffusion process (e.g., transcription, DNA repair, RNA processing, etc.) that involves association and dissociation of a cellular component with a substantially larger target (DNA, RNA, or a large complex), thus achieving a sufficient change in mobility. The method can also be applied to systems where a protein switches between a cytoplasmic and a membrane-bound state, such as the Min oscillator of E. coli. Furthermore, measurements of the system properties could be obtained under different growth conditions, drug treatment, or in strains bearing different mutations, further extending the reach of these studies.
Acknowledgments
We thank Dr. Setsu Hirano for the pBlueSK-Pvan-long plasmid, Dr. Gang Fang for a C. crescentus genome analysis, Drs. Peter Moore, Thomas Steitz, and Gregor Blaha for helpful discussion, and the Jacobs-Wagner lab members for valuable input and for critical reading of the manuscript.
This work was funded by the National Institutes of Health (GM065835 to C. J.-W.).
C. J.-W. is an investigator of the Howard Hughes Medical Institute.
Footnotes
Paula Montero Llopis’s current address is Department of Microbiology and Immunobiology, Harvard Medical School, Boston, Massachusetts 02115.
Supporting Material
References
- 1.Spitzer J. From water and ions to crowded biomacromolecules: in vivo structuring of a prokaryotic cell. Microbiol. Mol. Biol. Rev. 2011;75:491–506. doi: 10.1128/MMBR.00010-11. [DOI] [PMC free article] [PubMed] [Google Scholar]
- 2.Zimmerman S.B., Trach S.O. Estimation of macromolecule concentrations and excluded volume effects for the cytoplasm of Escherichia coli. J. Mol. Biol. 1991;222:599–620. doi: 10.1016/0022-2836(91)90499-v. [DOI] [PubMed] [Google Scholar]
- 3.Zhou H.X., Rivas G., Minton A.P. Macromolecular crowding and confinement: biochemical, biophysical, and potential physiological consequences. Annu. Rev. Biophys. 2008;37:375–397. doi: 10.1146/annurev.biophys.37.032807.125817. [DOI] [PMC free article] [PubMed] [Google Scholar]
- 4.Minton A.P. How can biochemical reactions within cells differ from those in test tubes? J. Cell Sci. 2006;119:2863–2869. doi: 10.1242/jcs.03063. [DOI] [PubMed] [Google Scholar]
- 5.Mika J.T., Poolman B. Macromolecule diffusion and confinement in prokaryotic cells. Curr. Opin. Biotechnol. 2011;22:117–126. doi: 10.1016/j.copbio.2010.09.009. [DOI] [PubMed] [Google Scholar]
- 6.Sprague B.L., McNally J.G. FRAP analysis of binding: proper and fitting. Trends Cell Biol. 2005;15:84–91. doi: 10.1016/j.tcb.2004.12.001. [DOI] [PubMed] [Google Scholar]
- 7.McNally J.G. Quantitative FRAP in analysis of molecular binding dynamics in vivo. Methods Cell Biol. 2008;85:329–351. doi: 10.1016/S0091-679X(08)85014-5. [DOI] [PubMed] [Google Scholar]
- 8.Hallen M.A., Layton A.T. Expanding the scope of quantitative FRAP analysis. J. Theor. Biol. 2010;262:295–305. doi: 10.1016/j.jtbi.2009.10.020. [DOI] [PubMed] [Google Scholar]
- 9.Elowitz M.B., Surette M.G., Leibler S. Protein mobility in the cytoplasm of Escherichia coli. J. Bacteriol. 1999;181:197–203. doi: 10.1128/jb.181.1.197-203.1999. [DOI] [PMC free article] [PubMed] [Google Scholar]
- 10.Konopka M.C., Shkel I.A., Weisshaar J.C. Crowding and confinement effects on protein diffusion in vivo. J. Bacteriol. 2006;188:6115–6123. doi: 10.1128/JB.01982-05. [DOI] [PMC free article] [PubMed] [Google Scholar]
- 11.Kumar M., Mommer M.S., Sourjik V. Mobility of cytoplasmic, membrane, and DNA-binding proteins in Escherichia coli. Biophys. J. 2010;98:552–559. doi: 10.1016/j.bpj.2009.11.002. [DOI] [PMC free article] [PubMed] [Google Scholar]
- 12.Mullineaux C.W., Nenninger A., Robinson C. Diffusion of green fluorescent protein in three cell environments in Escherichia coli. J. Bacteriol. 2006;188:3442–3448. doi: 10.1128/JB.188.10.3442-3448.2006. [DOI] [PMC free article] [PubMed] [Google Scholar]
- 13.Bakshi S., Bratton B.P., Weisshaar J.C. Subdiffraction-limit study of Kaede diffusion and spatial distribution in live Escherichia coli. Biophys. J. 2011;101:2535–2544. doi: 10.1016/j.bpj.2011.10.013. [DOI] [PMC free article] [PubMed] [Google Scholar]
- 14.Mika J.T., Krasnikov V., Poolman B. Evaluation of pulsed-FRAP and conventional-FRAP for determination of protein mobility in prokaryotic cells. PLoS ONE. 2011;6:e25664. doi: 10.1371/journal.pone.0025664. [DOI] [PMC free article] [PubMed] [Google Scholar]
- 15.van den Bogaart G., Hermans N., Poolman B. Protein mobility and diffusive barriers in Escherichia coli: consequences of osmotic stress. Mol. Microbiol. 2007;64:858–871. doi: 10.1111/j.1365-2958.2007.05705.x. [DOI] [PubMed] [Google Scholar]
- 16.Schulmeister S., Ruttorf M., Sourjik V. Protein exchange dynamics at chemoreceptor clusters in Escherichia coli. Proc. Natl. Acad. Sci. USA. 2008;105:6403–6408. doi: 10.1073/pnas.0710611105. [DOI] [PMC free article] [PubMed] [Google Scholar]
- 17.Laursen B.S., Sørensen H.P., Sperling-Petersen H.U. Initiation of protein synthesis in bacteria. Microbiol. Mol. Biol. Rev. 2005;69:101–123. doi: 10.1128/MMBR.69.1.101-123.2005. [DOI] [PMC free article] [PubMed] [Google Scholar]
- 18.Simonetti A., Marzi S., Yusupov M. A structural view of translation initiation in bacteria. Cell. Mol. Life Sci. 2009;66:423–436. doi: 10.1007/s00018-008-8416-4. [DOI] [PMC free article] [PubMed] [Google Scholar]
- 19.Dunkle J.A., Cate J.H. Ribosome structure and dynamics during translocation and termination. Annu. Rev. Biophys. 2010;39:227–244. doi: 10.1146/annurev.biophys.37.032807.125954. [DOI] [PubMed] [Google Scholar]
- 20.Hirokawa G., Nijman R.M., Kaji A. The role of ribosome recycling factor in dissociation of 70S ribosomes into subunits. RNA. 2005;11:1317–1328. doi: 10.1261/rna.2520405. [DOI] [PMC free article] [PubMed] [Google Scholar]
- 21.Peske F., Rodnina M.V., Wintermeyer W. Sequence of steps in ribosome recycling as defined by kinetic analysis. Mol. Cell. 2005;18:403–412. doi: 10.1016/j.molcel.2005.04.009. [DOI] [PubMed] [Google Scholar]
- 22.Zavialov A.V., Hauryliuk V.V., Ehrenberg M. Splitting of the posttermination ribosome into subunits by the concerted action of RRF and EF-G. Mol. Cell. 2005;18:675–686. doi: 10.1016/j.molcel.2005.05.016. [DOI] [PubMed] [Google Scholar]
- 23.Dalbow D.G., Young R. Synthesis time of beta-galactosidase in Escherichia coli B/r as a function of growth rate. Biochem. J. 1975;150:13–20. doi: 10.1042/bj1500013. [DOI] [PMC free article] [PubMed] [Google Scholar]
- 24.Sørensen M.A., Kurland C.G., Pedersen S. Codon usage determines translation rate in Escherichia coli. J. Mol. Biol. 1989;207:365–377. doi: 10.1016/0022-2836(89)90260-x. [DOI] [PubMed] [Google Scholar]
- 25.Sørensen M.A., Vogel U., Pedersen S. The rates of macromolecular chain elongation modulate the initiation frequencies for transcription and translation in Escherichia coli. Antonie van Leeuwenhoek. 1993;63:323–331. doi: 10.1007/BF00871227. [DOI] [PubMed] [Google Scholar]
- 26.Young R., Bremer H. Polypeptide-chain-elongation rate in Escherichia coli B/r as a function of growth rate. Biochem. J. 1976;160:185–194. doi: 10.1042/bj1600185. [DOI] [PMC free article] [PubMed] [Google Scholar]
- 27.Wang Y., Jones B.D., Brun Y.V. A set of ftsZ mutants blocked at different stages of cell division in Caulobacter. Mol. Microbiol. 2001;40:347–360. doi: 10.1046/j.1365-2958.2001.02395.x. [DOI] [PubMed] [Google Scholar]
- 28.Montero Llopis P., Jackson A.F., Jacobs-Wagner C. Spatial organization of the flow of genetic information in bacteria. Nature. 2010;466:77–81. doi: 10.1038/nature09152. [DOI] [PMC free article] [PubMed] [Google Scholar]
- 29.Thanbichler M., Iniesta A.A., Shapiro L. A comprehensive set of plasmids for vanillate- and xylose-inducible gene expression in Caulobacter crescentus. Nucleic Acids Res. 2007;35:e137. doi: 10.1093/nar/gkm818. [DOI] [PMC free article] [PubMed] [Google Scholar]
- 30.Evinger M., Agabian N. Envelope-associated nucleoid from Caulobacter crescentus stalked and swarmer cells. J. Bacteriol. 1977;132:294–301. doi: 10.1128/jb.132.1.294-301.1977. [DOI] [PMC free article] [PubMed] [Google Scholar]
- 31.Sliusarenko O., Heinritz J., Jacobs-Wagner C. High-throughput, subpixel precision analysis of bacterial morphogenesis and intracellular spatio-temporal dynamics. Mol. Microbiol. 2011;80:612–627. doi: 10.1111/j.1365-2958.2011.07579.x. [DOI] [PMC free article] [PubMed] [Google Scholar]
- 32.Konopka M.C., Sochacki K.A., Weisshaar J.C. Cytoplasmic protein mobility in osmotically stressed Escherichia coli. J. Bacteriol. 2009;191:231–237. doi: 10.1128/JB.00536-08. [DOI] [PMC free article] [PubMed] [Google Scholar]
- 33.Mika J.T., van den Bogaart G., Poolman B. Molecular sieving properties of the cytoplasm of Escherichia coli and consequences of osmotic stress. Mol. Microbiol. 2010;77:200–207. doi: 10.1111/j.1365-2958.2010.07201.x. [DOI] [PubMed] [Google Scholar]
- 34.Kelly A.J., Sackett M.J., Brun Y.V. Cell cycle-dependent transcriptional and proteolytic regulation of FtsZ in Caulobacter. Genes Dev. 1998;12:880–893. doi: 10.1101/gad.12.6.880. [DOI] [PMC free article] [PubMed] [Google Scholar]
- 35.Thom A., Apelt C.J. D. Van Nostrand; London: 1961. Field Computations in Engineering and Physics. [Google Scholar]
- 36.English B.P., Hauryliuk V., Elf J. Single-molecule investigations of the stringent response machinery in living bacterial cells. Proc. Natl. Acad. Sci. USA. 2011;108:E365–E373. doi: 10.1073/pnas.1102255108. [DOI] [PMC free article] [PubMed] [Google Scholar]
- 37.Lee S.F., Thompson M.A., Moerner W.E. Super-resolution imaging of the nucleoid-associated protein HU in Caulobacter crescentus. Biophys. J. 2011;100:L31–L33. doi: 10.1016/j.bpj.2011.02.022. [DOI] [PMC free article] [PubMed] [Google Scholar]
- 38.Robinow C., Kellenberger E. The bacterial nucleoid revisited. Microbiol. Rev. 1994;58:211–232. doi: 10.1128/mr.58.2.211-232.1994. [DOI] [PMC free article] [PubMed] [Google Scholar]
- 39.Briegel A., Dias D.P., Jensen G.J. Multiple large filament bundles observed in Caulobacter crescentus by electron cryotomography. Mol. Microbiol. 2006;62:5–14. doi: 10.1111/j.1365-2958.2006.05355.x. [DOI] [PubMed] [Google Scholar]
- 40.Marvaldi J., Pichon J., Marchis-Mouren G. Individual ribosomal protein pool size and turnover rate in Escherichia coli. J. Mol. Biol. 1974;84:83–96. doi: 10.1016/0022-2836(74)90213-7. [DOI] [PubMed] [Google Scholar]
- 41.Gamba P., Veening J.W., Daniel R.A. Two-step assembly dynamics of the Bacillus subtilis divisome. J. Bacteriol. 2009;191:4186–4194. doi: 10.1128/JB.01758-08. [DOI] [PMC free article] [PubMed] [Google Scholar]
- 42.Russell A.D., Fountain R.H. Aspects of the mechanism of action of some cephalosporins. J. Bacteriol. 1971;106:65–69. doi: 10.1128/jb.106.1.65-69.1971. [DOI] [PMC free article] [PubMed] [Google Scholar]
- 43.Bakshi S., Siryaporn A., Weisshaar J.C. Superresolution imaging of ribosomes and RNA polymerase in live Escherichia coli cells. Mol. Microbiol. 2012;85:21–38. doi: 10.1111/j.1365-2958.2012.08081.x. [DOI] [PMC free article] [PubMed] [Google Scholar]
- 44.De Boer H.A., Bakker A.J., Gruber M. The role of energy-generating processes in the degradation of guanosine tetrophosphate, ppGpp, in Escherichia coli. Biochim. Biophys. Acta. 1976;432:361–368. doi: 10.1016/0005-2787(76)90146-5. [DOI] [PubMed] [Google Scholar]
- 45.Aviram M., Hershko A. Proceedings: energy requirement of the breakdown of RNA in cultured hepatoma cells. Isr. J. Med. Sci. 1975;11:1200. [PubMed] [Google Scholar]
- 46.Park E.A., Morgan H.E. Energy dependence of RNA degradation in rabbit reticulocytes. Am. J. Physiol. 1984;247:C390–C395. doi: 10.1152/ajpcell.1984.247.5.C390. [DOI] [PubMed] [Google Scholar]
- 47.Jarett L., Hendler R.W. 2,4-Dinitrophenol and azide as inhibitors of protein and ribonucleic acid synthesis in anaerobic yeast. Biochemistry. 1967;6:1693–1703. doi: 10.1021/bi00858a018. [DOI] [PubMed] [Google Scholar]
- 48.Forchhammer J., Lindahl L. Growth rate of polypeptide chains as a function of the cell growth rate in a mutant of Escherichia coli 15. J. Mol. Biol. 1971;55:563–568. doi: 10.1016/0022-2836(71)90337-8. [DOI] [PubMed] [Google Scholar]
- 49.Mangiarotti G., Schlessinger D. Polyribosome metabolism in Escherichia coli. I. Extraction of polyribosomes and ribosomal subunits from fragile, growing Escherichia coli. J. Mol. Biol. 1966;20:123–143. doi: 10.1016/0022-2836(66)90122-7. [DOI] [PubMed] [Google Scholar]
- 50.Phillips L.A., Hotham-Iglewski B., Franklin R.M. Polyribosomes of Escherichia coli. II. Experiments to determine the in vivo distribution of polysomes, ribosomes and ribosomal subunits. J. Mol. Biol. 1969;45:23–38. doi: 10.1016/0022-2836(69)90207-1. [DOI] [PubMed] [Google Scholar]
- 51.Phillips L.A., Hotham-Iglewski B., Franklin R.M. Polyribosomes of Escherichia coli. I. Effects of monovalent cations on the distribution of polysomes, ribosomes and ribosomal subunits. J. Mol. Biol. 1969;40:279–288. doi: 10.1016/0022-2836(69)90475-6. [DOI] [PubMed] [Google Scholar]
- 52.Varricchio F., Monier R. Ribosome patterns in Escherichia coli growing at various rates. J. Bacteriol. 1971;108:105–110. doi: 10.1128/jb.108.1.105-110.1971. [DOI] [PMC free article] [PubMed] [Google Scholar]
- 53.Weber S.C., Spakowitz A.J., Theriot J.A. Nonthermal ATP-dependent fluctuations contribute to the in vivo motion of chromosomal loci. Proc. Natl. Acad. Sci. USA. 2012;109:7338–7343. doi: 10.1073/pnas.1119505109. [DOI] [PMC free article] [PubMed] [Google Scholar]
- 54.Oh E., Becker A.H., Bukau B. Selective ribosome profiling reveals the cotranslational chaperone action of trigger factor in vivo. Cell. 2011;147:1295–1308. doi: 10.1016/j.cell.2011.10.044. [DOI] [PMC free article] [PubMed] [Google Scholar]
- 55.Bremer H., Dennis P.P. Modulation of chemical composition and other parameters of the cell by growth rate. In: Neidhardt F.C., editor. Escherichia coli and Salmonella. ASM Press; Washington: 1996. pp. 1553–1569. [Google Scholar]
- 56.Sørensen M.A., Pedersen S. Absolute in vivo translation rates of individual codons in Escherichia coli. The two glutamic acid codons GAA and GAG are translated with a threefold difference in rate. J. Mol. Biol. 1991;222:265–280. doi: 10.1016/0022-2836(91)90211-n. [DOI] [PubMed] [Google Scholar]
- 57.Liang S.T., Xu Y.C., Bremer H. mRNA composition and control of bacterial gene expression. J. Bacteriol. 2000;182:3037–3044. doi: 10.1128/jb.182.11.3037-3044.2000. [DOI] [PMC free article] [PubMed] [Google Scholar]
- 58.Proshkin S., Rahmouni A.R., Nudler E. Cooperation between translating ribosomes and RNA polymerase in transcription elongation. Science. 2010;328:504–508. doi: 10.1126/science.1184939. [DOI] [PMC free article] [PubMed] [Google Scholar]
- 59.Svergun D.I., Pedersen J.S., Koch M.H. Solution scattering from 50S ribosomal subunit resolves inconsistency between electron microscopic models. Proc. Natl. Acad. Sci. USA. 1994;91:11826–11830. doi: 10.1073/pnas.91.25.11826. [DOI] [PMC free article] [PubMed] [Google Scholar]
- 60.Hansen J.L., Moore P.B., Steitz T.A. Structures of five antibiotics bound at the peptidyl transferase center of the large ribosomal subunit. J. Mol. Biol. 2003;330:1061–1075. doi: 10.1016/s0022-2836(03)00668-5. [DOI] [PubMed] [Google Scholar]
- 61.Ormö M., Cubitt A.B., Remington S.J. Crystal structure of the Aequorea victoria green fluorescent protein. Science. 1996;273:1392–1395. doi: 10.1126/science.273.5280.1392. [DOI] [PubMed] [Google Scholar]
- 62.Nenninger A., Mastroianni G., Mullineaux C.W. Size dependence of protein diffusion in the cytoplasm of Escherichia coli. J. Bacteriol. 2010;192:4535–4540. doi: 10.1128/JB.00284-10. [DOI] [PMC free article] [PubMed] [Google Scholar]
- 63.Bancaud A., Huet S., Ellenberg J. Molecular crowding affects diffusion and binding of nuclear proteins in heterochromatin and reveals the fractal organization of chromatin. EMBO J. 2009;28:3785–3798. doi: 10.1038/emboj.2009.340. [DOI] [PMC free article] [PubMed] [Google Scholar]
- 64.Schlessinger D., Gurgo C., Apirion D. Polyribosome metabolism in growing and nongrowing Escherichia coli. Cold Spring Harb. Symp. Quant. Biol. 1969;34:231–242. doi: 10.1101/sqb.1969.034.01.029. [DOI] [PubMed] [Google Scholar]
- 65.Cabrera J.E., Jin D.J. The distribution of RNA polymerase in Escherichia coli is dynamic and sensitive to environmental cues. Mol. Microbiol. 2003;50:1493–1505. doi: 10.1046/j.1365-2958.2003.03805.x. [DOI] [PubMed] [Google Scholar]
- 66.Jensen R.B., Shapiro L. The Caulobacter crescentus smc gene is required for cell cycle progression and chromosome segregation. Proc. Natl. Acad. Sci. USA. 1999;96:10661–10666. doi: 10.1073/pnas.96.19.10661. [DOI] [PMC free article] [PubMed] [Google Scholar]
- 67.Okuyama A., Machiyama N., Tanaka N. Inhibition by kasugamycin of initiation complex formation on 30S ribosomes. Biochem. Biophys. Res. Commun. 1971;43:196–199. doi: 10.1016/s0006-291x(71)80106-7. [DOI] [PubMed] [Google Scholar]
- 68.Schneider E., Blundell M., Kennell D. Translation and mRNA decay. Mol. Gen. Genet. 1978;160:121–129. doi: 10.1007/BF00267473. [DOI] [PubMed] [Google Scholar]
- 69.Kaberdina A.C., Szaflarski W., Moll I. An unexpected type of ribosomes induced by kasugamycin: a look into ancestral times of protein synthesis? Mol. Cell. 2009;33:227–236. doi: 10.1016/j.molcel.2008.12.014. [DOI] [PMC free article] [PubMed] [Google Scholar]
- 70.Takanami M., Okamoto T. Interaction of ribosomes and synthetic polyribonucleotides. J. Mol. Biol. 1963;7:323–333. doi: 10.1016/s0022-2836(63)80027-3. [DOI] [PubMed] [Google Scholar]
- 71.Okamoto T., Takanami M. Interaction of ribosomes and natural polyribonucleotides. Biochim. Biophys. Acta. 1963;76:266–274. [PubMed] [Google Scholar]
- 72.Lin B., Thayer D.A., Maddock J.R. The Caulobacter crescentus CgtAC protein cosediments with the free 50S ribosomal subunit. J. Bacteriol. 2004;186:481–489. doi: 10.1128/JB.186.2.481-489.2004. [DOI] [PMC free article] [PubMed] [Google Scholar]
- 73.Bernstein J.A., Khodursky A.B., Cohen S.N. Global analysis of mRNA decay and abundance in Escherichia coli at single-gene resolution using two-color fluorescent DNA microarrays. Proc. Natl. Acad. Sci. USA. 2002;99:9697–9702. doi: 10.1073/pnas.112318199. [DOI] [PMC free article] [PubMed] [Google Scholar]
- 74.Pertea M., Ayanbule K., Salzberg S.L. OperonDB: a comprehensive database of predicted operons in microbial genomes. Nucleic Acids Res. 2009;37(Database issue):D479–D482. doi: 10.1093/nar/gkn784. [DOI] [PMC free article] [PubMed] [Google Scholar]
- 75.Bogacki P., Shampine L.F. A 3(2) pair of Runge-Kutta formulas. Appl. Math. Lett. 1989;2:321–325. [Google Scholar]
- 76.Nelder J.A., Mead R. A simplex method for function minimization. Comput. J. 1965;7:308–313. [Google Scholar]
- 77.Marks M.E., Castro-Rojas C.M., Crosson S. The genetic basis of laboratory adaptation in Caulobacter crescentus. J. Bacteriol. 2010;192:3678–3688. doi: 10.1128/JB.00255-10. [DOI] [PMC free article] [PubMed] [Google Scholar]
Associated Data
This section collects any data citations, data availability statements, or supplementary materials included in this article.