

Abstract
Light isomerizes 11-cis-retinal in a retinal rod and produces an active form of rhodopsin (Rh*) that binds to the G-protein transducin and activates the phototransduction cascade. Rh* is turned off by phosphorylation by rhodopsin kinase [G-protein-coupled receptor kinase 1 (GRK1)] and subsequent binding of arrestin. To evaluate the role of GRK1 in rod light response decay, we have generated the transgenic mouse RKS561L in which GRK1, which is normally present at only 2–3% of rhodopsin, is overexpressed by ∼12-fold. Overexpression of GRK1 increases the rate of Rh* phosphorylation and reduces the exponential decay constant of the response (τREC) and the limiting time constant (τD) both by ∼30%; these decreases are highly significant. Similar decreases are produced in Rv−/− rods, in which the GRK1-binding protein recoverin has been genetically deleted. These changes in response decay are produced by acceleration of light-activated phosphodiesterase (PDE*) decay rather than Rh* decay, because light-activated PDE* decay remains rate limiting for response decay in both RKS561L and Rv−/− rods. A model incorporating an effect of GRK1 on light-activated PDE* decay rate can satisfactorily account for the changes in response amplitude and waveform. Modulation of response decay in background light is nearly eliminated by deletion of recoverin. Our experiments indicate that rhodopsin kinase and recoverin, in addition to their well-known role in regulating the turning off of Rh*, can also modulate the decay of light-activated PDE*, and the effects of these proteins on light-activated PDE* decay may be responsible for the quickening of response recovery in background light.
Introduction
Increases in ambient illumination increase the sensitivity of vision to change and motion. This phenomenon occurs for both rod and cone vision and is responsible for the well-known increase in the flicker-fusion frequency with increasing background light (Hecht and Shlaer, 1936). It results at least in part from modulation of the decay time of the photoreceptor response, as was first demonstrated nearly 50 years ago by Fuortes and Hodgkin (1964) for the Limulus lateral eye. More recently, this important feature of adaptation has been shown also to occur in the rods of wild-type (WT) mice (Woodruff et al., 2008; Chen et al., 2010b), making possible a genetic and physiological analysis of its mechanism.
The decay of the light response in a vertebrate photoreceptor (Fain, 2003) requires the turning off of light-activated rhodopsin (Rh*) by G-protein-coupled receptor kinase 1 (GRK1)-mediated phosphorylation and binding of arrestin, the decay of light-activated phosphodiesterase (PDE*), and resynthesis of cGMP by guanylyl cyclase under control of the Ca2+-binding guanylyl cyclase-activating proteins (GCAPs). Because modulation of response decay in background light still occurs in a quantitatively similar manner after the GCAPs have been deleted (Chen et al., 2010b), the mechanism of modulation cannot involve GCAPs or guanylyl cyclase but must act on Rh* or PDE* decay. Recent experiments have indicated that light-activated PDE* decay is considerably slower than Rh* decay and is rate limiting for the turning off of the rod response (Krispel et al., 2006; Tsang et al., 2006; Chen et al., 2010a; Gross and Burns, 2010; but see Doan et al., 2009). We have therefore suggested that modulation of light-activated PDE* is a likely mechanism for acceleration of response decay during adaptation (Woodruff et al., 2008) and have shown that a model incorporating PDE* modulation can account for the changes in WT and GCAP−/− responses in background light (Chen et al., 2010b). However, these results give no indication how the PDE* modulation might occur.
As a part of our investigation of response decay, we constructed a mouse line RKS561L in which GRK1 is overexpressed ∼12-fold, expecting that we would greatly reduce the amplitude of the light response but not its rate of decay. What we found instead was that response amplitude was only modestly diminished, but the exponential decay constant of the response (τREC) and the limiting time constant (τD) were both highly significantly accelerated. Similar effects were seen after knocking out the GRK1-binding protein recoverin (Rv), which should also produce greater activity of GRK1. These results are most simply understood if GRK1 and recoverin modulate light-activated PDE* decay, which we show to be rate limiting in both RKS561L and Rv−/− rods. Such modulation may be responsible for the effect of background light on rod response decay, which is essentially eliminated when recoverin is deleted from the genome. We conclude that GRK1 and recoverin, in addition to their role in phosphorylating rhodopsin, may also regulate light-activated PDE* decay and mediate the increase in temporal resolution of rods during light adaptation.
Materials and Methods
Transgenic mice.
Site-directed mutagenesis to change the last amino acid of a bovine rhodopsin kinase (RK) cDNA from Ser to Leu (S561L) was performed with the QuickChange kit (Agilent) and sequence verified. To overexpress the mutated bovine rhodopsin kinase in mouse rods, a transgenic construct (Fig. 1A) was made by subcloning the S561L rhodopsin kinase cDNA into the SalI/ClaI sites of a pRho4.4 vector (Li et al., 2005). The so-called RKS561L construct was mixed in a 1:1:1 ratio with two additional constructs, TGβ5L (Rao et al., 2007) and RGS9-1 (Chen et al., 2003), and injected into C57BL/6 × SJL embryos. The rationale of injecting a mixture, instead of one construct, was to maximize the chance of getting founders that simultaneously overexpress multiple proteins in mouse rods. Five founders were generated from which one stable founder line was established. In this line, the RGS9-1 transgene was not integrated into the genome, whereas RKS561L expression level was high across the retina and TGβ5-L expression was barely detectable. We identified the presence of the RKS561L transgene by an ∼350 bp PCR product using the following two primers: RH1.1, 5′-TCA GTG CCT GGA GTT GCG CTG TGG; and RKb1, 5′-TCG TCG GCC GTG TCG TAG TCC TCG. PCR conditions were identical to those described for iCre75 (Li et al., 2005). The founder line was backcrossed to the C57BL/6 background with WT alleles at the Pde6b locus to remove the rd1 allele intrinsic to the SJL background. R9AP95 mice were used and genotyped as described previously (Chen et al., 2010a). Recoverin knock-out mice were provided by Jeannie Chen of the University of Southern California (Los Angeles, CA) and genotyped as described previously (Makino et al., 2004). All experiments were performed on pigmented mice of either sex in accordance with the rules and regulations of the National Institutes of Health guidelines for research animals, as approved by the institutional animal care and use committees of the Virginia Commonwealth University and the University of California, Los Angeles. Animals were kept in a 12 h light/dark cycle in approved cages and supplied with ample food and water. Animals in all experiments were killed before tissue extraction by approved procedures, usually CO2 inhalation or decerebration.
Figure 1.
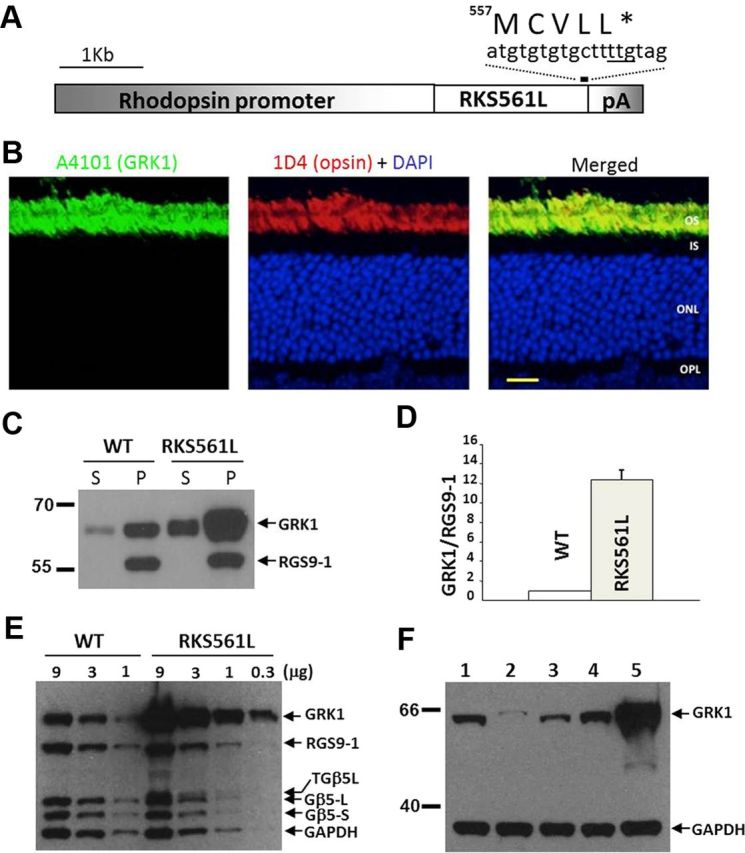
Overexpression of rhodopsin kinase in RKS561L transgenic mice. A, Transgenic construct. B, GRK1 in the RKS561L mouse is colocalized with rhodopsin in the rod outer segment (OS) layer. IS, Inner segment; ONL, outer nuclear layer; OPL, outer plexiform layer. Scale bar, 20 μm. C, A representative Western blot demonstrating relative level of transgenic versus endogenous rhodopsin kinase in particulate (P) and soluble (S) fractions of mouse retinas. RGS9-1 serves as a membrane marker, whose level is comparable between WT and RKS561L retinas. D, The level of rhodopsin kinase overexpression in RKS561L mouse retina, measured by Western blotting and normalized to that of RGS9-1, is determined to be 12 ± 1.5-fold of WT (n = 3). E, A representative Western blot showing comparable levels of components of transducin GAP in WT and RKS561L mouse retinas. Despite the weak expression of a transgenic FLAG-tagged TGβ5L, RGS9-1 concentrations are similar between the two lines. F, Western blot showing the relative abundance of rhodopsin kinase in mouse lines used in the study. 1, WT; 2, RKBark7; 3, GRK1+/−; 4, Rv−/−; 5, RKS561L. GAPDH signal serves as an internal loading control. The difference in expression level between the lowest (RKBark7) and the highest (RKS561L) expressors is ∼80-fold.
Antibody.
Polyclonal antibody A4101 was raised in rabbit against a synthetic rhodopsin kinase peptide (CQDVGAFSTVKGVAF) coupled to keyhole limpet hemocyanin (GenScript). The antibody was affinity purified with a corresponding peptide column and stored in 1× PBS with 0.02% sodium azide. Phosphospecific antibodies against phosphorylated rhodopsin were a gift from Dr. David Williams (University of California, Los Angeles, Los Angeles, CA). Three commercial antibodies were used: MA1-720 (G8, mouse monoclonal antibody against rhodopsin kinase; Thermo Fisher Scientific), GAPDH (3683, rabbit monoclonal antibody against glyceraldehyde 3-phosphate dehydrogenase; Cell Signaling Technology), and 1D4 (SC-57432, mouse monoclonal antibody against rhodopsin; Santa Cruz Biotechnology).
Western blotting.
Mouse retinas were homogenized in PBS and centrifuged at 20,000 × g for 30 min at 4°C. The pellet was homogenized in fresh PBS with a volume equal to that of the supernatant. Both pellet and supernatant (10 μg of protein) were resolved by 12% SDS-PAGE and transferred onto nitrocellulose membranes. The membranes were blocked with 10% dry milk in TBST buffer containing 25 mm Tris, pH 7.5, 137 mm NaCl, and 0.05% Tween 20. To determine the expression level of transgenic RKS561L, the A4101 antibody was used at 1:1000 dilution (Fig. 1B). To detect endogenous and various mutant GRK1 mouse lines, including RKBark7 (Chen et al., 2010a), RK+/− (Chen et al., 1999), and Rv−/− (Makino et al., 2004), on the same gel (Fig. 1D), the monoclonal G8 antibody was used at 1:5000 dilution. To detect RGS9-1 and Gβ5 isoforms, rabbit CT318 and CT215 polyclonal antibodies (provided by Mel Simon of the California Institute of Technology, Pasadena, CA) were used at 1:3000 and 1:2500 dilutions, respectively. Species-specific HRP-coupled secondary antibodies (Santa Cruz Biotechnology) were used at 1:12500 dilution, and the signal was detected by enhanced chemiluminescence with the SuperSignal West Dura extended duration substrate kit (Thermo Fisher Scientific). Signals were captured and quantified in the Kodak IS440 imaging system with accompanying 1D image analysis software (Eastman Kodak).
Rhodopsin phosphorylation.
Mice were dark adapted overnight and rod outer segments (ROS) were purified under infrared illumination by vortexing 10 retinas in 250 μl of 47% sucrose in ROS–Ca1 buffer containing the following (in mm): 20 3-(N-morpholino)-propanesulfonic acid, pH 7.0, 30 NaCl, 60 KCl, 2 MgCl2, 1 DTT, 1 CaCl2, and 0.2 PMSF. After centrifugation at 4°C at 20,000 × g for 30 min, the resulting supernatant was diluted 1:1 with cold ROS–Ca1 buffer and centrifuged for 30 min. The pellet was washed with cold ROS–Ca1 buffer and bath sonicated for 10 s. Rhodopsin concentration was determined by difference spectroscopy at 500 nm from a molar extinction coefficient of 40,000 liter M−1 cm−1. After adjusting rhodopsin and ATP concentrations to 5 μm and 2 mm, respectively, phosphorylation of rhodopsin was initiated by exposure to 500 lux white light at room temperature and stopped by adding 20 μl of the mixture to an equal volume of 1× SDS-PAGE sample buffer at different time points. Samples were analyzed without boiling by Western blotting, first with each of the two phosphospecific antibodies, followed by membrane stripping and reprobing with 1D4. Two independent assays were performed with similar experimental outcomes.
Histology.
Animals were raised in 12 h light/dark cycles. Enucleated eyeballs were fixed overnight in 2% paraformaldehyde/2.5% glutaraldehyde in 0.1 m cacodylic acid, pH 7.4. After removing the cornea and lens, the eyecup was postfixed in 1% osmium tetroxide in 0.1 m cacodylic acid at room temperature for 4 h. The eyecup was gradually dehydrated in ethanol and impregnated and hardened in Spurr resin at 70°C (Electron Microscopy Sciences). Gross retinal morphology was assessed in 990 nm semithin sections, followed by staining with 0.15% toluidine blue in 0.5% sodium borate. For electron microscopy, thin sections were cut on a Reichert Ultracut ultramicrotome, stained with uranyl acetate and Reynold's lead citrate, and examined with a JEOL 100CX transmission electron microscope. Negatives were scanned and dimensions were measured in Photoshop (Adobe Systems).
Immunohistochemistry.
Enucleated mouse eyeballs were handled in room light and immersion fixed in 4% paraformaldehyde in PBS at 4°C for 12–18 h. After removal of the cornea and lens, the resulting eyecups were cryoprotected in cold 30% sucrose in PBS, embedded in TBS (Triangle Biomedical Sciences), and sectioned at −20°C at 30 μm thickness. The sections were blocked for 60 min at room temperature with 10% goat serum and 0.3% Triton X-100 in 1× PBS and incubated for 4–8 h at room temperature with antibodies against rhodopsin kinase (A4101, used at 1:100) and rhodopsin (1D4, used at 1: 200). Alexa Fluor 563-conjugated goat anti-mouse antibody and Alexa Fluor 488-conjugated goat anti-rabbit antibody (both at 1:2000 dilution; Invitrogen) were used to localize GRK1 and rhodopsin, respectively. Fluorescent images were captured with a Carl Zeiss LSM510Meta confocal microscope at Virginia Commonwealth University Microscopy core facility. Unmodified files were viewed in a separate computer with the LSM Image Browser program (Carl Zeiss), and images were exported as TIFF files to Adobe Photoshop (Adobe Systems) for cropping. No image processing was performed during or after image acquisition.
Suction-electrode recordings.
Methods for recording responses of mouse rods have been given previously (Woodruff et al., 2008; Chen et al., 2010a). Animals between 2 and 6 months of age were dark adapted typically for 5 h but for at least 3 h in a light-tight box. Rods were perfused at 37°C with DMEM (D-2902; Sigma Chemical), supplemented with 15 mm NaHCO3, 2 mm Na succinate, 0.5 mm Na glutamate, 2 mm Na gluconate, and 5 mm NaCl, bubbled with 95% O2/5% CO2, pH 7.4. Unless otherwise indicated, data were filtered at 35 Hz (eight-pole, Bessel) and sampled at 100 Hz. Flashes of 500 nm light, 20 ms in duration, were attenuated to different light levels by absorptive neutral density filters. At dim intensities, 10–20 individual responses presented at 5 s intervals were averaged to obtain mean flash responses. At medium intensities, 5–10 responses were averaged, and the interflash interval was increased to 10 s. At bright intensities above saturation for the rods, only three to five responses were averaged, and the interflash interval was increased to 15–20 s. A 500 nm light was also used for steps of light and backgrounds. Other information about the details of response presentation are given in the figure legends. The values of τD were measured as in the study by Woodruff et al. (2008) by giving a series of five flashes at each of between four and seven intensities chosen for each rod to fall within 1.5 log units above the flash intensity that just produced saturation of the response amplitude of that rod. Flash intensities were in the range of 159–3250 photons μm−2. The time in saturation (Tsat) was measured as the time from the beginning of the flash to the time at which the mean circulating current recovered to 25% of its dark-adapted value. The value of τD was then calculated as the best-fitting slope of Tsat versus the natural logarithm of the flash intensity. Unless otherwise stated, errors are given as SE. Curve fitting, statistical tests, and plotting of data were done with the program Origin (OriginLab).
Results
RKS561L mice
When studied ectopically in COS-7 cells, the S561L mutation causes GRK1 to be geranylgeranylated instead of farnesylated, with an apparent increase in membrane affinity but no effect on catalytic activity for light-activated rhodopsin (Inglese et al., 1992). In the RKS561L mouse retina, the expression of mutant S561L GRK1 is rod specific and confined exclusively to the outer segment layer (Fig. 1B). The level of transgenic versus endogenous GRK1 in mice positive for the RKS561L transgene (Fig. 1A) was determined by Western blotting to be ∼12-fold with little change in the level of other phototransduction proteins, such as RGS9-1 (Fig. 1C–E), despite the additional expression of a FLAG-tagged transgenic TGβ5L. The high expression level of transgenic GRK1 appears to result from where the transgene was integrated into the genome and not from the S561L mutation itself, because several other founder lines harboring the same transgene showed little or no expression (data not shown). Although a significant fraction of recombinant GRK1 is soluble in an ectopic expression system (Inglese et al., 1992; Bruel et al., 2000), the majority of endogenous GRK1 and transgenic S561L mutant GRK1 are membrane associated in mouse retina in the dark (Fig. 1C).
Figure 1F demonstrates the relative abundance of rhodopsin kinase in the various mouse lines used in this study and in our previous experiments. The lowest level is in the RKBark7 line (∼15% of WT, lane 2; Chen et al., 2010a), followed by heterozygous rhodopsin kinase knock-out (∼40% of WT, lane 3; Chen et al., 1999, 2010a). Recoverin knock-out mice (lane 4; Makino et al., 2004) express rhodopsin kinase at a level comparable with that of WT mice. The difference in expression level between RKBark7 and RKS561L mice was ∼80-fold.
Our biochemical determinations show that the amount of GRK1 per WT mouse retina is 1040 ± 50 ng (SD). Because the molecular weight of RK is ∼64 kDa, the amount of GRK1 in a WT mouse retina is ∼15 pmol. The amount of rhodopsin in a WT mouse retina is ∼600 pmol, so the ratio of GRK1 to rhodopsin is ∼15:600, or 2–3%. Because the ratio of expression level of GRK1 to that of rhodopsin is so low, increases or decreases in expression of GRK1 should produce proportionate changes in the rate of phosphorylation. As a control for this notion, we used phosphospecific antibodies (Adams et al., 2003; Wang et al., 2005) and an antibody-based assay to investigate the effect of the 12-fold increase in GRK1 expression in RKS561L mice on the rate of rhodopsin phosphorylation (Fig. 2). Under our assay conditions, phosphorylation at Ser338 occurs much faster than at Ser334. We also observed, as noted by Adams et al. (2003), that phosphorylation at Ser338 is more transient than at Ser334. Because both antibodies are in limited supply, we did not pursue a quantitative description of enhanced rhodopsin phosphorylation at either site. Nevertheless, the data in Figures 1 and 2 clearly demonstrate that overexpressed GRK1 in RKS561L mice is located in the outer segment and greatly accelerates the rate of rhodopsin phosphorylation.
Figure 2.

Increased light-dependent phosphorylation of rhodopsin in RKS561L mouse retinas. A, Light-dependent phosphorylation of rhodopsin at Ser334 revealed by the α-phospho334 antibody (top). Total rhodopsin is revealed by 1D4 staining (bottom). B, Light-dependent phosphorylation of rhodopsin at Ser338, revealed by the α-phospho338 antibody (top) with total rhodopsin level (1D4) shown at the bottom. Two independent experiments were performed with similar results showing an increased rate of rhodopsin phosphorylation in RKS561L versus WT mice.
Responses of RKS561L rods to flashes
In Figure 3, A and B, we compare the waveforms of dark-adapted WT and RKS561L rods to brief flashes at the same light intensities. Although comparable in many respects, the responses of RKS561L rods clearly decline more rapidly at all intensities examined. Both the integration time (ti) and the τREC are smaller for RKS561L rods (Table 1), and these differences were highly significant (p < 0.0003 for both, Student's t test). The RKS561L rods were also somewhat less sensitive than WT rods (Table 1), and this difference was also significant.
Figure 3.

Comparison of mean response waveform of WT, RKS561L, and Rv−/− rods to 20 ms flashes given at t = 0, for each rod type at the same intensities (in photons μm−2): 4, 17, 43, 158, 453, 645, 1120, and 1870. A, WT, mean of 10 rods. B, RKS561L, mean of 8 rods. C, Rv−/−, mean of 16 rods.
Table 1.
Kinetic and sensitivity parameters of rods
| Animal line (n rods) | rmax (pA) | SfD (pA photon−1 μm2) | I½ (photons μm−2) | ti (ms) | τREC (ms) | τD (ms) |
|---|---|---|---|---|---|---|
| WT (45) | 14.1 ± 0.6 | 0.31 ± 0.02 | 33 ± 2 | 259 ± 10 | 185 ± 11 | 173 ± 10 |
| RKS561L (26) | 11.9 ± 0.4 | 0.17 ± 0.01 | 45 ± 5 | 170 ± 10 | 120 ± 13 | 123 ± 7 |
| p = 0.008 | p < 0.0001 | p < 0.0001 | p < 0.0001 | p = 0.0003 | p = 0.001 | |
| Rv−/−(17) | 11.5 ± 0.7 | 0.28 ± 0.02 | 30 ± 2 | 168 ± 9 | 80 ± 7 | 117 ± 9 |
| p = 0.016 | p < 0.0001 | p < 0.0001 | p = 0.002 | |||
| R9AP95 (18) | 12.1 ± 0.7 | 0.07 ± 0.01 | 98 ± 7 | 106 ± 9 | 60 ± 8 | 53 ± 2 |
| p < 0.0001 | p < 0.0001 | p < 0.0001 | p < 0.0001 | p > 0.0001 | ||
| R9AP95;RKS561L (13) | 11.9 ± 0.7 | 0.10 ± 0.01 | 111 ± 19 | 132 ± 7 | 51 ± 6 | 51 ± 7 |
| p = 0.049 | p < 0.0001 | p < 0.0001 | p < 0.0001 | p < 0.0001 | p < 0.0001 | |
| R9AP95;Rv−/− (10) | 10.9 ± 0.7 | 0.24 ± 0.02 | 32 ± 2 | 119 ± 7 | 53 ± 5 | 49 ± 2 |
| p = 0.016 | p < 0.0001 | p < 0.0001 | p < 0.0001 | |||
| RK+/− (13) | 14.4 ± 1.3 | 0.30 ± 0.03 | 31 ± 2 | 386 ± 34 | 339 ± 33 | 220 ± 14 |
| p < 0.0001 | p < 0.0001 | |||||
| RKBark7 (21) | 15.2 ± 0.5 | 0.37 ± 0.03 | 29 ± 2 | 444 ± 19 | 254 ± 23 | 214 ± 9 |
| p < 0.0001 | p = 0.003 |
All values are means ± SE. Numbers in parentheses in the first column give number of rods recorded. Values of rmax (maximum response amplitude) were determined cell by cell from responses to saturating flashes; SfD, by dividing the peak amplitude of the mean dim-flash response for each cell by the flash intensity; I½, from the fit of response-intensity data for each cell to a Boltzmann function in the program Origin; ti, from the time integral of the mean dim-flash response for each cell divided by the peak amplitude of the response; τREC, by fitting a single-exponential decay function to averaged responses of small amplitude (<0.3 rmax); and τD (the Pepperberg constant), for dark-adapted rods as described in the Materials and Methods. Bold indicates significant difference (p < 0.01) from WT with p values given under the mean. For the Rv−/−, RK-overexpressing (RKS561L), and GAP-overexpressing (R9AP95) mice, comparisons that yielded differences were as follows: RKS561L versus R9AP95;RKS561L, SfD (p = 0.005), I½ (p = 0.001), τREC (p = 0.001), and τD (p < 0.0001); Rv−/− versus R9AP95;Rv−/−, ti (p = 0.001), τREC (p = 0.009), and τD (p < 0.0001); and R9AP95 versus R9AP95;Rv−/−, SfD (p < 0.0001) and I½ (p < 0.0001).
We were struck by the similarity in waveform of the RKS561L rods to the previously reported responses of Rv−/− rods, for which the gene for recoverin was genetically deleted (Makino et al., 2004; Bush and Makino, 2007). In Figure 3C, we show our own recordings of responses of Rv−/− rods to the same flash intensities used for the rods in Figure 3, A and B; the similarity in the flash response waveform of RKS561L and Rv−/− rods should perhaps not be surprising, given that deletion of recoverin should increase the effective activity of GRK1 (Kawamura, 1993; Chen et al., 1995, 2010a; Klenchin et al., 1995). Both ti and τREC were again shorter in Rv−/− rods than in WT rods (Table 1), and these differences were highly significant (p < 0.0001).
Measurements of outer segment length from electron micrographs show that RKS561L rods are somewhat larger than WT rods, with lengths averaging 29.5 ± 3.7 μm as opposed to 26.0 ± 3.1 μm for WT (SDs). Recoverin knock-out rods were even longer (34.7 ± 4.0 μm). These increases in length would produce an increase in collecting area, and adjustment for these differences would produce relative decreases in sensitivity for both mutant rod types in Table 1 but would have no effect on response kinetics or the amplitude of single-photon responses (SPRs), which are given in Figure 6A as a fraction of the decrease in circulating current. ROS diameters for RKS561L and Rv−/− rods averaged ∼1 μm and were similar to those of WT rods fixed concurrently (mean ± SD, Rv−/−, 0.97 ± 0.14 μm; RKS561L, 1.02 ± 0.13 μm; WT, 0.87 ± 0.12). These values are somewhat smaller than in our previous experiments (Tsang et al., 2006), perhaps because the tissue in this instance was immersion fixed instead of by perfusion as done previously.
Figure 6.

SPRs, responses to flashes, and model calculations. A, Family of average normalized SPRs from the genotypes indicated here and described in Results. Data are solid colors and model fits are solid black. Model is a modification of that by Chen et al. (2010b), in which the unphosphorylated form and each phosphorylated form of activated rhodopsin must undergo a conformation change before binding to GRK1. In the model, the rate constant for each conformational change was constrained to be the same across genotypes. The number of activated G-proteins per Rh* was virtually the same across genotypes in the model (10% lower in WT than that in RKS561L and Rv−/−). The rate of GRK1 binding for each phosphorylation step was chosen to be 12 times higher for RKS561L compared with WT, because the binding rate is assumed to be proportional to the nominal concentration of free GRK1. The rate of rhodopsin kinase binding was chosen to be the same for Rv−/− and RKS561L to minimize the number of free parameters. The time constant of decay of PDE*, τPDE, was chosen by a best fit procedure. The best-fit values for τPDE were 180, 73, and 46 ms for WT, RKS541L, and Rv−/−, respectively. The only parameter difference between RKS541L and Rv−/− was τPDE. It was necessary to adjust only one additional parameter to account for the broad shape of the WT SPR: the rate constant for activated G-protein binding to inactive phosphodiesterase was 40% lower in WT compared with RKS541L and Rv−/−. B, Family of average flash responses of WT rods (solid colors) and best fits (solid black) of the model in A. Because these cells are not the same ones used for the average SPR in A, all parameters were free to vary during the fitting procedure. The best-fit parameters were essentially similar to those for the average SPR. C, Same as B but for RKS541L rods. D, Same as B and C but for Rv−/− rods.
The limiting time constant τD
The rods of Figure 3 were exposed to a series of bright flashes to measure the time required for the rod to recover its circulating current (Tsat; see Materials and Methods). In Figure 4 we have plotted Tsat as a function of the natural logarithm of the flash intensity for WT (●), RKS561L (○), and Rv−/− (□) rods. As Makino et al. (2004) also showed, the curve for Rv−/− rods is displaced downward, such that at each flash intensity the Tsat is shorter for the Rv−/− rods than for WT rods. RKS561L rods behave in an identical manner. Furthermore, the slope of Tsat as a function of intensity is clearly smaller for both RKS561L and Rv−/− rods than for WT rods: the best-fitting linear slopes to the mean values of Tsat in Figure 4 gave a τD of 192 ms for WT and 115 ms for both RKS561L and Rv−/− rods. To test for significance, we evaluated τD for each rod one by one from individual estimates of Tsat as a function of intensity. From these measurements, we calculated τD values (Table 1) of 185 ± 11 ms for WT rods, 123 ± 7 ms for RKS561L rods, and 119 ± 9 ms for Rv−/− rods. There was no significant difference between RKS561L and Rv−/−, but both were significantly different from WT (for RKS561L, p < 0.001; for Rv−/−, p < 0.003). A quantitatively similar change in τD between WT and Rv−/− rods was previously noted for two representative photoreceptors by Makino et al. (2004) and for an ensemble of rods by Bush and Makino (2007), and the difference they reported is also highly statistically significant (p < 0.0067, C. L. Makino, personal communication).
Figure 4.

Tsat as a function of the natural logarithm of flash intensity for the rods in Figure 3. For each rod at each flash intensity, the time between the beginning of the flash and the recovery of the photocurrent to 25% of its dark-adapted value was measured as in the study by Woodruff et al. (2008). Best-fitting linear fits to means gave values of τD of 192 ms for WT and 115 ms for both RKS561L and Rv−/−, similar to values in Table 1 for a larger sample of rods for which values of τD were determined rod by rod and then averaged.
RKS561L and Rv−/− on a GAP overexpressing background
Recent experiments indicate that the decay of light-activated phosphodiesterase is rate limiting for the decline of the mouse rod flash response (Krispel et al., 2006; Tsang et al., 2006; Chen et al., 2010a; Gross and Burns, 2010; but see Doan et al., 2009). Overexpression of GAPs on a WT background has been shown to produce a significant decrease in both τREC and τD (Krispel et al., 2006; Chen et al., 2010a), whereas a twofold to fourfold overexpression of GRK1 was reported to produce only modest decreases in τREC and no significant change in τD (Krispel et al., 2006; Sakurai et al., 2011). Our measurements indicate that more extensive overexpression of GRK1 and the deletion of the gene for recoverin produce highly significant decreases in both τREC and τD and question the conclusion that inactivation of PDE* is rate limiting for the decay of the rod response (Sakurai et al., 2011).
The experiments of Figure 5 were designed to resolve this uncertainty. Both RKS561L and Rv−/− mice were mated with R9AP95 mice, which our previous experiments have shown to overexpress the GAP complex proteins by approximately sixfold (Chen et al., 2010a). In mice with the R9AP95 transcript on a WT background, τREC was reduced to 60 ± 8 ms, and τD was decreased to 53 ± 2 ms (Table 1), which are the fastest dark-adapted mouse rod responses recorded so far. The decrease in the time constants of decay can be directly attributable to an increase in the rate of inactivation of PDE* via hydrolysis of transducin–GTP to transducin–GDP (Krispel et al., 2006; Chen et al., 2010a); overexpression of GAPs has by itself no effect on the rate of decay of Rh* (Chen et al., 2010a).
Figure 5.
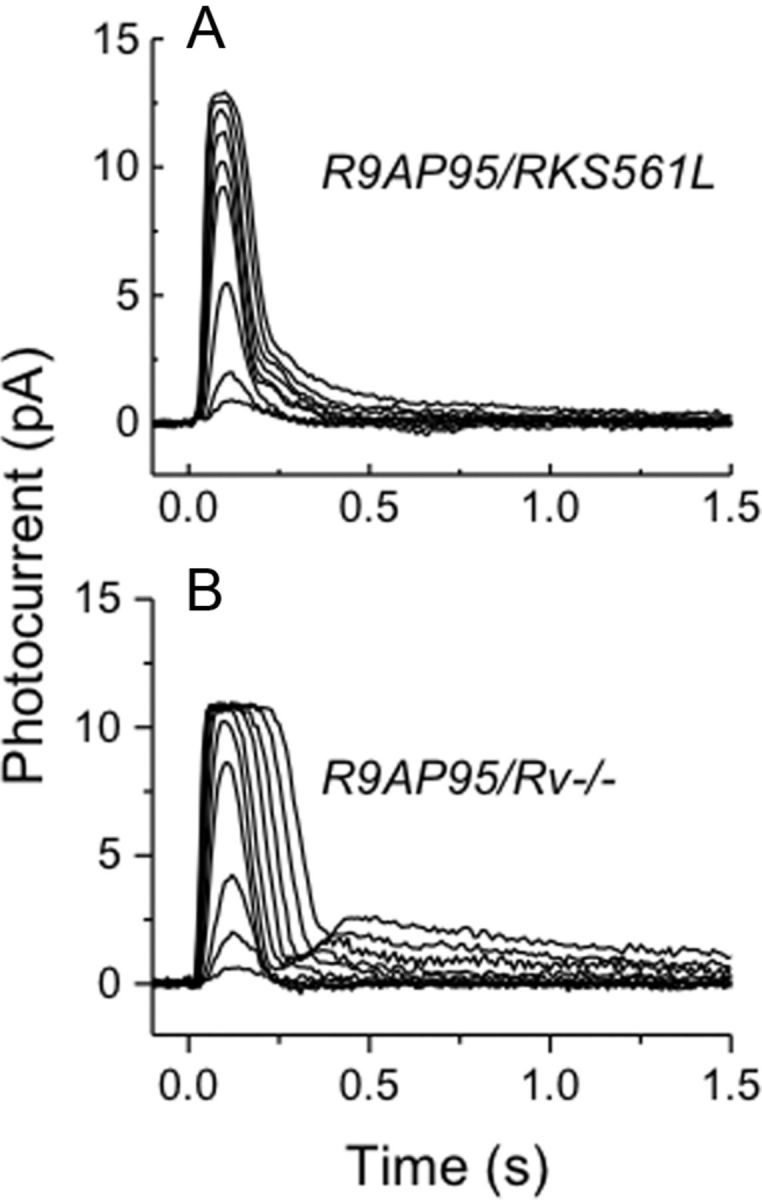
Responses of RKS561L and Rv−/− rods on a GAP overexpressed background. A, Mean light responses of four R9AP95/RKS561L rods to 20 ms flashes given at t = 0 at the following intensities (in photons μm−2): 17, 43, 158, 453, 645, 863, 1120, 1870, and 2430. B, Mean light responses of eight R9AP95/Rv−/− rods to 20 ms flashes given at t = 0 at the following intensities (in photons μm−2): 3, 9, 23, 75, 130, 240, 430, 780, 1500, and 2800.
A similar increase in response decay was also seen when the GAPs were overexpressed on either a RKS561L or Rv−/− background. Comparison of the responses in Figure 5, A and B, with those of Figure 3, B and C, shows that overexpression of GAPs produces a dramatic speeding of the response, with acceleration of the major time constant of decay comparable with that observed when the GAPs are overexpressed on a WT background (see Table 1). In addition, both responses show a slower recovery phase of smaller amplitude that is especially prominent in R9AP95;Rv−/− rods, which we have not attempted to describe quantitatively and whose origin is unclear.
These experiments demonstrate that the time constant of decay of Rh* can be no greater than ∼50 ms in WT rods, as well as in RKS561L and Rv−/− rods; light-activated PDE* decay therefore remains rate limiting when GRK1 activity is increased in our experiments. We conclude that the decreases in decay time observed when GRK1 is overexpressed or recoverin is deleted from the genome are the result of an increase in the rate of light-activated PDE* decay and not of Rh* decay. Moreover, Makino et al. (2004) showed that response decay is accelerated even when recoverin is knocked out on a GCAP−/− background (their Fig. 6A), ruling out the possibility that deletion of recoverin is speeding response recovery by altering the rate of the cyclase. The data in Table 1 show that the sensitivity of both R9AP95;RKS561L and R9AP95;Rv−/− rods is greater than that of R9AP95 rods, although only the difference with R9AP95;Rv−/− is significant. Increasing the rate of Rh* phosphorylation would be expected to further decrease sensitivity, not increase it. We have no explanation for this surprising observation.
Single-photon responses
In Figure 6A, we show SPRs averaged from 41 WT rods, 16 RKS561L rods, and 11 Rv−/− rods, calculated from the squared mean and variance of the response as described previously (Chen et al., 2000; Tsang et al., 2006). Response waveforms have been normalized to the peak photocurrent cell by cell and averaged; therefore, they give the fraction of channels closed per photon for the three mouse lines. SPRs of RKS561L and Rv−/− rods show the same accelerated decay as responses to brighter illuminations (Fig. 3). The peak amplitudes of the three responses were quite similar, indicating that single photons closed nearly the same fraction of channels even after GRK1 expression was greatly increased.
The weak sensitivity of the SPR amplitude to GRK1 expression is surprising if GRK1 and G-protein compete for mutually exclusive binding to Rh*. In such a scheme, it can be shown that the average number of activated G-proteins produced by each phosphorylated form of Rh* (except the one capped with high probability by arrestin) should be proportional to the ratio of the forward rate constant for G-protein binding and the forward rate constant of GRK1 binding. The forward rate of GRK1 binding is presumably proportional to the concentration of free GRK1 on the disk membrane. Consequently, increasing free GRK1 by a factor of x on the disk membrane should reduce the average number of activated G-proteins by a factor of x. Furthermore, if we assume that the deactivation of light-activated PDE* is much slower than the deactivation of Rh* in WT mouse rods and rate limiting for the decay of the response (Krispel et al., 2006; Tsang et al., 2006; Chen et al., 2010a; Gross and Burns, 2010; but see Doan et al., 2009), we might expect that increasing free GRK1 by a factor of x should produce an approximate scaling of the WT SPR by a factor of x with little or no detectable change in the rate of decay of the tail of the SPR. Because the SPRs in Figure 6A differ dramatically from these expectations, we speculate that GRK1 may not compete with G-protein for binding to Rh*. One way this might occur is if each form of Rh* that can activate G-protein must undergo a conformational change before it can be phosphorylated. In this scenario, when Rh* is in a conformation in which it can bind G-protein, it either binds G-protein or undergoes the conformational change so binding cannot occur; the rate of the change in conformation is independent of GRK1 concentration. If the rate of phosphorylation is high enough in WT mouse rods, making it even higher by increasing free GRK1 will by itself have a diminished effect on the number of activated G-proteins produced and the amplitude of the SPR.
The black curves in Figure 6A are predictions of the photoreceptor response based on a model we published previously (Chen et al., 2010b) but altered such that (1) Rh* changes conformation before phosphorylation, (2) once the change in conformation has occurred, RK binds and phosphorylates at a rate proportional to the RK expression level, and (3) RK also increases the rate of decay of light-activated PDE*. The number of activated G-proteins varies across the three genotypes in the model by only 13%. Figure 6B–D compares averaged waveforms and calculations with this same model for WT, RK561L, and Rv−/− rods over a broader range of flash intensities. It is worth noting that the slower phase of recovery of the response to intermediate and bright flash intensities cannot be captured by our model. It appears that the model is lacking some slow process that we do not understand.
In the final two rows of Table 1, we give kinetic and sensitivity parameters from RK+/− and RKBark7 rods, which express GRK1 by ∼40% and 15% of WT levels (Fig. 1F). Comparison of values of sensitivity expressed either as SfD (dark-adapted flash sensitivity) or I½ (the intensity required to produce a half-maximal response) indicates that sensitivity is altered by at most a factor of 2 when RK expression levels were changed by 80-fold. Changes in the rate of phosphorylation in the rod seem to have minimal effects on sensitivity, indicating that modulation of phosphorylation rate by recoverin is unlikely to play a significant role in the control of transduction gain (see Discussion).
Deletion of recoverin essentially eliminates modulation of flash response decay time in background light
Our experiments suggest that recoverin and GRK1 may act to accelerate the decay of the flash response in background light by modulating light-activated PDE* decay. If true, deletion of recoverin should alter the acceleration of response decay during light adaptation. The experiments of Figure 7 were designed to test this notion. The responses of rods of Rv−/− mice were recorded first in the absence of a background (black traces) and then in a series of backgrounds of gradually increasing steady intensity (colored traces). A and B of the figure show responses to flashes of 17 photons μm−2, and C and D show responses to flashes of 453 photons μm−2. The averaged responses are given in A and C. As the background intensity was increased, the peak response amplitude to flashes of light diminished, a well-known feature of light adaptation (Fain et al., 2001). Responses were then normalized rod by rod to the peak amplitude of the response, and the normalized records are given in B and D. For the dimmer flash intensity (Fig. 7B), the normalized responses are essentially superimposable, indicating that the time course of decay was unaffected by the background light. For the brighter intensity (Fig. 7D), responses show a small acceleration of decay time with brighter illumination. However, this effect is much less than previously reported for WT mouse rods (Woodruff et al., 2008; Chen et al., 2010b).
Figure 7.
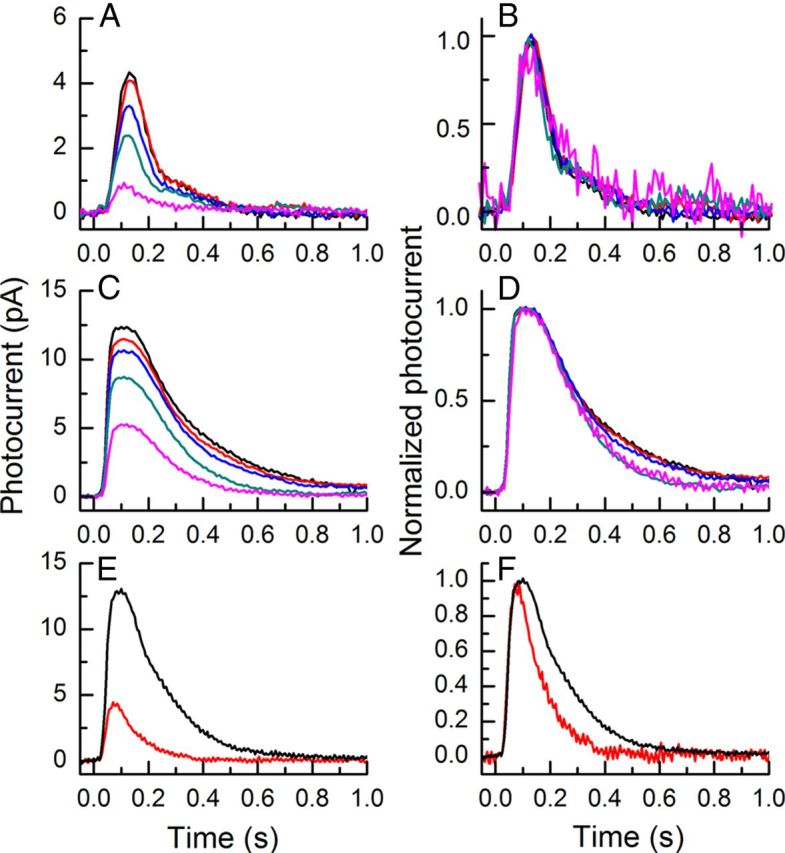
Responses of Rv−/− rods in background light. A, Mean light responses of three or four Rv−/− rods to 20 ms flashes given at t = 0 at an intensity of 17 photons μm−2 in the absence of background light (black) and the presence of steady backgrounds of the following intensities (in photons μm−2 s−1): 13 (red), 38 (blue), 118 (dark cyan), and 438 (magenta). B, Same responses as in A but normalized rod by rod to the peak amplitude of the response of each rod and then averaged. C, Mean light responses of three or four Rv−/− rods to 20 ms flashes given at t = 0 at an intensity of 453 photons μm−2 in the absence of background light (black) and the presence of steady backgrounds of the following intensities (in photons μm−2 s−1): 13 (red), 38 (blue), 118 (dark cyan), and 438 (magenta). D, Same responses as in C but normalized rod by rod to the peak amplitude of the response of each rod and then averaged. E, Mean light responses of seven RKS561L rods to 20 ms flashes given at t = 0 at an intensity of 230 photons μm−2, in the absence of background light (black trace) and the presence of a steady background illumination of 1350 photons μm−2 s−1. F, Same responses as in E but normalized rod by rod to the peak amplitude of the response of each rod and then averaged.
Overexpression of GRK1 does not eliminate response acceleration in background light. In Figure 7E, we show mean responses from seven RKS561L rods to flashes of 230 photons μm−2, dark adapted (black traces) or in the presence of a background of 1350 photons μm−2 s−1. These same responses are shown in Figure 7F normalized rod by rod to the peak amplitude of the responses as in Figure 7, B and D. Single-exponential fits to the mean responses give values of τREC of 139 ms for the dark-adapted response and 97 ms for the response in the presence of the background; these are similar to the means determined by averaging values from individual rods (mean ± SE, dark adapted, 125 ± 32 ms; light-adapted, 84 ± 8 ms). These results are representative of recordings from 15 rods in two experiments at two different flash intensities. We interpret these experiments to show that there is sufficient recoverin in the rod to produce at least partial modulation of response decay even when the concentration of GRK1 has been substantially increased in the RKS561L retinas.
One possible explanation for our results is that GRK1 (under the control of recoverin) is phosphorylating one of the proteins of the transduction cascade and accelerating response decay during light adaptation. To test for a role of the GAPs, we recorded from RGS9-1 knock-out rods with and without overexpression of GRK1. RGS9 knock-out rods lack not only the RGS9-1 protein but also Gβ5-L, another protein of the GAP complex (Chen et al., 2000); our measurements from these rods gave mean ± SE values for τREC of 3.7 ± 0.8 s (n = 30 rods) and τD of 7.7 ± 0.5 s (n = 26 rods). For rods lacking RGS9-1 that were also RKS561L and overexpressed GRK1, we obtained a mean τREC of 3.8 ± 0.6 s (n = 19 rods) and a mean τD of 7.7 ± 0.7 s (n = 13 rods). The values of τREC and τD for rods from these two animals were not significantly different. These experiments show that the GAPs are required for overexpression of GRK1 to accelerate response decay and are consistent with phosphorylation of one of the proteins of the GAP complex by GRK1. However, we cannot exclude the possibility that PDEγ or the α subunit of transducin is the site of action of the kinase.
Discussion
We have overexpressed rhodopsin kinase in mouse rods, expecting from previous results that an increase in GRK1 activity would reduce response amplitude but not affect the time course of the response (Krispel et al., 2006; Tsang et al., 2006; Woodruff et al., 2008; Gross and Burns, 2010). What we found instead was the opposite: response amplitude was nearly unaffected, but the decay time of the response was accelerated (Figs. 3B, 4, 6A). Similar effects are produced by deletion of the recoverin gene (Figs. 3C, 4, 6A; see Makino et al., 2004), which should also increase GRK1 activity. Our results are most simply explained if rhodopsin kinase together with recoverin act to modulate light-activated PDE* decay and are responsible for the acceleration of the falling phase of the rod response in background light.
Rhodopsin kinase expression and rod sensitivity
Our experiments indicate that expression of rhodopsin kinase over a range of 80-fold (Fig. 1F) alters the sensitivity of the rod response by at most a factor of 2 (Fig. 6A). A similar insensitivity of rod response amplitude to kinase expression level has been observed previously for rhodopsin kinase underexpression (Chen et al., 1999, 2010a) and overexpression (Krispel et al., 2006; Sakurai et al., 2011) over a less-extensive range, and as well as for the knocking out of the recoverin gene (Makino et al., 2004). In aggregate, these results indicate that the amplitude of the rod response is remarkably insensitive to changes in GRK1 expression level.
Some of this apparent insensitivity of response amplitude to rate of phosphorylation could be the result of the feedback action of the guanylyl cyclase. Makino et al. (2004) showed that the knocking out of recoverin produced a larger change in response sensitivity on a GCAP−/− background than on a WT background, and similar results have been reported recently for increases and decreases in GRK1 expression (Gross et al., 2012). Moreover, all of our SPRs in Figure 6A can be fit by model parameters with a PDE inactivation time constant fixed at the WT value; however, these same parameters give a fixed value for τD that is equal to the WT PDE inactivation time constant, which is inconsistent with the data in Figure 4.
We can account for the effect of GRK1 overexpression on τD and the limited effect of GRK1 expression level on sensitivity by modifying our previously published model (Chen et al., 2010b), on the assumption that Rh* must transit into a state available for phosphorylation and that the transit time into this Rh* conformation is slow compared with the rate of rhodopsin phosphorylation. This obligate conformational change of Rh* before phosphorylation may play a role in diminishing the dependence of Rh* decay on the rate of phosphorylation. We are presently attempting to test this model by recording from RKBark7 and RKS561L rods in which the GCAPs and cyclase feedback have been deleted.
Whatever the mechanism of constancy of response sensitivity with GRK1 expression level, our results together with previously published studies indicate that phosphorylation of rhodopsin by GRK1 and the regulation of phosphorylation rate by recoverin are unlikely to play a significant role in the regulation of sensitivity in a rod. Although the role of the kinase in phosphorylation of rhodopsin is indisputable and absolutely required for the extinction of Rh* (Chen et al., 1999) and although the regulation of the phosphorylation rate by recoverin has been extensively documented in vitro (Kawamura, 1993; Chen et al., 1995, 2010a; Klenchin et al., 1995) and in intact rods (Chen et al., 2010a), the regulation of rate of phosphorylation seems to play a minimal role in the modulation of sensitivity. This conclusion is supported by a previous finding that deletion of recoverin has no detectable effect on the changes in sensitivity that occur during exposure to steady background light (Makino et al., 2004; Chen et al., 2010b).
Rhodopsin kinase expression and response waveform
Our results indicate that GRK1 and recoverin can alter the decay of light-activated PDE* and regulate the decay time of the rod light response. This novel conclusion would explain our previous result that RK+/− rods in which GAP is sixfold overexpressed (RK+/−;R9AP95) decay more slowly than RK+/+;R9AP95 rods (Chen et al., 2010a, compare their Fig. 1C,D), and τD is also significantly greater (73 ± 4 vs 54 ± 3 ms; Chen et al., 2010a, their Table 1). Because light-activated PDE* decay remains rate limiting in RK+/− rods, we hypothesize that responses decay more slowly in GRK1 heterozygotes because underexpression of rhodopsin kinase slows light-activated PDE* decay. A similar comparison in this present study of values of τREC and τD between RKS561L;R9AP95 rods and R9AP95 rods (in which the GAP molecules are sixfold overexpressed and GRK1 is or is not 12-fold overexpressed) reveals no significant difference (Table 1). It is possible that decay of light-activated PDE* in R9AP95 rods is already so fast that the decay of the light response becomes limited by Rh* decay. Our model predicts that increasing GRK1 expression would have only a limited effect on the rate of Rh* decay, because rhodopsin obligatorily transits through a state in which it can activate transducin but cannot be phosphorylated. This may explain why we can detect no significant acceleration in the time course of decay when we overexpress GRK1 on an R9AP95 background.
Rhodopsin kinase and modulation of response decay in background light
Many previous studies on amphibian photoreceptors have shown that increases in background light produce an acceleration of the time course of decay of responses to superimposed flashes (Fain et al., 2001), and a similar phenomenon has been observed more recently in the rods of the mouse (Woodruff et al., 2008). Because this effect is accompanied by a decrease in τD and is no longer observed in rods with a mutation of the PDEγ subunit (Woodruff et al., 2008), we have previously proposed that response acceleration is caused by modulation of the decay time of light-activated PDE*.
The results in this present study indicate that modulation of light-activated PDE* decay can be produced by the action of GRK1 and can be regulated by the Ca2+-binding protein recoverin. Increases in the rate of response decay do not occur in background light in Rv−/− rods (Fig. 7) (see also Makino et al., 2004). We propose that the decrease in Ca2+ concentration produced by steady background light causes the release of recoverin from GRK1 and an increase in the rate of phosphorylation of one of the proteins of the transduction cascade. In support of this notion, our recordings show no significant difference in the time constant of decay of RGS9−/− rods and RGS9−/−;RKS561L rods, indicating that the GAPs must be present for GRK1 to modulate the decay of the response. It is possible that GRK1 phosphorylates one of the GAPs, but we cannot exclude the possibility of phosphorylation of PDEγ or the α subunit of transducin. Deletion of recoverin produces an acceleration of both τREC and τD nearly to their values in rods exposed to the brightest backgrounds we have tested (Woodruff et al., 2008). Thus, regulation of GRK1 by recoverin may be sufficient to produce the entire range of response acceleration observed during the light adaptation of mouse rods.
Our proposal that GRK1 and recoverin regulate response recovery during background illumination has an important implication. Because recoverin deletion nearly eliminates modulation of response recovery rate but has no effect on the dependence of rod sensitivity on background light (Makino et al., 2004; Chen et al., 2010b), receptor response decay and sensitivity appear to be regulated by different mechanisms. The decrease in sensitivity in background light has been shown previously to be caused in part from guanylyl cyclase regulation by the GCAPs (Mendez et al., 2001) and in part from some other mechanism, which we have proposed to be regulation of spontaneous and light-evoked PDE* decay (Chen et al., 2010b). In the complete absence of any biochemical experiments that would elucidate the mechanisms of PDE* modulation, it is not possible for us to speculate how spontaneous or light-activated PDE* is regulated or whether the regulation is entirely dependent on the free concentration of outer segment Ca2+. Future experiments will investigate the separate roles of light-activated and spontaneous PDE* and the effects of these various mechanisms on the changes in rod response properties during adaptation to steady light and after bleaching.
Footnotes
This work was supported by National Institutes of Health Grants EY01844 (G.L.F.) and EY013811 (C.-K.C.). We thank the transgenic mouse core facility at the University of Utah for generating transgenic mouse lines.
References
- Adams RA, Liu X, Williams DS, Newton AC. Differential spatial and temporal phosphorylation of the visual receptor, rhodopsin, at two primary phosphorylation sites in mice exposed to light. Biochem J. 2003;374:537–543. doi: 10.1042/BJ20030408. [DOI] [PMC free article] [PubMed] [Google Scholar]
- Bruel C, Cha K, Reeves PJ, Getmanova E, Khorana HG. Rhodopsin kinase: expression in mammalian cells and a two-step purification. Proc Natl Acad Sci U S A. 2000;97:3004–3009. doi: 10.1073/pnas.97.7.3004. [DOI] [PMC free article] [PubMed] [Google Scholar]
- Bush RA, Makino C. Recoverin shapes the photoresponse of retinal rods. In: Philippov P, Koch KW, editors. Neuronal calcium sensor proteins. Hauppauge, NY: Nova Science Publishers; 2007. pp. 153–180. [Google Scholar]
- Chen CK, Inglese J, Lefkowitz RJ, Hurley JB. Ca2+-dependent interaction of recoverin with rhodopsin kinase. J Biol Chem. 1995;270:18060–18066. doi: 10.1074/jbc.270.30.18060. [DOI] [PubMed] [Google Scholar]
- Chen CK, Burns ME, Spencer M, Niemi GA, Chen J, Hurley JB, Baylor DA, Simon MI. Abnormal photoresponses and light-induced apoptosis in rods lacking rhodopsin kinase. Proc Natl Acad Sci U S A. 1999;96:3718–3722. doi: 10.1073/pnas.96.7.3718. [DOI] [PMC free article] [PubMed] [Google Scholar]
- Chen CK, Burns ME, He W, Wensel TG, Baylor DA, Simon MI. Slowed recovery of rod photoresponse in mice lacking the GTPase accelerating protein RGS9-1. Nature. 2000;403:557–560. doi: 10.1038/35000601. [DOI] [PubMed] [Google Scholar]
- Chen CK, Eversole-Cire P, Zhang H, Mancino V, Chen YJ, He W, Wensel TG, Simon MI. Instability of GGL domain-containing RGS proteins in mice lacking the G protein beta-subunit Gbeta5. Proc Natl Acad Sci U S A. 2003;100:6604–6609. doi: 10.1073/pnas.0631825100. [DOI] [PMC free article] [PubMed] [Google Scholar]
- Chen CK, Woodruff ML, Chen FS, Chen D, Fain GL. Background light produces a recoverin-dependent modulation of activated-rhodopsin lifetime in mouse rods. J Neurosci. 2010a;30:1213–1220. doi: 10.1523/JNEUROSCI.4353-09.2010. [DOI] [PMC free article] [PubMed] [Google Scholar]
- Chen J, Woodruff ML, Wang T, Concepcion FA, Tranchina D, Fain GL. Channel modulation and the mechanism of light adaptation in mouse rods. J Neurosci. 2010b;30:16232–16240. doi: 10.1523/JNEUROSCI.2868-10.2010. [DOI] [PMC free article] [PubMed] [Google Scholar]
- Doan T, Azevedo AW, Hurley JB, Rieke F. Arrestin competition influences the kinetics and variability of the single-photon responses of mammalian rod photoreceptors. J Neurosci. 2009;29:11867–11879. doi: 10.1523/JNEUROSCI.0819-09.2009. [DOI] [PMC free article] [PubMed] [Google Scholar]
- Fain GL. Sensory transduction. Sunderland, MA: Sinauer; 2003. [Google Scholar]
- Fain GL, Matthews HR, Cornwall MC, Koutalos Y. Adaptation in vertebrate photoreceptors. Physiol Rev. 2001;81:117–151. doi: 10.1152/physrev.2001.81.1.117. [DOI] [PubMed] [Google Scholar]
- Fuortes MG, Hodgkin AL. Changes in time scale and sensitivity in the ommatidia of Limulus. J Physiol. 1964;172:239–263. doi: 10.1113/jphysiol.1964.sp007415. [DOI] [PMC free article] [PubMed] [Google Scholar]
- Gross OP, Burns ME. Control of rhodopsin's active lifetime by arrestin-1 expression in mammalian rods. J Neurosci. 2010;30:3450–3457. doi: 10.1523/JNEUROSCI.5391-09.2010. [DOI] [PMC free article] [PubMed] [Google Scholar]
- Gross OP, Pugh EN, Jr, Burns ME. The contribution of calcium feedback regulation to stability and reproducibility of single-photon responses. Invest Ophthalmol Vis Sci. 2012;53 e-Abstract 4135. [Google Scholar]
- Hecht S, Shlaer S. Intermittent stimulation by light. V. The relation between intensity and critical frequency for different parts of the spectrum. J Gen Physiol. 1936;19:965–977. doi: 10.1085/jgp.19.6.965. [DOI] [PMC free article] [PubMed] [Google Scholar]
- Inglese J, Koch WJ, Caron MG, Lefkowitz RJ. Isoprenylation in regulation of signal transduction by G-protein-coupled receptor kinases. Nature. 1992;359:147–150. doi: 10.1038/359147a0. [DOI] [PubMed] [Google Scholar]
- Kawamura S. Rhodopsin phosphorylation as a mechanism of cyclic GMP phosphodiesterase regulation by S-modulin. Nature. 1993;362:855–857. doi: 10.1038/362855a0. [DOI] [PubMed] [Google Scholar]
- Klenchin VA, Calvert PD, Bownds MD. Inhibition of rhodopsin kinase by recoverin. Further evidence for a negative feedback system in phototransduction. J Biol Chem. 1995;270:16147–16152. doi: 10.1074/jbc.270.27.16147. [DOI] [PubMed] [Google Scholar]
- Krispel CM, Chen D, Melling N, Chen YJ, Martemyanov KA, Quillinan N, Arshavsky VY, Wensel TG, Chen CK, Burns ME. RGS expression rate-limits recovery of rod photoresponses. Neuron. 2006;51:409–416. doi: 10.1016/j.neuron.2006.07.010. [DOI] [PubMed] [Google Scholar]
- Li S, Chen D, Sauv é Y, McCandless J, Chen YJ, Chen CK. Rhodopsin-iCre transgenic mouse line for Cre-mediated rod-specific gene targeting. Genesis. 2005;41:73–80. doi: 10.1002/gene.20097. [DOI] [PubMed] [Google Scholar]
- Makino CL, Dodd RL, Chen J, Burns ME, Roca A, Simon MI, Baylor DA. Recoverin regulates light-dependent phosphodiesterase activity in retinal rods. J Gen Physiol. 2004;123:729–741. doi: 10.1085/jgp.200308994. [DOI] [PMC free article] [PubMed] [Google Scholar]
- Mendez A, Burns ME, Sokal I, Dizhoor AM, Baehr W, Palczewski K, Baylor DA, Chen J. Role of guanylate cyclase-activating proteins (GCAPs) in setting the flash sensitivity of rod photoreceptors. Proc Natl Acad Sci U S A. 2001;98:9948–9953. doi: 10.1073/pnas.171308998. [DOI] [PMC free article] [PubMed] [Google Scholar]
- Rao A, Dallman R, Henderson S, Chen CK. Gβ5 is required for normal light responses and morphology of retinal ON-bipolar cells. J Neurosci. 2007;27:14199–14204. doi: 10.1523/JNEUROSCI.4934-07.2007. [DOI] [PMC free article] [PubMed] [Google Scholar]
- Sakurai K, Young JE, Kefalov VJ, Khani SC. Variation in rhodopsin kinase expression alters the dim flash response shut off and the light adaptation in rod photoreceptors. Invest Ophthalmol Vis Sci. 2011;52:6793–6800. doi: 10.1167/iovs.11-7158. [DOI] [PMC free article] [PubMed] [Google Scholar]
- Tsang SH, Woodruff ML, Chen CK, Yamashita CY, Cilluffo MC, Rao AL, Farber DB, Fain GL. GAP-Independent termination of photoreceptor light response by excess gamma subunit of the c-GMP-phosphodiesterase. J Neurosci. 2006;26:4472–4480. doi: 10.1523/JNEUROSCI.4775-05.2006. [DOI] [PMC free article] [PubMed] [Google Scholar]
- Wang Z, Wen XH, Ablonczy Z, Crouch RK, Makino CL, Lem J. Enhanced shutoff of phototransduction in transgenic mice expressing palmitoylation-deficient rhodopsin. J Biol Chem. 2005;280:24293–24300. doi: 10.1074/jbc.M502588200. [DOI] [PMC free article] [PubMed] [Google Scholar]
- Woodruff ML, Janisch KM, Peshenko IV, Dizhoor AM, Tsang SH, Fain GL. Modulation of phosphodiesterase6 turnoff during background illumination in mouse rod photoreceptors. J Neurosci. 2008;28:2064–2074. doi: 10.1523/JNEUROSCI.2973-07.2008. [DOI] [PMC free article] [PubMed] [Google Scholar]