

Abstract
The visual system is one of the most energetically demanding systems in the brain. The currency of energy is ATP, which is generated most efficiently from oxidative metabolism in the mitochondria. ATP supports multiple neuronal functions. Foremost is repolarization of the membrane potential after depolarization. Neuronal activity, ATP generation, blood flow, oxygen consumption, glucose utilization, and mitochondrial oxidative metabolism are all interrelated. In the retina, phototransduction, neurotransmitter utilization, and protein/organelle transport are energy-dependent, yet repolarization-after-depolarization consumes the bulk of the energy. Repolarization in photoreceptor inner segments maintains the dark current. Repolarization by all neurons along the visual pathway following depolarizing excitatory glutamatergic neurotransmission, preserves cellular integrity and permits reactivation. The higher metabolic activity in the magno- versus the parvo-cellular pathway, the ON- versus the OFF-pathway in some (and the reverse in other) species, and in specialized functional representations in the visual cortex, all reflect a greater emphasis on the processing of specific visual attributes. Neuronal activity and energy metabolism are tightly coupled processes at the cellular and even at the molecular levels. Deficiencies in energy metabolism, such as in diabetes, mitochondrial DNA mutation, mitochondrial protein malfunction, and oxidative stress can lead to retinopathy, visual deficits, neuronal degeneration, and eventual blindness.
Keywords: ATP, coupling, cytochrome c oxidase, neuronal activity, retina, visual cortex
The brain is one of the highest energy demanding tissues of the human body. Comprising only about 2% of the body weight, it consumes 20% of the total oxygen and about a quarter of the total glucose used for energy supply.1–3 Within the brain, the visual system ranks amongst the highest energy-consuming systems.4 This is of interest and importance because defects in energy metabolism often lead to visual deficits, if not frank blindness. This review will consider some of the key contributors to this high energy demand in the visual system. Bear in mind, however, that our knowledge of this topic is still modest in many parts of the visual system and almost nil in others. The emphasis will be on the retina and the primary visual cortex, with a minor discussion on the lateral geniculate nucleus. For more in-depth discussions of energy budget in the brain, the readers are referred to several excellent reviews in recent years.4–8
Before considering the visual system in greater detail, some of the salient features of energy metabolism applicable to all neurons will be reviewed. Energy is generated in two ways: glycolytic and oxidative. The energetic advantage of oxidative metabolism in the mitochondria far outweighs that of glycolytic metabolism in the cytosol, as one molecule of glucose yields only 2 molecules of ATP via the glycolytic pathway but up to 36 molecules of ATP via the oxidative pathway. Neurons, unlike glia, depend almost entirely on oxidative metabolism for their energy supply. Whereas glial cells can survive for long periods under anoxic conditions, neurons are the first cells to die when oxygen is lacking.9 Oxygen is delivered by the blood, which also brings in nutrients such as glucose, and both oxygen and nutrients contribute to the final yield of ATP in the mitochondria. A decrease in blood flow below a critical level can cause a 90% drop in ATP within 5 minutes in the brain, and if not corrected in time will lead to cell death.10 The visual system and especially the retina are especially sensitive to hypoxia.11 Thus, blood flow, glucose uptake, and oxidative metabolism are all important factors in considering energy metabolism. There are many techniques which contribute to our understanding of energy metabolism in the brain. These include: functional magnetic resonance imaging (for blood flow and oxygen consumption), positron emission tomography (for regional glucose or other tracer uptake), 2-deoxyglucose (for glucose utilization), and cytochrome c oxidase histo-, cyto-, and bio-chemistry (reflecting the cell’s oxidative capacity at the cellular and subcellular levels), as well as near-infrared spectroscopy.12–19
What are some of the energy-consuming functions of neurons? The synthesis of proteins, neurotransmitters, and other molecules naturally comes to mind, as many neurons have abundant rough endoplasmic reticulum (Nissl substance) and free ribosomes. Yet, protein synthesis actually consumes relatively little energy20,21 and in the rabbit retina, it accounts for only 12 nmol ATP/min/retina, which represents only 1.3% of total energy consumption.21 Likewise, the loading, release, recycling, and turnover of neurotransmitter molecules consume a minor fraction of energy in neurons.4,6,21 Active transport of macromolecules and organelles along microtubules between the cell bodies and their processes (dendrites and especially axons) requires ATP;22,23 but, again, this process accounts for only a minor portion of energy consumption by neurons. What, then, is the most energy demanding function of neurons?
By all accounts, active transport of ions against their concentration and electrical gradients is by far the largest energy consuming function of neurons.4,6,24 Active ion transport serves mainly to repolarize the plasma membrane after depolarization, to re-establish the transmembrane ionic gradient for reactivation. This is accomplished mainly by Na+K+ATPase,25 which utilizes 1 ATP for every 3 Na+ pumped out in exchange for 2 K+ brought into the cell.26 The maintenance of concentration gradients of other ions, such as Ca++, Cl−, and HCO3−, is also coupled to the Na+K+ATPase.4 It is important to remember that depolarization does not have to, (and indeed, in most cases does not), lead to local action potentials. With this in mind, it immediately becomes obvious that dendrites, with their numerous and extensive branching, represent the single neuronal compartment that receives the bulk of incoming depolarizing inputs, and their membranes, whose surface area far exceeds those of cell bodies and even axons, have to constantly pump cations out of the cells to maintain the ionic gradient. Dendrites, therefore, are the major energy consumers of the nervous system.24 Cell bodies, on the other hand, receive primarily inhibitory inputs, and repolarization after hyperpolarization is mainly passive and requires relatively little energy.24 Those cell bodies that are contacted directly by excitatory synapses will have a greater energy demand than those that receive only inhibitory inputs.24,27 Along the axon trunks, the propagation of action potentials, especially of the saltatory type in myelinated axons, consumes only 0.3% to 3% of total energy.28 For this reason, the white matter invariably gives a very low signal with metabolic markers and approaches, such as 2-deoxyglucose12 and cytochrome c oxidase.24 Likewise, action potentials contribute minimally to functional imaging signals.29 Axon terminals may have low, moderate, or high levels of energy demand depending on how frequently their membranes depolarize, ie, how tonically active they are.24 Thus, a single neuron is not metabolically homogeneous, with mitochondrial content and cytochrome c oxidase levels being the highest in dendrites and lowest in axon trunks,24 thereby attesting to the exquisite manner that neurons conserve energy production even at the subcellular level, so that energy is generated only when and where energy is needed. Neuronal activity and energy metabolism are thus tightly coupled24,30 (Figure 1). As long as the two are kept in proper balance, the nervous system will function adequately. An imbalance that tilts the scale in either direction, can be tolerated up to a point. However, beyond a certain threshold level, which undoubtedly varies among neurons and among brain regions, dire consequences can result. The visual system with its high energy demand is particularly vulnerable to functional deficits induced by deficiencies in energy metabolism. Specific examples will be given toward the end of this review to illustrate this point.
Figure 1.

Schematic diagram of the tight coupling between neuronal activity and energy metabolism. Depolarizing neuronal activity requires the action of Na+K+ATPase and other ATPases to repolarize the membrane for reactivation. This is the single most energy-consuming function of neurons. Such energy demand is met under normal conditions by increased blood flow and glucose utilization and increased cellular respiration in the mitochondria, where electron transport is coupled to oxidative phosphorylation, resulting in the synthesis of ATP. Cytochrome c oxidase (COX) is the terminal enzyme of the electron transport chain and reflects the oxidative capacity of neurons. The hydrolysis of ATP by the ATPases yields ADP, which is used to resynthesize ATP and is itself a controlling factor for cellular respiration.
We now turn to the visual system and consider the special energy demands in the retina, lateral geniculate nucleus, and the visual cortex. Much more is known about the retina than any other visual centers, although the basic principles apply to all visual neurons.
The retina
Blood supply to the retina
The retina is considered one of the highest oxygen-consuming tissues of the body, exceeding even that of the brain.21,31,32 Blood supply to the outer retina (mainly the photoreceptor cells) comes from choroidal capillaries that originate from ciliary arteries, whose source is the ophthalmic artery. Blood supply to the inner retina, on the other hand, is provided by the central retinal artery, also a branch of the ophthalmic artery. Retinal vessels are autoregulated to optimize blood supply to meet the metabolic needs of the retina,33 and when oxygen is severely reduced, so will the amplitude of the electroretinogram, especially the b-wave,11 and visual performance will be impaired.34,35 An intrinsic protective mechanism to improve cellular oxygenation in experimental ocular hypertension and human glaucoma is reportedly an up-regulation of hemoglobin expression in the inner retina via erythropoietin signaling.36 In the last decade, a neuron-specific oxygen-carrying protein has been found to be concentrated in the retina approximately 100-fold higher than that in the brain.37 It was named neuroglobin (Ngb) because of its ability to bind oxygen and because of its distant relationship to hemoglobin and myoglobin. Ngb is expressed in all neurons of the retina, but not in the retinal pigment epithelium (RPE). Whereas Ngb mRNA is expressed mainly in neuronal cell bodies, Ngb proteins are concentrated in the ellipsoid portion of the inner segments of photoreceptor cells, the outer and inner plexiform layers, and in the ganglion cell layer. Thus, the distribution of Ngb correlates with regions of high mitochondrial content and cytochrome c oxidase activity and with local oxygen demands (see below). It is tempting to conclude that Ngb binds and facilitates delivery of oxygen to retinal neurons. However, the exact function of neuroglobin remains unclear.38
Glucose supply to the retina
Retinal neurons rely more on a ready supply of glucose than glial-derived lactate for their energy production.39 Blood-derived glucose has to traverse an outer and an inner blood retinal barrier (BRB) before reaching retinal neurons. The outer barrier is formed by tight junctions (zonulae occludens) between RPE cells, which are interposed between the choriocapillaries and the avascular outer retina. The inner barrier is composed of tight junctions between endothelial cells within retinal capillaries.40 However, both barrier cell types have facilitated glucose transporters (GLUTs, mainly GLUT1) that permit ATP- and sodium-independent passive movement of glucose across their plasma membranes.41,42 Once glucose crosses the RPE or the retinal endothelial cells, it can reach other cell types via additional GLUT1s found in the outer segments and cell bodies of photoreceptors, Müller cells, (and reportedly ganglion cells and the nerve fiber layer),41–43 as well as via GLUT3 localized mainly to the two plexiform layers, and less so to the inner nuclear layer.41,44
In retinal Müller glial cells, glucose is metabolized primarily to lactate rather than CO2.45,46 This is because Müller cells contain very few mitochondria47 and have to rely mainly on anaerobic glycolysis for their energy supply. Excess lactate is reportedly released by Müller cells45 and transferred to neurons via proton-coupled monocarboxylate transporters (Mct) present in Müller cell membranes.48 Lactate can then be converted to pyruvate and be a source of fuel for oxidative phosphorylation in neurons.45 Lactate accumulated in the subretinal space is allegedly transported via Mct1 and Mct3 in the apical and basolateral membranes, respectively, of RPE back to choroidal circulation.49–51
Oxidative capacity of the retina
The energy demand of various retinal layers and cell types can be gleaned from sections reacted for cytochrome c oxidase. This enzyme is complex IV or terminal enzyme of the electron transport chain, without which oxidative metabolism cannot be carried to completion. It is also one of the key enzymes that pump protons from inside of the mitochondria to the outside, setting up the proton motive force necessary for the synthesis of ATP by complex V.52 The level of cytochrome c oxidase reflects the oxidative capacity of neurons necessary to meet the local energy demand, a major portion of which, as discussed above, is for active ion pumping subsequent to excitatory synaptic and other functions that depolarize the membranes.24 The pattern of cytochrome c oxidase distribution in the retina is very consistent among different mammalian species53 (Figure 2). The inner segments of photoreceptors stand out as the most reactive layer of the retina. The outer segments are understandably non-reactive, as there are no mitochondria there; but the cell bodies of photoreceptors in the outer nuclear layer also have low levels of this enzyme.53 The cone pedicles, particularly in primates, are very reactive and form a mosaic pattern in tangential section through the outer portion of the outer plexiform layer, whereas rod spherules seldom contain reactive mitochondria. Cones also consume more energy than rods because they do not saturate in bright light and they use more ATP/sec for light transduction and phosphorylation.54–57 Bipolar cells, in general, have low levels of cytochrome c oxidase activity. However, a special type of bipolar cell first described in amphibians58 and later verified in other species including humans59 has a protrusion known as the Landolt club that extends into the outer nuclear layer. This protrusion is packed full of mitochondria.60 Recently, the calcium binding protein recoverin normally found in photoreceptors has been localized to the Landolt club as well.61 Although the functional significance of the Landolt club remains poorly understood, active ion transport deserves serious consideration. Both the outer and inner plexiform layers are quite reactive for cytochrome c oxidase. Notably, the OFF sublamina-a is more reactive than the ON sublamina-b of the inner plexiform layer in the ferret and cat, but the opposite is true for the macaque (Figure 2). This indicates that the ON or OFF system is preferentially more activated depending on the visual experience of the animal. Horizontal cells at the outer border of the inner nuclear layer and the large ganglion cells in the ganglion cell layer, are also highly reactive for cytochrome c oxidase, as is the nerve fiber layer within the retina. Interestingly, metabolically active cone pedicles, horizontal cells and ganglion cells, all form mosaic patterns with regular spacing in the macaque retina.53 This suggests that such periodicity is designed to match visual field representation with possibly a similar distribution of blood supply.
Figure 2.

Transverse sections of cytochrome c oxidase-reacted retinas from ferret (A), cat (B), squirrel monkey (C), and macaque monkey (D and E). A universal pattern is an intense labeling of the inner segments of photoreceptor cells and a dense labeling of cone pedicles (small arrows), the outer and inner plexiform layers, horizontal cells, the large ganglion cells, and the nerve fiber layer. Note that the OFF-sublamina-a of IPL in the ferret and cat is more reactive than the ON-sublamina-b, but the reverse is true for the primate, especially in the central portion of the retina (E). Arrowheads point to blood vessels.
Abbreviations: PE, pigment epithelium (removed from ferret and cat); OS, outer segment; IS, inner segment; ONL, outer nuclear layer; OPL, outer plexiform layer; INL, inner nuclear layer; IPL, inner plexiform layer, subdivided into a and b sublayers; GCL, ganglion cell layer; NFL, nerve fiber layer. Modified with permission from Kageyana and Wong-Riley.53
Correlation between energy generation and energy consumption
If the differential distribution of cytochrome c oxidase in the retina denotes regions of energy production, then the pattern should match that of energy demand, particularly that of an active energy-consuming enzyme, Na+K+ATPase, and in general it does. Na+K+ATPase is localized mainly in the plasma membrane and is densely distributed in the inner segments of photoreceptor cells, the outer plexiform layer, and the nerve fiber layer, whereas the inner plexiform layer and ganglion cells have moderate levels of this enzyme62 (Figure 3).
Figure 3.

Comparison of sections of the macaque retina reacted for cytochrome c oxidase (COX) (A) or immunoreacted for Na+K+ATPase (B) The patterns are comparable between the two, except that cytochrome c oxidase labeling is more prominent in the IPL, whereas the OPL is more intensely labeled by Na+K+ATPase. The pigment epithelium (PE), especially the apical portion, is strongly labeled by both. Abbreviations are the same as in Figure 2.
With retinal impulse blockade induced by intravitreal injection of tetrodotoxin (TTX), a voltage-dependent sodium channel blocker, the level of cytochrome c oxidase is significantly reduced in spiking ganglion cells, their intraretinal axons, and presumably their dendrites in the inner plexiform layer. The level of this enzyme in non-spiking photoreceptor, horizontal, and most amacrine cells are not affected by TTX. Likewise, the intensity of Na+K+ATPase labeling is markedly reduced in ganglion cells and the nerve fiber layer.62
Photoreceptor cells
The cytochrome c oxidase-rich ellipsoid portions of photoreceptor inner segments are filled with mitochondria that are much larger, more densely packed, and twice as abundant in cones as in rods (Figure 4). The total surface area of inner mitochondrial membrane in cones is 3-fold greater than that in rods and presumably accommodates more electron transport chain enzymes to generate more ATP.63,64 This energy is used primarily by Na+K+ATPase in the inner segments to pump out excess Na+ entering via cGMP-gated channels in the outer segments in the dark, thereby maintaining the dark current.65 In the resting state of the rabbit retina, about 50% of the energy generated supports the sodium pump and less than 5% is for “vegetative metabolism”.21 Cones consume much more ATP than rods in bright light because Na+ influx through cGMP-gated channels does not fall below half that in darkness, the turnover number of transducin is at least twice as that in rods, and rhodopsin kinase activity is also much higher in cones.54–57 Cones apparently depolarize more frequently than rods and at least in primates, cone pedicles contain many more mitochondria highly reactive for cytochrome c oxidase than rod spherules.53
Figure 4.
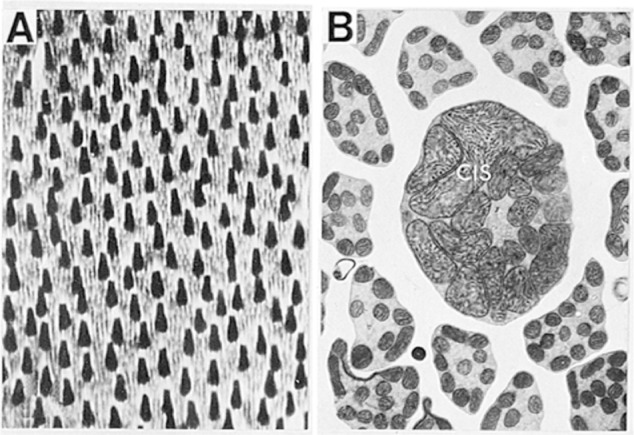
A) A tangential section of cytochrome c oxidase-reacted macaque retina through the inner segments of photoreceptor cells. Note that cone inner segments are much larger and are more intensely labeled by cytochrome c oxidase than those in rods. B) At the electron microscopic level, cone inner segments (CIS) contain much larger and more closely packed mitochondria than do rods. Modified with permission from Kageyana and Wong-Riley 1984.53
In addition to maintaining the dark current, photoreceptor cells are actively engaged in energy-dependent light transduction. Light induces the isomerization of the chromophore 11–cis-retinal to an all-trans-retinal, which dissociates from opsin and is reduced by retinol dehydrogenase (primarily RDH8 and RDH12) and their cofactor NADPH to an all-trans-retinol (vitamin A).66 The rate of this reduction is 10–40 times higher in cones than in rods.67 All-trans-retinol is transported to the RPE, where it is isomerized and oxidized to 11-cis-retinal, which is recycled back to photoreceptor cells. Opsin, in the meantime, undergoes a conformational change and activates the G-protein transducin to replace its Tα-GDP with Tα-GTP. Activated Tα-GTP, in turn, induces cGMP phosphodiesterase to convert cGMP to 5′-GMP. A decrease in cGMP concentration leads to the closing of ion channels in the outer segments, and photoreceptor cells hyperpolarize to light. Meanwhile, Tα-GTP is hydrolyzed to Tα-GDP in preparation for the next cycle, and rhodopsin is phosphorylated by opsin kinase to interact with arrestin for its own inactivation.64 All of these processes involve GTP or ATP. For example, the GDP-GTP exchange in Tα and the subsequent GTPase activity,68 the phosphorylation of each rhodopsin at up to three sites,69,70 and the consumption of 2–3 molecules of ATP for the conversion of each all-trans-retinal to all-trans-retinol and the regeneration of 11-cis-retinal.64 The total amount of ATP consumed varies among species and depends upon the intensity and duration of light exposure. However, all of the energy expenditure of phototransduction is still relatively small compared to that of the dark current.64 Recently, Miyazono’s group67 found in the carp retina that Müller cells convert all-trans-retinol to 11-cis-retinol and return it to the cones, where it is oxidized to 11-cis-retinal by a novel retinal-retinol redox (ALOL) coupling reaction that does not require the cofactor NADP+. However, the molecular mechanism of this coupling is not well understood at this time.
Energy requirements in darkness and in light
What does this all mean in terms of energy requirement? The absolute number of ATP molecules generated and used is likely to vary with species, age, life style, and time of the day. However, a calculation in the rabbit retina revealed some general modes of operation. More energy is required in the dark than in the light, and the retina relies more on oxidative than glycolytic metabolism for its energy supply.22 Neither of these observations comes as a surprise. Energy (expressed as a percentage of total phosphate generated in the dark) from glycolysis (calculated from lactate production) constitutes only 16% in both darkness and light. On the other hand, energy from oxidative metabolism (calculated from oxygen consumption, assuming a P:O ratio of 3) constitutes 84% in darkness and 61% in the light. Energy used by Na+K+ATPase is about 50% in darkness and 15% in the light, and much of this is for the dark current (35% of total energy or 70% of Na+K+ATPase usage in darkness, but 0% in the light). Energy required for cGMP turnover is only 2% in darkness, but 11% in the light, and energy transfer involving γ-phosphate of GTP is 20% in darkness and none in the light.22 Depolarization in the dark also leads to glutamate release from photoreceptor axon terminals, and neurotransmission is 80% faster in the dark than in the light.71 However, glutamate synthesis and recycling by themselves consume relatively little energy (< 2–4 × 10⁶ ATP s−1).6 In a mouse rod, the ATP expenditure is estimated to be about 9 × 10⁷ ATP s−1 in darkness and only about 2 × 10⁷ ATP s−1 in bright illumination.64 Of these, a large proportion is devoted to Na+ pumping (5.7 × 10⁷ ATP s−1) and less for Ca++ channels (~3 × 10⁷ ATP s−1), with negligible expenditure on guanylyl cyclase and phosphorylated rhodopsin in darkness. In bright illumination, GTPase activity associated with transducin utilizes <3 × 10⁶ ATP sec−1 in rods,64 and phosphorylation of rhodopsin uses <6 × 10⁵ ATP s−1.70 Likewise, guanylyl cyclase and the Ca++ channels consume relatively little energy in bright illumination.64 There is little wonder, then, that total energy consumption in bright light is less than a quarter of that in the dark.64
Other ATP-consuming functions
Besides Na+K+ATPase, Ca++ATPase is present in plasma membrane72 as well as in disc membrane.73 Ca++ uptake into rod outer segments is modulated by taurine and ATP, thereby protecting the cells against calcium toxicity.74 Most of the Ca++ being transported back into organelles is via Ca++ATPase that transfers 2 Ca++ per high energy phosphate (or ATP), whereas most of the Ca++ transport out of the cell is by counter-transport with Na+, with 1 Ca++ ion pumped per ATP consumed by Na+K+ATPase.75 However, both types of transport together in a neuron consume only about 3%–7% of the cell’s energy supply.5 Transport of cargo into the outer segments of photoreceptor cells and transport in general in other neurons is reliant on ATP-dependent motors, such as kinesin and dynein.76 Kinesin cycles its conformation approximately 100 times per second, hydrolyzing 1 ATP per cycle. Thus, each kinesin molecule hydrolyzes about 100 ATP molecules per second.77,78 The total energy demand will depend on the number of kinesin molecules per cell and the rate of transport of various cargo in the retina. Moreover, the creatine/phosphocreatine shuttle system is important in reversibly converting creatine and ATP to phosphocreatine and ADP for proper energy homeostasis at sites of high energy demand in the retina as well as in the brain.79
ATP binding cassette transporter (ABCR)
A related energy-requiring process is mediated by a protein known as ABCR found exclusively in photoreceptor cells along the rim regions of disc membranes.80–82 ABCR is involved in the transport of either all-trans-retinal or a Schiff base adduct of all-trans-retinal and phosphatidylethanolamine from the luminal to the cytosolic face of the disc membrane, thereby enabling the all-trans-retinal to be readily reduced to all-trans-retinol by cytosolic retinol dehydrogenase.83 One model for transport and ATP hydrolysis by ABCR is the sequential opening and closing of retinal entry and exit sites.83 In this model, the opening and closing of retinal entry site is coupled to the ATPase cycle of nuclear-binding domain 1 (NBD-1), whereas the opening and closing of the exit site is coupled to the ATPase cycle of NBD-2. More than 180 mutations of the ABCR gene (ABCA4) have been implicated in a number of retinal degenerative diseases,83,84 notably early onset autosomal recessive Stargardt macular dystrophy,85,86 fundus flavimaculatus,87 autosomal recessive retinitis pigmentosa,88 cone-rod dystrophy,89 and increased risk for age related macular degeneration.85,87
Glutamate transporter
Glutamate is the key excitatory neurotransmitter in the brain and in the retina. Glutamate released from synaptic terminals is actively transported by sodium-dependent glutamate transporters into glial cells, where some of the glutamate is converted to glutamine, a process that consumes 1 ATP per glutamate.6 Glutamine is released from glia, taken up by neurons, and is converted back to glutamate. This process consumes little or no energy because the N-like transporters cotransport a Na+ and export a H+.6 The excitatory amino acid transporter 1 (EAAT1) or GLAST (glutamate aspartate transporter) is localized to Müller cells and astrocytes. EAAT2 or GLT-1 is found in cones and two types of bipolar cells.90 EAAT3 (EAAC1) is contained in horizontal, amacrine, and ganglion cells, but more rarely in bipolar cells.90 EAAT5 is localized to photoreceptor and bipolar cells.91,92 EAAT4 has not been localized to retinal tissue. Glutamate released from neurons is cleared initially by Müller cells via their GLAST or EAAT191 but is slowly recycled back to neurons, specifically to cones via GLT-192 and to rods via EAAT5.90,92 In glaucoma, there is a down-regulation of EAAT1 and glutamatergic N-methyl-D-aspartate (NMDA) receptors, resulting in an elevated level of glutamate in the vitreous body, leading to neurotoxic ganglion cell death.93 Both EAAT1 and EAAT2 are important in regulating extracellular glutamate in the retina, thereby protecting the retina, and especially the highly sensitive ganglion cell layer, from excitotoxic cell death.94 Blockage of glutamate transport leads to retinal ganglion cell death in vitro.95
Retinal pigment epithelium (RPE)
Besides serving as the outer blood retinal barrier and transporting glucose to photoreceptor cells, the RPE is intimately associated with the photoreceptor outer segments with which its apical microvilli interdigitate. The electrogenic sodium pumps in its apical membrane actively transports ions and assists in the transport of metabolites and fluid across this cell layer, thereby maintaining the appropriate ionic and fluid composition of the subretinal space.96 RPE cells are responsible for the uptake of all-trans-retinol from photoreceptor cells, converting it to 11-cis-retinal, and transporting that back to photoreceptor cells. It is also actively involved in the phagocytosis of photoreceptor outer segments.97 For all of its energy-dependent functions, the RPE is richly supplied with mitochondria, especially toward the apical side.98 RPE cells have also been reported to release ATP into the subretinal space.99 This release may be related to Cl− channels, although the specific mechanism is not understood.99 ATP released into the subretinal space may stimulate P2X2 receptors on the outer segments of photoreceptors, leading to an influx of Ca++ into these cells.99,100 Extracellular ATP may be converted by RPE into adenosine, an elevation of which at night enhances circadian synthesis of melatonin.99,101 Thus, ATP released by RPE may be involved in the circadian regulation of photoreceptor function and phogocytosis.99 ATP is also reportedly released from retinal astrocytes102 and from inner retinal neurons103,104 and may serve similar functions.
Nerve fiber layer
The intraretinal layer of unmyelinated ganglion cell axons, unlike many unmyelinated axons elsewhere in the brain, has a high level of cytochrome c oxidase as well as Na+K+ATPase53,62 (Figure 3), indicating a considerable degree of depolarizing and re-polarizing activities. Once the axons acquire myelin sheaths at the lamina cribosa and begin their saltatory conduction, cytochrome c oxidase level falls precipitously in the retrobulbar optic nerve53 (Figure 5). The high energy requirement by unmyelinated ganglion cell axons and by the prelaminar and laminar optic nerve renders them, (and especially the optic nerve head where axons congregate), extremely vulnerable to energy exhaustion and eventual functional failure.105 Increased intraocular pressure, such as induced in glaucoma, potentially restricts blood flow and eventual ischemia that would be detrimental to the optic nerve head and retinal ganglion cells.106 Other conditions where energy metabolism is compromised, such as diabetes and a number of inherited mitochondrial diseases (to be discussed below), often lead to optic neuropathy that affects ganglion cells and their axons, culminating in blindness.
Figure 5.
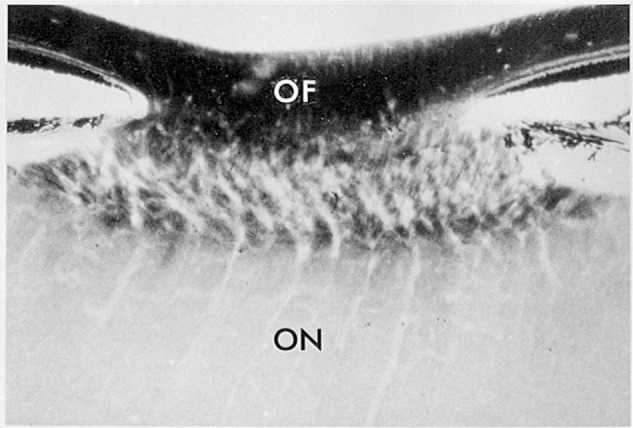
A transverse section of squirrel monkey optic disk. The unmyelinated portions of retinal ganglion cell axons (OF, optic fibers) within the eye are darkly reactive for cytochrome c oxidase. Labeling falls precipitously at the lamina cribosa, where the axons acquire myelin sheaths and form the optic nerve (ON). Modified with permission from Kageyana and Wong-Riley 1984.53
The lateral geniculate nucleus (LGN)
Relatively little is known about energy metabolism in the dorsal lateral geniculate nucleus, the main relay station from the retina to the primary visual cortex in mammals. The blood supply to the LGN comes mainly from thalamogeniculate arteries that branch from the posterior cerebral arteries in humans.107 Metabolic activities of geniculate neurons differ depending on the species and functional pathways. For example, the OFF-sublaminae in the ferret LGN (A’ and A1’) are metabolically much more active than the ON-sublamina (A and A1), indicating that the OFF-pathway is functionally more active than the ON in this species53 (Figure 6). The opposite is true for the macaque LGN, where the layers dominated by the ON-pathway (6 and 5) are metabolically more active than the ones subserving primarily the OFF pathway (4 and 3).53 The patterns in the LGN of both species are reminiscent of their respective pattern in the retinal inner plexiform layer (see Figure 2). However, two other features of the macaque LGN deserve attention. First, the magnocellular layers 1 and 2 are much more reactive for cytochrome c oxidase than most of the parvocellular layers (with the exception of layer 6), suggesting that the magnocellular (M)-pathway is functionally more active than the parvocellular (P)-pathway. Second, the layers subserving contralateral visual processing (especially layers 1 and 6) have higher levels of cytochrome c oxidase activity than their ipsilateral counterparts (2 and 5). Thus, the overall energy demand is the culmination of these three forces.
Figure 6.

A) A parasagittal section of ferret lateral geniculate nucleus reacted for cytochrome c oxidase. Sublaminae A′ and A1′ representing the OFF-pathway have higher enzyme levels than the ON-sublaminae A and A1. Magnocellular lamina C (Cm) is also more reactive than the parvocellular lamina C (Cp). The perigeniculate nucleus (PG) is only lightly labeled. B) Coronal section of the macaque LGN reacted for cytochrome c oxidase. The pattern of metabolic activity probably reflects a combination of greater functional activity in a) the magnocellular layers 1 and 2 than the parvocellular layers 3–5; b) the ON-pathway-dominant layers 5 and 6 than the OFF-pathway-dominant layers 3 and 4; and c) the contralateral pathway in layers 1 and 6 than the ipsilateral pathway in layers 2 and 5. Modified with permission from Kageyana and Wong-Riley 1984.53
LGN neurons are highly sensitive to the level of retinal input. Simply blocking impulse activity in retinal ganglion cells with intravitreal injections of TTX leads to significant reduction in cytochrome c oxidase activity in deprived layers of the LGN, ie, layers 1, 4, and 6 in the contralateral LGN, and layers 2, 3, and 5 on the ipsilateral side.108 The enzymatic reduction is accompanied by a decrease in mitochondrial DNA as well as both nuclear- and mitochondrial-encoded subunit mRNAs of cytochrome c oxidase in deprived LGN layers.108 Once again, energy metabolism and neuronal activity are tightly coupled.
The primary visual cortex
The primary visual cortex, calcarine cortex, area 17, or V1, receives direct input from the dorsal lateral geniculate nucleus. The visual cortex is richly supplied with penetrating blood vessels originating from the posterior cerebral artery. An extensive capillary network throughout V1 ensures that this region of the cortex has a ready source of oxygen, glucose, and other nutrients. Both capillary diameter and capillary density are highest in layer IV,109 which has the most intense level of cytochrome c oxidase activity in human, primate, and other mammalian species110–113 (Figure 7). Layer IV also has the highest level of sustained background spiking activity than any of the other layers.114 In addition, cytochrome c oxidase-rich globular zones (known as puffs, blobs, patches, dots, or spots)115 in the supragranular layers, are more richly vascularized than the intervening cytochrome c oxidase-poor zones.116 Local cerebral glucose metabolism and blood flow in the visual cortex are increased with visual stimulation, shown by 2-deoxyglucose uptake,117 positron emission tomography,118 and functional magnetic resonance imaging.119,120 Thus, a positive correlation has been found among blood flow, glucose utilization, capillary density, as well as cytochrome c oxidase level.121,122
Figure 7.

A schematic diagram depicting the general laminar and cellular patterns of labeling with cytochrome c oxidase in the primary visual cortex of various mammals studied (laminae are not drawn strictly to scale). The degree of darkness reflects the intensity of labeling. The basic pattern of metabolic activity is phylogenetically constant, with the geniculate-recipient layer IV having the highest energy demand. Primates evolved a more elaborate layer IV and supragranular cytochrome c oxidase-rich puffs centered on ocular dominance columns. Modified with permission from Wong-Riley 1988.112
Interestingly, exposure of rats to a supposedly more challenging “complex” environment actually promotes capillary formation in its visual cortex; however, the effect is much more prominent in the young than in the aging brain.123,124
What are the physiological and neurochemical properties of the primary visual cortex that may shed some light on its energy demand? First of all, the visual system (in addition to the auditory system) is one of the most active systems in the brain. Vision is vital for the survival of most animal species, especially the diurnal ones. The visual system is skilled in detecting contrast and movement in the visual environment, with constantly changing patterns of light and darkness falling on its receptive surface (photoreceptor cells), resulting in center-surround circular type of receptive fields at the retinal ganglion cell level that are relayed through the LGN to the primary visual cortex in precise spatial and temporal coding patterns. The processing is refined at the cortical level, where the receptive fields are converted into the elongated type specialized in the detection of contrast, borders, orientation, spatial frequencies, color, and eye preference.125–127 The complexity of visual processing requires an active visual system that consumes a great deal of energy. Visual stimuli to the eye initiate a chain of synaptic events from the retina, through the lateral geniculate nucleus, to the visual cortex. 13C nuclear magnetic resonance spectroscopy indicates that 80% of the total energy consumption of the rat cortex is concerned with signaling, the bulk of which is for Na+K+ATPase to repolarize the membrane after depolarization.128,129 Since glutamate is the major excitatory neurotransmitter in the central nervous system,130 much of the energy is utilized to support glutamatergic transmission,128 that is, to fuel repolarization after glutamate-induced depolarization. The recycling of second messengers and neurotransmitters accounts for only a small percentage (<10%) of the signaling cost. Maintaining resting potentials and counteracting leakage from organelles are estimated to consume less than 15% of the total energy, and the turnover of macromolecules is about 5% of the total.128,129 Energy utilized by glia to sustain their resting potential is only about 3% of the total in the brain.8 Not considered in the calculations are such functions as fast anterograde and retrograde axoplasmic and dendritic transport.
The geniculate-recipient layers of the primary visual cortex, mainly layer IV in most mammals, but extending to layers VI and II/III puffs in primates, are synaptically dominated by excitatory glutamatergic input from the LGN, with dense distribution of glutamate, NMDA receptor subunit 1, and neuronal nitric oxide synthase.27,131 The high demand of energy to constantly repolarize the membranes after depolarization is evident by the intense labeling of Na+K+ATPase131,132 and cytochrome c oxidase there.110,111 A dense distribution of glutamic acid decarboxylase in the same region as glutamate in the macaque visual cortex133 may, at first glance, appear to be contradictory to the positive correlation between energy metabolism and excitation (or repolarization after depolarization). However, at the immuno-electron microscopic level, it becomes clear that the GABAergic neurons themselves receive strong glutamatergic input not only on their dendrites, but also directly on their cell bodies.27,134 The exact distribution of axon terminals of these GABAergic neurons is not clear, but cytochrome c oxidase-rich puffs have a 3:1 ratio of glutamatergic to GABAergic synapses, whereas cytochrome c oxidase-poor interpuffs only have a 2:1 ratio.27 Moreover, even though puffs and interpuffs in the macaque V1 share the same types of neurons and comparable numerical densities of mitochondria, the mean size of neurons is smaller, the mean size of mitochondria is smaller, and the level of cytochrome c oxidase reactivity is much lower in interpuffs than in puffs.134,135
Other physiological attributes that may contribute to a greater metabolic demand in puffs than interpuffs include a higher rate of spontaneous activity,114,126 non-selectivity for stimulus orientation, greater frequency of activation, and broader spatial frequency and orientation band widths.126,127,136 Puff neurons are strongly monocular, whereas interpuffs neurons are binocular.126,137 Monocular input is invariably excitatory, but binocular interactions can result in inhibition and lower frequencies of activation.
Extrastriate visual cortical areas
Beyond the primary visual cortex, visual processing continues in two major streams: a dorsal stream for spatial vision (“where”) and a ventral stream for object vision (“what”), dominated by magnocellular (M) and parvocellular (P) pathways, respectively, but with extensive interconnections.138–141 Within the secondary visual cortex or V2, globular puff-like zones of high cytochrome c oxidase activity exist in layers III–IV thick and thin stripes.115 These metabolically active zones contain units with nonoriented wavelength selectivity, oriented disparity selectivity, directional selectivity, and preference for low spatial frequency gratings, whereas metabolically less active zones (interstripes) prefer high spatial frequency gratings and orientation selectivity.142,143 The difference in metabolic demand likely reflects the frequency of activation by the different functional attributes in V2. Beyond V2, the metabolic map is surprisingly uniform in all of the extrastriate cortical areas examined, with layers III and IV having the highest cytochrome c oxidase labeling.113 These layers receive and process intercortical visual information and are likely to be dominated by excitatory synaptic activities. The metabolic pattern revealed by cytochrome c oxidase agrees well with the microvascular pattern, which shows a negligible difference among several extrastriate cortical areas, but a much higher vascular density in the striate than the extrastriate cortices.3
Consequence of functional inactivation
The tight coupling between neuronal activity and energy metabolism is best illustrated with retinal impulse blockade by intravitreal injections of TTX in adult cats or monkeys.111,144 In this paradigm, photoreceptor cells and non-spiking cells in the retina are functioning normally, as light still enters the eyes and dark current is still maintained in the dark. However, all spiking retinal ganglion cells, be they ON-center or OFF – center, P- or M- type, central or peripheral, are functionally inactivated by TTX. Visual cortical neurons, being at least two to three synapses away from the retina, are not exposed to TTX, but rather, are simply deprived of their normal excitatory retino-geniculo-cortical input. A reduction in neuronal activity in functionally deprived cortical neurons down-regulates their energy metabolism, as exemplified by reduced cytochrome c oxidase as well as Na+K+ATPase most prominent in geniculate-recipient layer IV and supragranular puffs115,132 (Figure 8). As cytochrome c oxidase is an integral membrane protein, it takes time for the turnover to be visualized at the light microscopic level. However, as early as 14 hours after a single injection of TTX in the vitreous, a banding pattern of light and dark enzyme labeling can be seen in the visual cortex.115 Interestingly, not all neurons respond alike to the same functional insult. The metabolically most active neurons (type C cells in cortical puffs) suffer the most with not only a marked reduction in the level of their cytochrome c oxidase activity and in the numerical and areal densities of their mitochondria, but also a significant reduction in their cell size.134 Such responses in mature cortical neurons are entirely reversible, testifying to the tight coupling between neuronal activity and energy metabolism, as well as to plasticity in the adult visual system.24
Figure 8.

Tangential sections of the primary visual cortex from a macaque monkey whose left eye was functionally inactivated with TTX for 3 weeks. Serial sections were reacted histochemically either for cytochrome c oxidase (A) or Na+K+ATPase (B). Cortical layers are indicated by numerals. Note the light and dark banding pattern in layer 4c that is normally homogeneously and intensely labeled by both markers. In the supragranular layers 2–3, rows of large, darkly-labeled puffs (arrowheads) alternate with rows of small, lightly-labeled puffs. The lighter bands in 4c and lighter puffs correspond to the functionally inactivated eye. Large arrows indicate the border between area 17 and area 18. In area 18, thick and thin stripes with larger puff-like labeling within them are detectable (the pattern is more clearly seen in A). Modified with permission from Hevner et al 1992.132
Regulation of energy metabolism at the molecular level
Recently, the tight coupling between neuronal activity and energy metabolism is found to exist even at the molecular level. The same transcription factor (nuclear respiratory factor 1 or NRF-1) regulates not only all 13 subunits of cytochrome c oxidase derived from the nuclear and the mitochondrial genomes,145 but also a number of neurochemicals associated with glutamatergic neurotransmission146–148 (Figure 9). These neurochemicals include NMDA receptor subunits 1 and 2B that are critical components of this receptor,149 AMPA receptor subunit 2 (GluR2) that is critical in governing Ca2+ and Zn2+ permeability, receptor kinetics, and other functions,150 and neuronal nitric oxide synthase (nNOS) that links NMDA receptor transmission to the cGMP second messenger cascade.151 Moreover, the promoter of guanylyl cyclase gene has a putative binding site for NRF-1 and the expression of this gene is down-regulated with a knockdown of NRF-1.148 Such transcriptional coupling between cytochrome c oxidase and glutamatergic neurochemicals ensures that energy supply keeps pace with energy demand of neuronal activity with high efficiency and precision.
Figure 9.

Schematic diagram of the tight coupling between energy metabolism and neuronal activity co-regulated at the transcriptional level by the same transcription factor NRF-1 (nuclear respiratory factor 1). Recent studies (Dhar and Wong-Riley, 2009;146 Dhar et al 2008,145 2009,147 2009148) indicate that NRF-1 regulates the expression of not only all 13 subunit genes of cytochrome c oxidase (reflecting energy metabolism) but also genes of several neurochemicals associated with glutamatergic neurotransmission, including NMDA receptor subunits 1 and 2B (genes NR1 and NR2b), AMPA receptor subunit 2 (GluR2; gene Gria2), and neuronal nitric oxide synthase (nNOS, gene Nos1). This ensures high efficiency in matching energy production with energy demand of neuronal activity.
Disorders of the visual system
Under normal conditions, it is the energy demand of neuronal activity that controls energy production. However, when energy metabolism is compromised, neural transmission will be adversely affected. The first maternally inherited visual system disorder with a molecular identity linked to a point mutation in the mitochondrial DNA is Leber’s hereditary optic neuropathy (LHON).152 Since the initial identification of G11778A (ND4) mutation, other sites on the complex I subunit genes in the mitochondrial genome have been found, such as T14484C (ND6) and G3460A (ND1).153,154 The phenotype is similar: subacute visual loss in the second or third decade dominant in males, retinal ganglion cell and optic nerve degeneration, blindness in one eye followed within months by vision loss in the other eye, decreased complex I activity, decreased ATP synthesis, and increased oxidative stress. The prevalence in males implicates epigenetic factors and/or involvement of the nuclear genome. Among the risk factors are cigarette smoking, alcohol consumption, and exposure to a variety of toxins.155 These risk factors are themselves detrimental to energy metabolism.
Other mutations of the mitochondrial DNA also tend to affect the visual system.156 Mitochondrial DNA encodes for 2 rRNAs (12S and 16S), 22 tRNAs, and 13 polypeptide coding RNAs.157 These serve to produce 7 subunits of complex I (NADH dehydrogenase), 1 subunit of complex III (cytochrome bc1 complex), 3 subunits of complex IV (cytochrome c oxidase), and 2 subunits of complex V (ATP synthetase). These are the only 4 proteins that are bigenomically encoded, ie, they also have subunits encoded in the nuclear genome. Complex II (succinate dehydrogenase) is entirely nuclear-encoded. A T8993G mutation in the ATP synthetase subunit 6 gene leads to neuropathy, ataxia, and retinitis pigmentosa (NARP).158 A heteroplasmic G6930A mutation in cytochrome c oxidase subunit 1 gene leads to a premature stop codon and disrupts the functional structure of the enzyme, resulting in blindness, hearing loss, myopathy, encephalopathy, and peripheral neuropathy.159 Point mutations in the tRNA gene can cause multi-system dysfunction, such as mitochondrial encephalomyopathy, lactic acidosis, and stroke-like episodes (MELAS) that often includes cortical blindness.160 A large scale deletion of the mitochondrial genome results in progressive external ophthalmoplegia (PEO) or Kearns-Sayre syndrome (KSS), with pigmentary retinopathy and degeneration of the retina, in addition to multisystem disorders.161 As each cell has tens of thousands of mitochondria, and each mitochondrion has 2–10 copies of mitochondrial DNA, the degree of severity of visual deficits (and defects of other organs) will be dependent on the prevalence of the mutant DNA (homoplasmy or varying degrees of heteroplasmy) and the threshold level of tolerance in each organ and perhaps in each cell type.
Since 99% of proteins found in the mitochondria are encoded in the nuclear genome, mutations in many of these genes potentially lead to defective energy metabolism and visual deficits. For example, mutation in the OPA1 gene encoding a dynamin-like GTPase in the inner mitochondrial membrane and important for mitochondrial fission results in dominant optic atrophy (DOA), with decreased visual acuity, deficits in color vision, centro-coecal scotoma, and optic nerve pallor.162 OPA1 is normally expressed in retinal ganglion cells, starburst amacrine cells, and horizontal cells, but not in photoreceptor cells or nerve fiber layer.163 Mutation in SURF1 gene necessary for cytochrome c oxidase assembly leads to subacute necrotizing encephalomyopathy or Leigh syndrome that also includes optic atrophy.156,164 A point mutation in the DDPI/TIMM8a gene on the X chromosome involved in protein import into the mitochondria results in the deafness-dystonia syndrome or Mohr-Tranebjaerg Syndrome with distinct phenotypes that include vision loss due to severe atrophy of the visual cortex and degeneration of the retina and the optic nerve.165
A large number of visual system disorders are associated with defects in energy metabolism. Diabetic retinopathy is a leading cause of blindness in the adult, for defective glucose uptake resulting from impaired insulin action leads to reduced energy production, retinal dysfunction, vascular lesion, and eventual blindness.166 In proliferative diabetic retinopathy, blood flow is dysregulated and blood supply to the retina is reduced.33 Oxidative stress due to excessive accumulation of oxidants and free radicals has been implicated in such visual disorders as age-related macular degeneration (AMD) and glaucoma.167,168 Accumulation of galactose in the blood and tissues in genetic galactosemia can lead to cataract, liver enlargement, and mental retardation.169 Methanol toxicity is caused by the accumulation of formate that inhibits cytochrome c oxidase, and blindness often ensues.170 Recently, a loss of function mutation in IDH3B, encoding the β-subunit of NAD-specific isocitrate dehydrogenase, which catalyzes the oxidation of isocitrate to α-ketoglutarate in the Krebs cycle, has been linked to retinitis pigmentosa with no apparent clinical signs in any other tissues of the body.171
A number of diseases of aging, such as Alzheimer’s Disease, Huntington’s Disease, and Parkinson’s Disease, are associated with defective energy metabolism and visual deficits.172–174 Even with normal aging, cumulative insults of mitochondrial DNA with reactive oxygen species (ROS) increases the incidence of mutations in each mitochondrion and the prevalence of defective mitochondria in each organ.175 Respiratory control normally limits the production of ROS, but if the allosteric inhibition of cytochrome c oxidase at high ATP:ADP ratio is switched off under various forms of stress, increased mitochondrial membrane potential and cellular ROS can result, leading to degenerative diseases.176
Conclusions
The tight coupling between neuronal activity and energy metabolism denotes that each is highly dependent on the other. The major function that consumes the bulk of energy is repolarization after depolarization. This is manifested by the high energy demand of repolarization in the inner segments of photoreceptor cells to maintain the dark current, and in functionally active cone pedicles, outer and inner plexiform layers, larger ganglion cells, and unmyelinated nerve fiber layer of the retina to maintain normal membrane potentials for reactivation. Energy for repolarization is greater in certain pathways (such as ON versus OFF, mango- versus parvocellular pathways) in the retina and the lateral geniculate nucleus. At the primary visual cortical level, energy demand for repolarization is highest in the geniculate-recipient layer IV in a number of mammalian species examined. Primates have added energy demand in supragranular puffs with special physiological properties. Energy for repolarization in the brain is consumed primarily by dendrites postsynaptic to excitatory synapses, such as mediated by glutamate. Significantly, regulation of a key energy-generating enzyme, cytochrome c oxidase, is coupled to that of glutamatergic neurochemicals at the transcriptional level, thereby ensuring precise matching of energy production with energy consumption. Decreased neuronal activity leads to reduced energy production. Likewise, decreased energy production in diabetes, mitochondrial DNA mutations, and diseases of aging often results in varying degrees of visual dysfunction and even blindness.
Acknowledgments
The author deeply appreciates all of her former and current colleagues who have contributed immensely to the large body of work briefly reviewed here. She is also thankful for decades of support from the National Eye Institute. Current support: NIH EY018441.
Footnotes
Disclosure
The author reports no conflicts of interest in this work.
References
- 1.Rolfe DF, Brown GC. Cellular energy utilization and molecular origin of standard metabolic rate in mammals. Physiol Rev. 1997;77:731–758. doi: 10.1152/physrev.1997.77.3.731. [DOI] [PubMed] [Google Scholar]
- 2.Clarke DD, Sokoloff L. Circulation and energy metabolism of the brain. In: Siegel GJ, Agranoff BW, Albers RW, Fisher SK, Uhler MD, editors. Basic Neurochemistry: Molecular, Cellular and Medical Aspects. Philadelphia: Lippincott-Raven; 1999. pp. 637–669. [Google Scholar]
- 3.Weber B, Keller AL, Reichold J, Logothetis NK. The microvascular system of the striate and extrastriate visual cortex of the macaque. Cereb Cortex. 2008;18:2318–2330. doi: 10.1093/cercor/bhm259. [DOI] [PubMed] [Google Scholar]
- 4.Niven JE, Laughlin SB. Energy limitation as a selective pressure on the evolution of sensory systems. J Exp Biol. 2008;211:1792–1804. doi: 10.1242/jeb.017574. [DOI] [PubMed] [Google Scholar]
- 5.Ames A., 3rd CNS energy metabolism as related to function. Brain Res Reviews. 2000;34:42–68. doi: 10.1016/s0165-0173(00)00038-2. [DOI] [PubMed] [Google Scholar]
- 6.Attwell D, Laughlin SB. An energy budget for signaling in the gray matter of the brain. J Cereb Blood Flow Metab. 2001;21:1133–1145. doi: 10.1097/00004647-200110000-00001. [DOI] [PubMed] [Google Scholar]
- 7.Erecinska M, Cherian S, Silver IA. Energy metabolism in mammalian brain during development. Prog Neurobiol. 2004;73:397–445. doi: 10.1016/j.pneurobio.2004.06.003. [DOI] [PubMed] [Google Scholar]
- 8.Attwell D, Gibb A. Neuroenergetics and the kinetic design of excitatory synapses. Nat Rev Neurosci. 2005;6:841–849. doi: 10.1038/nrn1784. [DOI] [PubMed] [Google Scholar]
- 9.Winkler BS, Arnold MJ, Brassell MA, Puro DG. Energy metabolism in human retinal Muller cells. Invest Ophthalmol Vis Sci. 2000;41:3183–3190. [PMC free article] [PubMed] [Google Scholar]
- 10.Erecinska M, Silver IA. Tissue oxygen tension and brain sensitivity to hypoxia. Respir Physiol. 2001;128:263–276. doi: 10.1016/s0034-5687(01)00306-1. [DOI] [PubMed] [Google Scholar]
- 11.Stenslokken KO, Milton SL, Lutz PL, et al. Effect of anoxia on the electroretinogram of three anoxia-tolerant vertebrates. Comp Biochem Physiol a Mol Integr Physiol. 2008;150:395–403. doi: 10.1016/j.cbpa.2008.03.022. [DOI] [PubMed] [Google Scholar]
- 12.Sokoloff L, Reivich M, Kennedy C, et al. The [14C] deoxyglucose method for the measurement of local cerebral glucose utilization: theory, procedure, and normal values in the conscious and anesthetized albino rat. J Neurochem. 1977;28:897–916. doi: 10.1111/j.1471-4159.1977.tb10649.x. [DOI] [PubMed] [Google Scholar]
- 13.Wong-Riley M. Changes in the visual system of monocularly sutured or enucleated cats demonstrable with cytochrome oxidase histochemistry. Brain Res. 1979;171:11–28. doi: 10.1016/0006-8993(79)90728-5. [DOI] [PubMed] [Google Scholar]
- 14.Phelps ME, Mazziotta JC. Positron emission tomography: human brain function and biochemistry. Science. 1985;228:799–809. doi: 10.1126/science.2860723. [DOI] [PubMed] [Google Scholar]
- 15.Tootell RB, Dale AM, Sereno MI, Malach R. New images from human visual cortex. Trends Neurosci. 1996;19:481–489. doi: 10.1016/S0166-2236(96)10053-9. [DOI] [PubMed] [Google Scholar]
- 16.Davis TL, Kwong KK, Weisskoff RM, Rosen BR. Calibrated functional MRI: Mapping the dynamics of oxidative metabolism. Proc Natl Acad Sci U S A. 1998;95:1834–1839. doi: 10.1073/pnas.95.4.1834. [DOI] [PMC free article] [PubMed] [Google Scholar]
- 17.Wong-Riley MTT, Nie F, Hevner RF, Liu S. Brain cytochrome oxidase: functional significance and bigenomic regulation in the CNS. In: Gonzalez-Lima F, editor. Cytochrome Oxidase in Neuronal Metabolism and Alzheimer’s disease. New York: Plenum Press; 1998. pp. 1–53. [Google Scholar]
- 18.Uludag K, Steinbrink J, Kohl-Bareis M, Wenzel R, Villringer A, Obrig H. Cytochrome-c-oxidase redox changes during visual stimulation measured by near-infrared spectroscopy cannot be explained by a mere cross talk artifact. Neuroimage. 2004;22:109–119. doi: 10.1016/j.neuroimage.2003.09.053. [DOI] [PubMed] [Google Scholar]
- 19.Logothetis NK. What we can do and what we cannot do with fMRI. Nature. 2008;453:869–878. doi: 10.1038/nature06976. [DOI] [PubMed] [Google Scholar]
- 20.Bachelard HS. Energy utilized by neurotransmitters. In: Ingvar DH, Lassen NA, editors. Brain Work Alfred Benzon Symposium, VIII. New York: Academic Press; 1975. pp. 79–81. [Google Scholar]
- 21.Ames A, 3rd, Li YY, Heher EC, Kimble CR. Energy metabolism of rabbit retina as related to function: high cost of Na+ transport. J Neurosci. 1992;12:840–853. doi: 10.1523/JNEUROSCI.12-03-00840.1992. [DOI] [PMC free article] [PubMed] [Google Scholar]
- 22.Forman DS, Brown KJ, Livengood DR. Fast axonal transport in permeabilized lobster giant axons is inhibited by vanadate. J Neurosci. 1983;3:1279–1288. doi: 10.1523/JNEUROSCI.03-06-01279.1983. [DOI] [PMC free article] [PubMed] [Google Scholar]
- 23.Vallee RB, Wall JS, Paschal BM, Shpetner HS. Microtubule-associated protein 1C from brain is a two-headed cytosolic dynein. Nature. 1988;332:561–563. doi: 10.1038/332561a0. [DOI] [PubMed] [Google Scholar]
- 24.Wong-Riley MTT. Cytochrome oxidase: an endogenous metabolic marker for neuronal activity. Trends Neurosci. 1989;12:94–101. doi: 10.1016/0166-2236(89)90165-3. [DOI] [PubMed] [Google Scholar]
- 25.Skou JC. The influence of some cations on an adenosine triphosphatase from peripheral nerves. Biochim Biophys Acta. 1957;23:394–401. doi: 10.1016/0006-3002(57)90343-8. [DOI] [PubMed] [Google Scholar]
- 26.Stahl WL. The Na, K-ATPase of nervous tissue. Neurochem Int. 1986;8:449–476. doi: 10.1016/0197-0186(86)90179-8. [DOI] [PubMed] [Google Scholar]
- 27.Nie F, Wong-Riley MTT. Differential glutamatergic innervation in cytochrome oxidase-rich and -poor regions of the macaque striate cortex: Quantitative EM analysis of neurons and neuropil. J Comp Neurol. 1996;369:571–590. doi: 10.1002/(SICI)1096-9861(19960610)369:4<571::AID-CNE7>3.0.CO;2-1. [DOI] [PubMed] [Google Scholar]
- 28.Creutzfeldt OD. Neurophysiological correlates of different functional states of the brain. In: Ingvar DH, Lassen NA, editors. Brain Work Alfred Benzon Symposium, VIII. New York: Academic Press; 1975. pp. 21–46. [Google Scholar]
- 29.Alle H, Roth A, Geiger JRP. Energy-efficient action potentials in hippocampal mossy fibers. Science. 2009;325:1405–1408. doi: 10.1126/science.1174331. [DOI] [PubMed] [Google Scholar]
- 30.Lowry OH. Energy metabolism in brain and its control. In: Ingvar DH, Lassen NA, editors. Brain Work Alfred Benzon Symposium, VIII. New York: Academic Press; 1975. pp. 48–64. [Google Scholar]
- 31.Anderson B, Jr, Saltzman HA. Retinal oxygen utilization measured by hyperbaric blackout. Arch Ophthalmol. 1964;72:792–795. doi: 10.1001/archopht.1964.00970020794009. [DOI] [PubMed] [Google Scholar]
- 32.Yu DY, Cringle SJ. Oxygen distribution and consumption within the retina in vascularised and avascular retinas and in animal models of retinal disease. Prog Retin Eye Res. 2001;20:175–208. doi: 10.1016/s1350-9462(00)00027-6. [DOI] [PubMed] [Google Scholar]
- 33.Pournaras CJ, Rungger-Brandie E, Riva CE, Hardarson SH, Stefansson E. Regulation of retinal blood flow in health and disease. Prog Retin Eye Res. 2008;27:284–330. doi: 10.1016/j.preteyeres.2008.02.002. [DOI] [PubMed] [Google Scholar]
- 34.Wiedman M, Tabin GC. High altitude retinopathy and altitude illness. Ophthalmology. 1999;106:1924–1927. doi: 10.1016/S0161-6420(99)90402-5. [DOI] [PubMed] [Google Scholar]
- 35.Karakucuk S, Mirza GE. Ophthalmological effects of high altitude. Ophthalmic Res. 2000;32:30–40. doi: 10.1159/000055584. [DOI] [PubMed] [Google Scholar]
- 36.Tezel G, Yang X, Luo C, et al. Hemoglobin expression and regulation in glaucoma: insights into retinal ganglion cell oxygenation. Invest Ophthalmol Vis Sci. 2010;51:907–919. doi: 10.1167/iovs.09-4014. [DOI] [PMC free article] [PubMed] [Google Scholar]
- 37.Schmidt M, Giessl A, Laufs T, Hankein T, Wolfrum U, Burmester T. How does the eye breathe? Evidence for neuroglobin-mediated oxygen supply in the mammalian retina. J Biol Chem. 2003;278:1932–1935. doi: 10.1074/jbc.M209909200. [DOI] [PubMed] [Google Scholar]
- 38.Burmester T, Hankein T. What is the function of neuroglobin? J Exp Biol. 2009;212:1423–1428. doi: 10.1242/jeb.000729. [DOI] [PubMed] [Google Scholar]
- 39.Winkler BS, Pourcho RG, Starnes C, Slocum J, Slocum N. Metabolic mapping in mammalian retina: a biochemical and 3H-2-deoxyglucose autoradiography. Exp Eye Res. 2003;77:327–337. doi: 10.1016/s0014-4835(03)00147-7. [DOI] [PubMed] [Google Scholar]
- 40.Cunha-Vaz JG. The blood-retinal barriers. Doc Ophthalmol. 1976;41:287–327. doi: 10.1007/BF00146764. [DOI] [PubMed] [Google Scholar]
- 41.Mantych GJ, Hageman GS, Devaskar SU. Characterization of glucose transporter isoforms in the adult and developing human eye. Endocrinology. 1993;133:600–607. doi: 10.1210/endo.133.2.8344201. [DOI] [PubMed] [Google Scholar]
- 42.Kumagai AK, Glasgow BJ, Pardridge WM. GLUT1 glucose transporter expression in the diabetic and nondiabetic human eye. Invest Ophthalmol Vis Sci. 1994;35:2887–2894. [PubMed] [Google Scholar]
- 43.Hsu SC, Molday RS. Glycolytic enzymes and GLUT-1 glucose transporter in the outer segments of rod and cone photoreceptor cells. J Biol Chem. 1991;266:21745–21752. [PubMed] [Google Scholar]
- 44.Watanabe T, Matsushima S, Okazaki M, et al. Localization and ontogeny of GLUT3 expression in the rat retina. Dev Brain Res. 1996;94:60–66. doi: 10.1016/0165-3806(96)00044-2. [DOI] [PubMed] [Google Scholar]
- 45.Poitry-Yamate CL, Poitry S, Tsacopoulos M. Lactate released by Müller glial cells is metabolized by photoreceptors from mammalian retina. J Neurosci. 1995;15:5179–5191. doi: 10.1523/JNEUROSCI.15-07-05179.1995. [DOI] [PMC free article] [PubMed] [Google Scholar]
- 46.Winkler BS, Arnold MJ, Brassell MA, Sliter DR. Glucose dependence of glycolysis, hexose monophosphate shunt activity, energy status, and the polyol pathway in retinas isolated from normal (nondiabetic) rats. Invest Ophthalmol Vis Sci. 1997;38:62–71. [PubMed] [Google Scholar]
- 47.Uga S, Smelser GK. Comparative study of the fine structure of retinal Müller cells in various vertebrates. Invest Ophthalmol Vis Sci. 1973;12:434–448. [PubMed] [Google Scholar]
- 48.Magistretti PJ. Neuron-glia metabolic coupling and plasticity. J Exp Biol. 2006;209:2304–2311. doi: 10.1242/jeb.02208. [DOI] [PubMed] [Google Scholar]
- 49.Wang L, Tornquist P, Bill A. Glucose metabolism in pig outer retina in light and darkness. Acta Physiol Scand. 1997;160:75–81. doi: 10.1046/j.1365-201X.1997.00030.x. [DOI] [PubMed] [Google Scholar]
- 50.Philp NJ, Yoon H, Lombardi L. Mouse MCT3 gene is expressed preferentially in retinal pigment and choroid plexus epithelia. Am J Physiol Cell Physiol. 2001;280:C1319–C1326. doi: 10.1152/ajpcell.2001.280.5.C1319. [DOI] [PubMed] [Google Scholar]
- 51.Daniele LL, Sauer B, Gallagher SM, Pugh EN, Jr, Philp NJ. Altered visual function in monocarboxylate transporter 3 (Slc16a8) knockout mice. Am J Physiol Cell Physiol. 2008;295:C451–C457. doi: 10.1152/ajpcell.00124.2008. [DOI] [PMC free article] [PubMed] [Google Scholar]
- 52.Wikström M, Krab K, Saraste M. Cytochrome Oxidase A Synthesis. New York: Academic Press; 1981. [Google Scholar]
- 53.Kageyama GH, Wong-Riley MTT. The histochemical localization cytochrome oxidase in the retina and LGN of the ferret, cat and monkey, with particular reference to retinal mosaics and ON/OFF-center visual channels. J Neurosci. 1984;4:2445–2459. doi: 10.1523/JNEUROSCI.04-10-02445.1984. [DOI] [PMC free article] [PubMed] [Google Scholar]
- 54.Matthews HR, Fain GL, Murphy RL, Lamb TD. Light adaptation in cone photoreceptors of the salamander: a role for cytoplasmic calcium. J Physiol. 1990;420:447–469. doi: 10.1113/jphysiol.1990.sp017922. [DOI] [PMC free article] [PubMed] [Google Scholar]
- 55.Burkhardt DA. Light adaptation and photopigment bleaching in cone photoreceptors in situ in the retina of the turtle. J Neurosci. 1994;14:1091–1105. doi: 10.1523/JNEUROSCI.14-03-01091.1994. [DOI] [PMC free article] [PubMed] [Google Scholar]
- 56.Nikonov SS, Brown BM, Davis JA, et al. Mouse cones require an arrestin for normal inactivation of phototransduction. Neuron. 2008;59:462–474. doi: 10.1016/j.neuron.2008.06.011. [DOI] [PMC free article] [PubMed] [Google Scholar]
- 57.Kawamura S, Tachibanaki S. Rod and cone photoreceptors: molecular basis of the difference in their physiology. Comp Biochem Physiol a Mol Integr Physiol. 2008;150:369–377. doi: 10.1016/j.cbpa.2008.04.600. [DOI] [PubMed] [Google Scholar]
- 58.Landolt E. Beiträge zur Anatomie der Retina vom Frosch, Salamander und Triton. Arch Mikr Anat. 1871;7:81–98. [Google Scholar]
- 59.Polyak SL. The Retina. Chicago: University of Chicago Press; 1941. [Google Scholar]
- 60.Wong-Riley MTT. Synaptic organization of the inner plexiform layer in the retina of the tiger salamander. J Neurocytol. 1974;3:1–33. doi: 10.1007/BF01111929. [DOI] [PubMed] [Google Scholar]
- 61.Grigoryan EN, Bazhin AV, Krasnov MS, Philippov PP. Expression of ca-binding protein recoverin in normal, surviving, and regenerating retina of pleurodeles waltl adult triton. Bull Exp Biol Med. 2009;148:155–162. doi: 10.1007/s10517-009-0654-4. [DOI] [PubMed] [Google Scholar]
- 62.Wong-Riley MTT, Huang Z, Liebl W, Nie F, Xu H, Zhang C. Neurochemical organization of the macaque retina: effect of TTX on levels and gene expression of cytochrome oxidase and nitric oxide synthase and on the immunoreactivity of Na+ K+ ATPase and NMDA receptor subunit I. Vision Res. 1998;38(10):1455–1470. doi: 10.1016/s0042-6989(98)00001-7. [DOI] [PubMed] [Google Scholar]
- 63.Perkins GA, Ellisman MH, Fox DA. Three-dimensional analysis of mouse rod and cone mitochondrial cristae architecture: Bioenergetic and functional implications. Mol Vision. 2003;9:60–73. [PubMed] [Google Scholar]
- 64.Okawa H, Sampath AP, Laughlin SB, Fain GL. ATP consumption by mammalian rod photoreceptors in darkness and in light. Curr Biol. 2008;18:1917–1921. doi: 10.1016/j.cub.2008.10.029. [DOI] [PMC free article] [PubMed] [Google Scholar]
- 65.Hagins WA, Penn RD, Yoshikami S. Dark current and photocurrent in retinal rods. Biophys J. 1970;10:380–412. doi: 10.1016/S0006-3495(70)86308-1. [DOI] [PMC free article] [PubMed] [Google Scholar]
- 66.Maeda A, Golczak M, Maeda T, Palczewski K. Limited roles of Rdh8, Rdh12, and Abc4 in all-trans-retinal clearance in mouse retina. Invest Ophthalmol Vis Sci. 2009;50:5435–5443. doi: 10.1167/iovs.09-3944. [DOI] [PMC free article] [PubMed] [Google Scholar]
- 67.Miyazono S, Shimauchi-Matsukawa Y, Tachibanaki S, Kawamura S. Highly efficient retinal metabolism in cones. Proc Natl Acad Sci U S A. 2008;105:16051–16056. doi: 10.1073/pnas.0806593105. [DOI] [PMC free article] [PubMed] [Google Scholar]
- 68.Burns M, Arshavsky V. Beyond counting photons: trials and trends in vertebrate visual transduction. Neuron. 2005;48:387–401. doi: 10.1016/j.neuron.2005.10.014. [DOI] [PubMed] [Google Scholar]
- 69.Papac DI, Oatis JE, Jr, Crouch RK, Knapp DR. Mass spectrometric identification of phosphorylation sites in bleached bovine rhodopsin. Biochem. 1993;32:5930–5934. doi: 10.1021/bi00074a002. [DOI] [PubMed] [Google Scholar]
- 70.Kennedy MJ, Lee KA, Niemi GA, et al. Multiple phosphorylation of rhodopsin and the in vivo chemistry underlying rod photoreceptor dark adaptation. Neuron. 2001;31:87–101. doi: 10.1016/s0896-6273(01)00340-3. [DOI] [PubMed] [Google Scholar]
- 71.Xu Y, Ola MS, Berkich DA, et al. Energy sources for glutamate neurotransmission in the retina: absence of the aspartate/glutamate carrier produces reliance on glycolysis in glia. J Neurochem. 2007;101:120–131. doi: 10.1111/j.1471-4159.2006.04349.x. [DOI] [PubMed] [Google Scholar]
- 72.Garcia ML, Strehler EE. Plasma membrane calcium ATPases as critical regulators of calcium homeostasis during neuronal function. Front Biosci. 1999;4:D869–D882. doi: 10.2741/garcia. [DOI] [PubMed] [Google Scholar]
- 73.Panfoli I, Morelli A, Pepe IM. Calcium pump in the disk membranes isolated from bovine retinal rod outer segments. J Photochem Photobiol B. 1994;24:187–194. doi: 10.1016/1011-1344(94)07019-9. [DOI] [PubMed] [Google Scholar]
- 74.Militante JD, Lombardini JB. Stabilization of calcium uptake in rat rod outer segments by taurine and ATP. Amino Acids. 2000;19:561–570. doi: 10.1007/s007260070006. [DOI] [PubMed] [Google Scholar]
- 75.Pozzan T, Rizzuto R, Volpe P, Meldolesi J. Molecular and cellular physiology of intracellular calcium stores. Physiol Rev. 1994;74:595–636. doi: 10.1152/physrev.1994.74.3.595. [DOI] [PubMed] [Google Scholar]
- 76.Vale RD. The molecular motor toolbox for intracellular transport. Cell. 2003;112:467–480. doi: 10.1016/s0092-8674(03)00111-9. [DOI] [PubMed] [Google Scholar]
- 77.Mori T, Vale RD, Tomishige M. How kinesin waits between steps. Nature. 2007;450:750–754. doi: 10.1038/nature06346. [DOI] [PubMed] [Google Scholar]
- 78.Laughlin SB, de Ruyter van Steveninck RR, Anderson JC. The metabolic cost of neural information. Nat Neurosci. 1998;1:36–41. doi: 10.1038/236. [DOI] [PubMed] [Google Scholar]
- 79.Tachikawa M, Hosoya K, Ohtsuki S, Terasaki T. A novel relationship between creatine transport at the blood-brain and blood-retinal barriers, creatine biosynthesis, and its use for brain and retinal energy homeostasis. Subcell Biochem. 2007;46:83–98. doi: 10.1007/978-1-4020-6486-9_5. [DOI] [PubMed] [Google Scholar]
- 80.Papermaster DS, Schneider BG, Zorn MA, Kraehenbuhl JP. Immunocytochemical localization of a large intrinsic membrane protein to the incisures and margins of frog rod outer segment disks. J Cell Biol. 1978;78:415–425. doi: 10.1083/jcb.78.2.415. [DOI] [PMC free article] [PubMed] [Google Scholar]
- 81.Illing M, Molday LL, Molday RS. The 220-kDa rim protein of retinal rod outer segments is a member of the ABC transporter superfamily. J Biol Chem. 1997;272:10303–10310. doi: 10.1074/jbc.272.15.10303. [DOI] [PubMed] [Google Scholar]
- 82.Sun H, Nathans J. Stargardt’s ABCR is localized to the disc membrane of retinal rod outer segments. Nat Genet. 1997;17:15–16. doi: 10.1038/ng0997-15. [DOI] [PubMed] [Google Scholar]
- 83.Sun H, Nathans J. ABCR, the ATP-binding cassette transporter responsible for Stargardt macular dystrophy, is an efficient target of all-trans-retinal-mediated photooxidative damage in vitro, implications for retinal disease. J Biol Chem. 2001;276:11766–11774. doi: 10.1074/jbc.M010152200. [DOI] [PubMed] [Google Scholar]
- 84.Bungert S, Molday LL, Molday RS. Membrane topology of the ATP binding cassette transporter ABCR and its relationship to ABC1 and related ABCA transporters: identification of N-linked glycosylation sites. J Biol Chem. 2001;276:23539–23546. doi: 10.1074/jbc.M101902200. [DOI] [PubMed] [Google Scholar]
- 85.Allikmets R, Singlh N, Sun H, et al. A photoreceptor cell-specific ATP-binding transporter gene (ABCR) is mutated in recessive Stargardt macular dystrophy. Nat Genet. 1997;15:236–246. doi: 10.1038/ng0397-236. [DOI] [PubMed] [Google Scholar]
- 86.Nasonkin I, Illing M, Koehler MR, Schmid M, Molday RS, Weber BH. Mapping of the rod photoreceptor ABC transporter (ABCR) to 1p21–p22.1 and identification of novel mutations in Stargardt’s disease. Hum Genet. 1998;102:21–26. doi: 10.1007/s004390050649. [DOI] [PubMed] [Google Scholar]
- 87.Souied EH, Ducroq D, Rozet JM, et al. A novel ABCR nonsense mutation responsible for late-onset fundus flavimaculatus. Invest Ophthalmol Vis Sci. 1999;40:2740–2744. [PubMed] [Google Scholar]
- 88.Martinez-Mir A, Paloma E, Allikmets R, et al. Retinitis pigmentosa caused by a homozygous mutation in the Stargardt disease gene ABCR. Nat Genet. 1998;18:11–12. doi: 10.1038/ng0198-11. [DOI] [PubMed] [Google Scholar]
- 89.Cremers FP, van de Pol DJ, van Driel M, et al. Autosomal recessive retinitis pigmentosa and cone-rod dystrophy caused by splice site mutations in the Stargardt’s disease gene ABCR. Hum Mol Genet. 1998;7:355–362. doi: 10.1093/hmg/7.3.355. [DOI] [PubMed] [Google Scholar]
- 90.Rauen T. Diversity of glutamate transporter expression and function in the mammalian retina. Amino Acids. 2000;19:53–62. doi: 10.1007/s007260070033. [DOI] [PubMed] [Google Scholar]
- 91.Arriza JL, Eliasof S, Kavanaugh MP, Amara SG. Excitatory amino acid transporter 5, a retinal glutamate transporter coupled to chloride conductance. Proc Natl Acad Sci U S A. 1997;94:4155–4160. doi: 10.1073/pnas.94.8.4155. [DOI] [PMC free article] [PubMed] [Google Scholar]
- 92.Pow DV, Barnett NL, Penfold P. Are neuronal transporters relevant in retinal glutamate homeostasis? Neurochem Int. 2000;37:191–198. doi: 10.1016/s0197-0186(00)00022-x. [DOI] [PubMed] [Google Scholar]
- 93.Naskar R, Vorwerk CK, Dreyer EB. Concurrent downregulation of a glutamate transporter and receptor in glaucoma. Invest Ophthalmol Vis Sci. 2000;41:1940–1944. [PubMed] [Google Scholar]
- 94.Vorwerk CK, Naskar R, Schuettauf F, et al. Depression of retinal glutamate transporter function leads to elevated intravitreal glutamate levels and ganglion cell death. Invest Ophthalmol Vis Sci. 2000;41:3615–362. [PubMed] [Google Scholar]
- 95.Luo X, Lambrou GN, Sahel JA, Hicks D. Hypoglycemia induces general neuronal death, whereas hypoxia and glutamate transport blockade lead to selective retinal ganglion cell death in vitro. Invest Ophthalmol Vis Sci. 2001;42:2695–2705. [PubMed] [Google Scholar]
- 96.Steinberg RH, Miller SS, Stern WH. Initial observation on the isolated retinal pigment epithelium-choroid of the cat. Invest Ophthalmol Vis Sci. 1978;17:675–678. [PubMed] [Google Scholar]
- 97.Young RW, Bok D. Participation of the retinal pigment epithelium in the rod outer segment renewal process. J Cell Biol. 1969;42:392–403. doi: 10.1083/jcb.42.2.392. [DOI] [PMC free article] [PubMed] [Google Scholar]
- 98.Caldwell RB, Slapnick SM. Increased cytochrome oxidase activity in the diabetic rat retinal pigment epithelium. Invest Ophthalmol Vis Sci. 1989;30:591–599. [PubMed] [Google Scholar]
- 99.Mitchell CH. Release of ATP by a human retinal pigment epithelial cell line: potential for autocrine stimulation through subretinal space. J Physiol. 2001;534:193–202. doi: 10.1111/j.1469-7793.2001.00193.x. [DOI] [PMC free article] [PubMed] [Google Scholar]
- 100.Greenwood D, Yao WP, Housley GD. Expression of the P2X2 receptor subunit of the ATP-gated ion channel in the retina. NeuroReport. 1997;8:1083–1088. doi: 10.1097/00001756-199703240-00004. [DOI] [PubMed] [Google Scholar]
- 101.Ribelayga C, Mangel SC. A circadian clock and light/dark adaptation differentially regulate adenosine in the mammalian retina. J Neurosci. 2005;25:215–222. doi: 10.1523/JNEUROSCI.3138-04.2005. [DOI] [PMC free article] [PubMed] [Google Scholar]
- 102.Newman EA. Propagation of intercellular calcium waves in retinal astrocytes and Muller cells. J Neurosci. 2001;21:2215–2223. doi: 10.1523/JNEUROSCI.21-07-02215.2001. [DOI] [PMC free article] [PubMed] [Google Scholar]
- 103.Neal M, Cunningham J. Modulation by endogenous ATP of the light-evoked release of ACh from retinal cholinergic neurons. Br J Pharamacol. 1994;113:1085–1087. doi: 10.1111/j.1476-5381.1994.tb17106.x. [DOI] [PMC free article] [PubMed] [Google Scholar]
- 104.Santos PF, Caramelo OL, Carvalho AP, Duarte CB. Characterization of ATP release from cultures enriched in cholinergic amacrine-like neurons. J Neurobiol. 1999;41:340–348. [PubMed] [Google Scholar]
- 105.Morgan JE. Circulation and axonal transport in the optic nerve. Eye. 2004;18:1089–1095. doi: 10.1038/sj.eye.6701574. [DOI] [PubMed] [Google Scholar]
- 106.Schober MS, Chidlow G, Wood JP, Casson RJ. Bioenergetic-based neuroprotection and glaucoma. Clin Exp Ophthalmol. 2008;36:377–385. doi: 10.1111/j.1442-9071.2008.01740.x. [DOI] [PubMed] [Google Scholar]
- 107.Carpenter MB. Human Neuroanatomy. 7th ed. Baltimore: The Williams Wilkins; 1976. [Google Scholar]
- 108.Hevner RF, Wong-Riley MTT. Mitochondrial and nuclear gene expression for cytochrome oxidase subunits are disproportionately regulated by functional activity in neurons. J Neurosci. 1993;13:1805–1819. doi: 10.1523/JNEUROSCI.13-05-01805.1993. [DOI] [PMC free article] [PubMed] [Google Scholar]
- 109.Bell MA, Ball MJ. Laminar variation in the microvascular architecture of normal human visual cortex (area 17) Brain Res. 1985;335:139–143. doi: 10.1016/0006-8993(85)90284-7. [DOI] [PubMed] [Google Scholar]
- 110.Horton JC. Cytochrome oxidase patches: A new cytoarchitectonic feature of monkey visual cortex. Phil Trans R Soc Lond B. 1984;304:199–253. doi: 10.1098/rstb.1984.0021. [DOI] [PubMed] [Google Scholar]
- 111.Wong-Riley M, Carroll EW. Effect of impulse blockage on cytochrome oxidase activity in the monkey visual system. Nature. 1984;307:262–264. doi: 10.1038/307262a0. [DOI] [PubMed] [Google Scholar]
- 112.Wong-Riley MTT. Comparative study of the mammalian primary visual cortex with cytochrome oxidase histochemistry. In: Yew DT, So KF, Tsang DSC, editors. Vision: Structure and Function. New Jersey: World Scientific Press; 1988. pp. 450–486. [Google Scholar]
- 113.Wong-Riley MTT, Hevner RF, Cutlan R, et al. Cytochrome oxidase in the human visual cortex: Distribution in the developing and the adult brain. Visual Neurosci. 1993;10:41–58. doi: 10.1017/s0952523800003217. [DOI] [PubMed] [Google Scholar]
- 114.DeYoe EA, Trusk TC, Wong-Riley MTT. Activity correlates of cytochrome oxidase-defined compartments in granular and supragranular layers of primary visual cortex of the macaque monkey. Vis Neurosci. 1995;12:629–639. doi: 10.1017/s0952523800008920. [DOI] [PubMed] [Google Scholar]
- 115.Wong-Riley MTT. Primate Visual Cortex: Dynamic metabolic organization and plasticity revealed by cytochrome oxidase. In: Peters A, Rockland K, editors. Cerebral Cortex, Vol. 10. Primary Visual Cortex in Primates. New York: Plenum Press; 1994. pp. 141–200. [Google Scholar]
- 116.Zheng D, LaMantia AS, Purves D. Specialized vascularization of the primate visual cortex. J Neurosci. 1991;11:2622–2629. doi: 10.1523/JNEUROSCI.11-08-02622.1991. [DOI] [PMC free article] [PubMed] [Google Scholar]
- 117.Macko KA, Jarvis CD, Kennedy C, et al. Mapping the primate visual system with [2–14C] deoxyglucoes. Science. 1982;218:394–397. doi: 10.1126/science.7123241. [DOI] [PubMed] [Google Scholar]
- 118.Kushner MJ, Rosenquist A, Alavi A, et al. Cerebral metabolism and patterned visual stimulation: a positron emission tomographic study of the human visual cortex. Neurology. 1988;38:89–95. doi: 10.1212/wnl.38.1.89. [DOI] [PubMed] [Google Scholar]
- 119.Tootell RB, Hadjikhani NK, Vanduffel W, et al. Functional analysis of primary visual cortex (V1) in humans. Proc Natl Acad Sci U S A. 1998;95:811–817. doi: 10.1073/pnas.95.3.811. [DOI] [PMC free article] [PubMed] [Google Scholar]
- 120.Hoge RD, Atkinson J, Gill B, Crelier GR, Marrett S, Pike GB. Liner coupling between cerebral blood flow and oxygen consumption in activated human cortex. Proc Natl Acad Sci U S A. 1999;96:9403–9408. doi: 10.1073/pnas.96.16.9403. [DOI] [PMC free article] [PubMed] [Google Scholar]
- 121.Borowsky IW, Collins RC. Metabolic anatomy of brain: a comparison of regional capillary density, glucose metabolism, and enzyme activities. J Comp Neurol. 1989;288:401–413. doi: 10.1002/cne.902880304. [DOI] [PubMed] [Google Scholar]
- 122.Tuor UI, Grewal D. Autoregulation of cerebral blood flow: Influence of local brain development and postnatal age. Am J Physiol. 1994;267:H2220–H2228. doi: 10.1152/ajpheart.1994.267.6.H2220. [DOI] [PubMed] [Google Scholar]
- 123.Black JE, Sirevaag AM, Greenough WT. Complex experience promotes capillary formation in young rat visual cortex. Neurosci Lett. 1987;83:351–355. doi: 10.1016/0304-3940(87)90113-3. [DOI] [PubMed] [Google Scholar]
- 124.Black JE, Polinsky M, Greenough WT. Progressive failure of cerebral angiogenesis supporting neural plasticity in aging rats. Neurobiol Aging. 1989;10:353–358. doi: 10.1016/0197-4580(89)90048-1. [DOI] [PubMed] [Google Scholar]
- 125.Hubel DH, Wiesel TN. Ferrier lecture: Functional architecture of macaque monkey visual cortex. Proc R Soc London Ser B. 1977;198:1–59. doi: 10.1098/rspb.1977.0085. [DOI] [PubMed] [Google Scholar]
- 126.Livingstone MS, Hubel DH. Anatomy and physiology of a color system in the primate visual cortex. J Neurosci. 1984;4:309–356. doi: 10.1523/JNEUROSCI.04-01-00309.1984. [DOI] [PMC free article] [PubMed] [Google Scholar]
- 127.Tootell RBH, Silverman MS, Hamilton SL, Switkes E, DeValois RL. Functional anatomy of macaque striate cortex. V. Spatial frequency. J Neurosci. 1988;8:1610–1624. doi: 10.1523/JNEUROSCI.08-05-01610.1988. [DOI] [PMC free article] [PubMed] [Google Scholar]
- 128.Sibson NR, Dhankhar A, Mason GF, Rothman DL, Behar KL, Shulman RG. Stoichiometric coupling of brain glucose metabolism and glutamatergic neuronal activity. Proc Natl Acad Sci U S A. 1998;95:316–321. doi: 10.1073/pnas.95.1.316. [DOI] [PMC free article] [PubMed] [Google Scholar]
- 129.Rothman DL, Sibson NR, Hyder F, Shen J, Behar KL, Shulman RG. In vivo nuclear magnetic resonance spectroscopy studies of the relationship between the glutamate-glutamine neurotransmitter cycle and functional neuroenergetics. Philos Trans R Soc Lond B Biol Sci. 1999;354:1165–1177. doi: 10.1098/rstb.1999.0472. [DOI] [PMC free article] [PubMed] [Google Scholar]
- 130.Mayer ML, Westbrook GL. The physiology of excitatory amino acids in the vertebrate central nervous system. Prog Neurobiol. 1987;28:197–276. doi: 10.1016/0301-0082(87)90011-6. [DOI] [PubMed] [Google Scholar]
- 131.Wong-Riley M, Anderson B, Liebl W, Huang Z. Neurochemical organization of the macaque striate cortex: correlation of cytochrome oxidase with Na+K+ATPase, NADPH-diaphorase, nitric oxide synthase, and N-methyl-D-aspartate receptor subunit 1. Neurosci. 1998;83(4):1025–1045. doi: 10.1016/s0306-4522(97)00432-6. [DOI] [PubMed] [Google Scholar]
- 132.Hevner RF, Duff RS, Wong-Riley MTT. Coordination of ATP production and consumption in brain: Parallel regulation of cytochrome oxidase and Na+ K+ATPase. Neurosci Lett. 1992;138:188–192. doi: 10.1016/0304-3940(92)90502-x. [DOI] [PubMed] [Google Scholar]
- 133.Hendrickson AE, Hunt SP, Wu JY. Immunocytochemical localization of glutamic acid decarboxylase in monkey striate cortex. Nature. 1981;292:605–607. doi: 10.1038/292605a0. [DOI] [PubMed] [Google Scholar]
- 134.Wong-Riley MTT, Tripathi SC, Trusk TC, Hoppe DA. Effect of retinal impulse blockage on cytochrome oxidase-rich zones in the macaque striate cortex. I. Quantitative electron microscopic (EM) analysis of neurons. Vis Neurosci. 1989;2:483–497. doi: 10.1017/s0952523800012384. [DOI] [PubMed] [Google Scholar]
- 135.Wong-Riley MTT, Trusk TC, Kaboord W, Huang Z. Effect of retinal impulse blockage on cytochrome oxidase-poor interpuffs in the macaque striate cortex: Quantitative EM analysis of neurons. J Neurocytol. 1994;23:533–553. doi: 10.1007/BF01262055. [DOI] [PubMed] [Google Scholar]
- 136.Silverman MS, Grosof DH, De Valois RL, Elfar SD. Spatial-frequency organization in primate striate cortex. Proc Natl Acad Sci U S A. 1989;86:711–715. doi: 10.1073/pnas.86.2.711. [DOI] [PMC free article] [PubMed] [Google Scholar]
- 137.Ts’o DY, Frostig RD, Lieke EE, Grinvald A. Functional organization of primate visual cortex revealed by high resolution optical imaging. Science. 1990;249:417–420. doi: 10.1126/science.2165630. [DOI] [PubMed] [Google Scholar]
- 138.Mishkin M, Ungerleider LG, Macko KA. Object vision and spatial vision: Two cortical pathways. Trends Neurosci. 1983;6:414–417. [Google Scholar]
- 139.Van Essen DC, Maunsell JHR. Hierarchical organization and functional streams in the visual cortex. Trends Neurosci. 1983;6:370–375. [Google Scholar]
- 140.Felleman DJ, Van Essen DC. Distributed hierarchical processing in the primate cerebral cortex. Cereb Cortex. 1991;1:1–47. doi: 10.1093/cercor/1.1.1-a. [DOI] [PubMed] [Google Scholar]
- 141.Ungerleider LG, Haxby JV. “What” and “where” in the human brain. Curr Opin Neurobiol. 1994;4:157–165. doi: 10.1016/0959-4388(94)90066-3. [DOI] [PubMed] [Google Scholar]
- 142.Hubel DH, Livingstone MS. Segregation of form, color, and stereopsis in primate area 18. J Neurosci. 1987;7:3378–3415. doi: 10.1523/JNEUROSCI.07-11-03378.1987. [DOI] [PMC free article] [PubMed] [Google Scholar]
- 143.DeYoe EA, Van Essen DC. Concurrent processing streams in monkey visual cortex. Trends Neurosci. 1988;11:219–226. doi: 10.1016/0166-2236(88)90130-0. [DOI] [PubMed] [Google Scholar]
- 144.Wong-Riley M, Riley DA. The effect of impulse blockage on cytochrome oxidase activity in the cat visual system. Brain Res. 1983;261:185–193. doi: 10.1016/0006-8993(83)90622-4. [DOI] [PubMed] [Google Scholar]
- 145.Dhar SS, Ongwijitwat S, Wong-Riley MTT. Nuclear respiratory factor 1 regulates all ten nuclear-encoded subunits of cytochrome c oxidase in neurons. J Biol Chem. 2008;283:3120–3129. doi: 10.1074/jbc.M707587200. [DOI] [PMC free article] [PubMed] [Google Scholar]
- 146.Dhar SS, Wong-Riley MTT. Coupling of energy metabolism and synaptic transmission at the transcriptional level: Role of nuclear respiratory factor 1 in regulating both cytochrome c oxidase and NMDA glutamate receptor subunit genes. J Neurosci. 2009;29:483–492. doi: 10.1523/JNEUROSCI.3704-08.2009. [DOI] [PMC free article] [PubMed] [Google Scholar]
- 147.Dhar SS, Liang HL, Wong-Riley MTT. Nuclear respiratory factor 1 co-regulates AMPA glutamate receptor subunit 2 and cytochrome c oxidase: Tight coupling of glutamatergic transmission and energy metabolism in neurons. J Neurochem. 2009;108:1595–1606. doi: 10.1111/j.1471-4159.2009.05929.x. [DOI] [PMC free article] [PubMed] [Google Scholar]
- 148.Dhar SS, Liang HL, Wong-Riley MTT. Transcriptional coupling of synaptic transmission and energy metabolism: Role of nuclear respiratory factor 1 in co-regulating neuronal nitric oxide synthase and cytochrome c oxidase genes in neurons. BBA – Mol Cell Res. 2009;1793:1604–1613. doi: 10.1016/j.bbamcr.2009.07.001. [DOI] [PMC free article] [PubMed] [Google Scholar]
- 149.Chen PE, Wyllie DJ. Pharmacological insights obtained from structure-function studies of ionotropic glutamate receptors. Br J Pharamacol. 2006;147:839–853. doi: 10.1038/sj.bjp.0706689. [DOI] [PMC free article] [PubMed] [Google Scholar]
- 150.Swanson GT, Kamboj SK, Cull-Candy SG. Single-channel properties of recombinant AMPA receptors depend on RNA editing, splice variation, and subunit composition. J Neurosci. 1997;17:58–69. doi: 10.1523/JNEUROSCI.17-01-00058.1997. [DOI] [PMC free article] [PubMed] [Google Scholar]
- 151.Garthwaite J. Glutamate, nitric oxide and cell-cell signaling in the nervous system. Trends Neurosci. 1991;14:60–67. doi: 10.1016/0166-2236(91)90022-m. [DOI] [PubMed] [Google Scholar]
- 152.Wallace DC, Singh G, Lott MT, et al. Mitochondrial DNA mutation associated with Leber’s hereditary optic neuropathy. Science. 1988;242:1427–1430. doi: 10.1126/science.3201231. [DOI] [PubMed] [Google Scholar]
- 153.Howell N, Bindoff LA, McCullough DA, et al. Leber hereditary optic neuropathy: identification of the same mitochondrial ND1 mutation in six pedigrees. Am J Hum Genet. 1991;49:939–950. [PMC free article] [PubMed] [Google Scholar]
- 154.Johns DR, Neufeld MJ, Park RD. An ND-6 mitochondrial DNA mutation associated with Leber hereditary optic neuropathy. Biochem Biophys Res Comm. 1992;187:1551–1557. doi: 10.1016/0006-291x(92)90479-5. [DOI] [PubMed] [Google Scholar]
- 155.Carelli V, Ross-Cisneros FN, Sadun AA. Mitochondrial dysfunction as a cause of optic neuropathies. Prog Retin Eye Res. 2004;23:53–89. doi: 10.1016/j.preteyeres.2003.10.003. [DOI] [PubMed] [Google Scholar]
- 156.Edmond JC. Mitochondrial disorders. Int Ophthalmol Clin. 2009;49:27–33. doi: 10.1097/IIO.0b013e3181a8de58. [DOI] [PubMed] [Google Scholar]
- 157.Anderson S, Bankier AT, Barrell BG, et al. Sequence and organization of the human mitochondril genome. Nature. 1981;290:457–465. doi: 10.1038/290457a0. [DOI] [PubMed] [Google Scholar]
- 158.Baracca A, Sgarbi G, Mattiazzi M, et al. Biochemical phenotypes associated with the mitochondrial ATP6 gene mutations at nt8993. Biochim Biophys Acta. 2007;1767:913–919. doi: 10.1016/j.bbabio.2007.05.005. [DOI] [PubMed] [Google Scholar]
- 159.Bruno C, Martinuzzi A, Tang Y, et al. A stop-codon mutation in the human mtDNA cytochrome c oxidase 1 gene disrupts the functional structure of complex IV. Am J Hum Genet. 1999;65:611–620. doi: 10.1086/302546. [DOI] [PMC free article] [PubMed] [Google Scholar]
- 160.Pachalska M, DiMauro S, Forminska-Kapuscik M, et al. The course of vision disturbances in a patient with the MELAS syndrome. Med Sci Monit. 2002;8:CS11–20. [PubMed] [Google Scholar]
- 161.Schon EA, Rizzuto R, Moraes CT, Nakase H, Zeviani M, DiMauro S. A direct repeat is a hotspot for large-scale deletion of human mitochondrial DNA. Science. 1989;244:346–349. doi: 10.1126/science.2711184. [DOI] [PubMed] [Google Scholar]
- 162.Delettre C, Lenaers G, Griffoin JM, et al. Nuclear gene OPA1, encoding a mitochondrial dynamin-related proteins, is mutated in dominant optic atrophy. Nat Genet. 2000;26:207–210. doi: 10.1038/79936. [DOI] [PubMed] [Google Scholar]
- 163.Pesch UE, Fries JE, Bette S, et al. OPA1, the disease gene for autosomal dominant optic atrophy, is specifically expressed in ganglion cells and intrinsic neurons of the retina. Invest Ophthalmol Vis Sci. 2004;45:4217–4225. doi: 10.1167/iovs.03-1261. [DOI] [PubMed] [Google Scholar]
- 164.Zhu Z, Yao J, Johns T, et al. SURF1, encoding a factor involved in the biogenesis of cytochrome c oxidase, is mutated in Leigh syndrome. Nat Genet. 1998;20:337–343. doi: 10.1038/3804. [DOI] [PubMed] [Google Scholar]
- 165.Binder J, Hofmann S, Kreisel S, et al. Clinical and molecular findings in a patient with a novel mutation in the deafness-dystonia peptide (DDP1) gene. Brain. 2003;126:1814–1820. doi: 10.1093/brain/awg174. [DOI] [PubMed] [Google Scholar]
- 166.Antonetti DA, Barber AJ, Bronson SK, et al. Diabetic retinopathy. Seeing beyond glucose-induced microvascular disease. Diabetes. 2006;55:2401–2411. doi: 10.2337/db05-1635. [DOI] [PubMed] [Google Scholar]
- 167.Ting AY, Lee TK, MacDonald IM. Genetics of age-related macular degeneration. Curr Opin Ophthalmol. 2009;20:369–376. doi: 10.1097/ICU.0b013e32832f8016. [DOI] [PubMed] [Google Scholar]
- 168.Kong GY, Van Bergen NJ, Trounce IA, Crowston JG. Mitochondrial dysfunction and glaucoma. J Glaucoma. 2009;18:93–100. doi: 10.1097/IJG.0b013e318181284f. [DOI] [PubMed] [Google Scholar]
- 169.Bosch AM. Classical galactosaemia revisited. J Inherit Metab Dis. 2006;29:516–525. doi: 10.1007/s10545-006-0382-0. [DOI] [PubMed] [Google Scholar]
- 170.Tephly TR. The toxicity of methanol. Life Sci. 1991;48:1031–1041. doi: 10.1016/0024-3205(91)90504-5. [DOI] [PubMed] [Google Scholar]
- 171.Hartong DT, Dange M, McGee TL, Berson EL, Dryja TP, Colman RF. Insights from retinitis pigmentosa into the roles of isocitrate dehydrogenases in the Krebs cycle. Nat Genet. 2008;40:1230–1234. doi: 10.1038/ng.223. [DOI] [PMC free article] [PubMed] [Google Scholar]
- 172.Sadun AA, Borchert M, DeVita E, Hinton DR, Bassi CJ. Assessment of visual impairment in patients with Alzheimer’s disease. Am J Ophthalmol. 1987;104:113–120. doi: 10.1016/0002-9394(87)90001-8. [DOI] [PubMed] [Google Scholar]
- 173.Bodis-Wollner I. Retinopathy in Parkinson Disease. J Neural Transm. 2009;116:1493–1501. doi: 10.1007/s00702-009-0292-z. [DOI] [PubMed] [Google Scholar]
- 174.O’Donnell BF, Blekher TM, Weaver M, et al. Visual perception pre-diagnostic and early stage Huntington’s disease. J Int Neuropsychol Soc. 2008;14:446–453. doi: 10.1017/S1355617708080405. [DOI] [PMC free article] [PubMed] [Google Scholar]
- 175.Michikawa Y, Mazzucchelli F, Bresolin N, Scariato G, Attardi G. Aging-dependent large accumulation of point mutations in the human mtDNA control region for replication. Science. 1999;286:774–779. doi: 10.1126/science.286.5440.774. [DOI] [PubMed] [Google Scholar]
- 176.Kadenbach B, Ramzan R, Vogt S. Degenerative diseases, oxidative stress and cytochrome c oxidase function. Trends Mol Med. 2009;15:139–147. doi: 10.1016/j.molmed.2009.02.004. [DOI] [PubMed] [Google Scholar]