Abstract
Here we introduce a modified antibody staining method that uses up to 80% less antibody for flow cytometry. We demonstrate this method for the detection of antigens expressed at high, moderate, or low levels in mouse and rat lymphocytes as well as mouse mammary epithelial cells. We obtained reproducibly accurate results for the detection of up to seven parameters for activation induced-proliferation, cell cycle analysis, and phenotyping of cell-surface and intracellular antigens.
Keywords: flow cytometry, antibody staining, lymphocytes, epithelial cells
In multi-parameter flow cytometry, reagent selection, instrument parameters and staining protocol are crucial for sensitivity and accuracy. Experts in flow cytometry have long held that antibody concentration rather than cell number is essential to proper staining (1). Hence, the volumes of antibodies used in multiparametric flow cytometry profoundly affect the cost of experimentation. If the staining volume can be reduced while cell numbers are kept appropriate for the experiment, assay costs could be reduced. Here, we describe a method to reduce staining volume from 100µl as recommended to 20 µL. Considering that the average molecular weight of an antibody molecule is approximately 150,000 Dalton, 0.2 µg antibody (= 1.33 picomoles) would contain about 8×10¹¹ molecules (2). The average number of commonly used surface antigens expressed on leukocytes is between 10,000 and 100,000 molecules per cell (3–7). Thus, 0.2 µg of antibody contains about 4 to 40 times the number of target antigen molecules present on 2 million lymphocytes (2×10¹⁰ to 2×10¹¹ antigen molecules). At small staining volumes, the residual medium remaining above the cell pellet can affect the final concentration of antibody available for staining cells. We hypothesized that by carefully removing the supernatant and titrating the antibody concentration in a smaller staining volume, the amount of antibody required for each sample could be reduced significantly. For this purpose, we postulated that the surface fluorescence of 2 million cells stained with 0.2 µg antibody in a minimum staining volume (20 µl) would be comparable to 2 million cells stained with the normally recommended 1.0 µg antibody in 100 µL staining volume.
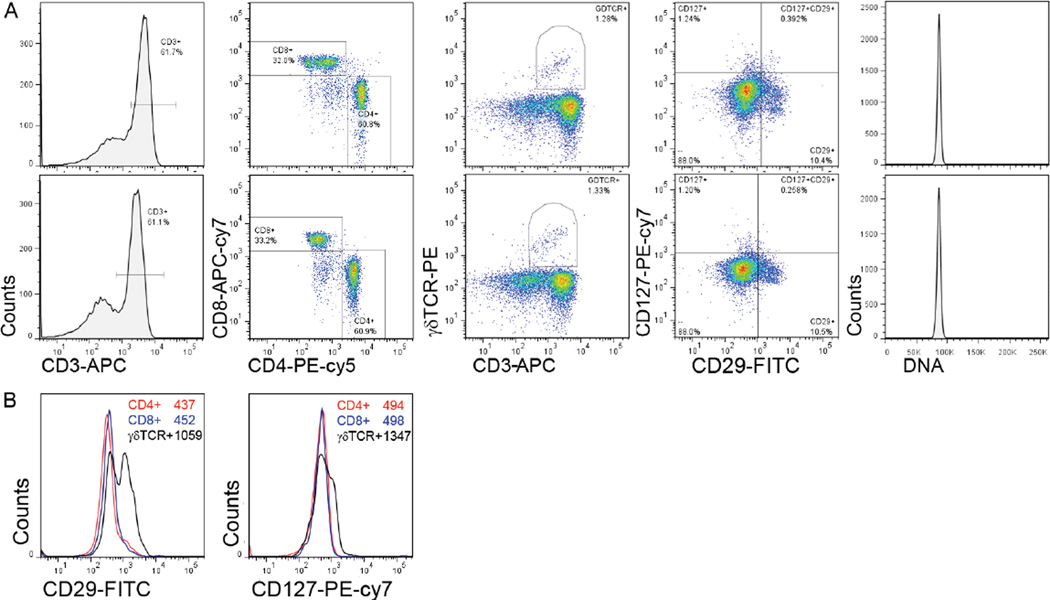
To establish the low-volume staining protocol, resting and activated lymphocytes were collected, counted, and centrifuged in 1.7 mL Eppendorf tubes at a speed of 5000×g, higher than the traditionally used speed of 1250×g for 5 mL tubes. The pellets obtained by this method were more compact, thus facilitating low volume staining. The supernatant was carefully removed as described in the Supplementary material. Using a 200 µL tip to remove the residual supernatant without disturbing the cell pellet ensured equal staining in multiple samples. The resulting volume of the cell pellet containing 2 million cells was measured and found to be about 1.4 µL for resting lymphocytes and 2.25 µL for activated lymphocytes. The pellet was loosened by gently tapping the tube and an antibody mixture containing either 0.1 µg, 0.2 µg, or 0.4 µg of each antibody in 20 µL or 1.0 µg of each antibody in 100µl was added. We used a combination of seven fluorochromes, namely FITC, PE, PE-cy5, APC, APC-cy7, PE-cy7, and Hoechst/Dylight405. We selected antibodies to quantify the expression of antigens at high (>105 per cell; CD45 and CD3ε), moderate (~105 per cell; CD4 and CD8), or variable (none to >105 per cell; γδTCR, CD24, CD127, CD29, CD49f) levels. This method was used for enumeration of cells found at moderate to high frequency (CD3+, CD4+ or CD8+ T cells in the spleen, or luminal and basal epithelial cells in the mammary epithelium) or low frequency (γδTCR+ T cells and NK cells in the spleen or mammary stem cells) (3–12). For the low-volume staining protocol, all antibodies were titrated for 0.5 to 5 million freshly isolated leukocytes (Supplementary Figure S1) and 0.2 µg of antibody in a 20 µL volume was found to be optimal with the Z-scores closest to zero (Supplementary Table S1). We compared lymphocytes stained with 0.2 µg of each antibody in a 20 µL volume to lymphocytes stained by the classical method using 1.0 µg of each antibody in a 100 µL volume (Figure 1). All six parameters and the DNA content showed a similar staining pattern and distribution of cellular subsets between the low and high volume staining protocols (Figure 1A and Supplementary Table S1). We observed that the γδTCR+ T cells expressed higher levels of CD29 and CD127 when compared with CD4+ and CD8+ T cells (Figure 1B), which is a novel finding. Since different T cell subsets expressed variable levels of CD29 and CD127, the peaks of CD29+ and CD127+ cells were broad as reflected in their high coefficient of variation (CV) (Supplementary Table S2).
Figure 1. Seven-color flow cytometric analysis of freshly isolated lymphocytes by the classical and low-volume antibody staining methods.
(A) Histograms and pseudo color dot plots (from left to right) showing CD3-APC, CD4-PE-cy5/CD8-APC-cy7, CD3-APC/γδTCR-PE, CD29-FITC/CD127-PE-cy7, and Hoechst staining. The upper row shows the results of staining 2×10⁶ cells with 0.2 µg antibody in a 20 µL volume and the lower row shows results of staining 2×10⁶ cells with 1.0 µg antibody in a 100 µL volume. (B) Histograms depicting expression of CD29 and CD127 on CD4+ (red line), CD8+ (blue line), and γδTCR+ (black line) T cells. Mean fluorescence intensity (MFI) for each cell type is shown in the inset. Data shown are from one of three samples and two such independent experiments were carried out. Z scores comparing the modified low volume staining method to the 1.0 µg/100µl staining method are shown in Supplementary Table S1.
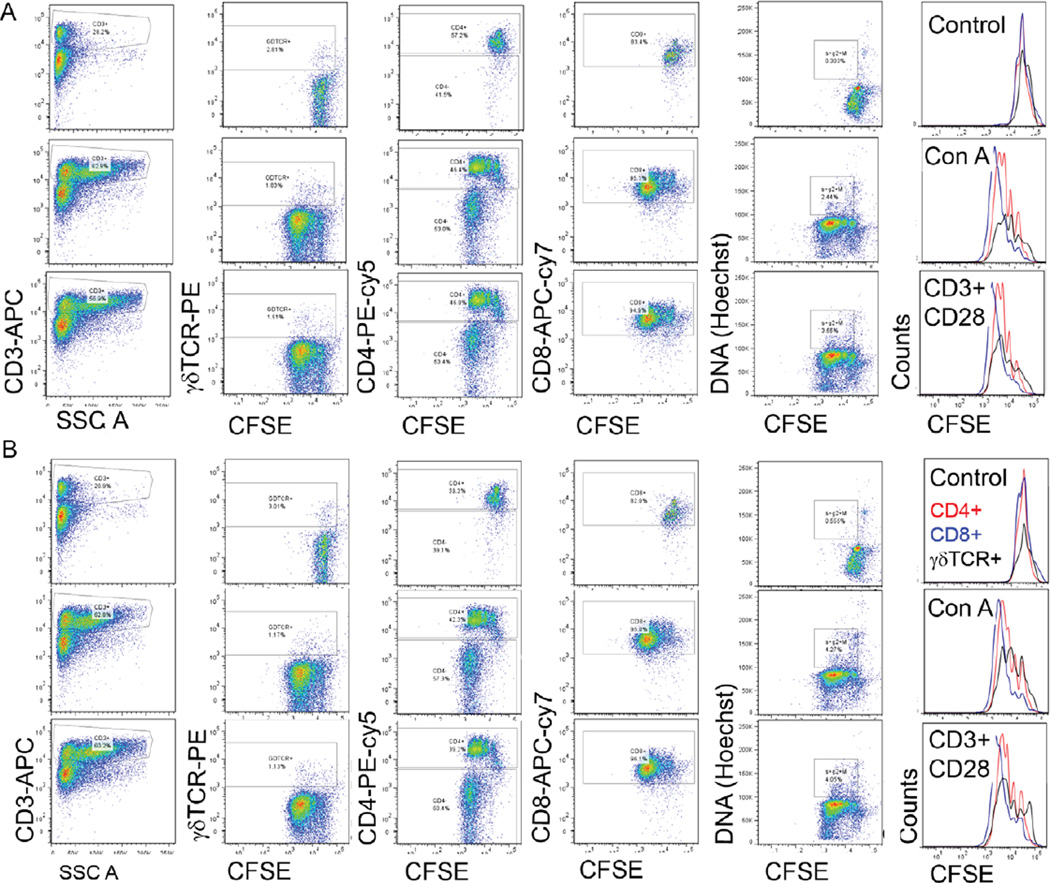
To validate this low-volume staining protocol for different flow cytometric applications, we performed proliferation assays, cell cycle analysis, cell surface staining, and intracellular staining. Mouse leukocytes were stained with carboxy fluorescein diacetate succinimidyl ester (CFSE) and stimulated in vitro with concanavalin A (1 µg/mL) or plate-bound CD3 and soluble CD28 antibodies. Subsequently, cell cycle analysis was done by Hoechst staining and cell surface phenotyping was done using a combination of CD3, γδTCR, CD4, and CD8 antibodies. Figure 2 shows the proliferation-dependent decrease in CFSE fluorescence for CD3+, CD4+, CD8+, and γδTCR+ T cells using the low-volume staining protocol (Figure 2A) compared with the classical staining protocol (Figure 2B). The results demonstrate that downscaling the staining volume did not affect the quality of fluorescent signal for these immunological assays. The low-volume staining protocol was also suitable for the measurement of five parameters for rat lymphocytes (CD3, CD4, CD8, γδTCR, and CD161α; Supplementary Figure S2).
Figure 2. Six-color flow cytometric analysis of activated and proliferating T cells by the classical and modified methods for antibody staining.
Pseudo color dot plots showing CD3-APC, γδTCR-PE, CD4-PE-cy5, CD8-APC-cy7, and Hoechst staining in CFSE (1 µM) stained cells stimulated with concanavalin A (1 µg/mL; middle row) or plate bound CD3 (5 µg/mL) + soluble CD28 (1 µg/mL) antibodies (lower row) compared with unstimulated cultured cells (upper row). (A) Results of staining 2×10⁶ cells with 1.0 µg antibody in 100 µL and (B) 2×10⁶ cells with 0.2 µg antibody in 20 µL. On the right, overlaid histograms demonstrate the loss of CFSE fluorescence showing proliferation of CD4+ (red line), CD8+ (blue line), and γδTCR+ (black line) T cells. Data shown are from one of three samples and two such independent experiments were carried out.
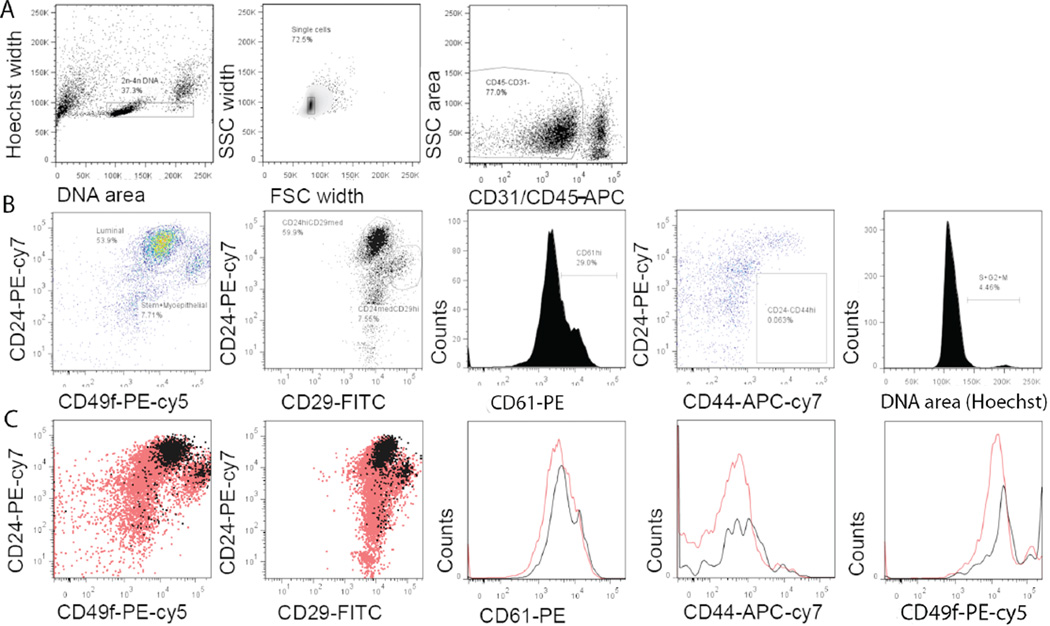
Finally, the low-volume staining protocol was utilized for the phenotyping of mouse mammary epithelial cells using seven parameters, namely CD24, CD29, CD44, CD31/CD45, CD49f, CD61, and DNA content. A restriction strategy was used to gate out red blood cells, doublets, hematopoietic cells, and endothelial cells based on DNA content, FSC/SSC width, CD45, and CD31, respectively (Figure 3A). Using the low-volume staining protocol, previously reported populations of mouse mammary epithelial cells including luminal, basal, and stem progenitor cells (10–12) could be quantitatively identified based on CD24 and CD49f expression as well as CD24 and CD29 expression (Figure 3B). Subsequently, we gated CD24negCD44high cells and dividing cells (containing more than 2nDNA) and found that the latter were enriched in the CD24highCD29high population and expressed higher levels of CD49f and CD61 (Figure 3C), which is an observation not previously reported in the literature for mouse mammary epithelial cells. The enrichment of dividing cells in the mouse mammary gland CD24highCD29high population expressing higher levels of CD49f was similar to that of actively dividing cells in rat mammary epithelial cells (13).
Figure 3. Flow cytometric characterization of mouse mammary epithelial cells stained by the modified method.
(A) Gating for live cells based on DNA content, separation of single cells by FSC width and SSC width, and gating for CD45-CD31- cells. (B) Pseudo color plot of CD24/CD49f expression, dot plot of CD24/CD29 expression, histogram of CD61 expression in luminal cells, pseudo color plot of CD24/CD44 expression, and histogram of DNA content for cell cycle analysis in CD45-CD31- mouse mammary epithelial cells. (C) Overlaid dot plots and histograms showing CD24/CD49f or CD24/ CD29, CD61, CD44, and CD49f expression in total CD45-CD31- cells (red) compared with actively dividing cells containing >2n DNA (black). Data shown are from one of six mice and three such independent experiments were carried out.
Multiple experiments in our lab, including more than 100 mice and more than 700 rats, yielded comparable results, ensuring reproducibility of this method for flow cytometric characterization of leukocytes and mammary epithelial cells (13–14). Besides cell surface phenotyping (CD24, CD29, CD31, CD45, CD61, and CD49f ), we successfully used the low volume protocol for intracellular staining (cytokeratin 14, cytokeratin 19, focal adhesion kinase, smooth muscle actin) of rat mammary epithelial cells and mammary carcinomas (13). By increasing the relative centrifugal force to pellet the cells, carefully reducing the medium volume to just above the pellet, and reducing the staining volume, up to 80 percent of each antibody can be saved without compromising the accuracy or reproducibility of multi-parameter flow cytometry data.
Supplementary Material
Acknowledgments
We thank Dagna Sheerar and flow staff of the Paul P. Carbone Comprehensive Cancer Center Flow Cytometry Core for their expertise, assistance, and service. This work was supported by National Institutes of Health grants (CA123272) and (CA077494), and National Institute of Environmental Health Sciences Grant (ES019466). The content is solely the responsibility of the authors and does not necessarily reflect the official views of National Institute of Environmental Health Sciences or National Institutes of Health. This paper is subject to the NIH Public Access Policy.
Footnotes
Supplementary material for this article is available at www.BioTechniques.com/article/113854
Competing interests
The authors declare no competing interests.
References
- 1.McLaughlin BE, Baumgarth N, Bigos M, Roederer M, De Rosa SC, Altman JD, Nixon DF, Ottinger J. Nine-color flow cytometry for accurate measurement of T cell subsets and cytokine responses. Part I: Panel design by an empiric approach. Cytometry A. 2008;73:400–410. doi: 10.1002/cyto.a.20555. [DOI] [PMC free article] [PubMed] [Google Scholar]
- 2.Padlan EA. Anatomy of the antibody molecule. Mol. Immunol. 1994;31:169–217. doi: 10.1016/0161-5890(94)90001-9. [DOI] [PubMed] [Google Scholar]
- 3.Cho BK, Lian KC, Lee P, Brunmark A, McKinley C, Chen J, Kranz DM, Eisen HN. Differences in antigen recognition and cytolytic activity of CD8(+) and CD8(−) T cells that express the same antigen-specific receptor. Proc. Natl. Acad. Sci. USA. 2001;98:1723–1727. doi: 10.1073/pnas.98.4.1723. [DOI] [PMC free article] [PubMed] [Google Scholar]
- 4.Ginaldi L, Matutes E, Farahat N, De Martinis M, Morilla R, Catovsky D. Differential expression of CD3 and CD7 in T-cell malignancies: a quantitative study by flow cytometry. Br. J. Haematol. 1996;93:921–927. doi: 10.1046/j.1365-2141.1996.d01-1720.x. [DOI] [PubMed] [Google Scholar]
- 5.Davis KA, Abrams B, Iyer SB, Hoffman RA, Bishop JE. Determination of CD4 antigen density on cells: role of antibody valency, avidity, clones, and conjugation. Cytometry. 1998;33:197–205. doi: 10.1002/(sici)1097-0320(19981001)33:2<197::aid-cyto14>3.0.co;2-p. [DOI] [PubMed] [Google Scholar]
- 6.Takada S, Engleman EG. Evidence for an association between CD8 molecules and the T cell receptor complex on cytotoxic T cells. J. Immunol. 1987;139:3231–3235. [PubMed] [Google Scholar]
- 7.Ginaldi L, Farahat N, Matutes E, De Martinis M, Morilla R, Catovsky D. Differential expression of T cell antigens in normal peripheral blood lymphocytes: a quantitative analysis by flow cytometry. J. Clin. Pathol. 1996;49:539–544. doi: 10.1136/jcp.49.7.539. [DOI] [PMC free article] [PubMed] [Google Scholar]
- 8.Nicolas L, Monneret G, Debard AL, Blesius A, Gutowski MC, Salles G, Bienvenu J. Human gammadelta T cells express a higher TCR/CD3 complex density than alphabeta T cells. Clin. Immunol. 2001;98:358–363. doi: 10.1006/clim.2000.4978. [DOI] [PubMed] [Google Scholar]
- 9.Mazzucchelli R, Durum SK. Interleukin-7 receptor expression: intelligent design. Nat. Rev. Immunol. 2007;7:144–154. doi: 10.1038/nri2023. [DOI] [PubMed] [Google Scholar]
- 10.Shackleton M, Vaillant F, Simpson KJ, Stingl J, Smyth GK, Asselin-Labat ML, Wu L, Lindeman GJ, Visvader JE. Generation of a functional mammary gland from a single stem cell. Nature. 2006;439:84–88. doi: 10.1038/nature04372. [DOI] [PubMed] [Google Scholar]
- 11.Stingl J, Eirew P, Ricketson I, Shackleton M, Vaillant F, Choi D, Li HI, Eaves CJ. Purification and unique properties of mammary epithelial stem cells. Nature. 2006;439:993–997. doi: 10.1038/nature04496. [DOI] [PubMed] [Google Scholar]
- 12.Visvader JE. Keeping abreast of the mammary epithelial hierarchy and breast tumorigenesis. Genes Dev. 2009;23:2563–2577. doi: 10.1101/gad.1849509. [DOI] [PMC free article] [PubMed] [Google Scholar]
- 13.Sharma D, Smits BM, Eichelberg MR, Meilahn AL, Muelbl MJ, Haag JD, Gould MN. Quantification of epithelial cell differentiation in mammary glands and carcinomas from DMBA- and MNU-exposed rats. PLoS One. 2011;6:e26145. doi: 10.1371/journal.pone.0026145. [DOI] [PMC free article] [PubMed] [Google Scholar]
- 14.Smits BM, Sharma D, Samuelson DJ, Woditschka S, Mau B, Haag JD, Gould MN. The non-protein coding breast cancer susceptibility locus Mcs5a acts in a non-mammary cell-autonomous fashion through the immune system and modulates T-cell homeostasis and functions. Breast Cancer Res. 2011;13:R81. doi: 10.1186/bcr2933. [DOI] [PMC free article] [PubMed] [Google Scholar]
Associated Data
This section collects any data citations, data availability statements, or supplementary materials included in this article.


