

Abstract
Defining the pathways through which neurons and astrocytes communicate may contribute to the elucidation of higher central nervous system functions. We investigated the possibility that decreases in extracellular calcium ion concentration ([Ca2+]e) that occur during synaptic transmission might mediate signaling from neurons to glia. Using noninvasive photolysis of the photolabile Ca2+ buffer diazo-2 {N-[2-[2-[2-[bis(carboxymethyl)amino]-5-(diazoacetyl)phenoxy]ethoxy]-4-methylphenyl]-N-(carboxymethyl)-, tetrapotassium salt} to reduce [Ca2+]e or caged glutamate to simulate glutamatergic transmission, we found that a local decline in extracellular Ca2+ triggered astrocytic adenosine triphosphate (ATP) release and astrocytic Ca2+ signaling. In turn, activation of purinergic P2Y1 receptors on a subset of inhibitory interneurons initiated the generation of action potentials by these interneurons, thereby enhancing synaptic inhibition. Thus, astrocytic ATP release evoked by an activity-associated decrease in [Ca2+]e may provide a negative feedback mechanism that potentiates inhibitory transmission in response to local hyperexcitability.
INTRODUCTION
The free calcium ion (Ca2+) is a ubiquitous intracellular messenger that plays a vital role in such diverse processes as excitability, secretion, gene transcription, cell proliferation, and cell death (1). Although numerous studies have investigated the modulation of synaptic strength by intracellular Ca2+ (2), the effect of the parallel decline in the extracellular Ca2+ concentration ([Ca2+]e) on synaptic function or glial signaling has received much less attention (3, 4). In the intact central nervous system (CNS), [Ca2+]e undergoes dynamic fluctuations during synaptic activity, which reflect the influx of Ca2+ through glutamate- and voltage-gated Ca2+ channels. Consequently, [Ca2+]e can decline from resting concentrations of 1.2 to 1.4 mM to less than 0.7 mM during periods of intense neuronal activity (5, 6). Low [Ca2+]e initiates a number of signaling processes in cultured astrocytes. These include the release of Ca2+ from cytosolic stores, the opening of connexin hemichannels, and the release of adenosine triphosphate (ATP) (7–10). Therefore, we postulated that decreases in [Ca2+]e might mediate signaling between glia and neurons—specifically, that the decrease in extracellular Ca2+ that occurs during synaptic activity might activate Ca2+ signaling in astrocytes. Work from multiple groups has shown that mobilization of intracellular Ca2+ stores represents the primary pathway by which astrocytes respond to neural activity. In turn, increased cytosolic Ca2+ is essential for the release of gliotransmitters and thereby for astrocytic modulation of synaptic efficacy. In particular, ATP has emerged as the principal gliotransmitter that mediates signaling between neighboring astrocytes (11). In addition, hippocampal interneurons contain P2Y1 receptors, activation of which is associated with increased γ-aminobutyric acid–mediated transmission (12, 13). Thus, the possibility exists that astrocytes can, through ATP release, modulate inhibitory transmission.
Here, we investigated the possibility that changes in the [Ca2+]e per se, as well as [Ca2+]e changes evoked by glutamate-induced depolarization, might be sufficient to activate astrocytes in situ. We used localized photolysis of MNI-glutamate [(S)-α-amino-2,3-dihydro-4-methoxy-7-nitro- δ-oxo-1H-indole-1-pentanoic acid] to manipulate the extracellular concentrations of glutamate and diazo-2 {N-[2-[2-[2-[bis(carboxymethyl)amino]-5-(diazoacetyl) phenoxy]ethoxy]-4-methylphenyl]-N-(carboxymethyl)-, tetrapotassium salt} to selectively manipulate local [Ca2+]e. Diazo-2 is a photolabile Ca2+ buffer whose affinity for Ca2+ increases markedly upon photolysis (14, 15); it has previously been used to study the role of intracellular Ca2+ in various processes, including long-term potentiation (LTP) (14), Ca2+ channel gating (16, 17), Na+/Ca2+ exchanger activity (18), and synaptic transmission (19), but not for manipulation of [Ca2+]e. We also used bioluminescence imaging to detect ATP release in response to localized reduction of [Ca2+]e. Our analysis suggests that the decrease in [Ca2+]e that occurs during excitatory transmission is sensed by neighboring astrocytes and that ATP released through astrocytic Cx43 hemichannels in turn strengthens inhibitory transmission by activating P2Y1 receptors on interneurons. Moreover, our study shows that signaling from neurons to glia can be mediated by changes in the concentration of extracellular Ca2+ ions and does not necessarily involve receptor-mediated signaling.
RESULTS
Photolysis of diazo-2 triggers astrocytic Ca2+ signaling
To determine the efficiency with which diazo-2 photolysis decreased [Ca2+]e, we inserted Ca2+-sensitive microelectrodes 75 μm from the site targeted for diazo-2 photolysis (Fig. 1A and fig. S1). Diazo-2 photolysis produced a dose-dependent decrease in [Ca2+]e with a nadir of −0.5 mM below resting [Ca2+]e and a delay of 0.3 ± 0.1 s (Fig. 1, B and C). The maximal amplitude of the decrease in [Ca2+]e was markedly reduced 100 and 150 μm from the site of photolysis, indicating that the effect of photolysis was local (fig. S1). We next combined photolysis with bioluminescence imaging of ATP. We added luciferin and luciferase to the bath and used a light-sensitive liquid nitrogen–cooled camera to detect photons produced by hydrolysis of ATP (9, 20) (Fig. 2, A and B). Diazo-2 photolysis stimulated a burst of local ATP release that occurred with a delay of 16.6 ± 5.8 s (n = 6); the ultraviolet (UV) flash used to trigger photolysis failed to trigger a detectable increase in photon emission if either diazo-2 or the luciferinluciferase mixture was omitted from the bath (Fig. 2B).
Fig. 1.
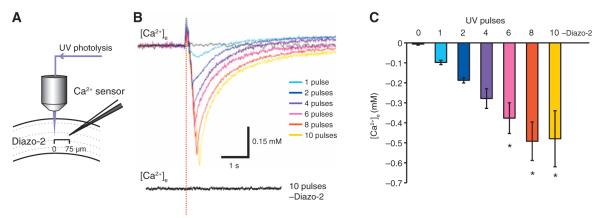
Photolysis of diazo-2 triggers a dose-dependent decrease in [Ca2+]e. (A) Experimental setup used for photolysis of diazo-2 in hippocampal slices. The Ca2+-sensitive microelectrode was placed at a distance of 75 μm from the site of photolysis. (B) Traces of changes in [Ca2+]e evoked by photolysis of diazo-2 in response to 1, 2, 4, 6, 8, or 10 UV pulses. In the absence of diazo-2, 10 UV pulses did not elicit a change in [Ca2+]e. (C) Bar graph displaying the changes in [Ca2+]e evoked by photolysis of diazo-2 plotted as a function of increasing number of UV photolysis. Omission of diazo-2 eliminated photolysis-induced decreases in [Ca2+]e (n = 3 to 4 photolysis events, *P < 0.05 compared to 0 pulse).
Fig. 2.

Photolysis of diazo-2 stimulates ATP release and slowly propagating Ca2+ waves. (A) Time series of bioluminescence imaging of photolysis-evoked ATP release with (upper panel) or without (lower panel) diazo-2. Luciferinluciferase was added to the bath, and a highly light-sensitive liquid nitrogen–cooled camera detected photons released from hippocampal slices in response to UV photolysis of diazo-2 (eight pulses). White circles indicate the position of UV photolysis. Scale bars, 100 mm. (B) Bar graph comparing peak luminescence signaling in the presence or absence of diazo-2 or luciferase (n = 3 to 6 photolysis events, **P < 0.01 compared to presence of diazo-2 and luciferase). (C) Time series of astrocytic Ca2+ (rhod-2) and LFP signals in response to photolysis of diazo-2. Hatched circles define the 50- and 100-μm radius from the photolysis site. Traces below show Ca2+ changes (percent of fluorescence change from baseline, ΔF/F) in individual cells 50, 100, or 150 μm from the site of photolysis, as well as LFP recordings (50-μm distance) after diazo-2 photolysis from the same experiment. Lower traces show similar experiment in the absence of diazo-2. Small white arrowheads indicate astrocytes that exhibit increases in Ca2+. (D) Bar graph comparing astrocytic Ca2+ increases (upper) and LFP (lower) evoked by photolysis of diazo-2 in the presence of suramin (50 μM) or PPADS (50 μM) (n = 5 to 8 photolysis events, **P < 0.01). Scale bar, 50 μm. We could not perform bioluminescence imaging in the presence of P2 receptor antagonists because all agents tested interfered with the luciferinluciferase reaction.
To determine whether ATP release was sufficient to trigger Ca2+ signaling among local astrocytes, we loaded mouse hippocampal slices with the Ca2+ indicator rhod-2 AM (Fig. 2C). Photolysis of diazo-2 did not induce an immediate increase in intracellular Ca2+; moreover, the local field potential (LFP) remained stable, indicating that the stimulation did not trigger neuronal depolarization. Rather, a slowly propagating Ca2+ wave was initiated after a delay of 19.7 ± 2.3 s (n = 22) (Fig. 2C). Cells closest to the photolysis site showed increases in intracellular Ca2+ first; this was followed by Ca2+ increases in surrounding cells, leading to a propagating Ca2+ wave that expanded to a mean radius of 137.9 ± 9.4 μm, at a velocity of 4.2 ± 0.4 μm/s (Fig. 2C). A subpopulation of astrocytes continued to show oscillatory Ca2+ signals after the wave had passed (Fig. 2C). Ca2+ waves were not evoked if diazo-2 was omitted from the bath or in the presence of either the purinergic type 2 (P2) receptor antagonist suramin or 4-[(E)-{4-formyl-5-hydroxy-6-methyl-3-[(phosphonooxy)methyl]pyridin-2-yl}diazenyl]benzene-1,3-disulfonic acid (PPADS) (Fig. 2D). Thus, UV photolysis of diazo-2 caused an abrupt decrease in extracellular Ca2+ that in turn triggered ATP release and P2 receptor–mediated Ca2+ signals in nearby astrocytes. As noted, the LFP signal remained stable throughout propagation of the Ca2+ wave (Fig. 2C), as did the membrane potential of CA1 pyramidal cells (fig. S2), indicating that the Ca2+ wave did not depend on neuronal depolarization. Moreover, the decline in [Ca2+]e did not directly affect the frequency or amplitude of spontaneous excitatory or inhibitory postsynaptic events (EPSPs or IPSCs, respectively; fig. S1). This observation is consistent with the notion that spontaneous neurotransmitter release is largely driven by the release of Ca2+ from internal Ca2+ stores and is therefore less sensitive to a transient reduction of [Ca2+]e (21) than is stimulus-evoked, action potential–dependent neurotransmitter release (22, 23).
Photolysis of caged glutamate triggers ATP release
Because extracellular Ca2+ decreases during excitatory transmission (22, 24, 25), we next asked whether the excitatory neurotransmitter glutamate was linked to ATP release and astrocytic Ca2+ signaling. We used UV photolysis of caged glutamate (MNI-glutamate) to trigger an abrupt increase in extracellular glutamate (26, 27) and quantified the effect of MNI-glutamate photolysis on [Ca2+]e with Ca2+-sensitive microelectrodes (Fig. 3A). MNI-glutamate photolysis induced a decrease in [Ca2+]e that peaked at 6.2 ± 1.2 s, showing a time course much slower than that induced by diazo-2 photolysis (compare Figs. 3B and 1B). The MNI-glutamate photolysis–induced decrease in [Ca2+]e was dose-dependent (Fig. 3, B and C) and was paralleled by neuronal depolarization (detected as a deflection of the LFP) (Fig. 3, B and C). Photolysis of MNI-glutamate triggered a widespread decrease in [Ca2+]e, with an average decrease of ~0.4 mM 100 μm from the site targeted by the UV beam and ~0.2 mM at 150 μm (fig. S3). Thus, whereas diazo-2 photolysis induced a rapid local decrease in [Ca2+]e that was not accompanied by neuronal depolarization, photolysis of MNI-glutamate slowly decreased [Ca2+]e over a wide area and triggered neuronal depolarization (Fig. 3, B and C, and fig. S3).
Fig. 3.

Photolysis of MNI-glutamate triggers a decrease in [Ca2+]e and release of ATP. (A) Experimental setup used for measuring bioluminescence and [Ca2+]e after photolysis of MNI-glutamate in hippocampal slices. (B) Representative traces of [Ca2+]e and LFP in response to increasing numbers of UV pulses (1 to 10) in cortical slices. (C) Bar graph comparing changes in [Ca2+]e and LFP (black bars) in response to MNI-glutamate photolysis and increasing the number of 1 to 10 UV pulses. Omission of MNI-glutamate eliminated changes in [Ca2+]e and LFP (n = 5 to 6 photolysis events, P > 0.05). (D) Bioluminescence imaging of ATP release in response to photolysis of MNI-glutamate. Lower panel shows photon emission in response to photolysis in the absence of MNI-glutamate. Scale bars, 100 μm. (E) Bar graph comparing the effect of omitting MNI-glutamate or luciferase on the peak bioluminescence signal evoked by photolysis (n = 12 photolysis events, **P < 0.01).
Bioluminescence imaging revealed that ATP was robustly released from the site targeted by MNI-glutamate, with a delay of 29 ± 4.1 s (n = 5) (Fig. 3D); the UV flash failed to trigger ATP release in the absence of either MNI-glutamate or the luciferin-luciferase mixture (Fig. 3E).
Photolysis of MNI-glutamate evokes two temporally distinct Ca2+ waves
Analysis of hippocampal slices loaded with rhod-2 AM revealed that photolysis of MNI-glutamate triggered a rapid increase in Ca2+ concentration in both neurons and astrocytes (Fig. 4, A and B, and fig. S4). These initial Ca2+ increases included most cells in the field of view and lasted 3.87 ± 1.2 s (n = 22) in neurons [identified by expression of yellow fluorescent protein (YFP) driven by the neuron-specific promoter Thy1] and 17.4 ± 3.0 s (n = 22) in astrocytes [identified by expression of enhanced green fluorescent protein (eGFP) driven by the astrocyte-specific promoter GLT1] (fig. S4). In 62 of 65 experiments, this initial Ca2+ increase was followed by a second, slowly propagating Ca2+ wave (Fig. 4, A and B). The slow Ca2+ wave was initiated 26.3 ± 0.9 s after MNI-glutamate photolysis and propagated with a velocity of 4.0 ± 0.3 μm/s or ~4000-fold slower than the LFP wave. Cytosolic Ca2+ in astrocytes remained increased for a longer duration than during the initial Ca2+ increase (67.2 ± 14 s, n = 20) (fig. S4). Moreover, some astrocytes continued to display oscillatory increases in Ca2+ after the wave had passed. Cytosolic Ca2+ in neurons did not change during the passage of the slow Ca2+ wave, nor did neuronal membrane potential or the LFP signal, indicating that the slow Ca2+ wave only involved astrocytes (Fig. 4B and figs. S2 and S4). Intracellular Ca2+ signals 100 μm from the site of photolysis did not differ in the presence and absence of 1 μM tetrodotoxin (TTX), indicating that the slow wave was TTX-insensitive and did not depend on action potential propagation (P = 0.2, n = 16 to 22, t test).
Fig. 4.

Photolysis of MNI-glutamate evokes an initial fast Ca2+ increase followed by a slowly propagating Ca2+ wave. (A) Serial images of relative changes in Ca2+ (rhod-2) in response to photolysis of caged MNI-glutamate in a hippocampal slice. Hatched circles label the radius 50, 100, and 150 μm from the photolysis site. Two recording electrodes (E1, E2) were placed at different distances from the site of photolysis. Small white arrows indicate astrocytes. Scale bar, 50 μm. (B) Traces of Ca2+ signals in astrocytes located 50, 100, and 150 μm from the site of photolysis. As shown, MNI-glutamate photolysis induced an initial fast increase in Ca2+ that includes most cells in the field followed by a Ca2+ wave that slowly propagates from the site of photolysis. Red lightning bolt indicates the time of photolysis. LFP signals recorded at electrodes E1 and E2. Small black arrows indicate the passage of the second Ca2+ wave. Inset shows enlarged time scale of the depolarization (LFP deflection). Black arrows indicate the initiation of depolarization. (C) Bar graphs compared the amplitude of the increase in intracellular Ca2+ (left panel) and the LFP signal (right panel) in response to MNI-glutamate photolysis in controls and in slices exposed to TBOA (100 μM), APV (50 μM), CNQX (20 μM), APV + CNQX, MPEP (50 μM) + LY367385 (50 μM), or nifedipine (10 μM) (n = 11 to 40 photolysis events, *P < 0.05, **P < 0.01 compared to respective controls). (D) Ca2+ increases in astrocytes during the first and the second Ca2+ wave in control slices and slices exposed to suramin (100 μM), PPADS (30 μM), or Reactive Blue 2 (RB, 30 μM) (n = 16 photolysis events, **P < 0.01 compared to respective controls).
Glutamate-induced neuronal depolarization was required for the initial increase in Ca2+ in both neurons and astrocytes in response to MNI-glutamate photolysis. A glutamate transport inhibitor, dl-threo-β-benzyloxyaspartic acid (TBOA; 100 μM), had little effect on intracellular Ca2+ signals during the initial Ca2+ increase or the slow wave, but increased the amplitude of the radially propagating wave of depolarization detected as an LFP (Fig. 4C). Slices exposed to either the N-methyl-d-aspartic acid (NMDA) receptor antagonist APV[(2R)-amino-5-phosphonovalericacid;(2R)-amino-5-phosphonopentanoate] (50 μM) or the AMPA glutamate receptor antagonist CNQX (6-cyano-7-nitroquinoxaline-2,3-dione) (20 μM) showed a partial decrease in the amplitude of the intracellular Ca2+ signals during both the first and the second Ca2+ waves. The amplitude of the LFP was also significantly reduced, but not eliminated, by addition of either APV or CNQX alone (P < 0.01, Tukey-Kramer), indicating that both NMDA and AMPA receptors contributed to neuronal depolarization (Fig. 4C). Indeed, a combination of both APV and CNQX completely blocked both the initial Ca2+ increase, the slow Ca2+ wave, and changes in the LFP. These observations are consistent with the notion that glutamate-induced neuronal depolarization and Ca2+ influx are required for initiation of both the initial Ca2+ increase and the slow Ca2+ wave. In contrast, inhibition of metabotropic glutamate receptors 1 and 5 (mGluR1/5) with the combination of 2-methyl-6-(phenylethynyl)pyridine (MPEP) and α-methyl-4-carboxyphenylglycine (LY367385) (both 50 μM) significantly reduced Ca2+ increases in astrocytes during the initial fast Ca2+ increase evoked by photolysis of caged glutamate (n = 15, P < 0.01, Tukey-Kramer), but failed to affect the slow Ca2+ wave or the LFP signal (Fig. 4C). This observation shows that activation of mGluR1/5 contributes to the initial Ca2+ increase induced by photolysis of caged glutamate, but that mGluR1/5 do not play a role in initiation or propagation of the slow Ca2+ wave. Nifedipine (10 μM), an inhibitor of L-type voltage-gated Ca2+ channels, had no significant effect on either the initial Ca2+ increase or the slow Ca2+ wave, or on the LFP signal (P > 0.05, Tukey-Kramer). Preliminary analyses of cortical slices indicated that photolysis of MNI-glutamate and diazo-2 induced similar responses in cortical and hippocampal slices (fig. S5).
Together, these observations suggest that photolysis of caged glutamate triggers neuronal depolarization through activation of both NMDA and AMPA receptors, but not voltage-gated Ca2+ channels. Astrocytic Ca2+ signals during the initial Ca2+ increase likely result from a combination of mGluR activation, K+-induced depolarization, and, possibly, other neurotransmitters released as a consequence of the neuronal depolarization induced by photolysis of caged glutamate (28).
The slow Ca2+ wave evoked by MNI-glutamate photolysis requires Cx43/Cx30
Our pharmacological analysis indicated that the initial fast Ca2+ wave evoked by MNI-glutamate photolysis was a result of glutamate receptor activation (Fig. 4C). Moreover, this analysis indicated that NMDA and AMPA receptor–mediated depolarization was required for induction of the slow Ca2+ wave. We next asked how the latter, slow Ca2+ wave propagated, sequentially engaging astrocytes at increasing distances from the site of photolysis. The slow Ca2+ wave did not involve neurons and propagated with a velocity of ~4 μm/s, strongly suggesting the involvement of nonsynaptic pathways. Because bioluminescence imaging indicated that MNI-glutamate photolysis triggered ATP release, we tested the effects of the P2 receptor antagonists suramin, PPADS, and Reactive Blue 2 on wave transmission. Each of these P2 receptor antagonists blocked the slow Ca2+ wave in astrocytes (n = 16, P < 0.01) without suppressing the initial Ca2+ wave in response to photolytic uncaging of glutamate from MNI-glutamate (P > 0.05) (Fig. 4D). These data raise the question of how photolysis of MNI-glutamate might evoke ATP release. Glial cells release ATP through Cx43-type connexin hemichannels (29–31) as well as through pannexin hemichannels, P2X7 receptors, volume-regulated anion channels, and vesicular release (32–35). Because hemichannels open in response to low extracellular Ca2+, we evaluated the effects of deleting astrocytic Cx43. We crossed transgenic mice in which floxed Cx43 was selectively inactivated in astrocytes by Cre recombinase driven by the human glial fibrillary acidic protein (hGFAP) promoter (36), with Cx30 knockout mice, to avoid the compensatory up-regulation of the connexin Cx30 hemichannel previously reported (36). We compared these Cx30−/−Cx43fl/fl:hGFAP-Cre (Cx43/Cx30KO) mice with Cx30−/−Cx43fl/fl (Cx30KO) littermates and found that deletion of Cx43/Cx30 channels essentially eliminated the slow Ca2+ wave without affecting the LFP or the initial Ca2+ increase induced by MNI-glutamate photolysis (n = 14, P < 0.01, Fig. 5, A and C). Similarly, pharmacological blockage of hemichannels by carbenoxolone (CBX, 50 μM) inhibited the slow Ca2+ wave without interfering with either the LFP or the initial Ca2+ increase (n = 14, P < 0.01, Fig. 5C). Deletion of Cx30 alone had no significant effect on either the initial Ca2+ increase (P = 0.82, t test) or the slow Ca2+ wave (P = 0.93, t test) induced by MNI-glutamate photolysis compared to wild-type (C57BL/6) mice, suggesting that Cx30 did not contribute to Ca2+ signaling in wild-type mice.
Fig. 5.

The second Ca2+ wave depends on astrocytic hemichannels and is potentiated by a point mutation that increases the number of open Cx43 hemichannels in astrocytes. (A) Time series of Ca2+ signaling evoked by photolysis of MNI-glutamate in a hippocampal slice prepared from a Cx43/30KO mouse. Hatched circles define the 50-, 100-, and 150-μm radius from the photolysis site. Scale bar, 75 μm. (B) Traces of Ca2+ increases and LFP at 50, 100, and 150 μm in experiment shown in (A). Inset shows enlarged time scale for the depolarization. Black arrows indicate the initiation of depolarization. (C) Comparison of the maximal amplitudes of LFP depolarization (left) and intracellular Ca2+ increases (right) evoked by photolysis of MNI-glutamate in hippocampal slices prepared from Cx30KO or Cx43/30KO mice, or Cx30KO slices treated with CBX (50 μM) (n = 14 to 21 photolysis events, **P < 0.01). (D) Ca2+ signaling evoked by MNI-glutamate photolysis in a hippocampal slice prepared from a Cx43G138R mouse. Small white arrows point to astrocytes. Scale bar, 75 μm. (E) Traces of Ca2+ signals and LFP in experiment shown in (D). (F) Histogram comparing the maximal amplitudes of LFP depolarization (left) and increased intracellular Ca2+ (right) in hippocampal slices prepared from Cx43WT (wild type) or Cx43G138R mice in response to photolysis of MNI-glutamate (n = 14 to 21 photolysis events, *P < 0.05, **P < 0.01). (G) Histograms comparing the maximal radius (n = 28 photolysis events; **P < 0.001 compared to Cx43WT) and durations (n = 5 to 9 photolysis events; **P = 0.004 compared to Cx43WT) of the Ca2+ wave evoked by photolysis of MNI-glutamate.
To determine whether increasing the number of open Cx43 hemichannels would potentiate the slow Ca2+ wave, we analyzed slices from transgenic mice with an astrocyte-targeted point mutation of Cx43 in which glycine 138 is substituted with arginine, Cx43+/G138Rfl:hGFAP-Cre (Cx43G138R). This mutation leads to an increased number of open hemichannels and increased ATP release (37). The delayed slow Ca2+ wave evoked by photolysis of MNI-glutamate was enhanced in slices from Cx43G138R mice (Fig. 5, D and G). For example, the slow Ca2+ wave propagated ~40% further in Cx43G138R slices than in those from littermate controls, with Cx43+/G138Rfl (Cx43WT) reaching a maximal radius of 214 ± 2.7 μm (n = 28, P < 0.001). The duration of the Ca2+ increase in Cx43G138R mice was also significantly higher than in littermate controls (157.8 ± 19.8 s compared with 75.4 ± 15.0 s, n = 5 to 9, P = 0.004, t test). Neither MNI-glutamate–induced depolarization nor the initial Ca2+ increase differed in slices from Cx43G138R mice compared to those of littermate controls (Cx43WT), indicating that glutamatergic transmission was unaffected by the point mutation of astrocytic Cx43 (Fig. 5F).
Thus, release of ATP in response to photolysis of MNI-glutamate was suppressed when Cx43/Cx30 was deleted, as well as in the presence of channel blockers. Conversely, the slow Ca2+ wave was enhanced in mice with an increased number of open Cx43 hemichannels. Together, these observations support the notion that astrocytes initiate the slow Ca2+ wave through release of ATP and that Cx43 hemichannels play an important role in ATP release evoked by reducing [Ca2+]e. A comparison of the Ca2+ wave evoked by photolysis of diazo-2 and the slow MNI-glutamate wave showed that the two were similar. The only difference we identified was that the delay between photolysis and the initial increase in intracellular Ca2+ was significantly shorter after diazo-2 photolysis than after that of MNI-glutamate (fig. S6; P = 0.015, t test).
High-frequency stimulation triggers ATP release and astrocytic Ca2+ signaling
MNI-glutamate photolysis noninvasively triggers a localized increase in extracellular glutamate at a designated location; however, photolysis does not replicate physiological stimulation. The question therefore arises as to whether the observations we have reported thus far have physiological relevance. Can glutamatergic signaling initiate a decrease in extracellular Ca2+ sufficient to open Cx hemichannels and trigger ATP release? To address these questions in a more physiological context, we assessed the effects of high-frequency stimulation (HFS), which elicits ATP release and astrocytic Ca2+ signaling (12, 38), in hippocampal slices. Delivery of several trains of HFS is an experimental paradigm frequently used to trigger hippocampal LTP (39), a widely accepted model of learning and memory. HFS consistently elicited a decrease in [Ca2+]e comparable to that evoked by photolysis of diazo-2 or MNI-glutamate (Fig. 6A). Addition of antagonists to NMDA receptors (APV, 50 μM) and AMPA receptors (CNQX, 20 μM) attenuated both the stimulation-induced decrease in [Ca2+]e and the negative deflection in LFP signal (Fig. 6B). The HFS-mediated decrease in [Ca2+]e depended on the total number of pulses delivered, and the decrease in [Ca2+]e was partially suppressed by application of APV and CNQX [100 pulses, −0.33 ± 0.05 mM versus −0.19 ± 0.04 mM in the presence of APV and CNQX; 200 pulses, −0.42 ± 0.08 mM versus −0.24 ± 0.03 mM in the presence of APV and CNQX, P < 0.01; two-way analysis of variance (ANOVA) with Tukey-Kramer, n = 5 to 6] (Fig. 6C). HFS was also associated with release of ATP as previously reported (Fig. 6D) (38). Moreover, HFS evoked two temporally distinct Ca2+ waves: An initial increase in Ca2+ that occurred during HFS was followed by a delayed slow Ca2+ wave (Fig. 6E). This slow Ca2+ wave propagated from the site of the stimulus electrode with a velocity of 4.1 ± 0.3 μm/s (n = 6). APV and CNQX reduced the amplitude of the intracellular Ca2+ signals during the initial response to HFS and nearly eliminated the slow Ca2+ wave (Fig. 6G).
Fig. 6.

High-frequency stimulation triggers a decrease in [Ca2+]e and stimulates the release of ATP and a slowly propagating Ca2+ wave. (A) Representative traces of [Ca2+]e and LFP evokedby an increasing number of stimulating pulses (10 to 200) in hippocampal slices. Lower trace shows expanded time scale for the stimulation. Rapid downward and upward peaks (indicated by arrows)before the slower downward evoked EPSPs represent stimulus artifacts. (B) Representative traces of [Ca2+]e and LFP evoked by increasing number of stimulating pulses (10 to 200) in the presence of 50 μM APV and 20 μM CNQX. (C) Bar graph comparing changes in [Ca2+]e in response to HFS in the absence or presence of APV and CNQX (n = 5 to 6 HFS events; *P < 0.05, **P < 0.01 compared to 0 pulse; #P < 0.05, ## P < 0.01 between vehicle and APV/CNQX). (D) Bioluminescence imaging of ATP release in response toHFS (200 pulses). White dotted lines indicate the position of stimulation electrode. Scale bar, 50 μm. (E) Time series of astrocytic Ca2+ (rhod-2) in response to HFS. Hatched circles indicate the radius 50 and 100 μm from the photolysis site. Traces on the right display Ca2+ changes in individual cells 50, 100, and 150 μm from the site of diazo-2 photolysis in the same experiment. Small white arrowheads indicate astrocytes. Scale bar, 50 μm. (F) Time series of astrocytic Ca2+ in response to HFS in the presence of APV and CNQX. (G) Comparison of Ca2+ responses and LFP changes in the presence of vehicle (control) or APV and CNQX (n = 16 to 20 for Ca2+ responses, n = 5 to 6 for LFP HFS events; **P < 0.001 between vehicle and APV/CNQX).
Together, our data indicate that HFS, like MNI-glutamate photolysis, induces a transient decrease in [Ca2+]e and also stimulates ATP release and a pattern of astrocytic Ca2+ signaling that is similar to that seen with MNI-glutamate photolysis. HFS and MNI-glutamate photolysis both induced an initial widespread increase in Ca2+, followed by a slow wave that sequentially engaged astrocytes located at increasing distance from the site of photolysis or the stimulus electrode. Inhibitors of NMDA and AMPA receptors effectively reduced the astrocytic Ca2+ response to photolysis of either MNI-glutamate or HFS.
Diazo-2 photolysis enhances the frequency of spontaneous IPSCs in a P2Y1 receptor–mediated pathway
Previous studies had shown that interneurons bearing P2Y1 receptors depolarize and fire action potentials in response to ATP and adenosine diphosphate (ADP) (12, 13). To determine whether diazo-2 photolysis–induced ATP release could activate interneuronal P2Y1 receptors and thereby modulate hippocampal network activity, we recorded from interneurons located in the stratum radiatum at a distance of 40 to 80 μm from the photolysis site (Fig. 7A). In these experiments, we visualized the impaled interneurons by adding Alexa Fluor 488 to the pipette solution, whereas Ca2+ signaling in astrocytes was visualized by rhod-2 AM loading (Fig. 7A). Diazo-2 photolysis triggered membrane depolarization in 17 of 25 interneurons tested, with a delay of 13.2 ± 2.7 s. Among the 17 interneurons that depolarized by more than 2 mV, 8 generated action potentials (Fig. 7, B and C). Diazo-2 photolysis–mediated depolarization was unaffected by TTX (1 μM), indicating that interneuronal depolarization was not a result of synaptic activity (amplitude, P = 0.34; delay, P = 0.10; duration, P = 0.98, P = 5 to 8) (Fig. 7, B and C). However, the P2Y1 receptor antagonist MRS2179 (50 μM) reduced membrane depolarization (from 11.6 ± 3.3 to 4.4 ± 1.8 mV, P < 0.05, t test, n = 5) and eliminated action potential firing (fig. S7). Conversely, application of the P2Y1 receptor agonist 2-methylthio-ADP (2MeSADP) elicited depolarization and interneuronal spiking at 3.1 ± 0.3 Hz, as did diazo-2 (2.8 ± 0.8 Hz, P = 0.86), consistent with the earlier finding that 2MeSADP induces depolarization of hippocampal interneurons (12, 13) (fig. S7).
Fig. 7.

Diazo-2 photolysis evokes interneuronal depolarization and bursting. (A) Experimental setup used for photolysis of diazo-2 combined with whole-cell recordings of interneurons located ~40 to 80 μm from the site targeted by the UV beam in hippocampal slices. Time series images of the slow Ca2+ wave evoked by photolysis of diazo-2. The pipette contained Alexa Fluor 488 (green) to visualize the impaled interneuron. Small white arrows point to astrocytes. Hatched circles define the radius 50, 100, and 150 μm from the photolysis site. Scale bar, 50 μm. (B) Representative recordings of interneurons (current clamp) in response to diazo-2 photolysis without (left panel) or with TTX (1 μM, right panel). Of a total of 25 recordings, 17 interneurons exhibited a transient depolarization (membrane potential shift >2 mV), and 8 of these cells exhibited spiking activity. In the presence of TTX, 12 of a total of 18 interneurons exhibited a transient depolarization (>2 mV), whereas the remaining 6 failed to respond to diazo-2 photolysis. (C) Comparison of the amplitude, delay, and duration of diazo-2–induced depolarization in the presence and absence of TTX (n = 6 to 8 photolysis events, P > 0.05). (D) Representative traces of recordings in a CA1 pyramidal neuron (current clamp) located ~40 to 80 μm from diazo-2 photolysis site. Enlarged time scales for the indicated periods are shown below. (E) Changes in the frequency of IPSCs induced by diazo-2 photolysis plotted as a function of time before or after diazo-2 photolysis (n = 5 photolysis events, **P < 0.01). Inset: Bicuculline reduced the frequency of IPSCs during baseline conditions (20 mM n = 9 slices, **P < 0.01). (F) Comparison of the effect of photolysis of diazo-2 on IPSC frequency during control conditions (10 to 50 s), after addition of the P2Y1 receptor antagonist MRS2179 (50 μM), or in slices from mice lacking Cx43 and Cx30 (Cx43/30KO) (n = 9 slices, **P < 0.01). (G) Proposed model for [Ca2+]e as a mediator of neuron-glia signaling. Glutamatergic signaling (or MNI photolysis) triggers Ca2+ influx into neurons through AMPA- or NMDA-type glutamate, leading to a localized decrease in [Ca2+]e. Connexin hemichannels in astrocytes open in response to low [Ca2+]e, enabling the efflux of ATP. ATP triggers two events: (i) ATP activates slowly propagating Ca2+ waves in astrocytes by binding to astrocytic P2YR1, P2YR2, and P2YR4; (ii) ATP is degraded to ADP, and in turn, ADP activates interneuronal P2Y1 receptors, stimulating the depolarization and increased firing of a subpopulation of interneurons. This mode of neuron-glia signaling may act as a negative feedback mechanism to increase inhibitory transmission during excessive glutamatergic activity.
In contrast to interneurons, hippocampal CA1 neurons were largely insensitive to diazo-2 photolysis (fig. S2). The decrease in [Ca2+]e evoked by diazo-2 photolysis did not alter the membrane potential or the input resistance of CA1 pyramidal neurons located within 40 to 80 μm of the photolysis site (fig. S2). However, we detected a transient increase in the frequency of spontaneous IPSCs in CA1 neurons after diazo-2 photolysis (P < 0.01, n = 5, Fig. 7, D and E). The increase in inhibitory transmission peaked 10 to 40 s after photolysis (Fig. 7, D and E), at a point in time in which [Ca2+]e had returned to resting concentrations (Fig. 1B) but coinciding with the release of ATP (Fig. 2, A and B) and interneuronal depolarization (Fig. 7, B and C). We speculated that P2Y1 receptor activation of interneurons was responsible for this transient increase in spontaneous IPSCs. This hypothesis was supported by the observation that the P2Y1 receptor antagonist MRS2179 significantly reduced the increase in IPSC frequency produced by diazo-2 photolysis (P < 0.01, Tukey-Kramer, Fig. 7F). Moreover, slices from Cx43/30KO mice also failed to show an increase in the frequency of IPSC after diazo-2 photolysis (Fig. 7F). The Ca2+ waves in astrocytes were not significantly reduced by MRS2179 (P = 0.42, t test, n = 8), likely reflecting that astrocytes contain ATP-activated P2Y receptors besides P2Y1, including P2Y2, P2Y4, and possibly others (12, 30). Whereas a delayed enhancement of inhibitory transmission (Fig. 7, D and E) occurred when [Ca2+]e had returned to resting levels after photolysis of diazo-2 (Fig. 2, A and B), the frequency of spontaneous EPSPs and spontaneous IPSCs did not change significantly immediately after diazo-2 photolysis or during the period when [Ca2+]e remained low (fig. S1E). Combined, these data suggest that ATP released from astrocytes in response to low [Ca2+]e activates interneuronal P2Y1 receptors and increases the frequency of spontaneous IPSCs. Thus, the net effect on network activity of decreased [Ca2+ ]e is strengthening of inhibitory transmission. Because spontaneous fluctuations of [Ca2+]e are driven by glutamatergic transmission, astrocytic release of ATP may act as a negative feedback mechanism to increase local inhibition in response to sustained regional excitation (Fig. 7G).
DISCUSSION
Here, we used photolysis of caged compounds to investigate the possible role of activity-associated interstitial hypocalcemia on neuron-glial interactions in the rodent hippocampus and neocortex. We found that signaling from neurons to astrocytes could be mediated through means other than neurotransmitter release. In particular, we found that synaptic activity triggered astrocytic Ca2+ signaling by lowering of [Ca2+]e. It has been known for decades that [Ca2+]e decreases during neuronal activity and that glutamate release is linked to transient decreases in [Ca2+]e (5, 6). Glutamatergic transmission triggers an influx of Ca2+ through ionotropic glutamate receptors (specifically the AMPA- and NMDA-type receptors), as well as through voltage-gated Ca2+ channels, resulting in a transient decrease in [Ca2+]e. The [Ca2+]e can thus be regarded as an integrator of the intensity of excitatory transmission. Our observations suggest that astrocytes can sense decreases in [Ca2+]e and that a transient drop in [Ca2+]e can trigger the opening of astrocytic hemichannels and ATP efflux therefrom. The resultant burst of extracellular ATP then triggers an increase in cytosolic Ca2+ in the surrounding astrocytes through the activation of metabotropic P2Y receptors (Fig. 7G).
Another concept suggested by our data is that ATP released in response to excessive glutamate release can increase the firing rate of inhibitory interneurons in a P2Y1 receptor–mediated pathway. Thus, the astrocytic release of ATP can potentially enhance inhibitory transmission in response to local excitation and thereby act as a brake on network excitatory output (Fig. 7G). We observed that slow astrocytic Ca2+ signaling triggered by a reduction in [Ca2+]e was insensitive to mGluR antagonists, an observation notable in that synaptic glutamate release is currently thought to represent the primary mechanism of neuro-glial signaling (11).
Ca2+’s role as an intracellular signaling moiety depends on the maintenance of low intracellular Ca2+. This low tonic level of free cytosolic Ca2+ is maintained by a number of means, which include both Ca2+ buffers and Ca2+ transporters. These homeostatic mechanisms maintain the ability of Ca2+ fluxes across the plasma membrane to provide signals, as well as the cell’s ability to rapidly mobilize Ca2+ from intracellular stores (40, 41). However, the importance of Ca2+ as an intracellular messenger has overshadowed the possible functions of transient decreases in [Ca2+]e. Outside of the CNS, [Ca2+]e is tightly controlled within the range of 1.1 to 1.4 mM by the actions of parathyroid hormone, which is the secreted product of chief cells of the parathyroid gland (42). Chief cells contain Ca2+-sensitive receptors (CaSRs), which sense minor changes in [Ca2+]e, to regulate the release of parathyroid hormone. In turn, parathyroid hormone regulates Ca2+ homeostasis by controlling reabsorption of renal and bone Ca2+. Although CaSRs are found in subpopulations of neurons and oligodendrocytes, multiple studies have failed to confirm that CaSR contributes to extracellular Ca2+ homeostasis in the CNS (43, 44).
Our observations suggest instead that Cx hemichannels are key to astrocytic detection of decreased [Ca2+]e. Multiple lines of evidence indicate that hemichannels open in response to decreased [Ca2+]e. For example, low [Ca2+]e mediates Cx-dependent uptake or release of compounds of less than 1.2 kD (7, 45–47), elicits the release of ATP and glutamate from astrocytes (30, 48), and decreases plasma membrane input resistance (45). An atomic force microscopy analysis showed that the inner pore of Cx43 is either in an open (2.5 nm diameter) or in a closed (1.8 nm diameter) state and that the open probability of the pore is strongly dependent on [Ca2+]e over a range of 1.0 to 1.8 mM (49). However, the physiological importance of this signaling pathway has not been determined. Here, we provide support for the notion that opening of hemichannels in response to decreased [Ca2+]e may provide a negative feedback mechanism during glutamatergic transmission, with ATP efflux through open hemichannels increasing the strength of inhibitory transmission by activation of interneuronal P2Y1 receptors.
Our recordings of [Ca2+] indicate that decreases in [Ca2+]e in the range of 0.4 to 0.6 mM are required to trigger ATP release and astrocytic Ca2+ signaling. Indeed, photolysis of diazo-2 or of MNI-glutamate, as well as HFS, all triggered decreases in [Ca2+]e within the same range (compare Figs. 1, 3, and 6). Comparable decreases in [Ca2+]e have been noted during epileptic activity (50), whereas ischemia and hypoxia have both been linked to more profound falls in [Ca2+]e (~1 mM); concentrations as low as 0.07 to 0.08 mM have been recorded during spreading depression and anoxia (51, 52). This indicates that the neuron to glia signaling pathway described here is active during seizure activity and during hypoxic events, but that additional studies are required to establish its possible physiological role and relative importance. Given our limited ability to monitor parenchymal Ca2+ in real time, it remains unclear how much [Ca2+]e declines during physiological activity (53). Although ion-selective microelectrodes accurately detect Ca2+, their large size prevents detection of the decline in [Ca2+]e that has been predicted to occur within the synaptic cleft during synaptic transmission (3, 51, 54). Thus, current technology does not enable us to determine whether a decline in [Ca2+]e plays a role in astrocytic Ca2+ signaling during physiological condition. It is in this regard of interest that slowly expanding Ca2+ waves have been observed during normal activity in the adult cerebellum. These waves are associated with the spontaneous release of ATP and spread to a maximum diameter of ~80 μm (55, 56). The trigger for these slow cerebellar waves remains unknown; however, climbing fibers provide powerful, excitatory inputs to Purkinje cells, and these synapses are extensively invested by Bergmann glial processes (57). Like astrocytes, Bergmann glial cells throughout the CNS contain abundant Cx43/Cx30 (58). Therefore, one may reasonably postulate that the complex spikes generated by climbing fibers could reduce [Ca2+]e below the opening threshold of Cx43 hemichannels present in perisynaptic glial processes, thereby initiating Ca2+ signaling hemichannel-mediated efflux of ATP.
The possible role of P2Y1 receptors in feed-forward inhibition is of particular interest (12, 13). We found that the decline in [Ca2+]e after glutamate-induced neuronal depolarization triggered ATP release. P2Y1 receptor activation then depolarized nearby interneurons, resulting in a transient increase in the frequency of IPSCs. Two groups have described the effect of P2Y1 receptor activation in hippocampal interneurons (12, 13). Their analyses suggest that P2Y1R-evoked depolarization may depend on the opening of nonselective cation channels, in combination with closure of K+ channels (12). Interneuronal depolarization in response to P2Y1 receptor stimulation in slices from mice lacking P2Y1 receptors (13), and nonselective cation conductance was inhibited by Cd2+ (12). This analysis also showed that P2Y1 receptor–mediated interneuronal depolarization did not require guanosine triphosphate (GTP)–binding protein (G protein)–mediated signaling, phospholipase C, or mobilization of intracellular Ca2+ stores (12, 13). Rather, P2Y1 receptors may couple directly to nonselective cation channels, such that receptor activation may transiently increase channel opening, resulting in interneuronal depolarization. This conclusion is consistent with detailed heterologous expression studies, which suggest that P2Y1 receptors directly interact with ion channels; for example, Xenopus oocytes expressing recombinant P2Y1 receptors display a cation current that did not involve G proteins (12, 59–61).
Together, our experiments suggest that the decreases in [Ca2+]e that occur during glutamatergic transmission result in the opening of astrocytic connexin hemichannels, and thereby astrocytic ATP release. In turn, interstitial ATP triggers the depolarization of nearby interneurons in a P2Y1 receptor–dependent pathway. As ATP diffuses away from the site of release, the net effect is a strengthening of inhibitory transmission both within and surrounding a hyperexcited or epileptic focus. These observations suggest that ATP released from astrocytes may contribute to surround inhibition within synaptically active regions of both the mammalian neocortex and the hippocampus. Hence, P2Y1 receptor agonists may constitute a new target for antiepileptic drugs.
MATERIALS AND METHODS
Transgenic mice
Conditional deletion of Cx43 in astrocytes was achieved through the inactivation of floxed Cx43 by Cre recombinase, the expression of which is driven by the hGFAP promoter as previously described (36). Because Cx43 deletion is partly compensated for by up-regulation of Cx30, we used transgenic mice lacking both Cx43 and Cx30 (62). In all experiments, we compared Cx30−/−Cx43fl/fl and Cx30−/−Cx43fl/fl:hGFAP-Cre littermates (62). The G138R point mutation of Cx43 has been associated with oculodentodigital dysplasia, and hemichannels with this mutation exhibit increased opening (37). We generated mice with astrocytic expression of the G138R mutation by crossing the hGFAP-cre mice from Jackson Laboratory with Cx43+/G138Rfl mice. hGFAP-Cre negative mice from the same litter were used as controls. The reporter mice used to identify hippocampal CA1 neurons were Thy1-YFP mice obtained from Jackson Laboratory, whereas astrocytes were identified on the basis of eGFP expression under the glutamate transporter in GLT1-eGFP mice (63). All animal experiments were conducted in accordance with the guidelines of the Animal Care and Use Committee of the University of Rochester.
Slice preparation and electrophysiology
All slice experiments used 15- to 21-day-old C57BL/6 mouse pups (Charles River) or transgenic mouse lines described above. The pups were anesthetized in a closed chamber with isoflurane (1.5%) and decapitated. Their brains were rapidly removed and immersed in an ice-cold cutting solution containing 230 mM sucrose, 2.5 mM KCl, 0.5 mM CaCl2, 10 mM MgSO4, 26 mM NaHCO3, 1.25 mM NaH2PO4, and 10 mM glucose and saturated with 95% O2 and 5% CO2. Coronal slices (300 μm) were cut with a Vibratome (Vibratome Company) and transferred to oxygenated artificial cerebrospinal fluid (aCSF) that contained 126 mM NaCl, 2.5 mM KCl, 2 mM CaCl2, 1 mM MgCl2, 26 mM NaHCO3, 1.25 mM NaH2PO4, and 10 mM glucose. Slices were incubated in aCSF for 1 to 5 hours at room temperature before recording (33, 64). During the recordings, the slices were placed in a perfusion chamber and superfused with aCSF gassed with 5% CO2 and 95% O2 at room temperature. Cells were visualized with a 40× water-immersion objective and differential interference contrast optics (BX51 upright microscope, Olympus Optical). Patch electrodes were fabricated from filament thin-wall glass (World Precision Instruments) on a vertical puller. Membrane potentials were recorded under current clamp with an Axopatch MultiClamp 700B amplifier (Axon Instruments). No currents were injected (I = 0), unless indicated. The pipette solution contained 140 mM potassium gluconate, 5 mM sodium phosphocreatine, 2 mM MgCl2, 10 mM Hepes, 4 mM Mg-ATP, and 0.3 mM Na-GTP (pH adjusted to 7.2 with KOH). Input resistance was measured by delivery of current steps of 50 to 200 pA every 2000 ms and presented as percent of voltage changes relative to baseline before stimulation. Spontaneous IPSCs were recorded in voltage clamp configuration, clamping the membrane potential at −60 mV and using a pipette solution that contained 140 mM CsCl, 2 mM MgCl2, 10 mM Hepes, 2 mM EGTA, 5 mM lidocaine N-ethyl chloride (QX314), 5 mM sodium phosphocreatine, 4 mM Mg-ATP, and 0.3 mM GTP (pH 7.2 with CsOH). Alexa Fluor 488 (100 μM) was added to the pipette solution in both recording configurations to visualize the impaled cells. The junction potential between the patch pipette and the bath solution was zeroed before formation of the gigaseal. Patches with seal resistances of less than 1 gigohm were rejected. Experiments were performed at room temperature (21°C to 23°C). Data were low-pass filtered at 2 kHz and digitized at 10 kHz with a Digidata 1440 interface controlled by pCLAMP Software (Molecular Devices). HFS (100 μs; 150 μA, 100 Hz, 10 to 200 pulses) was delivered through a constant isolated current source (an ISO-Flex isolator with a Master-8-vp stimulator; AMPI) at 100 Hz with a concentric bipolar electrode (FHC) placed in a distance of 75 μm from the Ca2+-sensitive electrode.
Fabrication and calibration of Ca2+-sensitive microelectrodes
To detect Ca2+ changes in the extracellular space, we fabricated ionsensitive microelectrodes from double-barreled pipette glass (PB150F-6, WPI) pulled to a tip of <3 μm (Sutter P-97). The pipette was silanised by dimethylsilane (Fluka, Sigma) loaded with a 100- to 150-μm column of Ca2+ ion-exchanger resin (Ca2+ ionophore 1, cocktail A, Fluka, Sigma) and backfilled with 100 mM CaCl2. The reference barrel was filled with Hepes-buffered 150 mM NaCl solution (pH 7.4). In select experiments, single barreled ion-selective electrodes were used in combination with a reference electrode located <10 μm away. The pipette was connected to the headstage of an Axoprobe 700B amplifier (Axon instruments). Electrodes were calibrated in 1 to 3 mM Ca2+ in aCSF before and after experiments. The recording pipette was located ~50 to 100 μm below the surface of the slice. Electrodes used in experiments typically displayed voltage responses of 5 to 10 mV per 1 mM increase in Ca2+ in the concentration range studied.
Two-photon laser scanning microscopy, MNI-glutamate and diazo-2 photolysis, and bioluminescence imaging
Slices were loaded with the Ca2+ indicator rhod-2 AM (10 μM, 1 hour; Invitrogen) for 45 to 60 min before imaging. A custom-built microscope attached to a Tsunami/Millennium laser (SpectraPhysics) and a scanning box (FV300, Olympus) using Fluoview software was for two-photon laser scanning microscopy. Most experiments used a 40× water-immersion objective [0.9 numerical aperture (NA), Olympus]. Excitation wavelength was in the range of 820 to 840 nm. Two-channel detection of emission wavelength was achieved with a 565-nm dichroic mirror and two external photomultiplier tubes. A 525/50 band-pass filter was used to detect Alexa Fluor 488, eGFP, and YFP, and a 620/60 band-pass filter was used to detect rhod-2 emission wavelengths (Chroma Technology). To uncage MNI-glutamate (250 to 350 μM) or diazo-2 (140 to 280 μM), we focused a 355-nm continuous laser (diode-pumped solid state) controlled by a mechanical shutter (Uniblitz, Vincent Associate) through the objective lens to an optical spot of ~4 μm diameter at the tissue. Photolysis of MNI-glutamate and diazo-2 was triggered by a train of 1 × 10 to 10 × 10 ms (interval, 50 ms) laser pulses. Because each batch of MNI-glutamate and diazo-2 showed slightly different sensitivity to UV excitation, we determined the number of pulses (typically four to eight) of UV light used for stimulation for each batch and then used the same number of UV pulses for all remaining experiments with that batch. UV laser intensity was less than 3.5 mW after passing through the 40× objective. In all experiments, we included controls to test whether similar stimulation triggered Ca2+ signaling or detectable changes in the electrophysiological characteristics of neurons in the absence of MNI-glutamate or diazo-2. All imaging files were analyzed with Fluoview software and values are presented as percent rhod-2 fluorescence increase from baseline fluorescence (ΔF/F). The average intensity of 15 frames was used as a baseline to calculate relative changes in rhod-2 signal. Experiments were not used if baselines rhod-2 values showed more than 5% variability.
For bioluminescence imaging, we added firefly luciferase (40 μg/ml, Sigma) and d-luciferin sodium salt (100 μg/ml, Sigma) to aCSF and imaged photon production by a liquid nitrogen–cooled charged-coupled device camera (VersArray 1300B, Princeton Instruments) with a 40× waterimmersion objective (NA 0.9), 5 × 5 binning, and 5-s integration per frame (9, 20).
Chemicals
APV, CNQX, LY367385, MPEP, suramin hexasodium salt, PPADS, MNI-glutamate, QX 314 chloride, and MRS2179 tetrasodium salt, TBOA were from Tocris Cookson. Rhod-2 AM, pluronic acid F-127, glycine, and diazo-2 were from Invitrogen. Reactive Blue 2, 2MeSADP, TTX, and all other chemicals used to prepare aCSF and slice cutting solution were from Sigma (62).
Statistics
All bar graphs are shown as means ± SEM. One-way or two-way ANOVA with Tukey-Kramer post hoc test was used to determine statistical significance. When only two groups were compared, Student’s t test was used. Shapiro-Wilk test was used for testing the normality of the data. Repeatedmeasures ANOVA was used where appropriate.
Supplementary Material
Fig. S1. Calibration of Ca2+-sensitive microelectrode and effects of diazo-2 photolysis on [Ca2+]e (A) Representative trace of calibration of a Ca2+-sensitive microelectrode. Extracellular Ca2+ in the bath was successively increased from 1, to 2, to 3 mM Ca2+ in aCSF. (B) Calibration of Ca2+ sensitive microelectrodes in aCSF (n=3 microelectodes, r2=0.986). The electrodes used in experiments typically showed voltage responses of 5-10 mV per mM increase in Ca2+ concentration in the concentration range studied. Electrode calibration was done before and after each experiment. (C) Duration of diazo-2-induced decrease in [Ca2+]e plotted as a function of stimulus intensity (n=3 photolysis events, UV pulses 1-10, and 10 pulses without diazo-2, **, p<0.01). (D) Diagram showing recordings obtained by placing the electrode at increasing distances from the photolysis site. Diazo-2-induced reduction in [Ca2+]e detected with the Ca2+-sensitive microelectrode placed 50, 100, or 150 μm from the site targeted by photolysis. (n=8 photolysis events, **, p<0.01 compared to 50 μm). (E) Traces show representative recordings of spontaneous EPSPs and IPSCs in hippocampal CA1 neurons. Bar histograms compare the frequency and amplitude of EPSPs and IPSCs 5 s before or 5 s after photolysis (no significant differences in EPSP or IPSC frequency and amplitude was identified using paired t-test, before vs. after, p>0.05, n = 7).
Fig. S2. CA1 pyramidal neurons depolarize and decrease their input resistance in response to photolysis of MNI-glutamate, whereas photolysis of diazo-2 is not associated with changes in the membrane properties (A) Representative current-clamp recordings from a hippocampal CA1 pyramidal cell located ~70 μm from the site of photolysis of diazo-2 (left panel) or MNI-glutamate (right panel). Lower traces show expanded timescale. (B) Comparison of changes in plasma membrane potential in response to photolysis of diazo-2 and MNI-glutamate in CA1 pyramidal neurons (n=4-11 photolysis events, **, p<0.001). (C) Comparison of relative changes in input resistance in response to photolysis of diazo-2 and MNI-glutamate in CA1 pyramidal neurons (n=4-5 photolysis events, **, p<0.001).
Fig. S3. Photolysis of MNI-glutamate (A) Duration of the decrease in [Ca2+]e produced by photolysis of MNI-glutamate plotted as a function of number of UV pulses used for photolysis (n=5 photolysis events, **, p<0.01). (B) Diagram of recordings obtained by placing the electrode at increasing distances from the photolysis site. MNI-glutamate-induced reduction in [Ca2+]e detected with the Ca2+-sensitive microelectrode placed 50, 100, or 150 μm from the site targeted by photolysis (n=4-15 photolysis events. *, p<0.05 compared to 50 μm). If MNI-glutamate was omitted, UV pulses failed to decrease [Ca2+]e.
Fig. S4. Transgenic reporter mice reveal distinct responses to MNI-glutamate photolysis of neurons and astrocytes in hippocampal slices (A) Hippocampal slice from a Thy1-YFP reporter mouse loaded with the Ca2+ indicator rhod-2 am. YFP+ neurons show an increase in Ca2+ during the 1st, but not the 2nd Ca2+ wave. Scale bar, 50 μm. (B) Hippocampal slice from a GLT1-GFP reporter mouse loaded with the Ca2+ indicator rhod-2 am. GFP+ astrocytes show an increase in Ca2+ during both the 1st and the 2nd Ca2+ waves. Scale bar, 50 μm. (C) Duration of the increase in Ca2+ in astrocytes and neurons during the 1st and the 2nd Ca2+ wave (n=12-13 photolysis events, *, p<0.05, **, p<0.01). (D) The amplitude of the increases in Ca2+ in astrocytes or neurons during the 1st or the 2nd Ca2+ wave (n=10 photolysis events, **, p<0.01).
Fig. S5. Comparison of Ca2+ waves in hippocampus and cortex evoked by photolysis of MNI-glutamate or diazo-2 (A) Comparison of Ca2+ increases in astrocytes during the 2nd Ca2+ wave evoked by photolysis of MNI-glutamate and the Ca2+ wave evoked by photolysis of diazo-2 at 50, 100, and 150 μm in cortex and hippocampus (n=9 photolysis events, p>0.05). (B) Comparison of maximal radius of the Ca2 waves in astrocytes evoked by photolysis of MNI-glutamate and diazo-2 in cortex and hippocampus (n=10 photolysis events, p>0.05).
Fig. S6. Comparison of Ca2+ waves evoked by diazo-2 or MNI-glutamate photolysis All comparisons are made between Ca2+ waves evoked by diazo-2 photolysis and the 2nd Ca2+ wave evoked by MNI-glutamate. (A) Histogram comparing the delay between photolysis and the first increase in Ca2+ evoked by diazo-2 or MNI-glutamate photolysis (n=20-22 photolysis events, *, p<0.05). (B) Ca2+ increase at 75 μm evoked by diazo-2 or MNI-glutamate photolysis (n=16 photolysis events). (C) Radius of Ca2+ waves evoked by diazo-2 or MNI-glutamate photolysis (n=26 photolysis events). (D) Velocity of Ca2+ waves evoked by diazo-2 or MNI-glutamate photolysis (n=18 photolysis events). (E) Duration of Ca2+ increases in astrocytes evoked by diazo-2 or MNI-glutamate photolysis (n=12 photolysis events).
Fig. S7. Effect of manipulation of P2Y1 receptors in hippocampal interneurons (A) The P2Y1 receptor antagonist, MRS2179 (50 μM) blocked depolarization and bursting activity induced by diazo-2 photolysis in 4 of 5 interneurons. One of the five interneurons exhibited a transient minor depolarization, but no action potential firing. (B) Exposure to the P2Y1 receptor agonist 2MeSADP (100 μM) induced depolarization in a total of 8 interneurons tested, whereof 3 exhibited bursting activity. (C) Histograms compare the frequency of interneuronal action potential firing, as well as the amplitude of membrane depolarization induced by photolysis of diazo-2 with or without exposure to 2MeSADP (n = 6-8 photolysis events).
Acknowledgments
We thank D. Rusakov, D. Yule, and S. Goldman for valuable comments. Funding: This work was supported by the National Institute of Neurological Disorders and Stroke/NIH and by the German Research Association SFB 645,B2 for work in the Bonn laboratory.
Footnotes
Author contributions: A.T., Q.X., and F.W. performed the experiments and analyzed the data. R.D. and K.W. generated the transgenic mice. A.T. and M.N. designed the experiments. A.T., F.W., T.F., T.T., and M.N. wrote the paper.
Competing interests: The authors declare that they have no competing interests.
SUPPLEMENTARY MATERIALS www.sciencesignaling.org/cgi/content/full/5/208/ra8/DC1
REFERENCES AND NOTES
- 1.Berridge MJ, Bootman MD, Lipp P. Calcium—A life and death signal. Nature. 1998;395:645–648. doi: 10.1038/27094. [DOI] [PubMed] [Google Scholar]
- 2.Connor JA, Petrozzino J, Pozzo-Miller LD, Otani S. Calcium signals in long-term potentiation and long-term depression. Can. J. Physiol. Pharmacol. 1999;77:722–734. [PubMed] [Google Scholar]
- 3.Hofer AM, Brown EM. Extracellular calcium sensing and signalling. Nat. Rev. Mol. Cell Biol. 2003;4:530–538. doi: 10.1038/nrm1154. [DOI] [PubMed] [Google Scholar]
- 4.Hofer AM, Curci S, Doble MA, Brown EM, Soybel DI. Intercellular communication mediated by the extracellular calcium-sensing receptor. Nat. Cell Biol. 2000;2:392–398. doi: 10.1038/35017020. [DOI] [PubMed] [Google Scholar]
- 5.Hansen AJ, Nedergaard M. Brain ion homeostasis in cerebral ischemia. Neurochem. Pathol. 1988;9:195–209. doi: 10.1007/BF03160362. [DOI] [PubMed] [Google Scholar]
- 6.Berridge MJ. Neuronal calcium signaling. Neuron. 1998;21:13–26. doi: 10.1016/s0896-6273(00)80510-3. [DOI] [PubMed] [Google Scholar]
- 7.Stout C, Charles A. Modulation of intercellular calcium signaling in astrocytes by extracellular calcium and magnesium. Glia. 2003;43:265–273. doi: 10.1002/glia.10257. [DOI] [PubMed] [Google Scholar]
- 8.Zanotti S, Charles A. Extracellular calcium sensing by glial cells: Low extracellular calcium induces intracellular calcium release and intercellular signaling. J. Neurochem. 1997;69:594–602. doi: 10.1046/j.1471-4159.1997.69020594.x. [DOI] [PubMed] [Google Scholar]
- 9.Arcuino G, Lin JH-C, Takano T, Liu C, Jiang L, Gao Q, Kang J, Nedergaard M. Intercellular calcium signaling mediated by point-source burst release of ATP. Proc. Natl. Acad. Sci. U.S.A. 2002;99:9840–9845. doi: 10.1073/pnas.152588599. [DOI] [PMC free article] [PubMed] [Google Scholar]
- 10.Khakh BS, Burnstock G. The double life of ATP. Sci. Am. 2009;301:84–90. doi: 10.1038/scientificamerican1209-84. [DOI] [PMC free article] [PubMed] [Google Scholar]
- 11.Verkhratsky A, Parpura V, Rodriguez JJ. Where the thoughts dwell: The physiology of neuronal-glial “diffuse neural net.”. Brain Res. Rev. 2011;66:133–151. doi: 10.1016/j.brainresrev.2010.05.002. [DOI] [PubMed] [Google Scholar]
- 12.Bowser DN, Khakh BS. ATP excites interneurons and astrocytes to increase synaptic inhibition in neuronal networks. J. Neurosci. 2004;24:8606–8620. doi: 10.1523/JNEUROSCI.2660-04.2004. [DOI] [PMC free article] [PubMed] [Google Scholar]
- 13.Kawamura M, Gachet C, Inoue K, Kato F. Direct excitation of inhibitory interneurons by extracellular ATP mediated by P2Y1 receptors in the hippocampal slice. J. Neurosci. 2004;24:10835–10845. doi: 10.1523/JNEUROSCI.3028-04.2004. [DOI] [PMC free article] [PubMed] [Google Scholar]
- 14.Malenka RC, Lancaster B, Zucker RS. Temporal limits on the rise in postsynaptic calcium required for the induction of long-term potentiation. Neuron. 1992;9:121–128. doi: 10.1016/0896-6273(92)90227-5. [DOI] [PubMed] [Google Scholar]
- 15.Kamiya H, Zucker RS. Residual Ca2+ and short-term synaptic plasticity. Nature. 1994;371:603–606. doi: 10.1038/371603a0. [DOI] [PubMed] [Google Scholar]
- 16.Gurney AM, Charnet P, Pye JM, Nargeot J. Augmentation of cardiac calcium current by flash photolysis of intracellular caged-Ca2+ molecules. Nature. 1989;341:65–68. doi: 10.1038/341065a0. [DOI] [PubMed] [Google Scholar]
- 17.Hadley RW, Lederer WJ. Ca2+ and voltage inactivate Ca2+ channels in guinea-pig ventricular myocytes through independent mechanisms. J. Physiol. 1991;444:257–268. doi: 10.1113/jphysiol.1991.sp018876. [DOI] [PMC free article] [PubMed] [Google Scholar]
- 18.Eisenrauch A, Juhaszova M, Ellis-Davies GC, Kaplan JH, Bamberg E, Blaustein MP. Electrical currents generated by a partially purified Na/Ca exchanger from lobster muscle reconstituted into liposomes and adsorbed on black lipid membranes: Activation by photolysis of Ca2+ J. Membr. Biol. 1995;145:151–164. doi: 10.1007/BF00237373. [DOI] [PubMed] [Google Scholar]
- 19.Ivanov AI, Calabrese RL. Spike-mediated and graded inhibitory synaptic transmission between leech interneurons: Evidence for shared release sites. J. Neurophysiol. 2006;96:235–251. doi: 10.1152/jn.01094.2005. [DOI] [PubMed] [Google Scholar]
- 20.Wang X, Arcuino G, Takano T, Lin J, Peng WG, Wan P, Li P, Xu Q, Liu QS, Goldman SA, Nedergaard M. P2X7 receptor inhibition improves recovery after spinal cord injury. Nat. Med. 2004;10:821–827. doi: 10.1038/nm1082. [DOI] [PubMed] [Google Scholar]
- 21.Emptage NJ, Reid CA, Fine A. Calcium stores in hippocampal synaptic boutons mediate short-term plasticity, store-operated Ca2+ entry, and spontaneous transmitter release. Neuron. 2001;29:197–208. doi: 10.1016/s0896-6273(01)00190-8. [DOI] [PubMed] [Google Scholar]
- 22.Rusakov DA. The role of perisynaptic glial sheaths in glutamate spillover and extracellular Ca2+ depletion. Biophys. J. 2001;81:1947–1959. doi: 10.1016/S0006-3495(01)75846-8. [DOI] [PMC free article] [PubMed] [Google Scholar]
- 23.Rusakov DA, Fine A. Extracellular Ca2+ depletion contributes to fast activity-dependent modulation of synaptic transmission in the brain. Neuron. 2003;37:287–297. doi: 10.1016/s0896-6273(03)00025-4. [DOI] [PMC free article] [PubMed] [Google Scholar]
- 24.Heinemann U, Louvel J. Changes in [Ca2+]o and [K+]o during repetitive electrical stimulation and during pentetrazol induced seizure activity in the sensorimotor cortex of cats. Pflugers Arch. 1983;398:310–317. doi: 10.1007/BF00657240. [DOI] [PubMed] [Google Scholar]
- 25.King RD, Wiest MC, Montague PR. Extracellular calcium depletion as a mechanism of short-term synaptic depression. J. Neurophysiol. 2001;85:1952–1959. doi: 10.1152/jn.2001.85.5.1952. [DOI] [PubMed] [Google Scholar]
- 26.Sobczyk A, Svoboda K. Activity-dependent plasticity of the NMDA-receptor fractional Ca2+ current. Neuron. 2007;53:17–24. doi: 10.1016/j.neuron.2006.11.016. [DOI] [PubMed] [Google Scholar]
- 27.Harvey CD, Svoboda K. Locally dynamic synaptic learning rules in pyramidal neuron dendrites. Nature. 2007;450:1195–1200. doi: 10.1038/nature06416. [DOI] [PMC free article] [PubMed] [Google Scholar]
- 28.Belhage B, Hansen GH, Schousboe A. Depolarization by K+ and glutamate activates different neurotransmitter release mechanisms in GABAergic neurons: Vesicular versus non-vesicular release of GABA. Neuroscience. 1993;54:1019–1034. doi: 10.1016/0306-4522(93)90592-4. [DOI] [PubMed] [Google Scholar]
- 29.Bennett MV, Contreras JE, Bukauskas FF, Sáez JC. New roles for astrocytes: Gap junction hemichannels have something to communicate. Trends Neurosci. 2003;26:610–617. doi: 10.1016/j.tins.2003.09.008. [DOI] [PMC free article] [PubMed] [Google Scholar]
- 30.Cotrina ML, Lin JH, Alves-Rodrigues A, Liu S, Li J, Azmi-Ghadimi H, Kang J, Naus CC, Nedergaard M. Connexins regulate calcium signaling by controlling ATP release. Proc. Natl. Acad. Sci. U.S.A. 1998;95:15735–15740. doi: 10.1073/pnas.95.26.15735. [DOI] [PMC free article] [PubMed] [Google Scholar]
- 31.Anselmi F, Hernandez VH, Crispino G, Seydel A, Ortolano S, Roper SD, Kessaris N, Richardson W, Rickheit G, Filippov MA, Monyer H, Mammano F. ATP release through connexin hemichannels and gap junction transfer of second messengers propagate Ca2+ signals across the inner ear. Proc. Natl. Acad. Sci. U.S.A. 2008;105:18770–18775. doi: 10.1073/pnas.0800793105. [DOI] [PMC free article] [PubMed] [Google Scholar]
- 32.Liu HT, Toychiev AH, Takahashi N, Sabirov RZ, Okada Y. Maxi-anion channel as a candidate pathway for osmosensitive ATP release from mouse astrocytes in primary culture. Cell Res. 2008;18:558–565. doi: 10.1038/cr.2008.49. [DOI] [PubMed] [Google Scholar]
- 33.Kang J, Kang N, Lovatt D, Torres A, Zhao Z, Lin J, Nedergaard M. Connexin 43 hemichannels are permeable to ATP. J. Neurosci. 2008;28:4702–4711. doi: 10.1523/JNEUROSCI.5048-07.2008. [DOI] [PMC free article] [PubMed] [Google Scholar]
- 34.Parpura V, Scemes E, Spray DC. Mechanisms of glutamate release from astrocytes: Gap junction “hemichannels,” purinergic receptors and exocytotic release. Neurochem. Int. 2004;45:259–264. doi: 10.1016/j.neuint.2003.12.011. [DOI] [PubMed] [Google Scholar]
- 35.Iglesias R, Locovei S, Roque A, Alberto AP, Dahl G, Spray DC, Scemes E. P2X7 receptor-Pannexin1 complex: Pharmacology and signaling. Am. J. Physiol. Cell Physiol. 2008;295:C752–C760. doi: 10.1152/ajpcell.00228.2008. [DOI] [PMC free article] [PubMed] [Google Scholar]
- 36.Theis M, Jauch R, Zhuo L, Speidel D, Wallraff A, Döring B, Frisch C, Söhl G, Teubner B, Euwens C, Huston J, Steinhäuser C, Messing A, Heinemann U, Willecke K. Accelerated hippocampal spreading depression and enhanced locomotory activity in mice with astrocyte-directed inactivation of connexin43. J. Neurosci. 2003;23:766–776. doi: 10.1523/JNEUROSCI.23-03-00766.2003. [DOI] [PMC free article] [PubMed] [Google Scholar]
- 37.Dobrowolski R, Sasse P, Schrickel JW, Watkins M, Kim JS, Rackauskas M, Troatz C, Ghanem A, Tiemann K, Degen J, Bukauskas FF, Civitelli R, Lewalter T, Fleischmann BK, Willecke K. The conditional connexin43G138R mouse mutant represents a new model of hereditary oculodentodigital dysplasia in humans. Hum. Mol. Genet. 2008;17:539–554. doi: 10.1093/hmg/ddm329. [DOI] [PMC free article] [PubMed] [Google Scholar]
- 38.Bekar L, Libionka W, Tian GF, Xu Q, Torres A, Wang X, Lovatt D, Williams E, Takano T, Schnermann J, Bakos R, Nedergaard M. Adenosine is crucial for deep brain stimulation–mediated attenuation of tremor. Nat. Med. 2008;14:75–80. doi: 10.1038/nm1693. [DOI] [PubMed] [Google Scholar]
- 39.Malenka RC. The long-term potential of LTP. Nat. Rev. Neurosci. 2003;4:923–926. doi: 10.1038/nrn1258. [DOI] [PubMed] [Google Scholar]
- 40.Nedergaard M, Rodriguez JJ, Verkhratsky A. Glial calcium and diseases of the nervous system. Cell Calcium. 2010;47:140–149. doi: 10.1016/j.ceca.2009.11.010. [DOI] [PubMed] [Google Scholar]
- 41.Nedergaard M, Verkhratsky A. Calcium dyshomeostasis and pathological calcium signalling in neurological diseases. Cell Calcium. 2010;47:101–102. doi: 10.1016/j.ceca.2009.12.011. [DOI] [PMC free article] [PubMed] [Google Scholar]
- 42.Fujita T, Okano K, Orimo H, Yoshikawa M. Release of immunoreactive parathyroid hormone from rat parathyroid gland in organ culture. Endocrinology. 1974;95:30–37. doi: 10.1210/endo-95-1-30. [DOI] [PubMed] [Google Scholar]
- 43.Yano S, Brown EM, Chattopadhyay N. Calcium-sensing receptor in the brain. Cell Calcium. 2004;35:257–264. doi: 10.1016/j.ceca.2003.10.008. [DOI] [PubMed] [Google Scholar]
- 44.Mudò G, Trovato-Salinaro A, Barresi V, Belluardo N, Condorelli DF. Identification of calcium sensing receptor (CaSR) mRNA-expressing cells in normal and injured rat brain. Brain Res. 2009;1298:24–36. doi: 10.1016/j.brainres.2009.08.074. [DOI] [PubMed] [Google Scholar]
- 45.Li H, Liu TF, Lazrak A, Peracchia C, Goldberg GS, Lampe PD, Johnson RG. Properties and regulation of gap junctional hemichannels in the plasma membranes of cultured cells. J. Cell Biol. 1996;134:1019–1030. doi: 10.1083/jcb.134.4.1019. [DOI] [PMC free article] [PubMed] [Google Scholar]
- 46.Kondo RP, Wang SY, John SA, Weiss JN, Goldhaber JI. Metabolic inhibition activates a non-selective current through connexin hemichannels in isolated ventricular myocytes. J. Mol. Cell. Cardiol. 2000;32:1859–1872. doi: 10.1006/jmcc.2000.1220. [DOI] [PubMed] [Google Scholar]
- 47.Contreras JE, Sánchez HA, Eugenin EA, Speidel D, Theis M, Willecke K, Bukauskas FF, Bennett MV, Sáez JC. Metabolic inhibition induces opening of unapposed connexin 43 gap junction hemichannels and reduces gap junctional communication in cortical astrocytes in culture. Proc. Natl. Acad. Sci. U.S.A. 2002;99:495–500. doi: 10.1073/pnas.012589799. [DOI] [PMC free article] [PubMed] [Google Scholar]
- 48.Ye ZC, Wyeth MS, Baltan-Tekkok S, Ransom BR. Functional hemichannels in astrocytes: A novel mechanism of glutamate release. J. Neurosci. 2003;23:3588–3596. doi: 10.1523/JNEUROSCI.23-09-03588.2003. [DOI] [PMC free article] [PubMed] [Google Scholar]
- 49.Thimm J, Mechler A, Lin H, Rhee S, Lal R. Calcium-dependent open/closed conformations and interfacial energy maps of reconstituted hemichannels. J. Biol. Chem. 2005;280:10646–10654. doi: 10.1074/jbc.M412749200. [DOI] [PubMed] [Google Scholar]
- 50.Lux HD, Heinemann U. Ionic changes during experimentally induced seizure activity. Electroencephalogr. Clin. Neurophysiol. Suppl. 1978;34:289–297. [PubMed] [Google Scholar]
- 51.Hansen AJ. Effect of anoxia on ion distribution in the brain. Physiol. Rev. 1985;65:101–148. doi: 10.1152/physrev.1985.65.1.101. [DOI] [PubMed] [Google Scholar]
- 52.Pumain R, Heinemann U. Stimulus-and amino acid-induced calcium and potassium changes in rat neocortex. J. Neurophysiol. 1985;53:1–16. doi: 10.1152/jn.1985.53.1.1. [DOI] [PubMed] [Google Scholar]
- 53.Hofer AM, Machen TE. Technique for in situ measurement of calcium in intracellular inositol 1,4,5-trisphosphate-sensitive stores using the fluorescent indicator mag-fura-2. Proc. Natl. Acad. Sci. U.S.A. 1993;90:2598–2602. doi: 10.1073/pnas.90.7.2598. [DOI] [PMC free article] [PubMed] [Google Scholar]
- 54.Cohen JE, Fields RD. CaMKII inactivation by extracellular Ca2+ depletion in dorsal root ganglion neurons. Cell Calcium. 2006;39:445–454. doi: 10.1016/j.ceca.2006.01.005. [DOI] [PMC free article] [PubMed] [Google Scholar]
- 55.Nimmerjahn A, Mukamel E, Schnitzer M. Program No. 337.2, Neuroscience Meeting Planner. Society for Neuroscience; Washington, MD: 2008. p. 337.2. [Google Scholar]
- 56.Hoogland TM, Kuhn B, Göbel W, Huang W, Nakai J, Helmchen F, Flint J, Wang SS. Radially expanding transglial calcium waves in the intact cerebellum. Proc. Natl. Acad. Sci. U.S.A. 2009;106:3496–3501. doi: 10.1073/pnas.0809269106. [DOI] [PMC free article] [PubMed] [Google Scholar]
- 57.Takayasu Y, Iino M, Takatsuru Y, Tanaka K, Ozawa S. Functions of glutamate transporters in cerebellar Purkinje cell synapses. Acta Physiol. 2009;197:1–12. doi: 10.1111/j.1748-1716.2009.02019.x. [DOI] [PubMed] [Google Scholar]
- 58.Yamamoto T, Ochalski A, Hertzberg EL, Nagy JI. On the organization of astrocytic gap junctions in rat brain as suggested by LM and EM immunohistochemistry of connexin43 expression. J. Comp. Neurol. 1990;302:853–883. doi: 10.1002/cne.903020414. [DOI] [PubMed] [Google Scholar]
- 59.O’Grady SM, Elmquist E, Filtz TM, Nicholas RA, Harden TK. A guanine nucleotide-independent inwardly rectifying cation permeability is associated with P2Y1 receptor expression in Xenopus oocytes. J. Biol. Chem. 1996;271:29080–29087. doi: 10.1074/jbc.271.46.29080. [DOI] [PubMed] [Google Scholar]
- 60.von Kugelgen I, Wetter A. Molecular pharmacology of P2Y-receptors. Naunyn Schmiedebergs Arch. Pharmacol. 2000;362:310–323. doi: 10.1007/s002100000310. [DOI] [PubMed] [Google Scholar]
- 61.Lee SY, Wolff SC, Nicholas RA, O’Grady SM. P2Y receptors modulate ion channel function through interactions involving the C-terminal domain. Mol. Pharmacol. 2003;63:878–885. doi: 10.1124/mol.63.4.878. [DOI] [PubMed] [Google Scholar]
- 62.Lin JH, Lou N, Kang N, Takano T, Hu F, Han X, Xu Q, Lovatt D, Torres A, Willecke K, Yang J, Kang J, Nedergaard M. A central role of connexin 43 in hypoxic preconditioning. J. Neurosci. 2008;28:681–695. doi: 10.1523/JNEUROSCI.3827-07.2008. [DOI] [PMC free article] [PubMed] [Google Scholar]
- 63.Regan MR, Huang YH, Kim YS, Dykes-Hoberg MI, Jin L, Watkins AM, Bergles DE, Rothstein JD. Variations in promoter activity reveal a differential expression and physiology of glutamate transporters by glia in the developing and mature CNS. J. Neurosci. 2007;27:6607–6619. doi: 10.1523/JNEUROSCI.0790-07.2007. [DOI] [PMC free article] [PubMed] [Google Scholar]
- 64.Cotrina ML, Kang J, Lin JH, Bueno E, Hansen TW, He L, Liu Y, Nedergaard M. Astrocytic gap junctions remain open during ischemic conditions. J. Neurosci. 1998;18:2520–2537. doi: 10.1523/JNEUROSCI.18-07-02520.1998. [DOI] [PMC free article] [PubMed] [Google Scholar]
Associated Data
This section collects any data citations, data availability statements, or supplementary materials included in this article.
Supplementary Materials
Fig. S1. Calibration of Ca2+-sensitive microelectrode and effects of diazo-2 photolysis on [Ca2+]e (A) Representative trace of calibration of a Ca2+-sensitive microelectrode. Extracellular Ca2+ in the bath was successively increased from 1, to 2, to 3 mM Ca2+ in aCSF. (B) Calibration of Ca2+ sensitive microelectrodes in aCSF (n=3 microelectodes, r2=0.986). The electrodes used in experiments typically showed voltage responses of 5-10 mV per mM increase in Ca2+ concentration in the concentration range studied. Electrode calibration was done before and after each experiment. (C) Duration of diazo-2-induced decrease in [Ca2+]e plotted as a function of stimulus intensity (n=3 photolysis events, UV pulses 1-10, and 10 pulses without diazo-2, **, p<0.01). (D) Diagram showing recordings obtained by placing the electrode at increasing distances from the photolysis site. Diazo-2-induced reduction in [Ca2+]e detected with the Ca2+-sensitive microelectrode placed 50, 100, or 150 μm from the site targeted by photolysis. (n=8 photolysis events, **, p<0.01 compared to 50 μm). (E) Traces show representative recordings of spontaneous EPSPs and IPSCs in hippocampal CA1 neurons. Bar histograms compare the frequency and amplitude of EPSPs and IPSCs 5 s before or 5 s after photolysis (no significant differences in EPSP or IPSC frequency and amplitude was identified using paired t-test, before vs. after, p>0.05, n = 7).
Fig. S2. CA1 pyramidal neurons depolarize and decrease their input resistance in response to photolysis of MNI-glutamate, whereas photolysis of diazo-2 is not associated with changes in the membrane properties (A) Representative current-clamp recordings from a hippocampal CA1 pyramidal cell located ~70 μm from the site of photolysis of diazo-2 (left panel) or MNI-glutamate (right panel). Lower traces show expanded timescale. (B) Comparison of changes in plasma membrane potential in response to photolysis of diazo-2 and MNI-glutamate in CA1 pyramidal neurons (n=4-11 photolysis events, **, p<0.001). (C) Comparison of relative changes in input resistance in response to photolysis of diazo-2 and MNI-glutamate in CA1 pyramidal neurons (n=4-5 photolysis events, **, p<0.001).
Fig. S3. Photolysis of MNI-glutamate (A) Duration of the decrease in [Ca2+]e produced by photolysis of MNI-glutamate plotted as a function of number of UV pulses used for photolysis (n=5 photolysis events, **, p<0.01). (B) Diagram of recordings obtained by placing the electrode at increasing distances from the photolysis site. MNI-glutamate-induced reduction in [Ca2+]e detected with the Ca2+-sensitive microelectrode placed 50, 100, or 150 μm from the site targeted by photolysis (n=4-15 photolysis events. *, p<0.05 compared to 50 μm). If MNI-glutamate was omitted, UV pulses failed to decrease [Ca2+]e.
Fig. S4. Transgenic reporter mice reveal distinct responses to MNI-glutamate photolysis of neurons and astrocytes in hippocampal slices (A) Hippocampal slice from a Thy1-YFP reporter mouse loaded with the Ca2+ indicator rhod-2 am. YFP+ neurons show an increase in Ca2+ during the 1st, but not the 2nd Ca2+ wave. Scale bar, 50 μm. (B) Hippocampal slice from a GLT1-GFP reporter mouse loaded with the Ca2+ indicator rhod-2 am. GFP+ astrocytes show an increase in Ca2+ during both the 1st and the 2nd Ca2+ waves. Scale bar, 50 μm. (C) Duration of the increase in Ca2+ in astrocytes and neurons during the 1st and the 2nd Ca2+ wave (n=12-13 photolysis events, *, p<0.05, **, p<0.01). (D) The amplitude of the increases in Ca2+ in astrocytes or neurons during the 1st or the 2nd Ca2+ wave (n=10 photolysis events, **, p<0.01).
Fig. S5. Comparison of Ca2+ waves in hippocampus and cortex evoked by photolysis of MNI-glutamate or diazo-2 (A) Comparison of Ca2+ increases in astrocytes during the 2nd Ca2+ wave evoked by photolysis of MNI-glutamate and the Ca2+ wave evoked by photolysis of diazo-2 at 50, 100, and 150 μm in cortex and hippocampus (n=9 photolysis events, p>0.05). (B) Comparison of maximal radius of the Ca2 waves in astrocytes evoked by photolysis of MNI-glutamate and diazo-2 in cortex and hippocampus (n=10 photolysis events, p>0.05).
Fig. S6. Comparison of Ca2+ waves evoked by diazo-2 or MNI-glutamate photolysis All comparisons are made between Ca2+ waves evoked by diazo-2 photolysis and the 2nd Ca2+ wave evoked by MNI-glutamate. (A) Histogram comparing the delay between photolysis and the first increase in Ca2+ evoked by diazo-2 or MNI-glutamate photolysis (n=20-22 photolysis events, *, p<0.05). (B) Ca2+ increase at 75 μm evoked by diazo-2 or MNI-glutamate photolysis (n=16 photolysis events). (C) Radius of Ca2+ waves evoked by diazo-2 or MNI-glutamate photolysis (n=26 photolysis events). (D) Velocity of Ca2+ waves evoked by diazo-2 or MNI-glutamate photolysis (n=18 photolysis events). (E) Duration of Ca2+ increases in astrocytes evoked by diazo-2 or MNI-glutamate photolysis (n=12 photolysis events).
Fig. S7. Effect of manipulation of P2Y1 receptors in hippocampal interneurons (A) The P2Y1 receptor antagonist, MRS2179 (50 μM) blocked depolarization and bursting activity induced by diazo-2 photolysis in 4 of 5 interneurons. One of the five interneurons exhibited a transient minor depolarization, but no action potential firing. (B) Exposure to the P2Y1 receptor agonist 2MeSADP (100 μM) induced depolarization in a total of 8 interneurons tested, whereof 3 exhibited bursting activity. (C) Histograms compare the frequency of interneuronal action potential firing, as well as the amplitude of membrane depolarization induced by photolysis of diazo-2 with or without exposure to 2MeSADP (n = 6-8 photolysis events).