

Abstract
Deep sympatric intraspecific divergence in mtDNA may reflect cryptic species or formerly distinct lineages in the process of remerging. Preliminary results from DNA barcoding of Scandinavian butterflies and moths showed high intraspecific sequence variation in the autumnal moth, Epirrita autumnata. In this study, specimens from different localities in Norway and some samples from Finland and Scotland, with two congeneric species as outgroups, were sequenced with mitochondrial and nuclear markers to resolve the discrepancy found between mtDNA divergence and present species-level taxonomy. We found five COI sub-clades within the E. autumnata complex, most of which were sympatric and with little geographic structure. Nuclear markers (ITS2 and Wingless) showed little variation and gave no indications that E. autumnata comprises more than one species. The samples were screened with primers for Wolbachia outer surface gene (wsp) and 12% of the samples tested positive. Two Wolbachia strains were associated with different mtDNA sub-clades within E. autumnata, which may indicate indirect selection/selective sweeps on haplotypes. Our results demonstrate that deep mtDNA divergences are not synonymous with cryptic speciation and this has important implications for the use of mtDNA in species delimitation, like in DNA barcoding.
Keywords: DNA barcoding, Epirrita autumnata, mtDNA, nDNA, selective sweep, Wolbachia
Introduction
Species are often regarded as basic units of evolution and correct species delimitation serves as a backbone in most biological studies (Mayr 1982; Roe and Sperling 2007). However, the number of described species is a small portion of the estimated extant number and there is a need for an increased ability to identify and discriminate species (Blaxter 2004; Silva-Brandao et al. 2009). For the last three decades, mitochondrial DNA has been extensively used (Ballard and Whitlock 2004) and proven to be an important tool in species delimitation as it possesses biological properties making it suitable as a marker for molecular biodiversity (Moore 1995; Hebert et al. 2003).
A universal system for rapid, inexpensive species identification applicable for any life stage, DNA barcoding, has been proposed by Hebert et al. (2003). The ambition behind DNA barcoding is identification by sequencing of short standardized gene regions in order to assign unknown individuals to species and to enhance the discovery of new species. The assumptions underlying DNA barcoding are that every species have sets of unique barcode sequences and hence constitutes monophyletic clades and that genetic variation between species exceeds the variation within species (Hebert et al. 2003). Nevertheless, there are examples of deep intraspecific divergences in mtDNA, also in sympatric populations of animal groups such as birds (Omland et al. 2000; Johnsen et al. 2010; Hogner et al. in press), beetles (Schulenburg et al. 2002; Avtzis et al. 2008), and spiders (Chang et al. 2007). There are several possible explanations for high intraspecific variation. First, this pattern may reflect the presence of cryptic species. The exploration of cryptic species within the Skipper butterfly, Astraptes fulgerator, performed by Hebert et al. (2004) is a well-known example. By combining DNA barcoding with information about ecology and morphology of A. fulgerator, at least 10, largely sympatric cryptic species were revealed (but see Brower 2006). Second, demographic effects like isolation will cause differentiation between isolated populations by the accumulation of mutations over time. The differentiation may then reflect early stages of speciation. Secondary admixture of allopatrically evolved populations will in many cases result in gene trees with pronounced phylogenetic gaps between branches (Avise 2000). However, haplotype loss due to genetic drift (i.e., lineage sorting) will over time make a population monophyletic for a single gene lineage (Beebee and Rowe 2004). As lineage sorting is more prominent in small populations, the number of haplotypes maintained in a population is a function of current and historic effective population sizes. In closely related species, allele fixation often fails to complete and they will in these cases share ancestral polymorphisms resulting in discordance between gene trees and species trees (Moore 1995; Beebee and Rowe 2004). For nuclear DNA, when reproductive barriers do not evolve in allopatry and if secondary contact is obtained, variation must be maintained by factors opposing gene flow (e.g., geography and ecology). This is because gene flow will homogenize the nuclear genome over time (Futuyma 2005). Third, introgression by hybridization between closely related species can cause mtDNA to show a different gene genealogy than most other genes in the species in question. As the gene genealogy resulting from introgression is very similar to that expected by ancestral polymorphism and incomplete linage sorting (Ballard and Whitlock 2004), distinguishing between isolation and ancient hybridization can be very difficult. Finally, interpretation of mitochondrial genetic diversity may be hampered by the presence of heritable endoparasitic symbionts and in some cases result in incongruence between nDNA and mtDNA (Linares et al. 2009). Among the most widespread are bacteria from the genus Wolbachia (Alphaproteobacteria: Rickettsiales) (Russell et al. 2009). It has long been recognized that endoparasitic symbionts are prevalent among arthropods and that these organisms may have an important role in arthropod evolution as they can cause a number of reproductive alterations in their host, the most common being cytoplasmic incompatibility (Rousset et al. 1992; Werren 1997; Hurst et al. 1999; Hurst and Jiggins 2005; Narita et al. 2009). Male-killing parthenogenesis and feminization of genetic males are other alterations documented in arthropods (Rousset et al. 1992; Grandjean et al. 1993; Werren et al. 1995; Werren 1997; Jiggins 2003; Hurst and Jiggins 2005). The effects of inherited symbionts can be mistaken as evidence for population structure and admixture, as an mtDNA genealogy with deep internal branches could be the result of multiple selective sweeps from different Wolbachia strains, rather than a population being large and old or because of secondary admixture (Hurst and Jiggins 2005). Nevertheless, analysis and comparison of sequence data from both mtDNA and nDNA should help distinguishing between demographic effects and indirect selection on mtDNA by parasitic bacteria in an infected population (Rokas et al. 2001; Raychoudhury et al. 2010).
The genus Epirrita constitutes nine species (Scoble 1999), of which three are distributed in Norway (Aarvik et al. 2009). These are the autumnal moth, Epirrita autumnata, pale November moth, Epirrita christyi, and November moth, Epirrita dilutata. E. autumnata (Fig. 1) is distributed from Japan and Manchuria through Mongolia, Siberia, and Caucasus, to Western Europe and from the northern parts of Scandinavia to the Mediterranean (Skou 1984). The subspecies E. autumnata omissa and E. autumnata henshawi are found in North America (Tenow 1972; Scoble 1999). The larvae feed on deciduous trees, especially on birch (Betula), alder (Alnus), and willow (Salix) and have cyclic outbursts with ∼9- to10-year intervals (Tenow 1972; Aarvik et al. 2009). In periods with high larvae densities, it can defoliate and seriously harm the mountain birch (Betula pubescens ssp. czerepanovii) forests (Ruohomaki et al. 2000; Jepsen et al. 2008; Yang et al. 2008). As a consequence of the moths' cyclical population dynamics, northern populations of E. autumnata may experience present-day bottlenecks as outbreaks are followed by collapse in population size and subsequent decline in genetic variability. Hence, one might expect to find relatively low levels of genetic variation within this species (Futuyma 1998; Snäll et al. 2004). However, preliminary results from DNA barcoding of Scandinavian moths and butterflies (Lepidoptera) revealed discrepancy between present division to species and sequence divergence in the genus Epirrita (Johnsen, Aarvik & Lifjeld, unpublished data). In particular, high sequence variation clustered in several well-defined haplogroups within sympatric E. autumnata suggested that this might be a complex of cryptic species.
Figure 1.
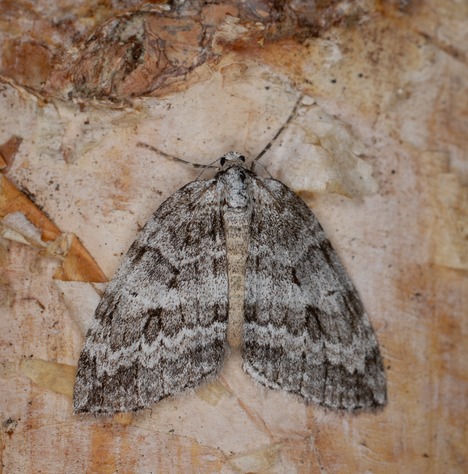
The study species, Epirrita autumnata. Photo: Svein Bekkum.
The main aims of this study were to examine the relatively high mtDNA variation found within E. autumnata, describe the degree of sympatry among haplogroups within Norwegian populations of this species and compare the variation at mitochondrial (Cytochrome c Oxidase subunit 1, CO1) and nuclear (Internal Transcribed Spacer 2, ITS2 and Wingless) loci. In particular, we wanted to investigate four possible explanations for high intraspecific mtDNA variation: (1) presence of cryptic species; (2) historic isolation and secondary contact; (3) introgression from a related species; and (4) Wolbachia infections associated with different haplogroups. First, if the high mtDNA diversity reflects cryptic species, we predict congruence between divergence in mtDNA and nDNA sequence data, given that there has been sufficient time for divergence. Second, if the pattern is due to isolation and secondary contact, we predict higher differentiation in mtDNA compared with nDNA because the former has a relatively high evolutionary rate (5–10 times higher than single copy nDNA) (Avise 1986). Furthermore, depending on the amount of time since range expansions and secondary contact, we expect some degree of mtDNA- and nDNA structure, reflecting the demographic history and original geographic distribution of the lineages, again with higher degree of structure in mtDNA. Third, if ancient introgression by hybridization caused the differentiation in E. autumnata mtDNA, the same predictions as for historic isolation with secondary contact will apply. However, if introgression occurred recently, we would expect to find overlapping haplotypes with closely related species (e.g., E. dilutata and/or E. christyi). Finally, if Wolbachia infections have affected the mtDNA variation within this species, we predict an association between infection status and haplogroups and incongruence between mtDNA and nDNA. The samples were screened for Wolbachia infections to evaluate whether Wolbachia might have influenced patterns of mitochondrial diversity in E. autumnata.
Material and methods
Material examined
A total of 87 moths from the genus Epirrita were examined in the course of this study, of which 79 were collected in Norway, five in Finland, and three in Scotland (Appendix, Table 4). The Norwegian moths were sampled from different parts of Norway in the period 1999–2009. The middle leg of each moth was collected and stored in ethanol for DNA extraction and the abdomen was removed from some of the specimens for the purpose of making genital preparations. The rest of the animal was prepared dry and pinned as voucher. Information about the samples is available at the Barcode of Life Data Systems website (http://www.boldsystems.org) in the “NorBOL – Lepidoptera – Epirrita” project. In addition, two Wingless and three wsp sequences (see below) were downloaded from GenBank and included in the analysis. Sequences downloaded from GenBank are identified by accession numbers in the phylogenetic trees.
Genetic analysis
DNA extraction
Legs were dried at 50°C and transferred to eppendorf tubes. To speed up lysis, the legs were crushed into smaller pieces. DNA extraction was carried out using the E.Z.N.A tissue kit (Omega Bio-tek Inc, Norcross, GA), according to the manufacturer's protocol. The lysis reaction proceeded overnight and the DNA elution was performed with 100-μL elution buffer.
Amplification
Amplification of a 658 base pair long COI fragment from the COI 5′ region was performed using the primers Lep-F1 (5′-ATTCAACCAATCATAAAGATAT-3′; Hebert et al. 2004) and Lep-R1, (5′-TAAACTTCTGGATGTCCAAAAA-3′ Hebert et al. 2004). In cases where these primers failed to amplify, a second reverse primer EnhLep-R1 (5′-CTCCWCCAGCAGGATCAAAA-3′; Hajibabaei et al. 2006) was used in combination with Lep-F1, targeting a 612-bp fragment of the COI region. The PCR profile used for this marker was as follows: 94°C for 1 min, 94°C for 30 sec, 46°C for 40 sec, 72°C for 1 min, (step 2–4 cycled 5 times), 94°C for 30 sec, 51°C for 40 sec, 72°C for 1 min, (step 5–7 cycled 35 times), and 72°C for 10 min.
A 500- to 514-bp long fragment, depending on the species, from the ITS2 region was amplified using the forward primer ITS3b (5′-GGGTCGATGAAGAACGCAST-3′; Roe and Sperling 2007) and reverse primer ITS4 (5′-TCCTCCGCTTATTGATATGC-3′; White et al. 1990). If these primers failed to amplify, another forward primer, FFA (5′-TGTGAACTGCAGGACACA-3′, Brown et al. 2000) was used. PCR profiles for the ITS2 markers were as follows: 94°C for 2 min, 94°C for 30 sec, 55°C for 1 min, 72°C for 2 min, (step 2-4 cycled 34 times), and 72°C for 10 min.
To amplify a 408-bp long fragment from the Wingless region, a single primer pair was used; LepWG1_f (5′-GARTGYAARTGYCAYGGYATGTCTGG-3′; Brower and DeSalle 1998) and LepWG2_r (5′-ACTICGCRCACCARTGGAATGTRCA-3′; Brower and DeSalle 1998). The PCR profile was as follows: 95°C for 5 min, 95°C for 1 min, 50°C for 1 min, 72°C for 2 min, (step 2–4 cycled 35 times) and 72°C for 10 min. For some of the Wingless samples, more than one fragment was amplified. In these cases, a second electrophoresis was performed using 7-μL PCR product and 4-μL loading dye. The PCR product was cut out with scalpel under UV light, cleaned up, and DNA was extracted following the protocol NucleoSpin® Extract II, PCR clean-up/extraction kit (Macherey-Nagel, Düren, Germany). To solubilize the gel slices, 200 μL NT buffer pr. 100 μg gel/PCR product was used.
General wsp primers were used to amplify 555–560 bp, depending on the strain, from the Wolbachia outer surface gene; wsp 81F (5′-TGG TCC AAT AAG TGA TGA AGAAAC-3′; Braig et al. 1998) and wsp 691R (5′-AAA AAT TAA ACG CTA CTC CA-3′; Braig et al. 1998). The following PCR profile was used with the wsp primers: 94°C for 1 min, 94°C for 30 sec, 55°C for 40 sec, 72°C for 1 min, (step 2–4 cycled 35 times) and 72°C for 10 min. All wsp sequences were cloned in case of multiple infections (see below).
PCR reactions were performed in 10- or 12.5-μL reaction volume. The final concentration of the various chemicals was as follows: 1× buffer, 1.5mM MgCl2, 0.8mM dNTPs, 0.5 mM of the forward and reverse primers, 3% DMSO, 1U/μL Platinum Taq DNA Polymerase (Invitrogen, Carlsbad, CA), and dH2O to make up the remaining reaction volume. The DNA template had a final concentration of 15–50 ng. The MgCl2 concentration and/or polymerase concentration was increased when no bands were visible with agarose gel screening. All samples were screened on 1% agarose gel, stained with ethidiumbromide or SYBR- Safe (Invitrogen). Wolbachia screenings were performed with positive control. In cases where no bands were visible, a second amplification/screening was performed to confirm the result.
Cloning of wsp sequences
Cloning was performed following the TOPO10 Cloning protocol (Invitrogen). The PCR product was heated to 68°C for 10 min before the TOPO cloning reaction was set up. We used 2-μL PCR product and let the reaction incubate for 15 min at room temperature. We used E.coli DH5α cells for transformation and the transformed cells were transferred to growth medium (LB agar) containing Kanamycin (100 μg/mL) as selection marker. DNA from 6–8 clones from each individual were picked out and diluted in 6-μL dH2O (for two individuals only three colonies were obtained, however, they all gave the same result). The samples were then amplified and sequenced as described below using standard M13 primers.
Sequencing
The samples were cleaned for unconsumed primers and nucleotides using Exo-Sap-IT (United States Biochemical, Cleveland, OH), diluted 10 times and incubated at 37°C for 45 min for degradation of excess primers and nucleotides and inactivated at 80°C for 15 min. Cycle sequencing was performed in 10-μl reaction volume, using BigDye v3.1 cycle sequencing kit with 5× BigDye Terminator sequencing buffer (Applied Biosystems, Foster City, CA) and a program following manufacturer's recommendations. Purification was performed using ethanol/EDTA/sodium acetate precipitation. Electrophoresis and data analysis of samples were performed with an ABI 3130×l capillary electrophoresis instrument.
The four regions were sequenced in both directions and the resulting consensus sequences were aligned by ClustalW and manually edited in MEGA version 4.0.2 (Tamura et al. 2007). Using highly conserved primers, there is a risk of co-amplifying non-functional copies of mtDNA (numts) in addition to the targeted mtDNA and numts have been shown to be a source of error by overestimation of unique species inferred from the analysis (Gellissen et al. 1983; Lopez et al. 1994; Song et al. 2008). Careful examination of the sequences can reveal numts based on properties such as indels, frameshift mutations, in-frame stop codons, unexpected nucleotide composition, and systematic double peaks (Song et al. 2008). Alignments generated from the three coding regions (COI, Wingless, and wsp) were translated from nucleotide- to amino acid sequences to check for stop codons and frameshift mutations.
Phylogenetic and statistical analyses
A model test was performed on all four data sets using MEGA5 version 5.05 (Tamura et al. 2011) to find the best fit substitution models for the different markers. Neighbor-joining analyses, calculation of genetic distances, and standard errors between the different haplogroups were performed in MEGA5 using the Tamura 3-parameter (Tamura 1992) (COI and wsp) – and the Jukes–Cantor algorithm (Jukes and Cantor 1969) (ITS2 and Wingless) with all sites included, the complete deletion option, assuming homogenous pattern among lineages and uniform substitution rates among sites. Bootstrap values were calculated in MEGA5 using 10 000 iterations.
To test for neutrality, DnaSP version 5.10 (Librado and Rozas 2009) was used to compute Tajima's D (Tajima 1989). This test is based on the allele frequency spectrum and can be used to infer previous evolutionary and demographic events in the population. Positive values indicate an excess of intermediate-frequency alleles, which might result from balancing selection or bottlenecks, while negative values reflect an excess of rare polymorphisms, which might result from positive selection or a population expansion (Akey et al. 2004). We also calculated the two common measures of nucleotide polymorphism, π, the average number of nucleotide differences per site between two sequences and θ, the population mutation parameter estimated from the number of segregating sites in the aligned sample of sequences (Nei 1987).
Analysis of molecular variance (AMOVA: Excoffier et al. 1992) and calculation of FST (Wright 1951) were performed on 53 E. autumnata COI sequences of the Norwegian samples using ARLEQUIN version 3.5.1.2 (Excoffier et al. 2005), to investigate how genetic variation was distributed within and between regions. The 14 Norwegian sampling locations were divided into four regions: north (N = 5), east (N = 22), south (N = 13), and west (N = 13) (Appendix, Table 4). The analysis was conducted with pairwise difference as distance method.
Results
Mitochondrial and nuclear DNA variation
Translation from nucleotide- to amino acid sequences of the analyzed regions revealed no stop codons, frameshifts, or systematic double peaks and the mtDNA base composition was as expected, with a high A-T content (68%) (Perna and Kocher 1995).
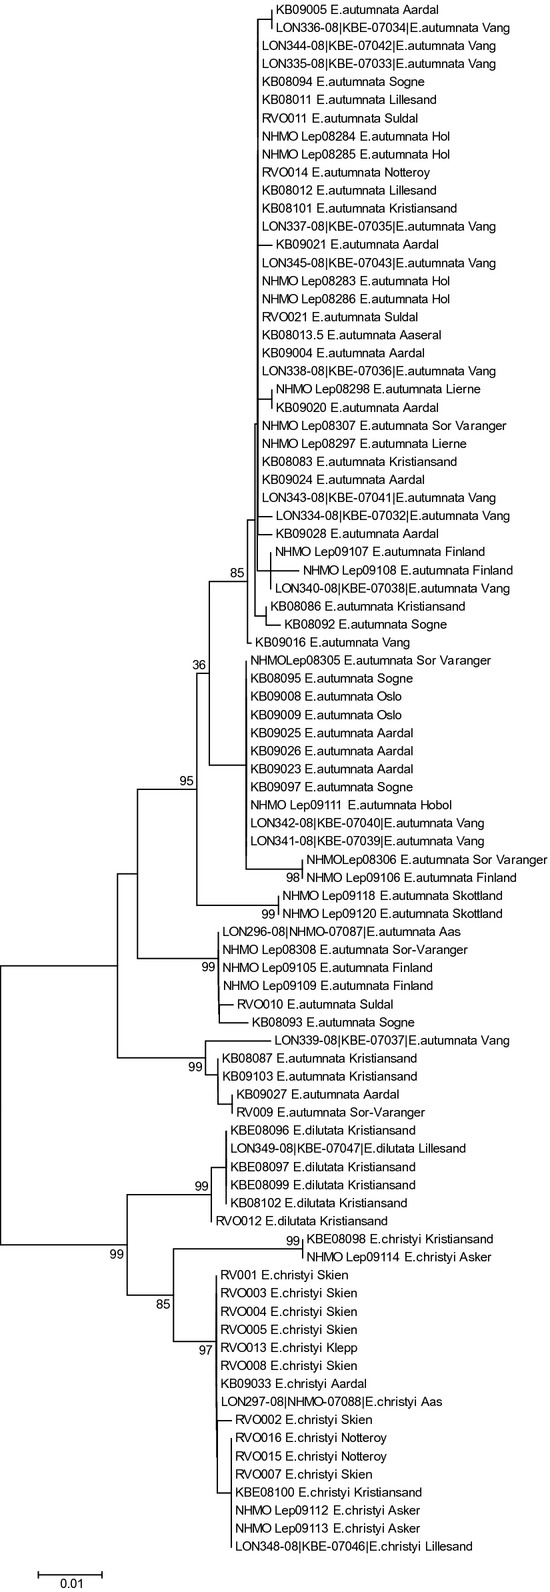
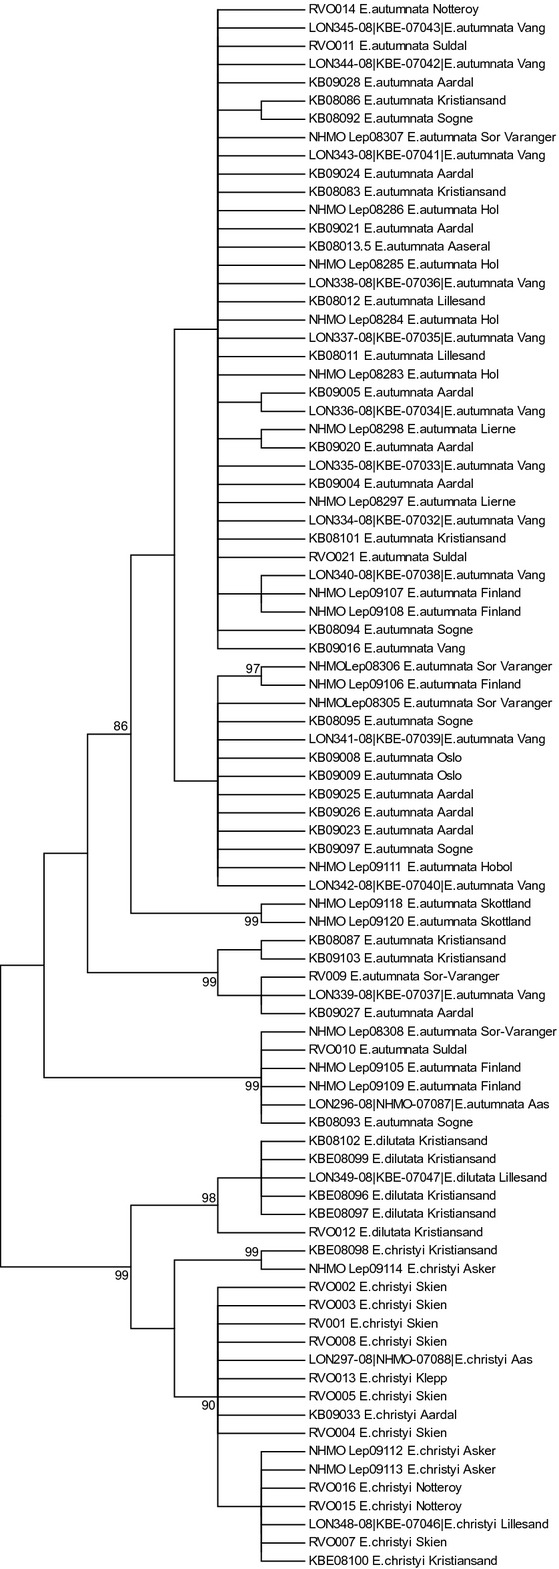
Neighbor-joining analysis of the COI data set showed high intraspecific variation within E. autumnata, with 21 haplotypes divided into five distinct haplogroups with varying degree of support at each node, ranging from 63% to 99% (Fig. 2a, only bootstrap values higher than 85% are shown). Standard estimates of nucleotide polymorphism were higher within E. autumnata than within E. christiy and E. dilutata (Table 1). Genetic distance between E. autumnata COI haplogroups 1–5 ranged from 1.5% to 4.1% (Table 2). Assuming a COI substitution rate of 1.5–2.3% per million years (Brower 1994; Farrell 2001; Kandul et al. 2004), genetic distance as high as 4.1% (distance between haplogroup 1 and 5) suggests divergence as far back as 1.7–2.7 million years. Interspecific distances among E. autumnata, E. christyi, and E. dilutata ranged from 2.9 to 7.6%. Haplogroup 3 consists of moths from Scotland, while the remaining four groups comprise samples from all four Norwegian regions: north, east, south, and west. This shows a high degree of sympatry of mtDNA linages in the northern E. autumnata populations. The Neighbor-joining topology based on the COI data is supported by Minimum evolution and Maximum parsimony analysis generated in MEGA5 (Appendix Fig. A1 and A2). In contrast, the phylogenies based on nuclear loci show far less intraspecific variation. In the phylogenies based on the ITS2- and Wingless data sets, E. autumnata constitutes one monophyletic group with ∼0.5% and no variation, respectively (Fig. 3 and 4). The AMOVA reveals that COI haplotype variation is much higher within regions (98.3%), than between regions (1.7%) (Table 3; overall FST = 0.017, P = 0.27). Estimates of Tajima's D were negative, but not significantly different from zero for COI in all three species (Table 1).
Figure 2.
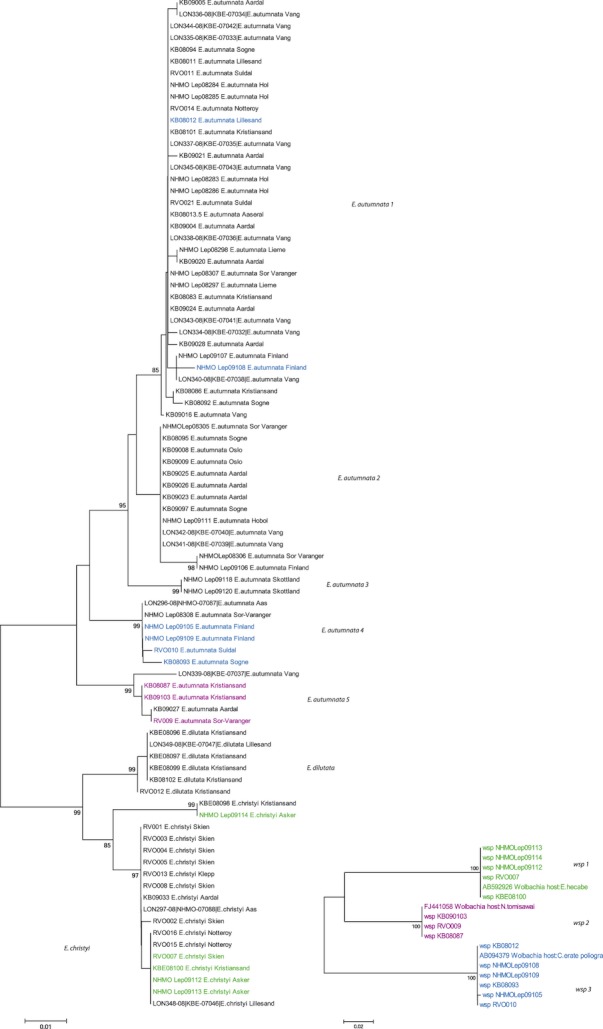
(a) Neighbor-joining analysis of 86 Epirrita samples based on the COI gene (Tamura 3-parameter used as substitution model). E. dilutata and E. christyi are included as out-groups. The five monophyletic groups of distinct E. autumnata haplotypes show high intraspecific variation. Bootstrap support (10000 iterations) is shown at each node. (b) Neighbor-joining analysis based on the wsp gene (Tamura 3-parameter used as substitution model). Bootstrap support (10000 iterations) is indicated at each node. Infections caused by bacteria represented in wsp group 1 are found in E. christyi. Infections from wsp group 2 are found in E. autumnata haplogroup 5, while infections represented in wsp group 3 are found in E. autumnata group 1 and 4. For each clade, we have added a representative wsp sequence (downloaded from Genbank) that has been identified in other Lepidoptera species (Eurema hecabe, Nephopterix tomisawai, Colias erate subsp. polygraphus).
Table 1.
Polymorphism statistics for Epirrita autumnata (and Epirrita christyi and Epirrita dilutata for COI) from the COI, Wingless and ITS2 region, and from Wolbachia outer surface gene (wsp)
| Species | N1 | L2 | Tajima's D3 | π4 | θ5 | |
|---|---|---|---|---|---|---|
| COI | E. autumnata | 62 | 658 | -0.77659 | 0.01674 | 0.02043 |
| E. christyi | 18 | 658 | -0.89359 | 0.00693 | 0.00907 | |
| E. dilutata | 6 | 658 | -0.93302 | 0.00058 | 0.00076 | |
| Wingless | E. autumnata | 14 | 409 | -1.15524 | 0.00039 | 0.00085 |
| ITS2 | E. autumnata | 23 | 484 | 1.99999 | 0.00285 | 0.542 |
| wsp | E. autumnata | 17 | 564 | -0.93302 | 0.10812 | 0.06573 |
Table 2.
Genetic distance (Tamura 3-parameter) between the five Epirrita autumnata haplotype groups 1-5 (below diagonal) with standard errors (above diagonal)
| E. a 1 | E. a 2 | E. a 3 | E. a 4 | E. a 5 | |
|---|---|---|---|---|---|
| E. autumnata1 | 0.005 | 0.007 | 0.009 | 0.010 | |
| E. autumnata2 | 0.015 | 0.007 | 0.008 | 0.009 | |
| E. autumnata3 | 0.023 | 0.022 | 0.009 | 0.009 | |
| E. autumnata4 | 0.035 | 0.033 | 0.039 | 0.009 | |
| E. autumnata5 | 0.041 | 0.036 | 0.040 | 0.037 |
Figure 3.
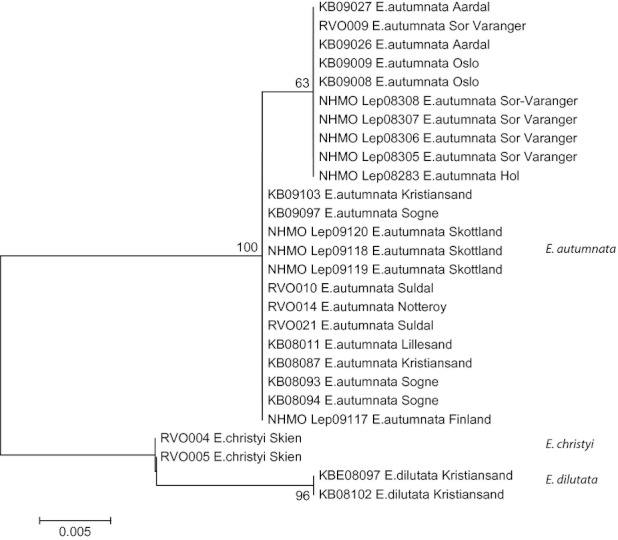
Neighbor-joining analysis of 27 Epirrita sequences based on the ITS2 gene (Jukes–Cantor used as substitution model). E. christyi and E. dilutata are included as out-groups. E. autumnata are shown as one monophyletic group with some diversity (< 0.5%). Bootstrap support (10000 iterations) is shown at each node.
Figure 4.
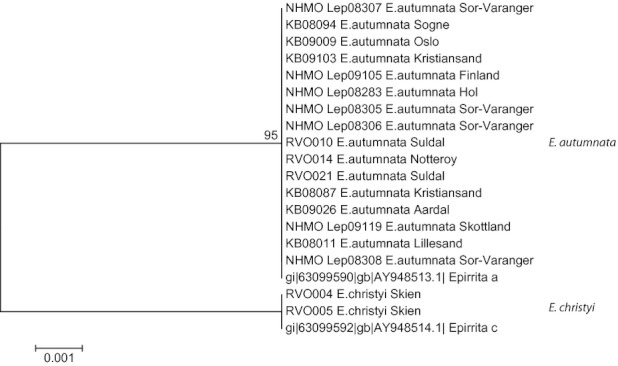
Neighbor-joining analysis of 20 Epirrita sequences based on the Wingless gene and with E. christyi as out-group (Jukes–Cantor used as substitution model). Bootstrap support (10,000 iterations) is shown at each node.
Table 3.
AMOVA of Norwegian Epirrita autumnata samples showing haplotype distribution in four selected regions in Norway; north, east, south, and west
| Source of variation | d.f | Sum of squares | Variance components | Percentage of variation |
|---|---|---|---|---|
| Among regions | 3 | 14.444 | 0.069 Va | 1.710 |
| Within regions | 49 | 194.273 | 3.965 Vb | 98.290 |
| Total | 52 | 208.717 | 4.034 |
Wolbachia screening
Of the 71 samples screened, 17 (12%) tested positive for Wolbachia. It was possible to generate wsp sequences from 14 of the 17 infected samples and all 14 individuals had only one wsp sequence as revealed by cloning. Hence, there was no case of multiple infections. Comparing these sequences with sequences in GenBank matched strains found in various insect taxa, including Lepidoptera (99% match). NJ analysis of the 14 sequences obtained using wsp primers combined with sequences downloaded from GenBank, splits the sequences into three clusters with 100% bootstrap support at each node (Fig. 2b). Infections from bacteria in wsp group 1 were only found in E. christyi, whereas wsp group 2 and 3 were found exclusively in E. autumnata. Interestingly, the two wsp groups infecting E. autumnata were associated with different haplogroups: wsp group 2 occurred only in E. autumnata haplogroup 5, whereas wsp group 3 occurred in haplogroups 1 and 4. Given the observed frequency ratio of 1:2 for the two wsp groups in E. autumnata, the probability that the Wolbachia positives within each of three haplogroups (N = 2, 3 and 4, respectively) would not show mixed wsp genotypes can be estimated to P = 0.039. Hence, we conclude that there was a significant association between Wolbachia strains and E. autumnata haplogroups. Screening for Wolbachia also revealed fragments in E. autumnata haplogroup 2 (2 individuals). The origin of these bands is unknown as no sequences were obtained from the PCR products. However, it would be interesting to sequence these bands in a future study as they might consist of a more divergent Wolbachia strain that requires other suitable primers.
Discussion
We found five distinct mtDNA haplogroups within E. autumnata in northern Europe, but little variation was found in the nuclear regions ITS2 and Wingless. High degree of sympatry and little geographic structure in E. autumnata haplotype distribution was evident. Twelve percent of the screened samples proved to be infected with Wolbachia and there was a close association between particular COI haplogroups within E. autumnata and the different Wolbachia strains.
Mitochondrial and nuclear incongruence
Combining data sets from unlinked genes should be informative in questions regarding species delineation, as unlinked genes are expected to have independent genealogical histories (Maddison 1997). In this study, genetic analysis of gene regions from different genomes (mtDNA and nDNA) gives different estimates of intraspecific variation within E. autumnata. The COI region reveals high sympatric intraspecific divergence (Fig. 2a) with genetic distances ranging from 1.5% to 4.1% (Table 2). One might argue that an intraspecific genetic distance of 4% is not high compared with distances found within other taxa. For example, there are several studies on land snails that show a higher degree of intraspecific divergence than that found within E. autumnata. However, many of these examples concern isolated and/or morphologically distinct populations (Hayashi and Chiba 2000; Shimizu and Ueshima 2000; Bond et al. 2001; Pinceel et al. 2005). In this context, we want to emphasize that the divergent E. autumnata haplogroups occur sympatrically and that the level of genetic distance within E. autumnata is comparable to the level of divergence commonly seen between sister species in Lepidoptera (Huemer and Hausmann 2009; Lukhtanov et al. 2009; Hajibabaei 2006; this study). In contrast to the levels of intraspecific variation found in COI, the ITS2 and Wingless regions show little (∼0.5%) and no variation, respectively (Fig. 3 and 4).
The presence of cryptic species has been suggested to explain high intraspecific divergence in several studies (Hebert et al. 2004; Roe and Sperling 2007; Vaglia et al. 2008). However, the presence of cryptic species predicts divergence in both mtDNA and nDNA and the results from this study show clear incongruence between the two data sets. In addition, preliminary analyses show no obvious intraspecific variation in genital structures and no association between flight period and haplogroups (Kvie & Aarvik, unpublished data). These findings all imply that cryptic speciation is not a likely explanation for high intraspecific mtDNA variation within E. autumnata. Nevertheless, using nuclear markers that evolve faster and that are more variable than Wingless and ITS2 might generate a different result than we found in this study. It is a well-known challenge to find nuclear markers that evolve fast enough to separate between cryptic species (Dasmahapatra and Mallet 2006). However, there are examples of studies performed on closely related- and cryptic arthropod species that have used these nuclear markers successfully (Roe and Sperling 2007; Schmitz et al. 2007; Linares et al. 2009; Dincă et al. 2011; Sun et al. 2011).
As the COI data set implies divergence as far back as 1.7–2.7 million years, a possible hypothesis would be separation of E. autumnata into different glacial refugia in Pleistocene (2 – 0.01 million years ago). It is a common perception that many extant sister taxa diverged during the cyclic climate in this period (Avise and Walker 1998; Avise 2000; Beebee and Rowe 2004). If the variation found in northern E. autumnata mtDNA is a result of separation into several refugia, we would expect some degree of geographic separation restricting gene flow. However, results from the AMOVA (Table 3) shows that most of the genetic variation is found within (98.3%) and not between populations (1.7%). Also, if mtDNA variation in the northern populations is a result of isolation, and we are looking at early stages of speciation, variation should be detectable in both mitochondrial- and nuclear markers (Jiggins and Tinsley 2005). As analysis of E. autumnata nDNA only reveals small amounts of variation and the results from the AMOVA show a small degree of variation between the populations, it is not likely that isolation alone can explain the high mtDNA variation found in this study.
There are European studies showing opposing results. Snäll et al. (2004) analyzed the mtDNA control region investigating the dispersal of E. autumnata females and differentiation between northern- (Norwegian samples) and southern (Finnish samples) E. autumnata populations. They found less variation in northern- compared with southern populations, which they argue might be a result of the northern moths' cyclic population dynamics (Futuyma 1998; Snäll et al. 2004). Their results also revealed moderate levels of divergence between the northern and southern populations. In addition, results from a study performed by Hausmann et al. (2011) showed no variation within Bavarian E. autumnata and the published sequences from that project cluster with moths in haplogroup 2 from this study (data not shown). As the two Scottish samples from our study also cluster together in one group (haplogroup 3, Fig. 2a), it is likely that there is a geographic structure at a larger scale and more samples from a wider range should be investigated.
There are no indications of hybridization between the Norwegian Epirrita species as no shared haplotypes between E. christyi, E. dilutata, and E. autumnata were found. However, ancient introgression by hybridization or introgression from another extant congeneric cannot be ruled out because this will give similar gene genealogy as ancestral polymorphisms caused by isolation (Ballard and Whitlock 2004). It should be noted that in Lepidoptera, females are the heterogametic sex and that according to Haldane's rule (Haldane 1922), hybrid sterility/inviability will be more severe in the heterogametic sex, thereby reducing the likelihood of heterospecific mtDNA introgression (but see Zakharov et al. 2009). Besides, even if both isolation and ancient introgression by hybridization could explain the origin of intraspecific variation in E. autumnata, neither of these processes can explain the high degree of incomplete linage sorting still existing in E. autumnata mtDNA. Geography, ecology, and reproductive barriers are all factors that could maintain variation within a species, but we did not find evidence for any of these factors playing a role in this study. Using nuclear markers that evolve faster, performing more thorough morphometric examinations of genitalia, and testing for other ecological and morphological differences like host plant preference and larvae differentiation could give a more solid basis for concluding about these possibilities.
Association between Wolbachia infections and COI haplogroups
Screening for Wolbachia infections showed infections in E. autumnata and in E. christyi (Fig. 2a and 2b). This result, combined with the results from NJ analysis of the COI region (Fig. 2a) and the AMOVA (Table 3), resembles those of Schulenburg et al. (2002). They examined Eurasian two-spot ladybirds, Adalia bipunctata, infected with endoparasites from the genera Rickettsia and Spiroplasma, in addition to infections by two distinct strains of Wolbachia. Also in this case, did mtDNA sequence analysis show an association between infection status and distribution of haplotypes, but no association between haplotype and geography. However, Shoemaker et al. (2004) showed that Wolbachia-infected species tend to have lower levels of mtDNA diversity than uninfected closely related species. Reduced levels of variation are the most commonly documented effect in Wolbachia-infected populations (Shoemaker et al. 1999; Dean et al. 2003; Jiggins 2003; Shoemaker et al. 2004). Nevertheless, high levels of diversity in mtDNA may be maintained within a population when infected with bacteria of different strains, as different strains might cause selective sweeps on different haplotypes. The diversity will, in these cases, depend on the number of symbionts the population harbors (Hurst and Jiggins 2005). Symbionts like Wolbachia are also known to cause hybrid introgression and possibly balancing selection on cytoplasmic genes and may therefore be an important factor in creating variation within a population or in a species (Jiggins 2003). For example, Jiggins and Tinsley (2005) found significantly elevated levels of mtDNA diversity in infected Adalia bipunctata beetles. They argued that the effects of endoparasitic symbionts can be considerably more complex than simple reduction in diversity following a selective sweep. As several samples in this study tested positive for Wolbachia and there seems to be an association between haplogroups in E. autumnata and infection class, it is possible that the mitochondrial genome of E. autumnata has undergone several Wolbachia infections and subsequent selective sweeps, maintaining the diversity within this species. However, as the test of selection based on Tajima's D gave a non-significant result, we cannot rule out the possibility that drift rather than selective sweeps causes variation to be maintained in this species. Some mtDNA haplotypes and their associated Wolbachia variants might be carried to high frequencies because of the cyclical fluctuations in population size in E. autumnata.
DNA barcoding Lepidoptera
DNA barcoding has proven to be a useful tool for species identification in a wide range of animal species, including Lepidoptera (Hebert et al. 2004; Hajibabaei 2006; Silva-Brandao et al. 2009; Hausmann et al. 2011, but see Elias et al. 2007; Wiemers and Fiedler 2007). This study shows that sequencing the barcode region is sufficient for discriminating between specimens of Norwegian moths in the genus Epirrita, hence fulfilling one of the main objectives of DNA barcoding (species identification of unknown specimens; Hebert et al. 2003). However, our results also demonstrate that delimiting species based on mtDNA divergence alone, whether based on a threshold distance, monophyly, or diagnostic nucleotides (Moritz and Cicero 2004; van Velzen et al. 2012), may lead to erroneous conclusions and inflation of species numbers, supporting previous critiques of the species discovery aspect of DNA barcoding (Moritz and Cicero 2004; Hickerson et al. 2006). It is becoming increasingly clear that integrating information from several independent genetic loci as well as morphological and/or ecological variation is required for defining new species (DeSalle et al. 2005; Galtier et al. 2009; Damm et al. 2010; Dupuis et al. 2012; Towes and Brelsford 2012). As such, DNA barcoding can be a useful method for initial screening of biodiversity, to discover interesting genetic variation worthy of further study.
Concluding remarks
Analysis of the COI region reveals high divergence within E. autumnata compared with the nuclear regions. As 12% of the samples surveyed in this study tested positive for Wolbachia, the COI data set should be interpreted with care. Our analyses revealed no association between the distribution of mitochondrial haplotypes and geography. Nevertheless, ecological and morphological factors should be examined more thoroughly to rule out the possibility of the different haplogroups reflecting early stages of speciation. As there seems to be an association between Wolbachia infections and mtDNA haplogroups, a likely explanation for the divergences in E. autumnata mtDNA is that current populations consist of separate lineages that once evolved in allopatry, without evolving reproductive barriers. At some point, secondary contact is obtained and gene flow reduces variation in the nuclear genome over time, while Wolbachia infections contribute to maintain the variation in the mitochondrial genome. The effect of linage sorting also seems prominent as there is one dominant haplogroup (haplogroup 1, Fig. 2a).
From these findings, we conclude that current taxonomy is correct and it is probable that Wolbachia contributes to intraspecific mtDNA variation by maintaining less common lineages that normally would have been sorted out.
Acknowledgments
We thank the following persons for contributing with moth samples: Kai Berggren, Geir E. E. Søli, Reidar Voith, Anders Endrestøl, Roy Leverton, and Antti Aalto. We also thank Eirik Rindal for contributing with moth samples and for statistical assistance, Jarl Andreas Anmarkrud for help with data analysis and Torbjørn Ekrem for useful comments. The study was financed by the Natural History Museum of Oslo.
Appendix
Table A1.
Information about the samples surveyed in this study, sampling locations, coordinates and collecting dates. Footnotes behind the municipalities show how the Norwegian E. autumnata samples were grouped into four Norwegian regions (used in the AMOVA)
| Tissue sample | Species | Country | Municipality | Coordinates | Collecting date |
|---|---|---|---|---|---|
| NHMO Lep08305 | Epirrita autumnata | Norway | Sør-Varanger1 | 69°33′48.53″N, 30°05′11.19″E | 10-20.VIII.2008 |
| NHMO Lep08306 | Epirrita autumnata | Norway | Sør-Varanger1 | 69°27′09.34″N, 30°03′28.97″E | 9.IX-2.X.2008 |
| NHMO Lep08307 | Epirrita autumnata | Norway | Sør-Varanger1 | 69°33′48.53″N, 30°05′11.19″E | 10-20.VIII.2008 |
| NHMO Lep08308 | Epirrita autumnata | Norway | Sør-Varanger1 | 69°33′48.53″N, 30°05′11.19″E | 10-20.VIII.2008 |
| RVO009 | Epirrita autumnata | Norway | Sør-Varanger1 | 69°22′14.45″N,29°40′43.56″E | 3.VIII-25.IX.2006 |
| NHMO Lep08297 | Epirrita autumnata | Norway | Lierne2 | 64°26′44.32″N, 13°42′57.43″E | 25.IX.2008 |
| NHMO Lep08298 | Epirrita autumnata | Norway | Lierne2 | 64°26′44.32″N, 13°42′57.43″E | 25.IX.2008 |
| NHMO Lep08283 | Epirrita autumnata | Norway | Hol2 | 60°31′33.79″N, 8°18′21.14″E | 5-7.IX.2008 |
| NHMO Lep08284 | Epirrita autumnata | Norway | Hol2 | 60°31′33.79″N, 8°18′21.14″E | 5-7.IX.2008 |
| NHMO Lep08285 | Epirrita autumnata | Norway | Hol2 | 60°31′33.79″N, 8°18′21.14″E | 5-7.IX.2008 |
| NHMO Lep08286 | Epirrita autumnata | Norway | Hol2 | 60°31′33.79″N, 8°18′21.14″E | 5-7.IX.2008 |
| RVO014 | Epirrita autumnata | Norway | Nøtterøy2 | 59°12′20.38″N, 10°33′49.53″E | 5.VIII.2006 |
| KB09008 | Epirrita autumnata | Norway | Oslo2 | 59°53′52.18″N, 10°43′55.37″E | 4-23.IX.2008 |
| KB09009 | Epirrita autumnata | Norway | Oslo2 | 59°53′52.18″N, 10°43′55.37″E | 21.VIII-4.IX.2008 |
| NHMO Lep09111 | Epirrita autumnata | Norway | Hobøl2 | 59°38′30.02″N, 10°59′50.52″E | 25-26.IX.2009 |
| KB09016 | Epirrita autumnata | Norway | Vang2 | 61°09′29.51″N, 8°31′40.88″E | IX.2007 |
| KBE07032 | Epirrita autumnata | Norway | Vang2 | 61°09′29.51″N, 8°31′40.88″E | 1.IX.2006 |
| KBE07033 | Epirrita autumnata | Norway | Vang2 | 61°09′29.51″N, 8°31′40.88″E | 1.IX.2006 |
| KBE07034 | Epirrita autumnata | Norway | Vang2 | 61°09′29.51″N, 8°31′40.88″E | 1.IX.2006 |
| KBE07035 | Epirrita autumnata | Norway | Vang2 | 61°09′29.51″N, 8°31′40.88″E | 1.IX.2006 |
| KBE07036 | Epirrita autumnata | Norway | Vang2 | 61°09′29.51″N, 8°31′40.88″E | 1.IX.2006 |
| KBE07037 | Epirrita autumnata | Norway | Vang2 | 61°09′29.51″N, 8°31′40.88″E | 1.IX.2006 |
| KBE07038 | Epirrita autumnata | Norway | Vang2 | 61°09′29.51″N, 8°31′40.88″E | 1.IX.2006 |
| KBE07039 | Epirrita autumnata | Norway | Vang2 | 61°09′29.51″N, 8°31′40.88″E | 1.IX.2006 |
| KBE07040 | Epirrita autumnata | Norway | Vang2 | 61°09′29.51″N, 8°31′40.88″E | 1.IX.2006 |
| KBE07041 | Epirrita autumnata | Norway | Vang2 | 61°09′29.51″N, 8°31′40.88″E | 1.IX.2006 |
| KBE07042 | Epirrita autumnata | Norway | Vang2 | 61°09′29.51″N, 8°31′40.88″E | 1.IX.2006 |
| KBE07043 | Epirrita autumnata | Norway | Vang2 | 61°09′29.51″N, 8°31′40.88″E | 1.IX.2006 |
| NHMO Lep07087 | Epirrita autumnata | Norway | Ås2 | 60°04′02.28″N, 10°11′15.06″E | 27.IX.2007 |
| KB08011 | Epirrita autumnata | Norway | Lillesand3 | 58°11′07.17″N,8°13′58.90″E | 4.X.2007 |
| KB08012 | Epirrita autumnata | Norway | Lillesand3 | 58°11′07.17″N,8°13′58.90″E | X.2007 |
| KB08013,5 | Epirrita autumnata | Norway | Åseral3 | 58°47′11.51″N,7°19′12.63″E | 11.X.2007 |
| KB08092 | Epirrita autumnata | Norway | Søgne3 | 58°07′37.47″N,7°36′40.09″E | 7.X.2008 |
| KB08093 | Epirrita autumnata | Norway | Søgne3 | 58°07′37.47″N,7°36′40.09″E | 17.X.2008 |
| KB08094 | Epirrita autumnata | Norway | Søgne3 | 58°07′37.47″N,7°36′40.09″E | 17.X.2008 |
| KB08095 | Epirrita autumnata | Norway | Søgne3 | 58°07′37.47″N,7°36′40.09″E | 17.X.2008 |
| KB09097 | Epirrita autumnata | Norway | Søgne3 | 58°07′37.47″N,7°36′40.09″E | 17.X.2008 |
| KB08083 | Epirrita autumnata | Norway | Kristiansand3 | 58°09′39.95″N, 8°05′57.44″E | 29.IX.2008 |
| KB08086 | Epirrita autumnata | Norway | Kristiansand3 | 58°09′39.95″N, 8°05′57.44″E | 6.X.2008 |
| KB08087 | Epirrita autumnata | Norway | Kristiansand3 | 58°12′08.76″N, 8°06′05.92″E | 12.X.2008 |
| KB08101 | Epirrita autumnata | Norway | Kristiansand3 | 58°12′08.76″N, 8°06′05.92″E | 18.X.2008 |
| KB09103 | Epirrita autumnata | Norway | Kristiansand3 | 58°12′08.76″N, 8°06′05.92″E | 12.X.2008 |
| KB09004 | Epirrita autumnata | Norway | Årdal4 | 61°21′19.81″N,7°52′47.72″E | 5-15.IX.2008 |
| KB09005 | Epirrita autumnata | Norway | Årdal4 | 61°21′19.81″N,7°52′47.72″E | 5-15.IX.2008 |
| KB09020 | Epirrita autumnata | Norway | Årdal4 | 61°21′19.81″N,7°52′47.72″E | IX.2008 |
| KB09021 | Epirrita autumnata | Norway | Årdal4 | 61°21′19.81″N,7°52′47.72″E | IX.2008 |
| KB09023 | Epirrita autumnata | Norway | Årdal4 | 61°21′19.81″N,7°52′47.72″E | IX.2008 |
| KB09024 | Epirrita autumnata | Norway | Årdal4 | 61°21′19.81″N,7°52′47.72″E | X.2008 |
| KB09025 | Epirrita autumnata | Norway | Årdal4 | 61°21′19.81″N,7°52′47.72″E | X.2008 |
| KB09026 | Epirrita autumnata | Norway | Årdal4 | 61°21′19.81″N,7°52′47.72″E | X.2008 |
| KB09027 | Epirrita autumnata | Norway | Årdal4 | 61°21′19.81″N,7°52′47.72″E | X.2008 |
| KB09028 | Epirrita autumnata | Norway | Årdal4 | 61°21′19.81″N,7°52′47.72″E | X.2008 |
| RVO021 | Epirrita autumnata | Norway | Suldal4 | 59°29′49.34″N, 6°15′30.65E” | 2.X.2002 |
| RVO010 | Epirrita autumnata | Norway | Suldal4 | 59°32′50.25″N,6°23′13.76″E | 18.X.2004 |
| RVO011 | Epirrita autumnata | Norway | Suldal4 | 59°39′27.09″N,6°52′06.80″E | 24.X.2002 |
| RVO013 | Epirrita christyi | Norway | Klepp | 58°44′23.49″N, 5°30′45.48″E | 14.X.2001 |
| RVO015 | Epirrita christyi | Norway | Nøttery | 59°12′20.38″N, 10°33′49.53″E | IX.2006 |
| RVO016 | Epirrita christyi | Norway | Nøttery | 59°12′20.38″N, 10°33′49.53″E | IX.2006 |
| RVO001 | Epirrita christyi | Norway | Skien | 59°08′00.51″N, 9°39′25.22″E | 11.IX.2008 |
| RVO002 | Epirrita christyi | Norway | Skien | 59°08′00.51″N, 9°39′25.22″E | 11.IX.2008 |
| RVO003 | Epirrita christyi | Norway | Skien | 59°08′00.51″N, 9°39′25.22″E | 11.IX.2008 |
| RVO004 | Epirrita christyi | Norway | Skien | 59°08′00.51″N, 9°39′25.22″E | 11.IX.2008 |
| RVO005 | Epirrita christyi | Norway | Skien | 59°08′00.51″N, 9°39′25.22″E | 11.IX.2008 |
| RVO007 | Epirrita christyi | Norway | Skien | 59°08′00.51″N, 9°39′25.22″E | 11.IX.2008 |
| RVO008 | Epirrita christyi | Norway | Skien | 59°08′00.51″N, 9°39′25.22″E | 11.IX.2008 |
| KB09033 | Epirrita christyi | Norway | Årdal | 61°21′19.81″N, 7°52′47.72″E | 17.X.2008 |
| KBE08098 | Epirrita christyi | Norway | Kristiansand | 58°09′39.95″N, 8°05′57.44″E | 18.X.2008 |
| KBE08100 | Epirrita christyi | Norway | Kristiansand | 58°12′08.76″N, 8°06′05.92″E | 18.XI.2008 |
| NHMO Lep09112 | Epirrita christyi | Norway | Asker | 59°50′10.26″N, 10°28′01.80″E | 1.X.2009 |
| NHMO Lep09113 | Epirrita christyi | Norway | Asker | 59°50′10.26″N, 10°28′01.80″E | 1.X.2009 |
| NHMO Lep09114 | Epirrita christyi | Norway | Asker | 59°50′10.26″N, 10°28′01.80″E | 1.X.2009 |
| NHMO Lep07088 | Epirrita christyi | Norway | Ås | 60°04′02.28″N, 10°11′15.06″E | 27.IX.2007 |
| KBE07046 | Epirrita christyi | Norway | Lillesand | 58°11′07.17″N,8°13′58.90″E | 30.IX.2007 |
| KB08102 | Epirrita dilutata | Norway | Kristiansand | 58°12′08.76″N, 8°06′05.92″E | 28.X.2008 |
| KBE08096 | Epirrita dilutata | Norway | Kristiansand | 58°12′08.76″N, 8°06′05.92″E | 18.X.2008 |
| KBE08097 | Epirrita dilutata | Norway | Kristiansand | 58°12′08.76″N, 8°06′05.92″E | 18.X.2008 |
| KBE08099 | Epirrita dilutata | Norway | Kristiansand | 58°12′08.76″N, 8°06′05.92″E | 18.X.2008 |
| RVO012 | Epirrita dilutata | Norway | Kristiansand | 58°04′06.92″N, 7°58′52.55″E | 1.XI.1999 |
| KBE07047 | Epirrita dilutata | Norway | Lillesand | 58°11′07.17″N,8°13′58.90″E | 14.X.2007 |
| NHMO Lep09105 | Epirrita autumnata | Finland | Lohja | 60°15′01.16″N, 24°04′45.68″E | 29.IX.2008 |
| NHMO Lep09106 | Epirrita autumnata | Finland | Lohja | 60°15′01.16″N, 24°04′45.68″E | 29.IX.2008 |
| NHMO Lep09107 | Epirrita autumnata | Finland | Lohja | 60°15′01.16″N, 24°04′45.68″E | 29.IX.2008 |
| NHMO Lep09108 | Epirrita autumnata | Finland | Hyvinkââ | 60°37′54.63″N, 24°51′51.13″E | 8.X.2008 |
| NHMO Lep09109 | Epirrita autumnata | Finland | Lohja | 60°15′01.16″N, 24°04′45.68″E | 29.IX.2008 |
| NHMO Lep09118 | Epirrita autumnata | Scotland | Banffshire | 57°25′11.28″N, 2°38′35.08″V | 18.X.2009 |
| NHMO Lep09119 | Epirrita autumnata | Scotland | Banffshire | 57°25′11.28″N, 2°38′35.08″V | 18.X.2009 |
| NHMO Lep09120 | Epirrita autumnata | Scotland | Banffshire | 57°25′11.28″N, 2°38′35.08″V | 18.X.2009 |
North.
East.
South.
West.
Appendix
Table A2.
GenBank accession numbers
| Tissue sample | Species | COI | ITS2 | Wingless | wsp |
|---|---|---|---|---|---|
| NHMO Lep08305 | Epirrita autumnata | JX260769 | JN225585 | JN225572 | |
| NHMO Lep08306 | Epirrita autumnata | JX260785 | JN225586 | JN225573 | |
| NHMO Lep08307 | Epirrita autumnata | JX260741 | JN225587 | JN225566 | |
| NHMO Lep08308 | Epirrita autumnata | JX260738 | JN225588 | JN225581 | |
| RVO009 | Epirrita autumnata | JX260749 | JN225606 | JN225568 | JX310341 |
| NHMO Lep08297 | Epirrita autumnata | JX260733 | |||
| NHMO Lep08298 | Epirrita autumnata | JX260786 | |||
| NHMO Lep08283 | Epirrita autumnata | JX260759 | JN225584 | JN225571 | |
| NHMO Lep08284 | Epirrita autumnata | JX260775 | |||
| NHMO Lep08285 | Epirrita autumnata | JX260783 | |||
| NHMO Lep08286 | Epirrita autumnata | JX260782 | |||
| RVO014 | Epirrita autumnata | JX260772 | JN225590 | JN225575 | |
| KB09008 | Epirrita autumnata | JX260758 | JN22600 | ||
| KB09009 | Epirrita autumnata | JX260768 | JN225601 | ||
| NHMO Lep09111 | Epirrita autumnata | JX260754 | |||
| KB09016 | Epirrita autumnata | JX260757 | |||
| KBE07032 | Epirrita autumnata | JX260784 | |||
| KBE07033 | Epirrita autumnata | JX260739 | |||
| KBE07034 | Epirrita autumnata | JX260760 | |||
| KBE07035 | Epirrita autumnata | JX260762 | |||
| KBE07036 | Epirrita autumnata | JX260752 | |||
| KBE07037 | Epirrita autumnata | JX260771 | |||
| KBE07038 | Epirrita autumnata | JX260773 | |||
| KBE07039 | Epirrita autumnata | JX260789 | |||
| KBE07040 | Epirrita autumnata | JX260788 | |||
| KBE07041 | Epirrita autumnata | JX260756 | |||
| KBE07042 | Epirrita autumnata | JX260743 | |||
| KBE07043 | Epirrita autumnata | JX260753 | |||
| NHMO Lep07087 | Epirrita autumnata | JX260779 | |||
| KB08011 | Epirrita autumnata | JX269737 | JN225592 | JN225580 | |
| KB08012 | Epirrita autumnata | JX260787 | JX310345 | ||
| KB08013,5 | Epirrita autumnata | JX260778 | |||
| KB08092 | Epirrita autumnata | JX260745 | |||
| KB08093 | Epirrita autumnata | JX260736 | JN225595 | JX310346 | |
| KB08094 | Epirrita autumnata | JX260744 | JN225596 | JN225567 | |
| KB08095 | Epirrita autumnata | JX260742 | |||
| KB09097 | Epirrita autumnata | JX260780 | JN225604 | ||
| KB08083 | Epirrita autumnata | JX260770 | |||
| KB08086 | Epirrita autumnata | JX260751 | |||
| KB08087 | Epirrita autumnata | JX260791 | JN225593 | JN225577 | JX310342 |
| KB08101 | Epirrita autumnata | JX260746 | |||
| KB09103 | Epirrita autumnata | JX260740 | JN225605 | JN225569 | JX310340 |
| KB09004 | Epirrita autumnata | JX260731 | |||
| KB09005 | Epirrita autumnata | JX260761 | |||
| KB09020 | Epirrita autumnata | JX260790 | |||
| KB09021 | Epirrita autumnata | JX260765 | |||
| KB09023 | Epirrita autumnata | JX260767 | |||
| KB09024 | Epirrita autumnata | JX260766 | |||
| KB09025 | Epirrita autumnata | JX260792 | |||
| KB09026 | Epirrita autumnata | JX260774 | JN225602 | JN225578 | |
| KB09027 | Epirrita autumnata | JX260734 | JN225603 | ||
| KB09028 | Epirrita autumnata | JX260732 | |||
| RVO021 | Epirrita autumnata | JX260747 | JN225591 | JN225576 | |
| RVO010 | Epirrita autumnata | JX260710 | JN225589 | JN225574 | JX310348 |
| RVO011 | Epirrita autumnata | JX260781 | |||
| RVO013 | Epirrita christyi | JX260808 | |||
| RVO015 | Epirrita christyi | JX260796 | |||
| RVO016 | Epirrita christyi | JX260802 | |||
| RVO001 | Epirrita christyi | JX260800 | |||
| RVO002 | Epirrita christyi | JX260806 | |||
| RVO003 | Epirrita christyi | JX260794 | |||
| RVO004 | Epirrita christyi | JX260807 | JN225607 | JN225582 | |
| RVO005 | Epirrita christyi | JX260793 | JN225608 | JN225583 | |
| RVO007 | Epirrita christyi | JX260799 | JX310336 | ||
| RVO008 | Epirrita christyi | JX260797 | |||
| KB09033 | Epirrita christyi | JX260804 | |||
| KBE08098 | Epirrita christyi | JX260809 | |||
| KBE08100 | Epirrita christyi | JX260805 | JX310335 | ||
| NHMO Lep09112 | Epirrita christyi | JX260803 | JX310337 | ||
| NHMO Lep09113 | Epirrita christyi | JX260810 | JX310338 | ||
| NHMO Lep09114 | Epirrita christyi | JX260795 | JX310339 | ||
| NHMO Lep07088 | Epirrita christyi | JX260798 | |||
| KBE07046 | Epirrita christyi | JX260801 | |||
| KB08102 | Epirrita dilutata | JX260814 | JN225610 | ||
| KBE08096 | Epirrita dilutata | JX260813 | |||
| KBE08097 | Epirrita dilutata | JX260816 | JN225609 | ||
| KBE08099 | Epirrita dilutata | JX260812 | |||
| RVO012 | Epirrita dilutata | JX260811 | |||
| KBE07047 | Epirrita dilutata | JX260815 | |||
| NHMO Lep09105 | Epirrita autumnata | JX260764 | JN225594 | JN225570 | JX310347 |
| NHMO Lep09106 | Epirrita autumnata | JX260735 | |||
| NHMO Lep09107 | Epirrita autumnata | JX260763 | |||
| NHMO Lep09108 | Epirrita autumnata | JX260748 | JX310343 | ||
| NHMO Lep09109 | Epirrita autumnata | JX260777 | JX310344 | ||
| NHMO Lep09118 | Epirrita autumnata | JX260750 | JN225598 | ||
| NHMO Lep09119 | Epirrita autumnata | JN225599 | JN225579 | ||
| NHMO Lep09120 | Epirrita autumnata | JX260776 | JN225597 |
Figure A1.
Minimum evolution analysis (Tamura 3-parameter as substitution model) of the COI data set (n = 86), showing the same structure as the NJ analysis, with 5 distinct COI-haplotypes. Bootstrap (10000 iterations) is shown at each node.
Figure A2.
Maximum parsimony analysis (using the complete deletion option) of the COI data set (n = 86). MP analysis also shows high intraspecific variation within E. autumnata. Bootstrap values (500 iterations) are shown at each node.
Data accessibility
DNA sequences, GenBank accession: COI: JX260731-JX260816, ITS2: JN225584-JN225610, Wingless: JN225566-JN225583, Wsp: JX310335-JX310348.
Conflict of Interest
None declared.
References
- Aarvik L, Hansen LO, Kononenko V. Norges sommerfugler, Håndbok over Norges dagsommerfugler og nattsvermere. Oslo (in Norwegian): Norsk entomologisk forening, Naturhistorisk Museum; 2009. p. 174. [Google Scholar]
- Akey JM, Eberle MA, Rieder MJ, Carlson CS, Shriver MD, Nickerson DA, et al. Population history and natural selection shape patterns of genetic variation in 132 genes. PLoS Biol. 2004;2:1591–1599. doi: 10.1371/journal.pbio.0020286. [DOI] [PMC free article] [PubMed] [Google Scholar]
- Avise JC. Mitochondrial DNA and the evolutionary genetics of higher animals. Phil. Trans. R. Soc. Lond. B. 1986;312:325–342. doi: 10.1098/rstb.1986.0011. [DOI] [PubMed] [Google Scholar]
- Avise JC. Phylogeography: the history and formation of species. Cambridge, Mass: Harvard University Press; 2000. pp. 56–59. [Google Scholar]
- Avise JC, Walker D. Pleistocene phylogeographic effects on avian populations and the speciation process. Proc. R. Soc. Lond. B. 1998;265:457–463. doi: 10.1098/rspb.1998.0317. [DOI] [PMC free article] [PubMed] [Google Scholar]
- Avtzis DN, Arthofer W, Stauffer C. Sympatric occurrence of diverged mtDNA lineages of Pityogenes chalcographus (Coleoptera, Scolytinae) in Europe. Biol. J. Linn. Soc. 2008;94:331–340. [Google Scholar]
- Ballard JWO, Whitlock MC. The incomplete natural history of mitochondria. Mol. Ecol. 2004;13:729–744. doi: 10.1046/j.1365-294x.2003.02063.x. [DOI] [PubMed] [Google Scholar]
- Beebee TJC, Rowe G. An introduction to molecular ecology. Oxford: Oxford University Press; 2004. pp. 167–176. [Google Scholar]
- Blaxter ML. The promise of a DNA taxonomy. Phil. Trans. R. Soc. B. 2004;359:669–679. doi: 10.1098/rstb.2003.1447. [DOI] [PMC free article] [PubMed] [Google Scholar]
- Bond JE, Hedin MC, Ramirez MG, Opell BD. Deep molecular divergence in the absence of morphological and ecological change in the Californian coastal dune endemic trapdoor spider Aptostichus simus. Mol. Ecol. 2001;10:899–910. doi: 10.1046/j.1365-294x.2001.01233.x. [DOI] [PubMed] [Google Scholar]
- Braig HR, Zhou W, Dobson SL, O'Neill SL. Cloning and characterization of a gene encoding the major surface protein of the bacterial Endosymbiont Wolbachia pipientis. J. Bacteriol. 1998;180:2373–2378. doi: 10.1128/jb.180.9.2373-2378.1998. [DOI] [PMC free article] [PubMed] [Google Scholar]
- Brower AVZ. Rapid morphological radiation and convergence among races of the butterfly Heliconius erato inferred from patterns of mitochondrial DNA evolution. Proc. Natl Acad. Sci. USA. 1994;91:6491–6495. doi: 10.1073/pnas.91.14.6491. [DOI] [PMC free article] [PubMed] [Google Scholar]
- Brower AVZ. Problems with DNA barcodes for species delimitation: ‘ten species’ of Astraptes fulgerator reassessed (Lepidoptera: Hesperiidae) Syst. Biodivers. 2006;4:127–132. [Google Scholar]
- Brower AVZ, DeSalle R. Patterns of mitochondrial versus nuclear DNA sequence divergence among nymphalid butterflies: the utility of wingless as a source of characters for phylogenetic inference. Insect Mol. Biol. 1998;7:73–82. doi: 10.1046/j.1365-2583.1998.71052.x. [DOI] [PubMed] [Google Scholar]
- Brown B, Emberson R, Paterson A. Phylogenetic relationships within the genus Wiseana (Lepidoptera: Hepialidae) New Zeal J. Zool. 2000;27:1–14. [Google Scholar]
- Chang J, Song DX, Zhou KY. Incongruous nuclear and mitochondrial phylogeographic patterns in two sympatric lineages of the wolf spider Pardosa astrigera (Araneae: Lycosidae) from China. Mol. Phylogenet. Evol. 2007;42:104–121. doi: 10.1016/j.ympev.2006.06.013. [DOI] [PubMed] [Google Scholar]
- Damm S, Schierwater B, Hadrys H. An integrative approach to species discovery in odonates: from character-based DNA barcoding to ecology. Mol. Ecol. 2010;19:3881–3893. doi: 10.1111/j.1365-294X.2010.04720.x. [DOI] [PubMed] [Google Scholar]
- Dasmahapatra KK, Mallet J. DNA barcodes: recent successes and future prospects. Heredity. 2006;97:254–255. doi: 10.1038/sj.hdy.6800858. [DOI] [PubMed] [Google Scholar]
- Dean MD, Ballard KJ, Glass A, Ballard JWO. Influence of two Wolbachia strains on population structure of East African Drosophila simulans. Genetics. 2003;165:1959–1969. doi: 10.1093/genetics/165.4.1959. [DOI] [PMC free article] [PubMed] [Google Scholar]
- DeSalle R, Egan MG, Siddall M. The unholy trinity: taxonomy, species delimitation and DNA barcoding. Phil. Trans. R. Soc. B Biol. Sci. 2005;360:1905–1916. doi: 10.1098/rstb.2005.1722. [DOI] [PMC free article] [PubMed] [Google Scholar]
- Dincă V, Lukhtanov VA, Talavera G, Vila R. Unexpected layers of cryptic diversity in wood white Leptidea butterflies. Nat. Commun. 2011;2:324. doi: 10.1038/ncomms1329. [DOI] [PubMed] [Google Scholar]
- Dupuis JR, Roe AD, Sperling FAH. Multi-locus species delimitation in closely related animals and fungi: one marker is not enough. Mol. Ecol. 2012;21:4422–4436. doi: 10.1111/j.1365-294X.2012.05642.x. [DOI] [PubMed] [Google Scholar]
- Elias MR, Hill I, Willmott KR, Dasmahapatra KK, Brower AVZ, Mallet J, et al. Limited performance of DNA barcoding in a diverse community of tropical butterflies. Proc. R. Soc. B Biol. Sci. 2007;274:2881–2889. doi: 10.1098/rspb.2007.1035. [DOI] [PMC free article] [PubMed] [Google Scholar]
- Excoffier L, Smouse PE, Quattro JM. Analysis of molecular variance inferred from metric distances among DNA haplotypes - application to human mitochondrial - DNA restriction data. Genetics. 1992;131:479–491. doi: 10.1093/genetics/131.2.479. [DOI] [PMC free article] [PubMed] [Google Scholar]
- Excoffier L, Laval G, Schneider S. Arlequin (version 3.0): an integrated software package for population genetics data analysis. Evol. Bioinform. 2005;1:47–50. [PMC free article] [PubMed] [Google Scholar]
- Farrell BD. Evolutionary assembly of the milkweed fauna: Cytochrome oxidase I and the age of Tetraopes beetles. Mol. Phylogenet. Evol. 2001;18:467–478. doi: 10.1006/mpev.2000.0888. [DOI] [PubMed] [Google Scholar]
- Futuyma DJ. Evolutionary biology. 3rd ed. Sunderland, Mass: Sinauer Associates; 1998. [Google Scholar]
- Futuyma DJ. Evolution. Sunderland, Mass: Sinauer Associates; 2005. [Google Scholar]
- Galtier N, Nabholz B, Glemin S, Hurst GDD. Mitochondrial DNA as a marker of molecular diversity: a reappraisal. Mol. Ecol. 2009;22:4541–4550. doi: 10.1111/j.1365-294X.2009.04380.x. [DOI] [PubMed] [Google Scholar]
- Gellissen G, Bradfield JY, White BN, Wyatt GR. Mitochondrial -DNA sequences in the nuclear genome of a locust. Nature. 1983;301:631–634. doi: 10.1038/301631a0. [DOI] [PubMed] [Google Scholar]
- Grandjean F, Rigaud T, Raimond R, Juchault P, Soutygrosset C. Mitochondrial-DNA polymorphism and feminizing sex factors dynamics in a natural-population of Armadillium-vulgare (Crustacea, Isopoda) Genetica. 1993;92:55–60. doi: 10.1007/BF00057507. [DOI] [PubMed] [Google Scholar]
- Hajibabaei M, Janzen DH, Burns JM, Hallwachs W, Hebert PDN. DNA barcodes distinguish species of tropical Lepidoptera. Proc. Natl. Acad. Sci. USA. 2006;103:968–971. doi: 10.1073/pnas.0510466103. [DOI] [PMC free article] [PubMed] [Google Scholar]
- Haldane JBS. Sex ratio and unisexual sterility in hybrid animals. J. Genet. 1922;12:101–109. Proceedings of the National Academy of Sciences of the United States of America, 103, 968-971. [Google Scholar]
- Hausmann A, Haszprunar G, Hebert PDN. DNA Barcoding the Geometrid Fauna of Bavaria (Lepidoptera): successes, Surprises, and Questions. PLoS ONE. 2011;6:e17134. doi: 10.1371/journal.pone.0017134. [DOI] [PMC free article] [PubMed] [Google Scholar]
- Hayashi M, Chiba S. Intraspecific diversity of mitochondrial DNA in the land snail Euhadra peliomphala (Bradybaenidae) Biol. J. Linn. Soc. 2000;70:391–401. [Google Scholar]
- Hebert PDN, Cywinska A, Ball SL, deWaard JR. Biological identifications through DNA barcodes. Proc. R. Soc. Lond. B. 2003;270:313–321. doi: 10.1098/rspb.2002.2218. [DOI] [PMC free article] [PubMed] [Google Scholar]
- Hebert PDN, Penton EH, Burns JM, Janzen DH, Hallwachs W. Ten species in one: DNA barcoding reveals cryptic species in the neotropical skipper butterfly Astraptes fulgerator. Proc. Natl Acad. Sci. USA. 2004;101:14812–14817. doi: 10.1073/pnas.0406166101. [DOI] [PMC free article] [PubMed] [Google Scholar]
- Hickerson M, Meyer C, Moritz C. DNA Barcoding Will Often Fail to Discover New Animal Species over Broad Parameter Space. Syst. Biol. 2006;55:729–739. doi: 10.1080/10635150600969898. [DOI] [PubMed] [Google Scholar]
- Hogner S, Laskemoen T, Lifjeld JT, Porkert J, Kleven O, Albayrak T, et al. Deep sympatric mitochondrial divergence without reproductive isolation in the common redstart Phoenicurus phoenicurus. Ecol. Evol. 2012 doi: 10.1002/ece3.398. (in press). doi: 10.1002/ece3.398. [DOI] [PMC free article] [PubMed] [Google Scholar]
- Huemer P, Hausmann A. A new expanded revision of the European high mountain Sciadia tenebraria. Zootaxa. 2009;2117:1–30. [Google Scholar]
- Hurst GDD, Jiggins FM. Problems with mitochondrial DNA as a marker in population, phylogeographic and phylogenetic studies: the effects of inherited symbionts. Proc. R. Soc. B. 2005;275:1525–1534. doi: 10.1098/rspb.2005.3056. [DOI] [PMC free article] [PubMed] [Google Scholar]
- Hurst GDD, Jiggins FM, Graf von der Schulenburg JH, Bertrand D, West SA, Goriachea II, et al. Male-killing Wolbachia in two species of insect. Proc. R. Soc. B. 1999;266:735–740. [Google Scholar]
- Jepsen JU, Hagen SB, Ims RA, Yoccoz NG. Climate change and outbreaks of the geometrids Operophtera brumata and Epirrita autumnata in subarctic birch forest: evidence of a recent outbreak range expansion. J. Anim. Ecol. 2008;77:257–264. doi: 10.1111/j.1365-2656.2007.01339.x. [DOI] [PubMed] [Google Scholar]
- Jiggins FM. Male-killing Wolbachia and mitochondrial DNA: selective sweeps, hybrid introgression and parasite population dynamics. Genetics. 2003;164:5–12. doi: 10.1093/genetics/164.1.5. [DOI] [PMC free article] [PubMed] [Google Scholar]
- Jiggins FM, Tinsley MC. An ancient mitochondrial polymorphism in Adalia bipunctata linked to a sex-ratio-distorting bacterium. Genetics. 2005;171:1115–1124. doi: 10.1534/genetics.105.046342. [DOI] [PMC free article] [PubMed] [Google Scholar]
- Johnsen A, Rindal E, Ericson PGP, Zuccon D, Kerr KCR, Stoeckle MY, et al. DNA barcoding of Scandinavian birds reveals divergent lineages in trans-Atlantic species. J. Ornithol. 2010;151:565–578. [Google Scholar]
- Jukes TH, Cantor CR. Evolution of protein molecules. Mammalian Protein Metabolism. New York: Academic Press; 1969. pp. 21–132. [Google Scholar]
- Kandul NP, Lukhtanov VA, Dantchenko AV, Coleman JWS, Sekercioglu CH, Haig D, et al. Phylogeny of Agrodiaetus (Hubner 1822) (Lepidoptera : Lycaenidae) inferred from mtDNA sequences of COI and COII and nuclear sequences of EF1-alpha: Karyotype diversification and species radiation. Syst. Biol. 2004;53:278–298. doi: 10.1080/10635150490423692. [DOI] [PubMed] [Google Scholar]
- Kimura M. A simple method for estimating evolutionary rates of base substitutions trough comparative studies of nucleotide sequences. J. Mol. Evol. 1980;16:11–120. doi: 10.1007/BF01731581. [DOI] [PubMed] [Google Scholar]
- Librado P, Rozas J. DnaSP v5: a software for comprehensive analysis of DNA polymorphism data. Bioinformatics. 2009;25:1451–1452. doi: 10.1093/bioinformatics/btp187. [DOI] [PubMed] [Google Scholar]
- Linares MC, Soto-Calderon ID, Lees DC, Anthony NM. High mitochondrial diversity in geographically widespread butterflies of Madagascar: a test of the DNA barcoding approach. Mol. Phylogenet. Evol. 2009;50:485–495. doi: 10.1016/j.ympev.2008.11.008. [DOI] [PubMed] [Google Scholar]
- Lopez JV, Yuhki N, Masuda R, Modi W, Obrien SJ. Numt, a recent transfer and tandem amplification of mitochondrial-DNA to the nuclear genome of the domestic cat. J. Mol. Evol. 1994;39:174–190. doi: 10.1007/BF00163806. [DOI] [PubMed] [Google Scholar]
- Lukhtanov VA, Sourakov A, Zakharov EV, Hebert PDN. DNA barcoding Central Asian butterflies: increasing geographical dimension does not significantly reduce the success of species identification. Mol. Ecol. Resour. 2009;9:1302–1310. doi: 10.1111/j.1755-0998.2009.02577.x. [DOI] [PubMed] [Google Scholar]
- Maddison WP. Gene trees in species trees. Syst. Biol. 1997;46:523–536. [Google Scholar]
- Mayr E. The growth of biological thought: diversity, evolution, and inheritance. Cambrigde, Massachusetts: Belknap Press of Harvard University Press; 1982. [Google Scholar]
- Moore WS. Inferring phylogenies from mtDNA variation- mitochondrial-genetrees versus nuclear-gene trees. Evolution. 1995;49:718–726. doi: 10.1111/j.1558-5646.1995.tb02308.x. [DOI] [PubMed] [Google Scholar]
- Moritz C, Cicero C. DNA Barcoding: promise and Pitfalls. PLoS Biol. 2004;2:1529–1531. doi: 10.1371/journal.pbio.0020354. [DOI] [PMC free article] [PubMed] [Google Scholar]
- Narita S, Shimajiri Y, Nomura M. Strong cytoplasmic incompatibility and high vertical transmission rate can explain the high frequencies of Wolbachia infection in Japanese populations of Colias erate poliographus (Lepidoptera: Pieridae) Bull. Entomol. Res. 2009;99:385–391. doi: 10.1017/S0007485308006469. [DOI] [PubMed] [Google Scholar]
- Nei M. Molecular evolutionary genetics. Press, New York: Columbia Univ; 1987. [Google Scholar]
- Omland KE, Tarr CL, Boarman WI, Marzluff JM, Fleischer RC. Cryptiv genetic variation and paraphyly in ravens. Proc. R. Soc. Lond. B. 2000;267:2475–2482. doi: 10.1098/rspb.2000.1308. [DOI] [PMC free article] [PubMed] [Google Scholar]
- Perna NT, Kocher TD. Patterns of nucleotide composition at a fourfold degenerate sites of animal motochondrial genomes. J. Mol. Evol. 1995;41:353–358. doi: 10.1007/BF00186547. [DOI] [PubMed] [Google Scholar]
- Pinceel JAN, Jordaens K, Pfenninger M, Backeljau T. Rangewide phylogeography of a terrestrial slug in Europe: evidence for Alpine refugia and rapid colonization after the Pleistocene glaciations. Mol. Ecol. 2005;14:1133–1150. doi: 10.1111/j.1365-294X.2005.02479.x. [DOI] [PubMed] [Google Scholar]
- Raychoudhury R, Grillenberger BK, Gadau J, Bijlsma R, Werren L, van de Zande JH, et al. Phylogeography of Nasonia vitripennis (Hymenoptera) indicates a mitochondrial-Wolbachia sweep in North America. Heredity. 2010;104:318–326. doi: 10.1038/hdy.2009.160. [DOI] [PubMed] [Google Scholar]
- Roe AD, Sperling FAH. Population structure and species boundary delimitation of cryptic Dioryctria moths: an integrative approach. Mol. Ecol. 2007;16:3617–3633. doi: 10.1111/j.1365-294X.2007.03412.x. [DOI] [PubMed] [Google Scholar]
- Rokas A, Atkinson RJ, Brown GS, West SA, Stone GN. Understanding patterns of genetic diversity in the oak gallwasp Biorhiza pallida: demographic history or a Wolbachia selective sweep? Heredity. 2001;87:294–304. doi: 10.1046/j.1365-2540.2001.00872.x. [DOI] [PubMed] [Google Scholar]
- Rousset F, Bouchon D, Pintureau B, Juchault P, Solignac M. Wolbachia endosymbionts responsible for various alterations of sexuality in arthropods. Proc. R. Soc. Lond. B. 1992;250:91–98. doi: 10.1098/rspb.1992.0135. [DOI] [PubMed] [Google Scholar]
- Ruohomaki K, Tanhuanpaa M, Ayres MP, Kaitaniemi P, Tammaru T, Haukioja E. Causes of cyclicity of Epirrita autumnata (Lepidoptera, Geometridae): grandiose theory and tedious practice. Popul. Ecol. 2000;42:211–223. [Google Scholar]
- Russell JA, Goldman-Huertas B, Moreau CS, Baldo L, Stahlhut JK, Werren JH, et al. Specialization and geographic isolation among Wolbachia symbionts from ants and Lycaenid butterflies. Evolution. 2009;63:624–640. doi: 10.1111/j.1558-5646.2008.00579.x. [DOI] [PubMed] [Google Scholar]
- Schmitz P, Cibois A, Landry B. Molecular phylogeny and dating of an insular endemic moth radiation inferred from mitochondrial and nuclear genes: the genus Galagete (Lepidoptera: Autostichidae) of the Galapagos Islands. Mol. Phylogenet. Evol. 2007;45:180–192. doi: 10.1016/j.ympev.2007.05.010. [DOI] [PubMed] [Google Scholar]
- Schulenburg J, Hurst GDD, Tetzlaff D, Booth GE, Zakharov IA, Majerus MEN. History of infection with different male-killing bacteria in the two-spot ladybird beetle Adalia bipunctata revealed through mitochondrial DNA sequence analysis. Genetics. 2002;160:1075–1086. doi: 10.1093/genetics/160.3.1075. [DOI] [PMC free article] [PubMed] [Google Scholar]
- Scoble MJ. Geometrid moths of the world: a catalogue. London: Natural History Museum; 1999. pp. 290–291. [Google Scholar]
- Shimizu Y, Ueshima R. Historical biogeography and interspecific mtDNA introgression in Euhadra peliomphala (the Japanese land snail) Heredity. 2000;85:84–96. doi: 10.1046/j.1365-2540.2000.00730.x. [DOI] [PubMed] [Google Scholar]
- Shoemaker DD, Katju V, Jaenike J. Wolbachia and the evolution of reproductive isolation between Drosophila recens and Drosophila subquinaria. Evolution. 1999;53:1157–1164. doi: 10.1111/j.1558-5646.1999.tb04529.x. [DOI] [PubMed] [Google Scholar]
- Shoemaker DD, Dyer KA, Ahrens M, McAbee K, Jaenike J. Decreased diversity but increased substitution rate in host mtDNA as a consequence of Wolbachia endosymbiont infection. Genetics. 2004;168:2049–2058. doi: 10.1534/genetics.104.030890. [DOI] [PMC free article] [PubMed] [Google Scholar]
- Silva-Brandao KL, Lyra ML, Freitas AVL. Barcoding Lepidoptera: current situation and perspectives on the usefulness of a contentious technique. Neotrop. Entomol. 2009;38:441–451. doi: 10.1590/s1519-566x2009000400001. [DOI] [PubMed] [Google Scholar]
- Skou P. Nordens målere: håndbog over de danske fennoskanadiske arter af Drepanidae og Geometridae (Lepidoptera) København: Fauna Bøger; 1984. pp. 117–119. [Google Scholar]
- Snäll N, Huoponen K, Saloniemi I, Savontaus ML, Ruohomaki K. Dispersal of females and differentiation between populations of Epirrita autumnata (Lepidoptera: Geometridae) inferred from variation in mitochondrial DNA. Eur. J. Entomol. 2004;101:495–502. [Google Scholar]
- Song H, Buhay JE, Whiting MF, Crandall KA. Many species in one: DNA barcoding overestimates the number of species when nuclear mitochondrial pseudogenes are coamplified. Proc. Natl Acad. Sci. USA. 2008;105:13486–13491. doi: 10.1073/pnas.0803076105. [DOI] [PMC free article] [PubMed] [Google Scholar]
- Sun XJ, Xiao JH, Cook JM, Feng G, Huang DW. Comparisons of host mitochondrial, nuclear and endosymbiont bacterial genes reveal cryptic fig wasp species and the effects of Wolbachia on host mtDNA evolution and diversity. BMC Evol. Biol. 2011;11:86. doi: 10.1186/1471-2148-11-86. [DOI] [PMC free article] [PubMed] [Google Scholar]
- Tajima F. Statistical-method for testing the neutral mutation hypothesis by DNA polymorphism. Genetics. 1989;123:585–595. doi: 10.1093/genetics/123.3.585. [DOI] [PMC free article] [PubMed] [Google Scholar]
- Tamura K. Estimation of the number of nucleotide substitutions when there are strong transition-transversion and G + C-content biases. Mol. Biol. Evol. 1992;9:678–687. doi: 10.1093/oxfordjournals.molbev.a040752. [DOI] [PubMed] [Google Scholar]
- Tamura K, Dudley J, Nei M, Kumar S. MEGA4: molecular evolutionary genetics analysis (MEGA) software version 4.0. Mol. Biol. Evol. 2007;24:1596–1599. doi: 10.1093/molbev/msm092. [DOI] [PubMed] [Google Scholar]
- Tamura K, Peterson D, Peterson N, Stecher G, Nei M, Kumar S. MEGA5: molecular evolutionary genetics analysis using maximum likelihood, evolutionary distance, and maximum parsimony methods. Mol. Biol. Evol. 2011;28:2731–2739. doi: 10.1093/molbev/msr121. [DOI] [PMC free article] [PubMed] [Google Scholar]
- Tenow O. The outbreaks of Oporinia autumnata Bkh. and Operophthera spp. (Lep., Geometridae) in the Scandinavian mountain chain and northern Finland 1862-1968. Uppsala: Almqvist & Wiksell; 1972. [Google Scholar]
- Towes DPL, Brelsford A. The biogeography of mitochondrial and nuclear discordance in animals. Mol. Ecol. 2012;21:3907–3930. doi: 10.1111/j.1365-294X.2012.05664.x. [DOI] [PubMed] [Google Scholar]
- Vaglia T, Haxaire J, Kitching IJ, Meusnier I, Rougerie R. Morphology and DNA barcoding reveal three cryptic species within the Xylophanes neoptolemus and loelia species-groups (Lepidoptera: Sphingidae) Zootaxa. 2008;36:18–36. [Google Scholar]
- van Velzen R, Weitschek E, Felici G, Bakker FT. DNA barcoding of recently diverged species: relative performance of matching methods. PLoS ONE. 2012;7:e30490. doi: 10.1371/journal.pone.0030490. [DOI] [PMC free article] [PubMed] [Google Scholar]
- Watterson GA. On the number of segregating sites in genetical models without recombination. Theor. Popul. Biol. 1975;7:256–276. doi: 10.1016/0040-5809(75)90020-9. [DOI] [PubMed] [Google Scholar]
- Werren JH. Biology of Wolbachia. Annu. Rev. Entomol. 1997;42:587–609. doi: 10.1146/annurev.ento.42.1.587. [DOI] [PubMed] [Google Scholar]
- Werren JH, Zhang W, Guo LR. Evolution and phylogeny of Wolbachia-reproductive parasites of arthropods. Proc. R. Soc. Lond. B. 1995;261:55–63. doi: 10.1098/rspb.1995.0117. [DOI] [PubMed] [Google Scholar]
- White TJ, Bruns T, Lee S, Taylor J. Amplification and direct sequencing of fungal ribosomal RNA genes for phylogeneics. New York: Academic Press Inc; 1990. [Google Scholar]
- Wiemers M, Fiedler K. Does the DNA barcoding gap exist? - a case study in blue butterflies (Lepidoptera: Lycaenidae) Front. Zool. 2007;4:8. doi: 10.1186/1742-9994-4-8. [DOI] [PMC free article] [PubMed] [Google Scholar]
- Wright S. The genetical structure of populations. Ann. Eugen. 1951;15:323–354. doi: 10.1111/j.1469-1809.1949.tb02451.x. [DOI] [PubMed] [Google Scholar]
- Yang SY, Ruuhola T, Haviola S, Rantala MJ. Effects of host-plant shift on immune and other key life-history traits of an eruptive Geometrid, Epirrita autumnata (Borkhausen) Ecol. Entomol. 2008;33:510–516. [Google Scholar]
- Zakharov EV, Lobo NF, Nowak C, Hellmann JJ. Introgression as a likely cause of mtDNA paraphyly in two allopatric skippers (Lepidoptera: Hesperiidae) Heredity. 2009;102(6):590–599. doi: 10.1038/hdy.2009.26. [DOI] [PubMed] [Google Scholar]
Associated Data
This section collects any data citations, data availability statements, or supplementary materials included in this article.
Data Availability Statement
DNA sequences, GenBank accession: COI: JX260731-JX260816, ITS2: JN225584-JN225610, Wingless: JN225566-JN225583, Wsp: JX310335-JX310348.