

Abstract
Caspase proteases are principal mediators of apoptosis, where they cleave hundreds of proteins. Phosphorylation also plays an important role in apoptosis, although the extent to which proteolytic and phosphorylation pathways crosstalk during programmed cell death remains poorly understood. Using a quantitative proteomic platform that integrates phosphorylation sites into the topographical maps of proteins, we identify a cohort of over 500 apoptosis-specific phosphorylation events and show that they are enriched on cleaved proteins and clustered around sites of caspase proteolysis. We find that caspase cleavage can expose new sites for phosphorylation, and, conversely, that phosphorylation at the +3 position of cleavage sites can directly promote substrate proteolysis by caspase-8. This study provides a global portrait of the apoptotic phosphoproteome, revealing heretofore unrecognized forms of functional crosstalk between phosphorylation and caspase proteolytic pathways that lead to enhanced rates of protein cleavage and the unveiling of new sites for phosphorylation.
Proteolysis and phosphorylation are two of the most pervasive forms of protein post-translational modification, playing essential roles in the majority of (patho)physiological processes, including tissue development, cancer, and cell death (Kurokawa and Kornbluth, 2009; Lopez-Otin and Hunter, 2010). Apoptosis, or programmed cell death, is orchestrated by a family of cysteine proteases called caspases, which cleave their protein substrates after aspartic acid residues (Crawford and Wells, 2011; Fuentes-Prior and Salvesen, 2004; Thornberry and Lazebnik, 1998). Recent advances in global protease substrate identification technologies have generated a large inventory of proteins that are cleaved by caspases during apoptosis, demonstrating that as much as 5% of the proteome is subject to caspase-mediated proteolysis (Arntzen and Thiede, 2011; Crawford and Wells, 2011).
Protein kinases are prominently represented among caspase substrates and, in some cases, cleavage activates these kinases so that they can perform important functions in apoptosis (Kurokawa and Kornbluth, 2009). Caspase-mediated activation of Rho-associated kinase 1 (ROCK1), for instance, promotes the characteristic membrane blebbing associated with apoptosis (Coleman et al., 2001). Kinases can also be inactivated by caspase-mediated cleavage to block their activity during apoptosis (Kurokawa and Kornbluth, 2009). The crosstalk between caspases and kinases also includes the phosphorylation of caspases to either enhance or suppress their activity (Kurokawa and Kornbluth, 2009). Likewise, the phosphorylation of some caspase substrates, notably BID phosphorylation on Thr59 (which is the P2 residue of the caspase-8 cleavage site) blocks caspase cleavage (Degli Esposti et al., 2003). These findings suggest that caspase and kinase pathways interact in intricate ways to influence the balance between cell survival and death. Nonetheless, whether a more global relationship between proteolysis and phosphorylation exists in apoptosis has not been investigated.
We recently introduced a proteomic method termed PROTOMAP (short for Protein Topography and Migration Analysis Platform) that can be used to characterize proteolytic events in cells by detecting shifts in protein migration through a combination of SDS-PAGE and mass spectrometry (MS)-based proteomics (Dix et al., 2008). Using this approach, we identified over 250 cleaved proteins in apoptotic cells, including 170 proteins that were not previously known to be cleaved by caspases. In the current study, we sought to create an advanced, quantitative version of PROTOMAP that enables simultaneous analysis of proteolytic and phosphorylation processes in cells, such that phosphorylation sites could be directly integrated into the topographical maps of cleaved proteins during apoptosis. We applied this method to study the intrinsic apoptotic cascade in Jurkat T-cells, resulting in the identification of more than 700 cleaved proteins and 5,000 sites of phosphorylation. The integration of these global datasets revealed that phosphorylation events are enriched on cleaved proteins and are clustered around sites of caspase cleavage. We further identified a cohort of previously unreported phosphorylation sites that were specific to apoptotic cells, suggesting the existence of a heretofore uncharacterized cell death-related phosphorylation network. We show using activity-based proteomic methods that at least a part of this network is driven by caspase-mediated activation of DNA-dependent protein kinase (DNA-PK) at early stages during the time course of apoptosis. Finally, we interrogated the functional relationship between proteolysis and phosphorylation, uncovering heretofore unrecognized forms of crosstalk that include the caspase processing of proteins to expose new sites for phosphorylation and the phosphorylation of proteins at the +3 (P3) position of caspase recognition sequences to dramatically enhance proteolysis by caspase-8.
RESULTS
Quantitative proteomic analysis of phosphorylation and proteolysis by qP-PROTOMAP
The proteomic measurement of dynamic post-translational modifications, like phosphorylation, requires quantification of individual peptides, and we therefore sought to combine PROTOMAP with stable isotopic labeling methods (SILAC; Ong et al., 2002) for this purpose. We also needed to incorporate a phosphopeptide enrichment step without sacrificing the protein size and topography information provided by the SDS-PAGE step of the original PROTOMAP method. The workflow for the resulting quantitative phospho-PROTOMAP (or qP-PROTOMAP) platform was therefore as follows (Figure 1A): Control and apoptotic cells were grown in media containing isotopically light and heavy amino acids, respectively. Equal quantities of each cell proteome were then combined and separated by SDS-PAGE. Next, as in the original PROTOMAP method, gel lanes were sliced into 22 evenly spaced bands that were digested in-gel with trypsin to extract peptides. Phosphopeptides were then enriched via immobilized metal-affinity chromatography (IMAC) and subjected to reverse-phase liquid chromatography and MS analysis on an LTQ-Velos Orbitrap. Flow-through from the IMAC step (containing unphosphorylated peptides) was also analyzed, and the combined SILAC ratios of unphosphorylated and phosphorylated peptides were integrated into quantitative peptographs to provide a complete picture of protein phosphorylation and proteolysis.
Figure 1. Quantitative profiling of phosphorylation and proteolytic pathways in apoptosis by qP-PROTOMAP.
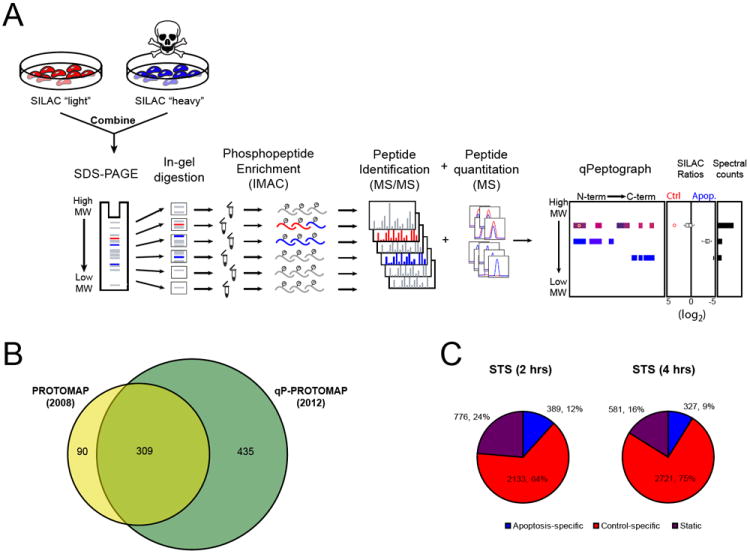
(A) General features of qP-PROTOMAP method as described in the main text. Peptides are colored red and blue to represent signals detected in healthy control (light) and apoptotic cells (heavy), respectively. (B) Number of cleaved proteins detected using the original PROTOMAP method (Dix et al., 2008) versus qP-PROTOMAP as described in this study. See Table S1 for peptographs of cleaved proteins identified by qP-PROTOMAP. (C) Distribution of phosphorylation events identified in control and apoptotic cells by qP-PROTOMAP. Phosphorylation events were designated “control-specific” or “apoptosis-specific” if they showed light/heavy SILAC ratios of > 2 or < 0.5, respectively (corresponding to log2 values of 1 or -1). Phosphorylation events displaying light/heavy ratios between - these values were designated as “static”.
Peptographs for qP-PROTOMAP experiments display detected peptides from left-to-right based on their position in the primary sequence of their proteins, and from top-to-bottom depending on the gel band in which they were detected (the vertical dimension thus represents molecular weight) (Figure 1A). Phosphopeptides are marked by a circle. For the purposes of quantitation, each peptide is assigned a color on a continuum from red to blue reflecting the light/heavy ratio: peptides exhibiting no-change (1:1 ratio) are displayed in purple; control- and apoptosis-specific peptides are shown in red and blue, respectively. To facilitate visual interpretation of these quantified peptide data, a box plot is provided in the middle panel (to the right of the peptograph) that displays the distribution of ratios found in each band. Spectral-count information is displayed in a third panel to enable estimation of the relative abundance of each protein isoform. Most importantly, because qP-PROTOMAP integrates phosphorylation sites into the topographical maps of cleaved proteins, the approach can determine the precise protein isoforms that possess individual phosphorylation events. Thus, we are able to identify phosphorylation events that may occur exclusively on full-length proteins or, alternatively, on fragments of these proteins generated during apoptosis. We present an example peptograph and more details on its interpretation in Figure S1.
For our assessment of crosstalk between proteolysis and phosphorylation, we induced the intrinsic apoptotic pathway in Jurkat T-cells with staurosporine (“STS”). While it might initially seem counterintuitive to use a broad-spectrum kinase inhibitor like STS to study phosphorylation events in apoptosis, we hypothesized that this drug, through the inhibition of many kinases, might simplify the phosphoproteome to facilitate the characterization of phosphorylation events that were important for programmed cell death. Indeed, we, and others, have shown that STS induces a highly efficient apoptotic cascade in Jurkat T-cells that is essentially complete by ~6 hours (Dix et al., 2008; Na et al., 1996; Stolzenberg et al., 2000), and we therefore expected that any kinase pathways relevant for this rapid cell death process would necessarily be insensitive to this drug. We therefore analyzed STS-treated Jurkat cells at an ‘early’ (2 hr) and ‘late’ (4 hr) stage of apoptosis by qP-PROTOMAP. In total, 4,521 proteins were detected across both time points, and 5,034 sites of phosphorylation were quantified on serine, threonine, or tyrosine residues from 1,624 of the proteins (36% of all proteins detected). Peptographs were generated for each protein at both time points, enabling rapid visual interpretation of their (1) cleavage status, (2) cleavage magnitude, and (3) phosphorylation status on individual protein isoforms in a time-dependent manner.
Quantitative analysis of cleaved proteins in apoptotic cells by qP-PROTOMAP
We initially evaluated the performance of qP-PROTOMAP as a global method for characterizing cleaved proteins, which were expected to: (1) possess multiple peptides in the parental protein band that substantially deviate from the 1:1 SILAC ratio observed for uncleaved proteins, and/or (2) display persistent protein fragments selectively in apoptotic cells. We developed abundance thresholds for quantifying the cleavage state of proteins, and, out of 2,867 proteins that met these thresholds, 744 of them (26%) showed strong evidence of cleavage (Table S1, see the Supplemental Experimental Procedures for details). A majority of the cleaved proteins identified in our original PROTOMAP study were also observed to be cleaved by qP-PROTOMAP (77%, Figure 1B), and we detected 349 proteins that had not been previously described in the literature as caspase substrates (Table S1). Considerably more proteins were found to be cleaved than has been previously reported, both in absolute number and as a percent of the proteome. This can be ascribed to the higher accuracy and sensitivity that is achievable using SILAC quantitation, enabling high-confidence assessments of lower-abundance proteins. As reported previously (Dix et al., 2008), the majority of cleaved proteins (67%) displayed one or more persistent fragments (Table S1).
Quantitative analysis of the phosphoproteome in apoptotic cells by qP-PROTOMAP
We next assessed the performance of qP-PROTOMAP as a global method for characterizing phosphorylation events in apoptotic cells. Phosphorylation events that showed > 2-fold SILAC ratios in control or apoptotic cells were defined as “control-specific” or “apoptosis-specific”, respectively. We should note the potential for these phosphopeptide SILAC ratios to be influenced by the cleavage of proteins. For instance, reductions in protein abundance during apoptosis could indirectly cause a loss of phosphopeptide signals. Conversely, the stochastic nature of peptide detection in individual data-dependent MS runs could result in the identification of a static phosphorylation event exclusively on one isoform of a protein. We attempted to address at least some of the complexities by performing numerous replicates for our phosphoproteomic experiments (see Supplemental Experimental Procedures for details), which yielded rapidly diminishing returns for unique phosphorylation-site identification with each replicate (Figure S2).
A global analysis of SILAC ratios for the 5,060 phosphorylation events identified in our combined qP-PROTOMAP datasets led to several important discoveries. First, a majority of phosphorylation events (> 85%) either showed no change or were elevated in control cells (Figure 1C). This is not a surprising result given that we induced apoptosis with the broad-spectrum kinase inhibitor STS. Even with this mode of inducing apoptosis, however, we still identified 531 phosphorylation sites that were apoptosis-specific (Figure 1C, Table S2). Striking examples included the pSer347 and pSer882 events in the retinoblastoma protein (RB1) (Figure 2A, features “1” and “2”, respectively), a well-studied tumor suppressor that is known to be cleaved at two distinct caspase sites following the induction of apoptosis (Fattman et al., 2001). We identified 18 additional sites of phosphorylation on RB1, virtually all of which were control-specific (Figure 2A and 2B). Most of these control-specific phosphorylation events occurred at well-characterized sites identified in numerous (> 10) independent studies as determined by searches of the PhosphoSite database (Hornbeck et al., 2011) (Figure 2B); interestingly, however, the apoptosis-specific pSer347 and pSer882 events had only been reported rarely in previous phosphoproteomic analysis (≤ 3 times each; Figure 2B) and, in the case of pSer347, only in Jurkat cells treated with pervanadate, a known pro-apoptotic stimulus (Hehner et al., 1999). These initial data suggested that apoptosis might activate a special phosphorylation network that is distinct in content from other cellular processes. We more systematically assessed this possibility by comparing the “novelty” of static, control-specific, or apoptosis-specific phosphorylation events, as estimated by the absence of annotation of these events in the PhosphoSite database. Strikingly, close to half of the apoptosis-specific phosphorylation sites were previously unreported in the literature, while less than 15% of the static/control-specific phosphorylation sites fell into this category (Figure 2C). Apoptosis-specific phosphorylation events were also underrepresented among phosphorylations that were frequently detected in the literature (≥ 5 citations) (Figure 2D). We conclude from these data that apoptosis leads to the activation of a specific set of kinases (and/or inactivation of phosphatases) to create a rare pool of phosphorylation events that are not observed in healthy cells.
Figure 2. Identification of a cohort of apoptosis-specific phosphorylation events.
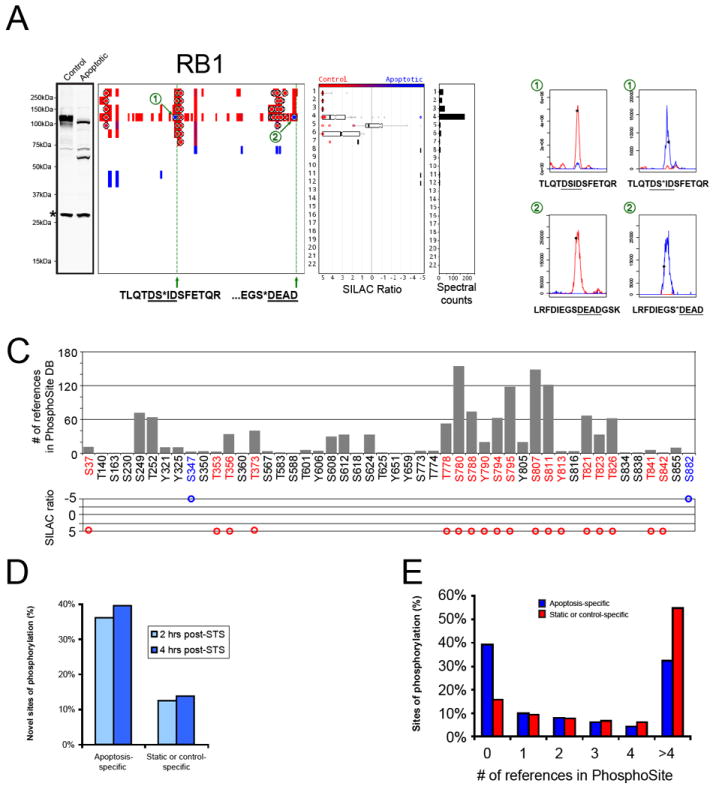
(A) Western blot and quantitative peptograph for RB1 at 4 hr post-STS treatment. Two apoptosis-specific phosphorylation events were identified at Ser347 (1) and Ser882 (2). To the right of the peptograph, representative MS1 chromatographs for phosphorylated and unphosphorylated versions of these peptides are shown in which light (control) and heavy (apoptotic) signals are colored red and blue, respectively. Green lines mark known sites of caspase cleavage (Fattman et al., 2001) that likely generate the observed N-terminal and internal fragments visible on the peptograph and, in the case of the internal fragment, by Western blotting. Asterisk denotes a non-specific band on the blot. (C) Shown are the 39 phosphorylation sites on RB1 listed in the PhosphoSite database, along with the number of literature references for each site. Note that the two apoptosis-specific phosphorylation events (blue) were either not previously reported (Ser347) or reported only once (Ser882), in contrast to control-specific phosphorylation events (red), which were, in general, detected in many previous studies. Below each phosphorylation site, we show the corresponding SILAC ratios. Sites shown in black were not detected in our study. (D) ~40% of apoptosis-specific phosphorylation events have not been reported previously based on PhosphoSite database searches. In contrast, only ~13% of static or control-specific phosphorylation events fall into this category. (E) Histogram showing the number of literature references found in the PhosphoSite database for apoptosis-specific (blue) and static or control-specific (red) phosphorylation events. Note that apoptosis-specific events are overrepresented in the previously unreported group (zero references), while static or control-specific events are overrepresented in the group with many previous identifications (> 4 references).
A closer examination of the apoptosis-specific phosphorylation sites on RB1 uncovered another provocative feature – both of these events are proximal to known sites of caspase cleavage (green lines in Figure 2A) that generate persistent fragments detectable by qp-PROTOMAP and western blotting (Figure 2A). The pSer347 event, for instance, occurs just two residues upstream (the P3 position) from the scissile aspartate (Fattman et al., 2001). The pSer882 event is located four residues upstream of a known scissile aspartate (at the P5 position, Fattman et al., 2001) and was identified by qP-PROTOMAP on a half-tryptic peptide ending at this residue, indicating that the phosphorylation event resides on a caspase-cleaved fragment of RB1 (in this case, the cleavage event is not expected to produce a shift in gel migration of RB1, since cleavage occurs near the C-terminus of the protein). These observations led us to wonder if such cleavage-site-proximal phosphorylation events were unique to RB1, or whether they might represent a more general phenomenon that occurs during apoptosis.
Systems-wide crosstalk between proteolysis and phosphorylation during apoptosis
To evaluate how phosphorylation events that occur during apoptosis might globally intersect with caspase-mediated proteolysis, we compiled all of the known sites of caspase cleavage, including 75 sites that were newly identified in the current study (Table S3), to give 679 total sites on 566 distinct proteins. 413 of these proteins were detected in our analysis of Jurkat T-cells, and we aligned their sequences such that they were all anchored around the scissile P1 aspartate residue. We then searched for phosphorylation events in our data sets that were located 200 residues up- or down-stream of the P1 residues, resulting in the discovery of ~675 such phosphorylation events on 210 proteins. These phosphorylation sites were strikingly clustered in the region immediately surrounding the scissile aspartate, in particular from the P6 to P6 residues (shaded region in Figure 3A; also see Table 1). This clustering was evident not only for apoptosis-specific phosphorylation events, but also for static and control-specific phosphorylation events (Figure S2). We furthermore found that known caspase substrates were more likely to be phosphorylated in Jurkat T-cells than were uncleaved proteins (Figure 3B).
Figure 3. Global crosstalk between phosphorylation and proteolytic pathways in apoptosis.
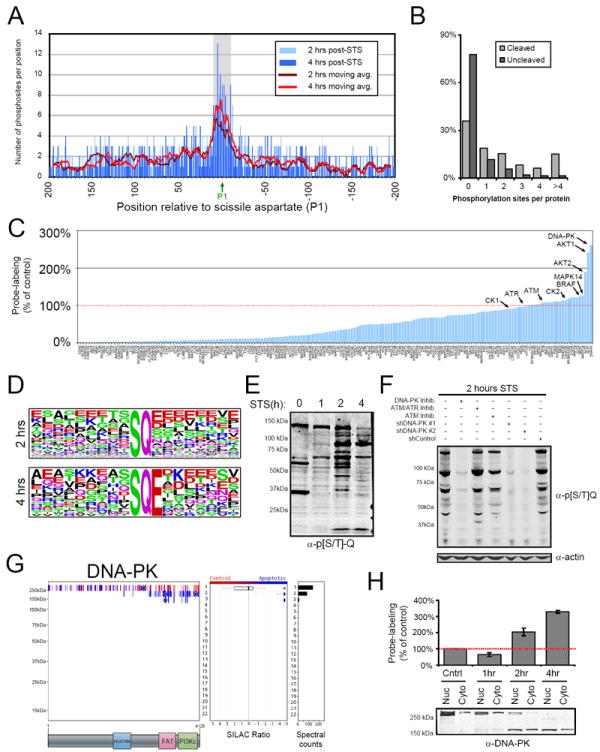
(A) Phosphorylation events are found near sites of caspase cleavage in apoptotic cells. 210 proteins observed in our data that contain known sites of caspase cleavage were aligned around their scissile aspartate residues (P1) and the number of phosphorylation sites detected +/- 200 residues are shown. The region of enrichment of phosphorylation surrounding scissile aspartate residues is shaded. (B) Caspase-cleaved proteins are more likely to be phosphorylated than uncleaved proteins. (C) Kinase activity profiles in Jurkat T-cells as measured by KiNativ analysis at 2 hr post-STS treatment relative to kinase activities measured in control cells (see Table S4 for full KiNativ data sets generated at 1, 2, and 4 hr post-STS treatment). (D) The most highly over-represented motifs for apoptosis-specific phosphorylation events as determined by the motif-x algorithm (also see Table S4). (E) Anti-p[S/T]-Q western blot showing increased phosphorylation of [S/T]-Q motifs following induction of apoptosis. (F) Anti-p[S/T]-Q blot demonstrating that DNA-PK, but not ATM or ATR kinases, is responsible for the apoptosis-related increase in p[S/T]-Q events. (G) Quantitative peptograph showing proteolysis of DNA-PK at 2 hr post-STS treatment. The C-terminal persistent fragment contains the PI-3-kinase-like catalytic domain. (H) Confirmation by western blotting that, upon induction of apoptosis, DNA-PK is cleaved and a C-terminal fragment containing the kinase domain translocates from the nucleus (Nuc) to the cytoplasm (Cyto). The cleavage kinetics for DNA-PK match closely the kinetics of DNA-PK activation as measured by KiNativ (bar graph) or p[S/T]-Q immunoreactivity (E). Data in (H) are presented as means ± standard error of the mean (SEM). See also Figure S2.
Table 1.
Apoptosis-specific phosphorylation sites found within six residues (P6-P6’) of caspase cleavage sites. See Table S1 for corresponding peptographs of the proteins.
| IPI Number | Symbol | Phosphosite | Sequence | Position |
|---|---|---|---|---|
| IPI00007423 | ANP32B | 158 | S*DAEVD∣GVDEEE | P6 |
| IPI00032064 | PALM2-AKAP2 | 698 | T*QEELD∣SGLDEL | P6 |
| IPI00794135 | SPTBN1 | 1454 | S*TDEVD∣SKRLTV | P6 |
| IPI00004363 | STK39 | 387 | S*DDEMD∣EKSEEG | P6 |
| IPI00438229 | TRIM28 | 683 | S*LDGAD∣STGVVA | P6 |
| IPI00465428 | VPS13C | 1400 | S*QDVHD∣SKNTLT | P6 |
| IPI00026156 | HCLS1 | 111 | HS*SQTD∣AAKGFG | P5 |
| IPI00003168 | PRPSAP2 | 219 | ES*DLVD∣GRHSPP | P5 |
| IPI00302829 | RB1 | 882 | GS*DEAD∣GSKHLP | P5 |
| IPI00026156 | HCLS1 | 112 | HSS*QTD∣AAKGFG | P4 |
| IPI00376199 | IRF2BP2 | 492 | PAS*LPD∣SSLATS | P4 |
| IPI00029822 | SMARCA4 | 699 | DVS*EVD∣ARHIIE | P4 |
| IPI00292140 | CASP3 | 26 | GSES*MD∣SGISLD | P3 |
| IPI00855957 | KHSRP | 100 | NNST*PD∣FGFGGQ | P3 |
| IPI00604620 | NCL | 591 | LKES*FD∣GSVRAR | P3 |
| IPI00026940 | NUP50 | 246 | TEDT*PD∣KKMEVA | P3 |
| IPI00302829 | RB1 | 347 | QTDS*ID∣SFETQR | P3 |
| IPI00745092 | SPTAN1 | 1484 | KGDS*LD∣SVEALI | P3 |
| IPI00178440 | EEF1B2 | 153 | WDDET*D∣MAKLEE | P2 |
| IPI00395014 | RSRC1 | 237 | EAIES*D∣SFVQQT | P2 |
| IPI00221106 | SF3B2 | 861 | KEDFS*D∣MVAEHA | P2 |
| IPI00329528 | VPRBP | 1421 | DDDDT*D∣DLDELD | P2 |
| IPI00304171 | H2AFY | 173 | KAASAD∣S*TTEGT | P1’ |
| IPI00745092 | SPTAN1 | 1484 | TEDKGD∣S*LDSVE | P1’ |
| IPI00219913 | USP14 | 228 | SVKETD∣S*SSASA | P1’ |
| IPI00604620 | NCL | 595 | LKESFD∣GS*VRAR | P2’ |
| IPI00397904 | NUP93 | 159 | GEDALD∣FT*QESE | P2’ |
| IPI00219913 | USP14 | 229 | SVKETD∣SS*SASA | P2’ |
| IPI00166394 | ARMC10 | 89 | PEDLTD∣GSY*DDV | P3’ |
| IPI00747447 | EIF3B | 164 | PEDFVD∣DVS*EEE | P3’ |
| IPI00102670 | FNBP1 | 522 | DRESPD∣GSY*TEE | P3’ |
| IPI00028065 | NCK1 | 91 | KPSVPD∣SAS*PAD | P3’ |
| IPI00221106 | SF3B2 | 302 | EEMETD∣ARS*SLG | P3’ |
| IPI00219913 | USP14 | 230 | SVKETD∣SSS*ASA | P3’ |
| IPI00455210 | CHD4 | 367 | EVTAVD∣GYET*DH | P4’ |
| IPI00000856 | PLEKHC1 | 351 | EVDEVD∣AALS*DL | P4’ |
| IPI00604620 | NCL | 206 | DEDDDD∣DEEDDS* | P6’ |
| IPI00163505 | RBM39 | 337 | VTERTD∣ASSASS* | P6’ |
We next asked whether the phosphorylation events that occurred in apoptotic cells were catalyzed by a specific set of kinases. To discover kinases that might be activated during apoptosis, we employed a functional proteomic platform termed KiNativ. The KiNativ technology uses active site-directed chemical probes containing biotin-conjugated electrophilic analogues of ATP or ADP for covalent capture of ATP-binding proteins from proteomes. Conserved lysines in kinase active sites react with the probes and are then enriched and quantified with streptavidin chromatography and targeted MS analysis, respectively (Patricelli et al., 2011, see Supplemental Experimental Procedures for details). The majority of kinases showed reduced KiNativ signals in apoptotic cells (Figure 3C and Table S4), likely reflecting inhibition by STS. However, a handful of kinases showed stronger KiNativ signals in STS-treated cells, the most dramatic of which was DNA-dependent protein kinase (DNA-PK) (Figure 3C). DNA-PK is known to preferentially phosphorylate serines and threonines that are located before glutamine residues on proteins ([S/T]-Q motif; Kim et al., 1999). Consistent with the activation of DNA-PK during apoptosis, a motif-x analysis (Schwartz and Gygi, 2005) revealed that S-Q phosphorylations were the most overrepresented motifs among the apoptosis-specific phosphorylation events in our datasets (Figure 3D and Table S4). No such enrichment of S-Q motifs was observed for static or control-specific phosphorylation events (Table S4). These proteomic data were confirmed by western blotting using an antibody that recognizes p[S/T]-Q motifs, which showed a time-dependent increase in p[S/T]-Q-immunoreactive proteins in apoptotic cells compared to control cells that peaked at 2 hr post-STS treatment (Figure 3E).
The [S/T]-Q substrate motif is utilized by other kinases, most notably ATM and ATR, which, along with DNA-PK, are important regulators genome stability and the DNA-damage response (Kim et al., 1999). No change in ATM or ATR activity was seen in our KiNativ data (Table S4), but this finding does not rule out a contribution of these kinases to phosphorylation events in apoptosis. We more directly tested for this possibility by treating Jurkat T-cells with selective inhibitors of DNA-PK (NU-7441 and NU-7026), ATM (KU5633), or ATM/ATR (CGK733) for 1 hour prior to induction of apoptosis. Western blotting revealed a near-complete block of p[S/T]-Q events upon treatment with DNA-PK inhibitors, while inhibitors of ATM and/or ATR were without effect (Figure 3F). We also generated two Jurkat T-cell lines with stable shRNA-mediated knockdowns of DNA-PK (Figure S2) and found that these cells showed substantially blunted [S/T]-Q phosphorylation following induction of apoptosis (Figure 3F). Finally, we performed a qP-PROTOMAP study of apoptotic Jurkat cells pre-treated with NU-7441, which resulted in a two-fold or greater reduction in the majority of p[S/T]-Q events (~60%), with other non-p[ST]-Q events being minimally affected (Figure S2). Interestingly, of the p[S/T]-Q events reduced by NU-7441 treatment, over 80% were apoptosis-specific (Figure S2 and Table S4), which, when combined with our immunoblotting results (Figure 3F), indicate that DNA-PK is responsible for a large fraction of the p[S/T]-Q events observed in apoptotic cells.
We next investigated how DNA-PK might be activated during apoptosis. We found that, early in the apoptotic cascade, DNA-PK relocated from the nucleus to the cytoplasm, where, interestingly, the enzyme was cleaved to generate a stable ~150 kDa C-terminal fragment that contains the kinase domain (Figure 3G, H). The appearance of a cleaved form of DNA-PK in the cytoplasm directly correlated with the increased p[S/T]-Q immunoreactive proteins (Figure 3E) and the enhanced KiNativ signals for this kinase observed 2 hr after induction of apoptosis (Figure 3H, top panel). Pre-treatment of cells with the caspase inhibitor Z-VAD-FMK blocked STS-induced cleavage of DNA-PK and p[S/T]-Q events (Figure S2). Previous studies have also reported the caspase-mediated cleavage of DNA-PK in apoptotic cells (Casciola-Rosen et al., 1995), but have mostly interpreted this proteolytic event to inactivate DNA-PK. The assays used in such studies, however, typically measured DNA-dependent DNA-PK activity with a peptide substrate (Allalunis-Turner et al., 1995; Han et al., 1996; Song et al., 1996). Our data support an alternative model wherein caspase cleavage releases DNA-PK from genomic DNA to generate an active, truncated form of the enzyme that traverses into the cytoplasm to catalyze a large number of apoptosis-specific phosphorylation events.
Caspase cleavage can expose phosphorylation sites
Previous studies that have examined the functional effects of phosphorylation on caspase cleavage with individual protein substrates in vitro have mostly uncovered instances where phosphorylation blocks caspase cleavage (Duncan et al., 2010; Kurokawa and Kornbluth, 2009; Tozser et al., 2003), leading to a model where phosphorylation serves to ‘protect’ proteins from proteolytic processing. Many of the apoptosis-specific phosphorylation events identified in our study, however, did not appear to conform to this scenario, since they were located on half-tryptic peptides ending in C-terminal aspartates, the hallmark of caspase cleavage. One such example is SF3B2, which contains an apoptosis-specific phosphorylation event at Ser861 that is located at the P2 position adjacent to a site of caspase cleavage (Figure 4A, B). To ascertain whether this phosphorylation event occurs before or after caspase-mediated proteolysis, we used a targeted MS approach with isotopically-labeled peptides to measure the four possible forms of the SF3B2 peptide: (1) uncleaved/unphosphorylated, (2) cleaved/unphosphorylated, (3) uncleaved/phosphorylated, and (4) cleaved/phosphorylated. These experiments provided two key lines of evidence supporting that phosphorylation of Ser861 occurs after caspase-mediated proteolysis. First, the cleaved/unphosphorylated peptide appeared at an earlier time point than the cleaved/phosphorylated peptide (Figure 4C). Second, the uncleaved/phosphorylated peptide was not detected at any time point, suggesting that the full-length (parental) form of SF3B2 is not phosphorylated at Ser861. These predictions were also supported by in vitro substrate assays, where we found that the unphosphorylated, but not phosphorylated peptide served as a substrate for caspases (Figure 4D and Figure S3).
Figure 4. Caspase cleavage exposes new sites for phosphorylation.
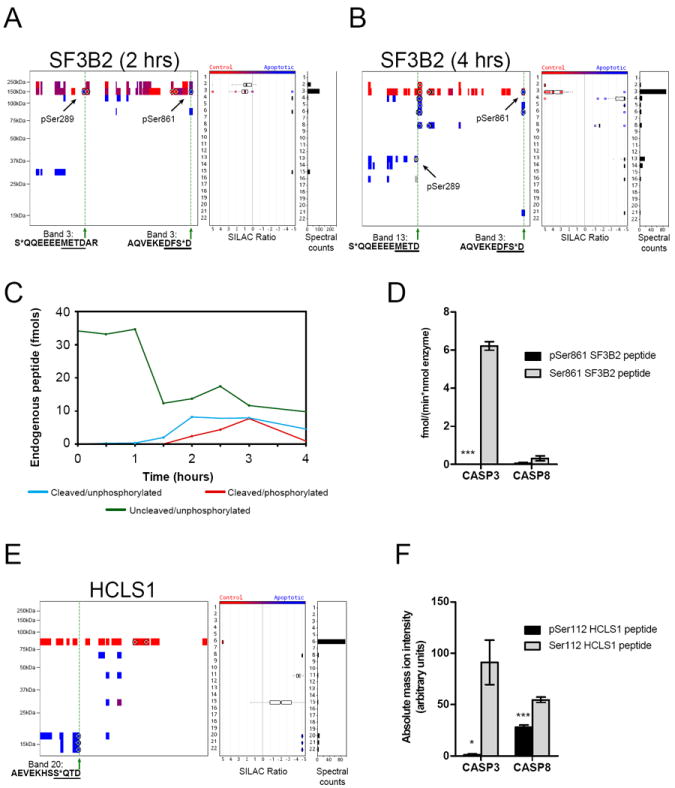
(A and B) Quantitative peptographs showing SF3B2 at 2 hr (A) and 4 hr (B) post-STS treatment. A C-terminal apoptosis-specific phosphorylation event at Ser861 occurs at the P2 position relative to the caspase cleavage site at Asp862. An additional apoptosis-specific phosphorylation event is observed at Ser289 on the parental form of SF3B2 (band 3) at 2 hrs, which is 10 residues from another site of caspase cleavage (Asp299, see band 13 in B). (C) MS-based quantitation showing that the cleaved/unphosphorylated (Ser861) SF3B2 peptide is generated prior to the cleaved/phosphorylated (pSer861) peptide during apoptosis. Quantified peptides: uncleaved/unphosphorylated - EQQAQVEKEDFSDMVAEHAAK, uncleaved/phosphorylated - EQQAQVEKEDFS*DMVAEHAAK (endogenous form not detected), cleaved/unphosphorylated - EQQAQVEKEDFSD, cleaved/phosphorylated - EQQAQVEKEDFS*D. (D)In vitro peptide substrate assays (1μM peptide substrate) demonstrating that phosphorylation of SF3B2 at Ser881 prevents cleavage by caspases. Peptide substrates: EQQAQVEKEDFSDMVAEHAAK and EQQAQVEKEDFS*DMVAEHAAK. (E) Quantitative peptograph of HCLS1 showing an apoptosis-specific phosphorylation event at Ser112 occurring at the P4 position of a caspase cleavage site at Asp115. (F) In vitro peptide substrate assays (1μM peptide substrate) demonstrating that phosphorylation of HCLS1 at Ser112 prevents proteolysis by caspase-3 and hinders proteolysis by caspase-8. Peptide substrates: SAVGHEYVAEVEKHSSQTDAAK and SAVGHEYVAEVEKHSS*QTDAAK. Data in (D) and (F) are presented as means ± standard error of the mean (SEM). * p < 0.05, *** p < 0.001. See also Figure S3.
A broader search of our qP-PROTOMAP data set identified several additional apoptosis-specific phosphorylation events that were found exclusively on half-tryptic, aspartate-terminating peptides (Figure S3 and Table S5). One candidate was a previously unreported phosphorylation event found at the P4 position (S*QTD) on an N-terminal fragment of HCLS1 (Figure 4E). Similar to what was observed for pSer861 in SF3B2, phosphorylation of Ser112 completely blocked caspase-3 cleavage of the HCLS1 peptide (Figure 4F and Figure S3). Caspase-8 cleavage was also significantly reduced by phosphorylation of Ser112, although residual hydrolytic activity was detected (Figure 4F). These data, taken together, are consistent with phosphorylation of Ser112 occurring after caspase-mediated cleavage of HCLS1.
Phosphorylation can promote caspase cleavage
We next wondered whether phosphorylation might also, in certain instances, directly promote (rather than block) caspase-mediated proteolysis. We accordingly searched our qP-PROTOMAP data sets for apoptosis-specific phosphorylation events that were located on the parental forms of cleaved proteins in close proximity to sites of caspase-mediated proteolysis. A compelling example was found in the protein KHSRP (Figure 5A), where we observe an apoptosis-specific phosphorylation event at Thr100 at 2 hr post-STS treatment on the parental 74 kDa form of the protein (band 6), and at 4 hr on a half tryptic, aspartate (Asp103)-terminating peptide in an N-terminal ~15 kDa fragment (band 21/22) (Figure 5A and 5B, respectively). pThr100 was thus located at the P3 position relative to the Asp103 caspase cleavage site. We also detected the unphosphorylated version of the half-tryptic, Asp103-terminal peptide in the KHSRP fragment.
Figure 5. Phosphorylation at the P3 position of caspase cleavage sites promotes caspase-8-mediated proteolysis.
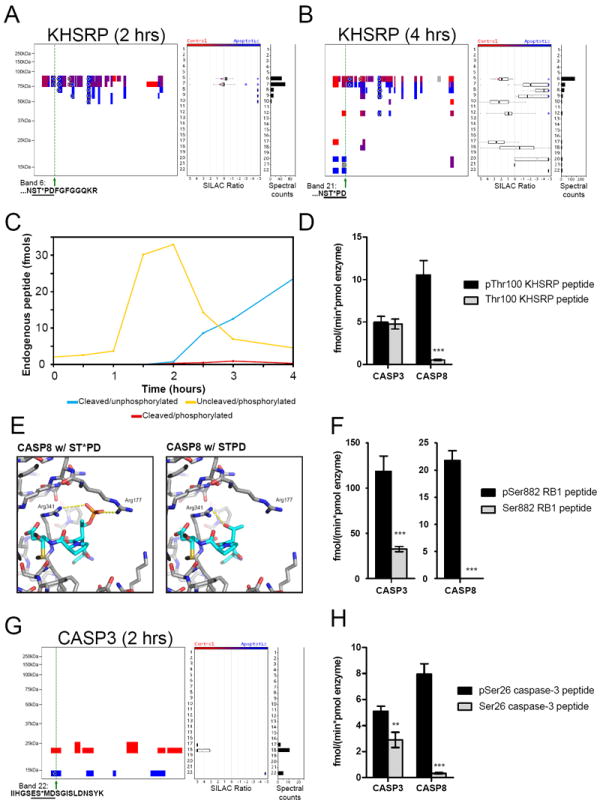
(A and B) Quantitative peptographs showing an apoptosis-specific phosphorylation event at Thr100 on the parental form of KHSRP (A, band 6) at 2 hr, and on a half-tryptic, aspartate (Asp103)-terminating peptide of a stable fragment of this protein at 4 hr (B, band 21). Note that this half-tryptic peptide is shown in gray because it lacks an isotopically labeled amino acid. (C) MS-based quantitation showing a rapid increase in the uncleaved/phosphorylated (pThr100) KHSRP peptide (yellow line) from 0-2 hr post-STS treatment, which is ~1 hr prior to the appearance of the cleaved forms of this peptide. Note that the uncleaved/unphosphorylated KHSRP peptide was found at 10 times higher levels than the other peptides and was therefore not shown in the figure for the sake of clarity (see Figure S3 for these data). Quantified peptides: uncleaved/unphosphorylated -IGGDAATTVNNSTPDFGFGGQK, uncleaved/phosphorylated - IGGDAATTVNNST*PDFGFGGQK, cleaved/unphosphorylated - IGGDAATTVNNSTPD, cleaved/phosphorylated - IGGDAATTVNNST*PD. (D) In vitro peptide substrate assays (1μM peptide substrate) demonstrating that phosphorylation at Thr100 of KHSRP enhances cleavage by caspase-8. Peptide substrates: IGGDAATTVNNSTPDFGFGGQK and IGGDAATTVNNST*PDFGFGGQK. (E) Structure of caspase-8 (PDB: 1QTN) with the tetrapeptide ST*PD modeled into the active site. See the Supplemental Experimental Procedures and Figure S4 for additional details. (F) In vitro peptide substrate assays (1μM peptide substrate) demonstrating that phosphorylation at Ser882 of RB1 promotes cleavage by caspase-8 and, to a lesser extent, by caspase-3. Peptide substrates: TLQTDSIDSFETQR and TLQTDS*IDSFETQR. (G) Quantitative peptograph showing caspase-3 at 2 hr post-STS treatment, revealing an apoptosis-specific phosphorylation event at Ser26, which is the P3 position relative to the known caspase cleavage site at Asp28. (H) In vitro peptide substrate assays (1μM peptide substrate) demonstrating that phosphorylation at Ser26 promotes cleavage of caspase-3 by caspase-8 and, to a lesser extent, by caspase-3. Peptide substrates: IIHGSESMDSGISLDNSYK and IIHGSES*MDSGISLDNSYK. Data in (D), (F), and (H) are presented as means ± standard error of the mean (SEM). ** p < 0.01, *** p < 0.001. See also Figure S4.
To determine the relative kinetics of Thr100 phosphorylation versus caspase-mediated proteolysis at Asp103 in KHSRP, we performed a targeted MS analysis using isotopically labeled peptides following the protocol outlined above for the SF3B2 protein. In band 6, where the parental form of KHSRP migrates, we detected the uncleaved/phosphorylated form of the peptide, which was strongly increased over the first 2 hrs following STS treatment and then decreased thereafter (Figure 5C). In contrast, the cleaved forms of the peptide in bands 21/22 did not appear until 2.5 hr and continued to accumulate throughout the remainder of the time course (Figure 5C). These data indicate that phosphorylation at Thr100 precedes proteolysis by a substantial time window during the apoptotic cascade. We should note that the vast majority of the cleaved peptide was found in the unphosphorylated form, with only trace levels of the cleaved/phosphorylated peptide being detected throughout the time course. Nonetheless, we were intrigued by the complementary time courses for phosphorylation versus proteolysis, as well as the similar stoichiometries of the uncleaved/phosphorylated and cleaved/unphosphorylated peptides, both of which peaked at ~10% of the total quantity of uncleaved/unphosphorylated peptide (Figure S4). These data correlate well with the low overall magnitude of cleavage for KHSRP (see peptographs in Figure 5A and B) and suggest further that phosphorylation and proteolysis may have a quantitative relationship wherein phosphorylation at Thr100 promotes caspase proteolysis at Asp103. In this model, the lack of accumulation of the cleaved/phosphorylated peptide could be explained by rapid dephosphorylation of pThr100 following caspase cleavage.
We tested whether phosphorylation at Thr100 directly affects caspase cleavage at Asp103 using in vitro peptide substrate assays. Caspase-3 hydrolyzed the phosphorylated and unphosphorylated KHSRP peptides at equivalent rates (Figure 5D and Figure S4); caspase-8, however, exhibited a dramatic increase in hydrolytic activity (> 20-fold) for the phosphorylated form of the peptide (Figure 5D and Figure S4). The increased hydrolytic activity of caspase-8 could be completely blocked by preincubation with the inhibitor z-VAD-fmk (Figure S4). These findings intrigued us because it is known that caspase-8, but not caspase-3, displays a strong preference for glutamic acid, which is an approximate isostere of phosphorylated serine/threonine residues (Pearlman et al., 2011), at the P3 position (Chereau et al., 2003; Fuentes-Prior and Salvesen, 2004). These data suggested that caspase-8 may have evolved a special capacity to accommodate and even prefer phosphorylated residues at the P3 position. To further explore this concept, we modeled the interaction of phosphorylated and unphosphorylated KHSRP peptides in the active sites of caspase-3 and caspase-8 (Figure 5E and Figure S4). These models predict a clear interaction between the pThr100 of the KHSRP substrate and an arginine residue (Arg177) in caspase-8 that is not found in caspase-3 (Figure 5E and Figure S4). Arg177 has also been found to interact with the P3 glutamic acid residue of inhibitors in caspase-8 co-crystal structures (Blanchard et al., 2000; Ekici et al., 2006). Inspired by this discovery, we searched our qP-PROTOMAP data for additional examples of apoptosis-specific Ser/Thr phosphorylation events occurring at the P3 position of known caspase cleavage sites (Table 1). We have already briefly discussed another such example - the apoptosis-specific pSer347 in RB1, which is located at the P3 position adjacent to the Asp350 cleavage site. Utilizing synthetic RB1 peptides, we again found that the phosphorylated peptide served as a much better caspase-8 substrate compared to the unphosphorylated variant (Figure 5F). In this case, caspase-3 also showed improved activity for the phosphorylated peptide, but exhibited a less dramatic increase than caspase-8 (Figure 5F). Finally, we noticed that caspase-3 itself possesses an apoptosis-specific phosphorylation event, pSer26 (detected at 2 hr post-STS treatment), that is located at the P3 position relative to the known caspase-cleavage site Asp29 between the prodomain and the large catalytic subunit (Figure 5G). Cleavage at this site is thought to occur primarily by autocatalytic processing, however there is some evidence that caspase-8 also proteolyzes this site (Rank et al., 2001). As we found for KHSRP and RB1, caspase-8 displayed markedly greater hydrolytic activity for the phosphorylated versus unphosphorylated caspase-3 peptide (Figure 5H).
These results, taken together, indicate that phosphorylation can promote the caspase cleavage of proteins during apoptosis primarily through a mechanism involving the P3 position of caspase proteolytic sites, which, upon phosphorylation, dramatically increases substrate hydrolysis by caspase-8.
DISCUSSION
The potential for crosstalk between phosphorylation and proteolytic pathways in apoptosis and other cell biological processes has long been recognized (Kurokawa and Kornbluth, 2009; Lopez-Otin and Hunter, 2010); however, investigating such network interactions at a global level has proven technically challenging due to the lack of proteomic technologies that can coordinately profile protein phosphorylation and proteolysis in cells. qP-PROTOMAP addresses this problem by quantifying phosphorylation events in proteomes and incorporating these modifications into the topographical maps of proteins such that their relationship to proteolytic processing can be directly inferred. Using this approach, we have uncovered several ways that phosphorylation and proteolytic pathways intersect in apoptotic cells. This crosstalk is evident on a global level by the enrichment of phosphorylation events on proteolyzed proteins at locations that are in close proximity to caspase cleavage sites. From a functional perspective, we show that caspase cleavage can unveil new sites for phosphorylation on proteins and, surprisingly, apoptosis-specific phosphorylation events at the P3 position of caspase recognition sites can directly promote the cleavage of proteins (Figure 6). To our knowledge, neither of these forms of crosstalk between caspases and kinases has been reported previously. Caspase cleavage can also activate kinases, like DNA-PK, that contribute to the creation of a network of phosphorylation events that are specific to apoptotic cells (Figure 6). This network is enriched in phosphorylation events that lack literature precedent, further supporting their potentially special relationship to the cell death process.
Figure 6. Mechanisms of crosstalk between phosphorylation and proteolytic pathways in apoptosis.
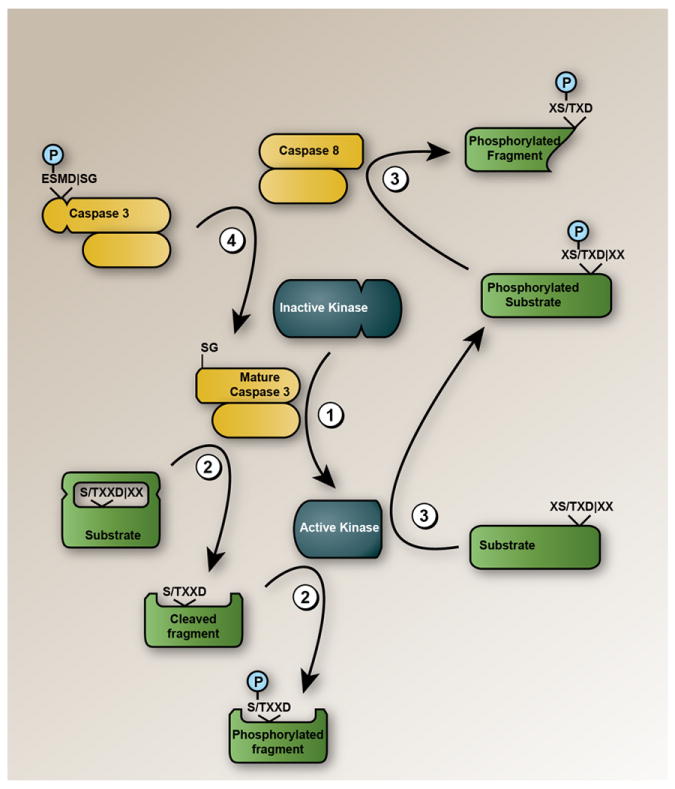
Several distinct forms of crosstalk between caspase and kinase pathways were uncovered by qP-PROTOMAP: (1) kinases (such as DNA-PK) can be cleaved and activated by caspases; (2) caspase cleavage can expose previously occluded residues that are then phosphorylated by kinases; (3) phosphorylation at the P3 position relative to scissile aspartates promotes proteolysis of proteins by caspase-8. This type of proteolysis-promoting P3 phosphorylation was also found on caspase-3 itself (4).
While we do not yet understand precisely how caspase cleavage promotes the phosphorylation of proteins, it is possible that the kinases responsible for these phosphorylation events cannot gain access to their substrates due to steric hindrance. Caspase cleavage at a proximal location along the protein backbone could then relieve this steric blockade to expose sites for phosphorylation (Figure 6). Alternatively, there may be kinases that selectively phosphorylate proteins near their N- or C-termini, although we are not aware of any specific kinases that have been reported to show this substrate preference. Finally, it is possible that cleavage promotes the redistribution of kinases like DNA-PK to distinct subcellular compartments where they phosphorylate new sets of substrates.
Phosphorylation events that promote proteolysis were found to occur at the P3 position relative to caspase cleavage sites, where they dramatically enhanced substrate hydrolysis by caspase-8. This finding is unexpected and important because phosphorylation events within caspase consensus motifs (P4-P1’ residues) have, in the past, been exclusively found to hinder caspase cleavage (Kurokawa and Kornbluth, 2009). Our results are, however, consistent with previous structural work on caspases, which have shown that caspase-8, as well as caspase-9, possess a unique arginine residue not found in other caspases that enhances binding to substrates with acidic residues in the P3 position (Blanchard et al., 2000; Chereau et al., 2003; Fuentes-Prior and Salvesen, 2004). This feature has historically been interpreted to explain the preference that caspase-8 displays for substrates with a P3 glutamic acid residue (Fuentes-Prior and Salvesen, 2004), but our data suggest another level of biological significance, namely, that caspase-8 may have evolved to recognize a set of substrates selectively in their phosphorylated state. We should mention, however, that so far, we have only assessed the impact of P3-phosphorylation on a handful of caspase substrates, and it is therefore not yet clear whether P3-phosphorylation will serve as a general or substrate-selective mechanism to enhance proteolysis by caspase-8.
The intricate, systems-level interactions between kinase and caspase networks uncovered by qP-PROTOMAP analysis of apoptotic cells sets the stage for several important lines of future research. First, we have only examined one cell line (Jurkat T-cells) and its response to a single apoptotic stimulus (STS). While the rapid and near-complete apoptotic progression observed in STS-treated Jurkat cells has made it a preferred model for cell biological and proteomic investigations of programmed cell death (Dix et al., 2008; Mahrus et al., 2008; Short et al., 2007), and a recent study has shown that different apoptotic stimuli (STS versus TRAIL) cause similar overall patterns of protein cleavage in cells (Agard et al., 2012), assessing the broader significance of our findings would certainly benefit from qP-PROTOMAP studies of additional cell types and with distinct apoptotic stimuli. Second, we do not yet fully understand which kinases are responsible for the phosphorylation events observed specifically in apoptotic cells. While our results indicate that DNA-PK makes a substantial contribution to this apoptosis-specific phosphorylation network, many of its constituent phosphorylation events do not conform to the [S/T]-Q motif preferred by DNA-PK (Figure S2), pointing to the potential activation of other kinases (or inactivation of phosphatases) during apoptosis. Our functional proteomic data suggest candidates like AKT1 and 2, MAPK14, and BRAF for future investigation (Figure 3C). Disrupting such kinases could reveal the functional contribution that they (and their cognate substrates) make to apoptosis, as has been shown previously for DNA-PK (Bharti et al., 1998; Chakravarthy et al., 1999; Chen et al., 2005a, b; Wang et al., 2000). Finally, there are other potential forms of crosstalk between phosphorylation and proteolytic pathways that may have eluded detection in our study. Phosphorylation events that, for instance, block caspase cleavage would not have been easily identified because the resulting phosphoprotein would not be detected as a cleaved product. Future studies that compare the apoptotic process under different cellular conditions may reveal context-dependent changes in protein cleavage that are due to such “protective” phosphorylation events. In fact, others have speculated, for instance, that cancer cells displaying resistance to apoptosis may possess specific kinase networks that mark proteins with phosphorylation events that protect against caspase cleavage (Ahmed et al., 2002). The qP-PROTOMAP method described herein represents a versatile proteomic platform for addressing such questions through its ability to generate global, quantitative, and integrated profiles of phosphorylation and proteolytic pathways in biological systems.
EXPERIMENTAL PROCEDURES
Cell Culture and Induction of Apoptosis
Jurkat cells were grown under standard conditions and seeded to a density of 1 × 10⁶ cells/ml prior to induction of apoptosis. Staurosporine (1 μM final) was added and the cells were incubated for 2 or 4 hrs at 37°C prior to lysis. See Supplemental Experimental Procedures for more detail.
Sample Preparation, SDS-PAGE, and Mass Spectrometry
400 μg of cytosolic protein (200 μg + 200 μg of light and heavy protein) was separated via a 10% SDS-PAGE gel and cut into 22 0.5 cm bands. Peptides were extracted via in-gel trypsin digestion and subjected to immobilized metal affinity chromatography (IMAC). IMAC eluate (enriched in phosphopeptides) or flow-through (for unphosphorylated peptides) was loaded onto a 100 μm (inner diameter) fused silica capillary column containing C18 resin, and eluted directly into an LTQ-Velos Orbitrap mass spectrometer operated in data-dependant scanning mode, with one full MS scan in the Orbitrap (60,000 resolution) followed by ten MS2 scans in the ion trap. See Supplemental Experimental Procedures for more detail.
Data Analysis
MS2 data were searched using the ProLuCID algorithm (Xu et al., 2006) with a reverse-concatenated, non-redundant variant of the human IPI database. Peptides from each gel-band were grouped and filtered using DTASelect (Tabb et al., 2002), SILAC ratios were obtained with Cimage (Weerapana et al., 2010), and these data were assembled into quantitative peptographs using custom software. The “phosphorylation site dataset” released on 3 Nov 2011 from the PhosphoSite database (Hornbeck et al., 2011) was used for assessments of phosphosite novelty. The CASBAH database (Luthi and Martin, 2007) was downloaded on 19 Dec 2011 and used for assessments of caspase-substrate novelty. See Supplemental Experimental Procedures for more detail.
Caspase Activity Assays with Synthetic Peptide Substrates
Recombinant human caspases were diluted into buffer containing substrate peptide and an internal standard, and incubated for 1-2 hrs at 37 °C. Assays were quenched by acidification and subjected to ZipTip purification before MS analysis. Absolute quantities of product were calculated by comparison to synthetic standards. Assays were performed under non-saturating substrate concentrations and resulted in less than 20% turnover of the substrate. See Supplemental Experimental Procedures for more detail.
Supplementary Material
Highlights.
Apoptosis induces a distinct network of phosphorylation sites
Phosphorylation is enriched on cleaved proteins and near caspase cleavage sites
Caspase-mediated proteolysis exposes sites for phosphorylation
Phosphorylation at the P3 position promotes substrate cleavage by caspase-8
Acknowledgments
This work was supported by the NIH (CA087660), a Predoctoral Fellowship from the California Breast Cancer Foundation (M.M.D.), the ARCS Foundation (M.M.D.), a Koshland Graduate Fellowship in Enzyme Biochemistry (G.M.S.), and the Skaggs Institute for Chemical Biology. We are grateful to Brian Grabiner and David Sabatini for their generous gift of lentiviral vectors.
Footnotes
Publisher's Disclaimer: This is a PDF file of an unedited manuscript that has been accepted for publication. As a service to our customers we are providing this early version of the manuscript. The manuscript will undergo copyediting, typesetting, and review of the resulting proof before it is published in its final citable form. Please note that during the production process errors may be discovered which could affect the content, and all legal disclaimers that apply to the journal pertain.
References
- Agard NJ, Mahrus S, Trinidad JC, Lynn A, Burlingame AL, Wells JA. Global kinetic analysis of proteolysis via quantitative targeted proteomics. Proceedings of the National Academy of Sciences. 2012 doi: 10.1073/pnas.1117158109. [DOI] [PMC free article] [PubMed] [Google Scholar]
- Ahmed K, Gerber DA, Cochet C. Joining the cell survival squad: an emerging role for protein kinase CK2. Trends in Cell Biology. 2002;12:226–230. doi: 10.1016/s0962-8924(02)02279-1. [DOI] [PubMed] [Google Scholar]
- Allalunis-Turner MJ, Lintott LG, Barron GM, Day RS, 3rd, Lees-Miller SP. Lack of correlation between DNA-dependent protein kinase activity and tumor cell radiosensitivity. Cancer research. 1995;55:5200–5202. [PubMed] [Google Scholar]
- Arntzen MO, Thiede B. ApoptoProteomics: An integrated database for analysis of proteomics data obtained from apoptotic cells. Mol Cell Proteomics. 2011 doi: 10.1074/mcp.M111.010447. [DOI] [PMC free article] [PubMed] [Google Scholar]
- Bharti A, Kraeft SK, Gounder M, Pandey P, Jin S, Yuan ZM, Lees-Miller SP, Weichselbaum R, Weaver D, Chen LB, et al. Inactivation of DNA-dependent protein kinase by protein kinase Cdelta: implications for apoptosis. Molecular and cellular biology. 1998;18:6719–6728. doi: 10.1128/mcb.18.11.6719. [DOI] [PMC free article] [PubMed] [Google Scholar]
- Blanchard H, Donepudi M, Tschopp M, Kodandapani L, Wu JC, Grutter MG. Caspase-8 specificity probed at subsite S(4): crystal structure of the caspase-8-Z-DEVD-cho complex. Journal of molecular biology. 2000;302:9–16. doi: 10.1006/jmbi.2000.4041. [DOI] [PubMed] [Google Scholar]
- Casciola-Rosen LA, Anhalt GJ, Rosen A. DNA-dependent protein kinase is one of a subset of autoantigens specifically cleaved early during apoptosis. The Journal of experimental medicine. 1995;182:1625–1634. doi: 10.1084/jem.182.6.1625. [DOI] [PMC free article] [PubMed] [Google Scholar]
- Chakravarthy BR, Walker T, Rasquinha I, Hill IE, MacManus JP. Activation of DNA-dependent protein kinase may play a role in apoptosis of human neuroblastoma cells. Journal of neurochemistry. 1999;72:933–942. doi: 10.1046/j.1471-4159.1999.0720933.x. [DOI] [PubMed] [Google Scholar]
- Chen GG, Sin FL, Leung BC, Ng HK, Poon WS. Differential role of hydrogen peroxide and staurosporine in induction of cell death in glioblastoma cells lacking DNA-dependent protein kinase. Apoptosis : an international journal on programmed cell death. 2005a;10:185–192. doi: 10.1007/s10495-005-6073-8. [DOI] [PubMed] [Google Scholar]
- Chen GG, Sin FL, Leung BC, Ng HK, Poon WS. Glioblastoma cells deficient in DNA-dependent protein kinase are resistant to cell death. Journal of cellular physiology. 2005b;203:127–132. doi: 10.1002/jcp.20230. [DOI] [PubMed] [Google Scholar]
- Chereau D, Kodandapani L, Tomaselli KJ, Spada AP, Wu JC. Structural and functional analysis of caspase active sites. Biochemistry. 2003;42:4151–4160. doi: 10.1021/bi020593l. [DOI] [PubMed] [Google Scholar]
- Coleman ML, Sahai EA, Yeo M, Bosch M, Dewar A, Olson MF. Membrane blebbing during apoptosis results from caspase-mediated activation of ROCK I. Nature cell biology. 2001;3:339–345. doi: 10.1038/35070009. [DOI] [PubMed] [Google Scholar]
- Crawford ED, Wells JA. Caspase substrates and cellular remodeling. Annual review of biochemistry. 2011;80:1055–1087. doi: 10.1146/annurev-biochem-061809-121639. [DOI] [PubMed] [Google Scholar]
- Degli Esposti M, Ferry G, Masdehors P, Boutin JA, Hickman JA, Dive C. Post-translational modification of Bid has differential effects on its susceptibility to cleavage by caspase 8 or caspase 3. The Journal of biological chemistry. 2003;278:15749–15757. doi: 10.1074/jbc.M209208200. [DOI] [PubMed] [Google Scholar]
- Dix MM, Simon GM, Cravatt BF. Global mapping of the topography and magnitude of proteolytic events in apoptosis. Cell. 2008;134:679–691. doi: 10.1016/j.cell.2008.06.038. [DOI] [PMC free article] [PubMed] [Google Scholar]
- Duncan JS, Turowec JP, Vilk G, Li SS, Gloor GB, Litchfield DW. Regulation of cell proliferation and survival: convergence of protein kinases and caspases. Biochimica et biophysica acta. 2010;1804:505–510. doi: 10.1016/j.bbapap.2009.11.001. [DOI] [PubMed] [Google Scholar]
- Ekici OD, Li ZZ, Campbell AJ, James KE, Asgian JL, Mikolajczyk J, Salvesen GS, Ganesan R, Jelakovic S, Grutter MG, et al. Design, synthesis, and evaluation of aza-peptide Michael acceptors as selective and potent inhibitors of caspases-2, -3, -6, -7, -8, -9, and -10. Journal of medicinal chemistry. 2006;49:5728–5749. doi: 10.1021/jm0601405. [DOI] [PubMed] [Google Scholar]
- Fattman CL, Delach SM, Dou QP, Johnson DE. Sequential two-step cleavage of the retinoblastoma protein by caspase-3/-7 during etoposide-induced apoptosis. Oncogene. 2001;20:2918–2926. doi: 10.1038/sj.onc.1204414. [DOI] [PubMed] [Google Scholar]
- Fuentes-Prior P, Salvesen GS. The protein structures that shape caspase activity, specificity, activation and inhibition. The Biochemical journal. 2004;384:201–232. doi: 10.1042/BJ20041142. [DOI] [PMC free article] [PubMed] [Google Scholar]
- Han Z, Malik N, Carter T, Reeves WH, Wyche JH, Hendrickson EA. DNA-dependent protein kinase is a target for a CPP32-like apoptotic protease. The Journal of biological chemistry. 1996;271:25035–25040. doi: 10.1074/jbc.271.40.25035. [DOI] [PubMed] [Google Scholar]
- Hehner SP, Hofmann TG, Droge W, Schmitz ML. Inhibition of tyrosine phosphatases induces apoptosis independent from the CD95 system. Cell death and differentiation. 1999;6:833–841. doi: 10.1038/sj.cdd.4400559. [DOI] [PubMed] [Google Scholar]
- Hornbeck PV, Kornhauser JM, Tkachev S, Zhang B, Skrzypek E, Murray B, Latham V, Sullivan M. PhosphoSitePlus: a comprehensive resource for investigating the structure and function of experimentally determined post-translational modifications in man and mouse. Nucleic acids research. 2011 doi: 10.1093/nar/gkr1122. [DOI] [PMC free article] [PubMed] [Google Scholar]
- Kim ST, Lim DS, Canman CE, Kastan MB. Substrate specificities and identification of putative substrates of ATM kinase family members. The Journal of biological chemistry. 1999;274:37538–37543. doi: 10.1074/jbc.274.53.37538. [DOI] [PubMed] [Google Scholar]
- Kurokawa M, Kornbluth S. Caspases and kinases in a death grip. Cell. 2009;138:838–854. doi: 10.1016/j.cell.2009.08.021. [DOI] [PMC free article] [PubMed] [Google Scholar]
- Lopez-Otin C, Hunter T. The regulatory crosstalk between kinases and proteases in cancer. Nature reviews Cancer. 2010;10:278–292. doi: 10.1038/nrc2823. [DOI] [PubMed] [Google Scholar]
- Luthi AU, Martin SJ. The CASBAH: a searchable database of caspase substrates. Cell death and differentiation. 2007;14:641–650. doi: 10.1038/sj.cdd.4402103. [DOI] [PubMed] [Google Scholar]
- Mahrus S, Trinidad JC, Barkan DT, Sali A, Burlingame AL, Wells JA. Global sequencing of proteolytic cleavage sites in apoptosis by specific labeling of protein N termini. Cell. 2008;134:866–876. doi: 10.1016/j.cell.2008.08.012. [DOI] [PMC free article] [PubMed] [Google Scholar]
- Na S, Chuang TH, Cunningham A, Turi TG, Hanke JH, Bokoch GM, Danley DE. D4-GDI, a substrate of CPP32, is proteolyzed during Fas-induced apoptosis. The Journal of biological chemistry. 1996;271:11209–11213. doi: 10.1074/jbc.271.19.11209. [DOI] [PubMed] [Google Scholar]
- Ong SE, Blagoev B, Kratchmarova I, Kristensen DB, Steen H, Pandey A, Mann M. Stable isotope labeling by amino acids in cell culture, SILAC, as a simple and accurate approach to expression proteomics. Mol Cell Proteomics. 2002;1:376–386. doi: 10.1074/mcp.m200025-mcp200. [DOI] [PubMed] [Google Scholar]
- Patricelli MP, Nomanbhoy TK, Wu J, Brown H, Zhou D, Zhang J, Jagannathan S, Aban A, Okerberg E, Herring C, et al. In situ kinase profiling reveals functionally relevant properties of native kinases. Chemistry & biology. 2011;18:699–710. doi: 10.1016/j.chembiol.2011.04.011. [DOI] [PMC free article] [PubMed] [Google Scholar]
- Pearlman SM, Serber Z, Ferrell JE., Jr A mechanism for the evolution of phosphorylation sites. Cell. 2011;147:934–946. doi: 10.1016/j.cell.2011.08.052. [DOI] [PMC free article] [PubMed] [Google Scholar]
- Rank KB, Mildner AM, Leone JW, Koeplinger KA, Chou KC, Tomasselli AG, Heinrikson RL, Sharma SK. [W206R]-procaspase 3: an inactivatable substrate for caspase 8. Protein expression and purification. 2001;22:258–266. doi: 10.1006/prep.2001.1433. [DOI] [PubMed] [Google Scholar]
- Schwartz D, Gygi SP. An iterative statistical approach to the identification of protein phosphorylation motifs from large-scale data sets. Nat Biotechnol. 2005;23:1391–1398. doi: 10.1038/nbt1146. [DOI] [PubMed] [Google Scholar]
- Short DM, Heron ID, Birse-Archbold JL, Kerr LE, Sharkey J, McCulloch J. Apoptosis induced by staurosporine alters chaperone and endoplasmic reticulum proteins: Identification by quantitative proteomics. Proteomics. 2007;7:3085–3096. doi: 10.1002/pmic.200600964. [DOI] [PubMed] [Google Scholar]
- Song Q, Lees-Miller SP, Kumar S, Zhang Z, Chan DW, Smith GC, Jackson SP, Alnemri ES, Litwack G, Khanna KK, et al. DNA-dependent protein kinase catalytic subunit: a target for an ICE-like protease in apoptosis. The EMBO journal. 1996;15:3238–3246. [PMC free article] [PubMed] [Google Scholar]
- Stolzenberg I, Wulf S, Mannherz HG, Paddenberg R. Different sublines of Jurkat cells respond with varying susceptibility of internucleosomal DNA degradation to different mediators of apoptosis. Cell and tissue research. 2000;301:273–282. doi: 10.1007/s004410000239. [DOI] [PubMed] [Google Scholar]
- Tabb DL, McDonald WH, Yates JR., 3rd DTASelect and Contrast: tools for assembling and comparing protein identifications from shotgun proteomics. J Proteome Res. 2002;1:21–26. doi: 10.1021/pr015504q. [DOI] [PMC free article] [PubMed] [Google Scholar]
- Thornberry NA, Lazebnik Y. Caspases: enemies within. Science (New York, NY) 1998;281:1312–1316. doi: 10.1126/science.281.5381.1312. [DOI] [PubMed] [Google Scholar]
- Tozser J, Bagossi P, Zahuczky G, Specht SI, Majerova E, Copeland TD. Effect of caspase cleavage-site phosphorylation on proteolysis. The Biochemical journal. 2003;372:137–143. doi: 10.1042/BJ20021901. [DOI] [PMC free article] [PubMed] [Google Scholar]
- Wang S, Guo M, Ouyang H, Li X, Cordon-Cardo C, Kurimasa A, Chen DJ, Fuks Z, Ling CC, Li GC. The catalytic subunit of DNA-dependent protein kinase selectively regulates p53-dependent apoptosis but not cell-cycle arrest. Proceedings of the National Academy of Sciences of the United States of America. 2000;97:1584–1588. doi: 10.1073/pnas.97.4.1584. [DOI] [PMC free article] [PubMed] [Google Scholar]
- Weerapana E, Wang C, Simon GM, Richter F, Khare S, Dillon MB, Bachovchin DA, Mowen K, Baker D, Cravatt BF. Quantitative reactivity profiling predicts functional cysteines in proteomes. Nature. 2010;468:790–795. doi: 10.1038/nature09472. [DOI] [PMC free article] [PubMed] [Google Scholar]
- Xu T, Venable JD, Park SK, Cociorva D, Lu B, Liao L, Wohlschlegel J, Hewel J, Yates JR., 3rd ProLuCID, a Fast and Sensitive Tandem Mass Spectra-based Protein Identification Program. Mol Cell Proteomics. 2006;5:S174. [Google Scholar]
Associated Data
This section collects any data citations, data availability statements, or supplementary materials included in this article.