


Abstract
Computationally identifying effective biomarkers for cancers from gene expression profiles is an important and challenging task. The challenge lies in the complicated pathogenesis of cancers that often involve the dysfunction of many genes and regulatory interactions. Thus, sophisticated classification model is in pressing need. In this study, we proposed an efficient approach, called ellipsoidFN (ellipsoid Feature Net), to model the disease complexity by ellipsoids and seek a set of heterogeneous biomarkers. Our approach achieves a non-linear classification scheme for the mixed samples by the ellipsoid concept, and at the same time uses a linear programming framework to efficiently select biomarkers from high-dimensional space. ellipsoidFN reduces the redundancy and improves the complementariness between the identified biomarkers, thus significantly enhancing the distinctiveness between cancers and normal samples, and even between cancer types. Numerical evaluation on real prostate cancer, breast cancer and leukemia gene expression datasets suggested that ellipsoidFN outperforms the state-of-the-art biomarker identification methods, and it can serve as a useful tool for cancer biomarker identification in the future. The Matlab code of ellipsoidFN is freely available from http://doc.aporc.org/wiki/EllipsoidFN.
INTRODUCTION
Computationally identifying cancer biomarkers that can indicate specific cancer types is an important and challenging topic in the current biomedical research because it can not only provide insightful clues into the cancer pathogenesis but also can help accurate diagnosis and prognosis. With the development of high-throughput technologies, e.g., microarrays and the next generation sequencing technologies, more than thousands of genes can be measured simultaneously. How to select the most meaningful biomarkers from the large number of genes forms a common question that scientists and clinicians often come across.
The most straightforward method for identifying cancer biomarkers is to calculate the fold changes of gene expressions in different classes of samples, given that the gene expression data is used to characterize the biological states. The larger the fold change is, the more likely the gene is a biomarker. However, this method does not consider the variations among samples of the same classes. Hence, the methods based on or similar to the Student's t-test or Wilcoxon rank-sum test are introduced to eliminate the irrelevant or noisy features (1,2). Owing to the multiple testing issues, methods such as SAM that provides fine false discovery rate control were invented (3). All these methods score genes one by one based on their expression levels and can generate many redundant biomarkers. Peng et al. (4) propose a criterion based on mutual information (MI) to find a set of biomarkers that have the maximal relevancy to the class labels but minimal redundancy within themselves. But the underlying assumptions of this method are not very clear.
In nature, biomarker identification is intrinsically linked to class assignment to samples (5–7). From a machine learning viewpoint, biomarker identification is a feature selection problem, given the biological states of samples (e.g., cancer or normal). The aim of feature selection is to find a set of features that can maximize the prediction accuracy of a classifier (8,9). With different classifiers, the identified biomarkers may be different. Many supervised or semi-supervised machine learning methods, such as support vector machines and Bayesian networks, can be exploited as the classifiers to guide the identification of biomarkers (1,10–14). Support vector machines provide a model assuming that biological states were linearly separated in the feature space, whereas Bayesian networks use graphs to model the complicated relationships among features. However, biomarker identification is not explicitly embedded in these methods. A model for simultaneous biomarker identification, especially non-redundant biomarker identification, and classification is needed to explicitly model the properties of biological states.
In this study, we explicitly considered the heterogeneity of cancers and proposed a novel model based on linear programming. In the gene expression space, we used ellipsoids to model cancers and normal samples and tried to identify a minimal set of genes to maximize the distinctiveness between cancers and normal samples and between cancer types. Different from the general biomarker identification approaches, it produces a set of non-redundant but complementary biomarkers that maintain the maximal classification ability. Computational results on prostate cancer, breast cancer, and leukemia gene expression datasets suggested that our method significantly outperformed the state-of-the-art biomarker identification methods.
MATERIALS AND METHODS
Overview of ellipsoidFN
We construct our method based on two assumptions: (i) Cancer and normal samples are stable biological states in the gene expression space; (ii) The differences of cancers from normal samples or from another cancer type are sample heterogeneous, i.e. one patient develops cancer because of the dysfunction of one gene, but another patient may develop cancer due to the dysfunction of a second gene. We try to seek a minimal set of genes such that cancers and normal samples are represented by different ellipsoids and that the distances between ellipsoids are maximized (Figure 1).
Figure 1.
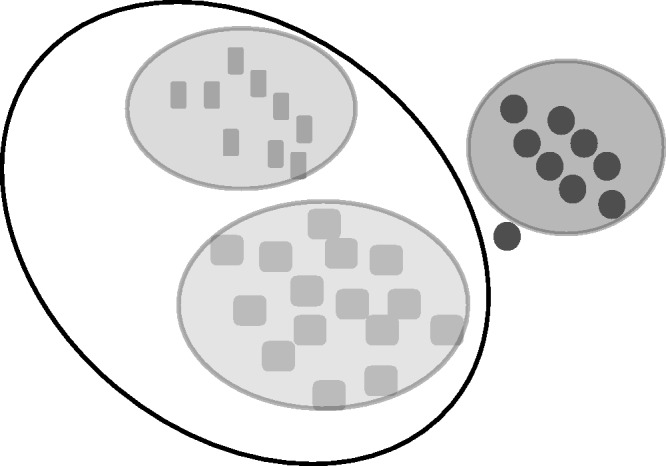
The schematic diagram of ellipsoidFN. ellipsoidFN tries to represent each cancer type by ellipsoids in the gene space and maximizes the distance between ellipsoids. A meta-ellipsoid (black) can be added to represent the relationship between cancer types.
Given a gene expression data set  , in which the expression of n genes is measured for m samples, and
  denotes the expression level of gene j in sample i, we set
 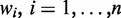 , denoting the weight for each gene to be determined. Supposing that there are in total c sample classes, the formulation of our method can be described as follows:
 |
(1) |
Subject to
 |
(2) |
 |
(3) |
| (4) |
| (5) |
| (6) |
Where  is the average/median expression level of gene i in class a.
  is the set of samples belonging to class a.
  and
and  are variables defining the inner and outer radius of the ellipsoid representing class a.
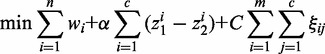
  are slack variables to tolerate the data errors. Equation (1) presents the objective function for the optimization problem. It consists of three terms.
  denotes the weight summarization of selected genes. By minimizing it, we aim to select a few of genes as biomarkers to enhance the interpretability. The second term
  is minimized to enlarge the difference of inner and outer radiuses of ellipsoid for perfect separation for each class. The third term
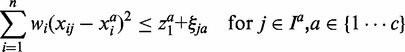
 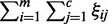 denotes the total classification errors for all the samples. It should be minimized to achieve high classification accuracy. Here α and C are two parameters introduced to balance the above three goals and unify them into a single objective function. Equation (2) implements the assumption (1), i.e., samples from the same cancer type are enclosed by one ellipsoid, which minimizes the distance of a sample from its class center. Equation (3) implements the assumption (2), i.e., every sample from the other cancers locates outside of the ellipsoid representing the current cancer. The divergence of one cancer from another cancer or normal samples is measured by the weighted sum of the divergence of gene expressions such that heterogeneity is modeled. The goal is to identify a minimal set of genes that maximize the distances between ellipsoids. We used the quadratic function in constraints (2) and (3). Other non-negative functional forms, e.g., the absolute values used in (15), can also be applied in a similar way.
We tuned two parameters, α and C, by grid search in the parameter space. For α, we tested 0.1, 0.5, 1, 2, 5, 10 and 100. For C, we tested 10, 100, 1000 and 10 000. The model will generate a trivial zero solution when α is small enough or C is large enough. Smaller α means the fewer biomarkers, whereas larger C means less classification errors. Thus, the parameter pair, which leads to non-trivial solution and at the same time has smaller α and larger C, was finally selected as our optimal parameter. α can be further decomposed into two separate parameters for  and
and  , respectively. In this situation, the weights of
  and
and  can be tuned separately. Here, we used the same parameters for
  and
and  to reduce the total number of parameters in the model.
We name our method as ellipsoidFN (ellipsoid Feature Net). Different from the one-by-one biomarker identifying methods (like fishing by a fishing rod), ellipsoidFN simultaneously identifies a minimal set of genes that represent different cancer types and normal samples as discrete ellipsoids (like fishing by a fishing net). Altering the parameters can adjust the number of identified biomarkers (like adjusting the size of the fishing net grid). Mathematically, ellipsoidFN is a linear programming model that can be solved efficiently in polynomial time. Thus, it can be applied to high-dimensional datasets.
ellipsoidFN is flexible. It can deal with any number of classes that have any relationship (unordered, linearly ordered, tree-ordered, etc.) as long as the computer memory and processor allows. For unordered multiple classes, the formulation is just illustrated as above. For cases where there are complicated relationships among classes, additional ellipsoids can be added into the model to represent meta-class denoting the class relationship.
Data sets and metrics for evaluation
We compared ellipsoidFN with the start-of-the-art biomarker identifying methods, which are widely used. For two-class cases, we compared ellipsoidFN with mRMR (4) and t-test. For multiple classes, we compared ellipsoidFN with minimum Redundancy Maximum Relevance Feature Selection (mRMR) and F-test-based gene weighting scheme. Evaluations were done on three different cancers (prostate cancer, breast cancer, and leukemia). The prostate cancer gene expression data set (16) was downloaded from the National Center for Biotechnology Information (NCBI) Gene Expression Omnibus (GEO) database (17) with accession number GDS3289. The breast cancer gene expression data set (18) was downloaded from the NCBI GEO database with accession number GSE10797. The leukemia gene expression data set was from (19). Four metrics were used to compare the results of ellipsoidFN and the state-of-the-art methods. One metric is the mean redundancy score between the identified biomarkers. Given two genes, the score of their redundancy was measured by the Pearson correlation coefficients (PCC) and MI of two genes’ expression profiles. The second and third metrics are the inter-class and intra-class similarity scores (measured by the PCCs and MI of two samples’ gene expression profiles). The fourth metric is the leave-one-out cancer classification error rate based on the identified biomarkers (naïve Bayes classifier). The smaller the redundancy, the inter-class similarity and the error rate are, the better the method is. The larger the in-class similarity is, the better the method performs. All the calculations were conducted in Matlab 7.13 on a computer with a 2.26 GHz Inter Core 2 Due CPU and 3GB memory. For a two-class data set with 72 samples and 1000 genes, ellipsoidFN took <1 min to identify the optimal biomarker set.
RESULTS
Comparisons on prostate cancer data set
There are totally 104 samples and 9483 genes in the prostate cancer dataset. The 104 samples consist of 22 normal samples and five different stages of prostate cancer samples. When we got the raw data, we filtered out those genes with missing values and those genes with low information content (measured by entropy of the gene expression distribution, <0.5). The normal and metastatic prostate cancer samples were extracted to evaluate the performances of ellipsoidFN, mRMR, and t-test. The normal, metastatic prostate cancer, and localized prostate cancer samples were extracted to assess the performances of ellipsoidFN, mRMR, and F-test. For each situation, the top 50 genes were selected as the most potential biomarkers in comparison.
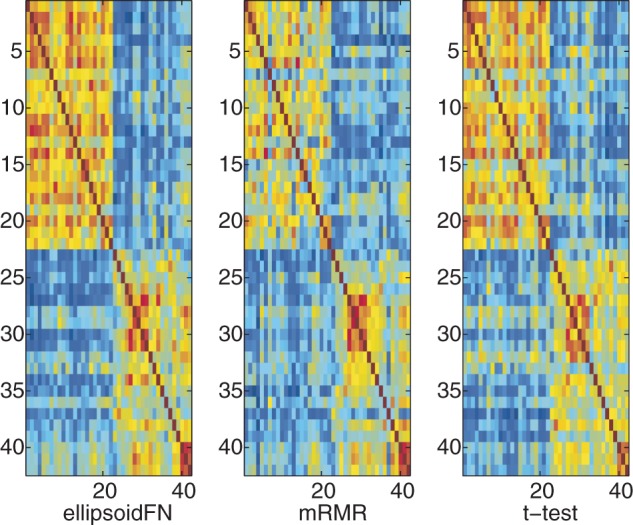
For two-class case, the biomarker redundancy of ellipsoidFN was lower than those of mRMR and t-test (Figure 2 and Table 1). The mean biomarker redundancy score (measured by PCC) of ellipsoidFN was 0.2350, whereas the mean redundancy score of mRMR was 0.2530 (PCC). The difference was significant (P = 0.0012, Student's t-test). The mean biomarker redundancy score of t-test was 0.4952 (PCC), much larger than that of ellipsoidFN (P < 10−20, Student's t-test). If MI was used to measure the biomarker redundancy, ellipsoidFN still identified the most heterogeneous biomarkers. Randomly sampling 1000 sets of biomarkers (50 genes per set), all the 1000 biomarker redundancy scores were smaller than those of ellipsoidFN (except two random biomarker sets for PCC), mRMR (no exception) and t-test (no exception) with regards to both PCC and MI, suggesting that ellipsoidFN identified a set of more heterogeneous biomarkers than mRMR and t-test.
Figure 2.
The biomarker redundancy heatmap of ellipsoidFN, mRMR, and t-test on the prostate cancer dataset when only two classes were considered. Red means high redundancy. Blue means no redundancy.
Table 1.
Comparison of ellipsoidFN, mRMR, and t-test for two-class situations
| ellipsoidFN | mRMR | t-test | |
|---|---|---|---|
| Prostate cancer | |||
| Bredundancy | 0.235a/0.0021 | 0.253/0.0059 | 0.4952/0.0066 |
| Sin-class | 0.3632/0.1494 | 0.2849/0.0064 | 0.3483/0.0028 |
| Sinter-class | −0.1733/0.1037 | −0.0788/0.0013 | −0.1274/0.0013 |
| Error rate | 0 | 0.0238 | 0.0238 |
| Breast cancer | |||
| Bredundancy | 0.2136/0.0526 | 0.2097/0.0271 | 0.3462/0.0837 |
| Sin-class | 0.3586/0.1552 | 0.7328/0.3433 | 0.4893/0.2164 |
| Sinter-class | 0.3576/0.1726 | 0.6962/0.3459 | 0.4401/0.2179 |
| Error rate | 0.0303 | 0.0152 | 0.0455 |
| Leukemia | |||
| Bredundancy | 0.322/0.0058 | 0.4912/0.0158 | 0.5804/0.0196 |
| Sin-class | 0.7249/0.0532 | 0.5537/0.0347 | 0.6778/0.0557 |
| Sinter-class | 0.3396/0.0150 | −0.2819/0.0184 | −0.0765/0.0122 |
| Error rate | 0.0139 | 0.0278 | 0.0417 |
aBold font indicates the best performer. Values in cells are PCC/MI, where PCC is Pearson correlation coefficient and MI is mutual information.
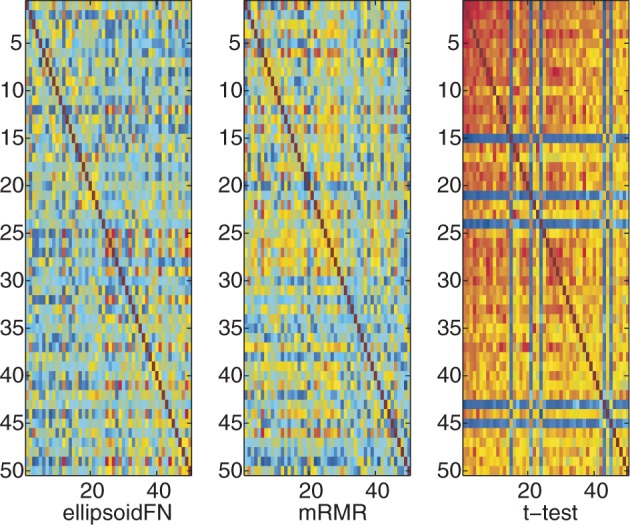
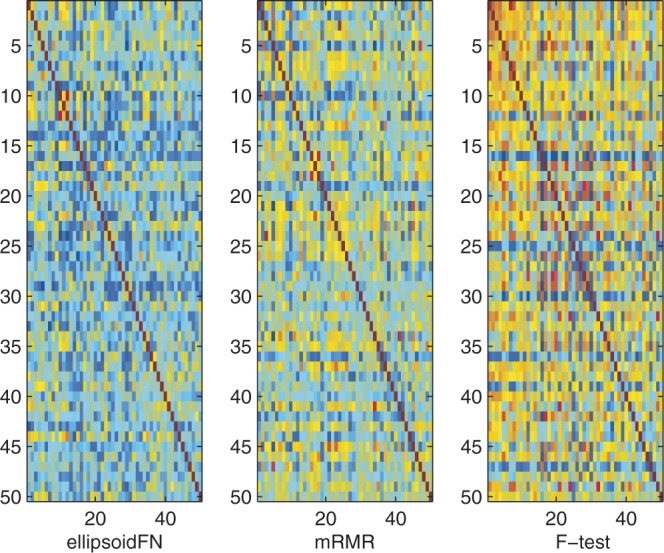
Exploiting the complementariness among the identified biomarkers, ellipsoidFN improved the in-class similarity and reduced the inter-class similarity of normal and prostate cancer samples (Figure 3 and Table 1). The in-class similarity of ellipsoidFN was 0.3632 (PCC), whereas the in-class similarity of mRMR was 0.2849 (PCC). The difference was statistically significant (P < 10−8, Student's t-test). The in-class similarity of t-test was similar to that of ellipsoidFN (0.3483, PCC). The inter-class similarity of ellipsoidFN was −0.1733 (PCC) whereas those of mRMR and t-test were −0.0788 (P < 10−20, Student's t-test) and −0.1274 (P < 10−5, Student's t-test), respectively. MI still supports the highest in-class similarity of ellipsoidFN. But mRMR and t-test got the lowest MI inter-class similarity.
Figure 3.
The sample similarity based on biomarkers identified by ellipsoidFN, mRMR, and t-test on the prostate cancer dataset when only two classes were considered. Red means high similarity. Blue means the opposite.
To evaluate the predictive power of the identified biomarkers, we used the Naïve Bayes classifier to predict the sample types by leave-one-out cross-validation. The error rates of ellipsoidFN, mRMR, and t-test were 0 (0/42), 0.0238 (1/42), and 0.0238 (1/42), respectively, suggesting the effectiveness of ellipsoidFN. We also plotted the receiver operating characteristic (ROC) curve to evaluate the true positive rate and false positive rate (Supplementary Figure S1). The ROC curve suggested that ellipsoidFN and mRMR are almost the same and both better than t-test.
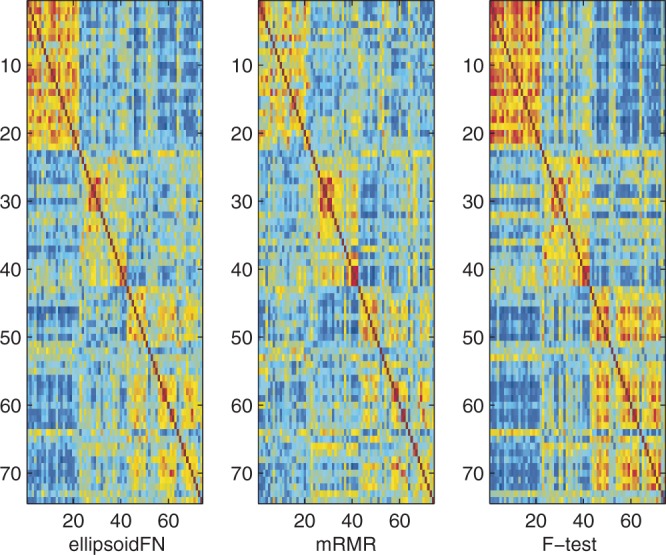
For multiple-class case, ellipsoidFN also showed excellent performance, compared with mRMR and F-test. The biomarker redundancy of ellipsoidFN was 0.1895 (PCC), whereas those of mRMR and F-test were 0.2284 (P < 10−13, Student's t-test) and 0.3247 (P < 10−20, Student's t-test), respectively (Figure 4 and Table 2). Randomly sampling 1000 sets of biomarkers (50 genes per set), 426 biomarker sets had redundancy scores smaller than that of ellipsoidFN, whereas 996 had scores smaller than that of mRMR, and no set smaller than that of t-test with regards to PCC. Measuring by MI, four random biomarker sets had redundancy scores larger than that of ellipsoidFN, but all random biomarker sets had redundancy scores smaller than those of mRMR and t-test. The in-class similarity of ellipsoidFN was 0.2520 (PCC), whereas that of mRMR was 0.1852 (P < 10−11, Student's t-test). The in-class similarity of F-test was 0.3109 (P < 10−9, Student's t-test), larger than that of ellipsoidFN (Figure 5 and Table 2). This is reasonable because more redundant biomarkers were selected by F-test, and ellipsoidFN is designed to handle the sample heterogeneity. The inter-class similarity of ellipsoidFN is smaller than that of mRMR (P < 10−9, Student's t-test) but larger than that of F-test (P < 10−7, Student's t-test). The error rates of ellipsoidFN, mRMR and F-test in leave-one-out experiment by Naïve Bayes classifier are 0.0135, 0.1351 and 0.0946, respectively. This further proves the effectiveness of ellipsoidFN.
Figure 4.
The biomarker redundancy heatmap of ellipsoidFN, mRMR, and F-test on the prostate cancer dataset when three classes were considered. Red means high redundancy. Blue means no redundancy.
Table 2.
Comparison of ellipsoidFN, mRMR, and F-test for multiple-class situations
| ellipsoidFN | mRMR | F-test | |
|---|---|---|---|
| Prostate cancer | |||
| Bredundancy | 0.1895a/0.0013 | 0.2284/0.0053 | 0.3247/0.0036 |
| Sin-class | 0.252/0.0028 | 0.1852/0.0054 | 0.3109/0.0036 |
| Sinter-class | −0.1096/0.0013 | −0.0774/0.0023 | −0.1396/0.0015 |
| Error rate | 0.0135 | 0.1351 | 0.0946 |
| Breast cancer | |||
| Bredundancy | 0.1924/0.0457 | 0.3386/0.0709 | 0.5047/0.1075 |
| Sin-class | 0.4461/0.2335 | 0.5901/0.2100 | 0.7914/0.4279 |
| Sinter-class | 0.3833/0.1975 | 0.4219/0.1361 | 0.7047/0.3576 |
| Error rate | 0.1818 | 0.2121 | 0.2121 |
| Leukemia | |||
| Bredundancy | 0.2645/0.0048 | 0.4127/0.0173 | 0.4391/0.0164 |
| Sin-class | 0.7188/0.0496 | 0.6775/0.0522 | 0.8038/0.0855 |
| Sinter-class | 0.3276/0.0142 | −0.0459/0.0086 | 0.1442/0.0093 |
| Error rate | 0.0417 | 0.0694 | 0.0417 |
aBold font indicates the best performer. Values in cells are PCC/MI, where PCC is Pearson correlation coefficients and MI is mutual information.
Figure 5.
The sample similarity based on biomarkers identified by ellipsoidFN, mRMR, and t-test on the prostate cancer dataset when three classes were considered. Red means high similarity. Blue means the opposite.
We compared the biomarkers identified by different methods (Figure 6). For two-class case, ellipsoidFN had 12 biomarkers overlapped with t-test and 10 with mRMR. There were three biomarkers shared by all the three methods. Most biomarkers identified by the three methods were method specific. Among the 30 ellipsoidFN-specific biomarkers (see Supplementary Data Sets 1–9 for the full lists of the biomarkers identified by ellipsoidFN on all the three data sets), PCBP1 regulates the expression of the androgen receptor (20). ALDH1A1 is demonstrated to be a marker for malignant prostate stem cells and predictor of prostate cancer patients’ outcome (21). RPL15 is observed to be a frequent aberration in multiple tumor samples including prostate cancer (22). Overexpression of NCOR2 is demonstrated to activate the activity of the androgen receptor in a cell type-specific context (23). Targeting JunD is suggested as a potential strategy to counteract hormone-refractory prostate cancer (24). MDM2 is proved to mediate the interaction between USP2a and MYC in prostate cancer (25). SPRY1 is a potential tumor suppressor in prostate cancer (26). For multiple-class case, ellipsoidFN, mRMR and F-test identified two common biomarkers, TCN2 and C5orf13. TCN2 is associated with reduced risk of prostate risk (27). TP53BP2, ALDH1A3, RPL15, ANXA1, COMP and IGF2 in the 32 ellipsoidFN-specific biomarkers are reported to associated with cancers (22,28–32).
Figure 6.
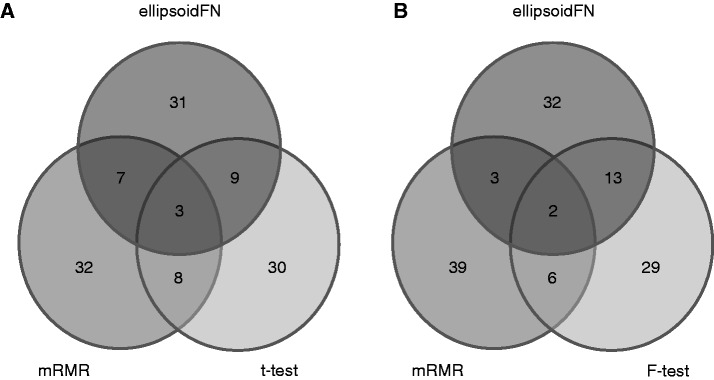
(A) biomarkers identified by ellipsoidFN, mRMR, and t-test on the prostate cancer dataset when two classes were considered; (B) biomarkers identified by ellipsoidFN, mRMR, and F-test on the prostate cancer dataset when three classes were considered.
Comparisons on breast cancer and leukemia data set
We further evaluated ellipsoidFN on a breast cancer and a leukemia data set. The breast cancer data set consists of 22 277 probes and 66 samples, including five normal stromal samples, five normal epithelial samples, 28 stromal samples of breast cancers and 28 epithelial samples of breast cancers. After removing the probes with missing values and low information-content, we retained 1000 informative probes for biomarker identification. Then, we applied ellipsoidFN, mRMR, and t-test to identify biomarkers distinguishing the 10 normal samples from the 56 breast cancer samples. F-test, mRMR, and ellipsoidFN were applied to identify biomarkers discriminating normal stromal, normal epithelial, breast cancer stromal and breast cancer epithelial samples. For each method, the top 50 biomarkers were extracted for comparison.
For the two-class case of the breast cancer data set (Table 1), the biomarker redundancy of ellipsoidFN is smaller than that of t-test (P < 10−20, Student's t-test, PCC) but larger than that of mRMR (P = 0.4481, Student's t-test, PCC). The in-class sample similarity of ellipsoidFN is lower than those of mRMR (P < 10−20, Student's t-test, PCC) and t-test (P < 10−20, Student's t-test, PCC), maybe owing to the in-class heterogeneity because we mixed stromal and epithelial samples in the same pseudo classes. The inter-class sample similarity of ellipsoidFN is lower than those of mRMR (P < 10−20, Student's t-test, PCC) and t-test (P < 10−12, Student's t-test, PCC). Based on the three identified biomarker sets, we evaluated the leave-one-out prediction accuracy by Naïve Bayes classifier. The error rates of ellipsoidFN, mRMR and t-test are 0.0303, 0.0152 and 0.0455, respectively. The ROC curve suggested that ellipsoidFN and mRMR are almost the same and better than t-test (Supplementary Figure S2). Randomly sampling 1000 sets of biomarkers (50 genes per set), only 1 of the 1000 redundancy scores measured by PCC was smaller than those of ellipsoidFN and mRMR. In all, 997 scores were smaller than that of t-test. Measured by MI, no random biomarker set had redundancy score smaller than that of mRMR, and no random biomarker set had redundancy score larger than that of t-test. In all, 519 of the 1000 random biomarker sets had redundancy score smaller than that of ellipsoidFN.
For multiple-case of the breast cancer data set (Table 2), the biomarker redundancy of ellipsoidFN was still significantly lower than those of mRMR (P < 10−20, Student's t-test) and F-test (P < 10−20, Student's t-test). The in-class sample similarity of ellipsoidFN was lower than those of mRMR (P < 10−20, Student's t-test) and F-test (P < 10−20, Student's t-test), may be owing to the intrinsic in-class heterogeneity. The inter-class sample similarity of ellipsoidFN is lower than those of mRMR (P < 10−20, Student's t-test) and F-test (P < 10−20, Student's t-test). The leave-one-out prediction error rates of ellipsoidFN, mRMR and F-test are 0.1818, 0.2121 and 0.2121, respectively. Randomly sampling 1000 sets of biomarkers (50 genes per set), no PCC redundancy score was smaller than that of ellipsoidFN; 990 were smaller than that of mRMR, and no score was larger than t-test.
The leukemia data set is composed of 7129 probes and 72 samples including 25 acute myeloid leukemia samples, 38 B-cell acute lymphoblastic leukemia (ALL) samples and nine T-cell ALL samples. After removing probes with missing values, three preprocessing steps including flooring/ceiling, filtering and log10-transformation were applied to select informative probes (33). Finally, 1000 of the most informative probes were retained for evaluation. First, ellipsoidFN, mRMR and t-test were applied to discriminate acute myeloid leukemias from ALLs (Table 1). The redundancy of the top 50 biomarkers of ellipsoidFN is lower than those of mRMR (P < 10−20, Student's t-test, PCC) and t-test (P < 10−20, Student's t-test, PCC). The in-class sample similarity of ellipsoidFN is larger than those of mRMR (P < 10−20, Student's t-test, PCC) and t-test (P < 10−20, Student's t-test, PCC). The inter-class sample similarity of ellipsoidFN was larger than those of mRMR (P < 10−20, Student's t-test, PCC) and t-test (P < 10−20, Student's t-test, PCC). The leave-one-out prediction error rates of ellipsoidFN, mRMR and t-test are 0.0139, 0.0278 and 0.0417, respectively. The ROC curve suggested that ellipsoidFN reached the highest true positive rate at a low false positive rate (Supplementary Figure S3). Randomly sampling 1000 sets of biomarkers (50 genes per set) suggested that no random redundancy score (PCC or MI) was larger than those of ellipsoidFN, mRMR, and t-test.
For multiple-class case of the leukemia data set (Table 2), the biomarker redundancy of ellipsoidFN is smaller than those of mRMR (P < 10−20, Student's t-test, PCC) and F-test (P < 10−20, Student's t-test, PCC). The in-class sample similarity of ellipsoidFN is larger than that of mRMR (P < 10−20, Student's t-test, PCC) but smaller than that of F-test (P < 10−20, Student's t-test, PCC). The inter-class sample similarity of ellipsoidFN was larger than those of mRMR (P < 10−20, Student's t-test, PCC) and F-test (P < 10−20, Student's t-test, PCC) because ellipsoidFN included biomarkers that B-cell ALLs and T-cell ALLs shared. The leave-one-out prediction error rates of ellipsoidFN, mRMR and F-test are 0.0417, 0.0694 and 0.0417, respectively. Randomly sampling 1000 sets of biomarkers (50 genes per set) suggested that no random redundancy score (PCC or MI) was larger than those of ellipsoidFN, mRMR, and t-test.
DISCUSSIONS
Identifying effective biomarkers for cancers is a challenging task because of the complexity of cancer pathogenesis. As many genes and gene interactions are involved in the cancer progression, it is especially challenging to identify cancer biomarkers through a small number of samples (34). Samples of the same cancer type may carry different aberrations. Thus, effective cancer biomarkers need to be addressed from a gene set view. Peng et al. firstly introduced mRMR to identify a biomarker set with minimum redundancy and maximum relevance. But the underlying assumptions of the method are not clear. We modeled the heterogeneity of cancer samples and tried to identify a minimal biomarker set, resulting in a more non-redundant and relevant biomarker set than mRMR in most cases. Thus, the assumptions in ellipsoidFN may correctly reflect, at least partially, the truth of caner generation and progression, and the implementation of ellipsoidFN may be more efficient.
We modeled the stable state of cancer types and normal samples by the average gene expressions of samples in ellipsoidFN. This is a little arbitrary, but facilitates the solving of ellipsoidFN. A future work is to optimize the representation of cancer types and normal samples. Besides, ellipsoids maybe cannot model the classes in some data sets perfectly, e.g. non-convex shapes in the geometric space. These situations may be solved by other modeling functions or be approximated by ellipsoids.
We demonstrated the performance of ellipsoidFN in two-class cases and multiple-class cases in this study. We observed that the biomarkers it identified are robust, in some ways, to the labels assigned to samples. For example, in the leukemia data set, we merged the B cell ALLs and T cell ALLs to test the performance of ellipsoidFN in two-class situations. In the sample similarity heatmap (Supplementary Figure S1), the distinctiveness between B cell ALLs and T cell ALLs was still obvious, revealed by ellipsoidFN. However, the distinctiveness became very weak in the sample similarity heatmaps revealed by mRMR and t-test (Supplementary Figure S1). The reason may lay in the inclusion of B cell ALL-specific and T cell ALL-specific biomarkers. Thus, ellipsoidFN is capable of reflecting the substructures of cancer types. Actually, ellipsoidFN is very flexible to incorporate complicated relationships among cancer types by introducing meta-ellipsoids (not demonstrated).
Actually, the solution to the cancer biomarker identification problem is not unique. There are many combinations of genes to distinguish cancer types and normal samples (33) because of curse of dimensionality (small number of samples but large number of genes). Different from those biomarkers identified by t-test or F-test, which were statistically significant, ellipsoidFN can identify biomarkers that may be not statistically significant but can enhance the explanation power of the identified biomarker set. This is very useful to identify new oncogenes and cancer suppressor genes (as demonstrated in the prostate cancer example).
The rapid development of cancer research has elucidated more and more details of cancer pathogenesis that can be organized as dynamic biological networks. ellipsoidFN was built solely based on the gene expression profiles of samples. A promising direction to extend ellipsoidFN is to integrate the current knowledge of cancer pathogenesis. Also, integrating biomolecular network to identify network biomarkers (34) or further dynamical network biomarkers (35) is an important future topic.
SUPPLEMENTARY DATA
Supplementary Data are available at NAR Online: Supplementary Figures 1–3 and Supplementary Data Sets 1–9.
FUNDING
The National Natural Science Foundation of China [11131009, 61171007, 61134013 and 91029301]; Chief Scientist Program of Shanghai Institutes for Biological Sciences, CAS (in part) [2009CSP002]. Funding for open access charge: The National Natural Science Foundation of China [11131009].
Conflict of interest statement. None declared.
Supplementary Material
ACKNOWLEDGEMENTS
The authors would thank all the members of Zhangroup of Academy of Mathematics and Systems Science (AMSS), and Key laboratory of Systems Biology, Chinese Academy of Sciences (CAS) for their valuable discussions and comments. The authors also thank the reviewers for their suggestions to further improve the manuscript.
REFERENCES
- 1.Baldi P, Long AD. A Bayesian framework for the analysis of microarray expression data: regularized t-test and statistical inferences of gene changes. Bioinformatics. 2001;17:509–519. doi: 10.1093/bioinformatics/17.6.509. [DOI] [PubMed] [Google Scholar]
- 2.Sandrine D, Hwa YY, Matthew CJ, Terence SP. Statistical methods for identifying differentially expressed genes in replicated cDNA microarray experiments. Stat. Sin. 2002;12:111–139. [Google Scholar]
- 3.Tusher VG, Tibshirani R, Chu G. Significance analysis of microarrays applied to the ionizing radiation response. Proc. Natl Acad. Sci. USA. 2001;98:5116–5121. doi: 10.1073/pnas.091062498. [DOI] [PMC free article] [PubMed] [Google Scholar]
- 4.Peng H, Long F, Ding C. Feature selection based on mutual information: criteria of max-dependency, max-relevance, and min-redundancy. IEEE Trans. Pattern Anal. Mach. Intell. 2005;27:1226–1238. doi: 10.1109/TPAMI.2005.159. [DOI] [PubMed] [Google Scholar]
- 5.Saeys Y, Inza I, Larrañaga P. A review of feature selection techniques in bioinformatics. Bioinformatics. 2007;23:2507–2517. doi: 10.1093/bioinformatics/btm344. [DOI] [PubMed] [Google Scholar]
- 6.Buturović LJ. PCP: a program for supervised classification of gene expression profiles. Bioinformatics. 2006;22:245–247. doi: 10.1093/bioinformatics/bti760. [DOI] [PubMed] [Google Scholar]
- 7.Li T, Zhang C, Ogihara M. A comparative study of feature selection and multiclass classification methods for tissue classification based on gene expression. Bioinformatics. 2004;20:2429–2437. doi: 10.1093/bioinformatics/bth267. [DOI] [PubMed] [Google Scholar]
- 8.Abeel T, Helleputte T, Van de Peer Y, Dupont P, Saeys Y. Robust biomarker identification for cancer diagnosis with ensemble feature selection methods. Bioinformatics. 2010;26:392–398. doi: 10.1093/bioinformatics/btp630. [DOI] [PubMed] [Google Scholar]
- 9.Hwang T, Sicotte H, Tian Z, Wu B, Kocher J-P, Wigle DA, Kumar V, Kuang R. Robust and efficient identification of biomarkers by classifying features on graphs. Bioinformatics. 2008;24:2023–2029. doi: 10.1093/bioinformatics/btn383. [DOI] [PubMed] [Google Scholar]
- 10.Gevaert O, Smet FD, Timmerman D, Moreau Y, Moor BD. Predicting the prognosis of breast cancer by integrating clinical and microarray data with Bayesian networks. Bioinformatics. 2006;22:e184–e190. doi: 10.1093/bioinformatics/btl230. [DOI] [PubMed] [Google Scholar]
- 11.Guyon I, Weston J, Barnhill S, Vapnik V. Gene selection for cancer classification using support vector machines. Mach. Learn. 2002;46:389–422. [Google Scholar]
- 12.Zhang HH, Ahn J, Lin X, Park C. Gene selection using support vector machines with non-convex penalty. Bioinformatics. 2006;22:88–95. doi: 10.1093/bioinformatics/bti736. [DOI] [PubMed] [Google Scholar]
- 13.Fox RJ, Dimmic MW. A two-sample Bayesian t-test for microarray data. BMC Bioinformatics. 2006;7:126. doi: 10.1186/1471-2105-7-126. [DOI] [PMC free article] [PubMed] [Google Scholar]
- 14.Díaz-Uriarte R, Alvarez de Andrés S. Gene selection and classification of microarray data using random forest. BMC Bioinformatics. 2006;7:3. doi: 10.1186/1471-2105-7-3. [DOI] [PMC free article] [PubMed] [Google Scholar]
- 15.Wang Y, Wu Q-F, Chen C, Wu L-Y, Yan X-Z, Yu S-G, Zhang X-S, Liang F-R. Revealing metabolite biomarkers for acupuncture treatment by linear programming based feature selection. BMC Syst. Biol. 2012;6:S15. doi: 10.1186/1752-0509-6-S1-S15. [DOI] [PMC free article] [PubMed] [Google Scholar]
- 16.Tomlins SA, Mehra R, Rhodes DR, Cao X, Wang L, Dhanasekaran SM, Kalyana-Sundaram S, Wei JT, Rubin MA, Pienta KJ, et al. Integrative molecular concept modeling of prostate cancer progression. Nat. Genet. 2007;39:41–51. doi: 10.1038/ng1935. [DOI] [PubMed] [Google Scholar]
- 17.Barrett T, Troup DB, Wilhite SE, Ledoux P, Evangelista C, Kim IF, Tomashevsky M, Marshall KA, Phillippy KH, Sherman PM, et al. NCBI GEO: archive for functional genomics data sets—10 years on. Nucleic Acids Res. 2011;39:D1005–D1010. doi: 10.1093/nar/gkq1184. [DOI] [PMC free article] [PubMed] [Google Scholar]
- 18.Casey T, Bond J, Tighe S, Hunter T, Lintault L, Patel O, Eneman J, Crocker A, White J, Tessitore J, et al. Molecular signatures suggest a major role for stromal cells in development of invasive breast cancer. Breast Cancer Res. Treat. 2009;114:47–62. doi: 10.1007/s10549-008-9982-8. [DOI] [PubMed] [Google Scholar]
- 19.Golub TR, Slonim DK, Tamayo P, Huard C, Gaasenbeek M, Mesirov JP, Coller H, Loh ML, Downing JR, Caligiuri MA, et al. Molecular classification of cancer: class discovery and class prediction by gene expression monitoring. Science. 1999;286:531–537. doi: 10.1126/science.286.5439.531. [DOI] [PubMed] [Google Scholar]
- 20.Cloke B, Shah K, Kaneda H, Lavery S, Trew G, Fusi L, Higham J, Dina RE, Ghaem-Maghami S, Ellis P, et al. The poly(c)-binding protein-1 regulates expression of the androgen receptor. Endocrinology. 2010;151:3954–3964. doi: 10.1210/en.2009-1264. [DOI] [PubMed] [Google Scholar]
- 21.Li T, Su Y, Mei Y, Leng Q, Leng B, Liu Z, Stass SA, Jiang F. ALDH1A1 is a marker for malignant prostate stem cells and predictor of prostate cancer patients' outcome. Lab. Invest. 2010;90:234–244. doi: 10.1038/labinvest.2009.127. [DOI] [PMC free article] [PubMed] [Google Scholar]
- 22.Pavlova TV, Kashuba VI, Muravenko OV, Yenamandra SP, Ivanova TA, Zabarovskaia VI, Rakhmanaliev ER, Petrenko LA, Pronina IV, Loginov VI, et al. Technology of analysis of epigenetic and structural changes of epithelial tumors genome with NotI-microarrays by the example of human chromosome. Mol. Biol. 2009;43:339–347. [PubMed] [Google Scholar]
- 23.Laschak M, Bechtel M, Spindler K-D, Hessenauer A. Inability of NCoR/SMRT to repress androgen receptor transcriptional activity in prostate cancer cell lines. Int. J. Mol. Med. 2011;28:645–651. doi: 10.3892/ijmm.2011.735. [DOI] [PubMed] [Google Scholar]
- 24.Sarkar D, Wang X-Y, Fisher PB. Targeting JunD: a potential strategy to counteract hormone-refractory prostate cancer. Cell Cycle. 2011;10:3433. doi: 10.4161/cc.10.20.17668. [DOI] [PMC free article] [PubMed] [Google Scholar]
- 25.Benassi B, Flavin R, Marchionni L, Zanata S, Pan Y, Chowdhury D, Marani M, Strano S, Muti P, Blandino G, et al. MYC is activated by USP2a-mediated modulation of microRNAs in prostate cancer. Cancer Discov. 2012;2:236–247. doi: 10.1158/2159-8290.CD-11-0219. [DOI] [PMC free article] [PubMed] [Google Scholar]
- 26.Kwabi-Addo B, Ren C, Ittmann M. DNA methylation and aberrant expression of Sprouty1 in human prostate cancer. Epigenetics. 2009;4:54–61. doi: 10.4161/epi.4.1.7400. [DOI] [PubMed] [Google Scholar]
- 27.Collin SM, Metcalfe C, Palmer TM, Refsum H, Lewis SJ, Smith GD, Cox A, Davis M, Marsden G, Johnston C, et al. The causal roles of vitamin B(12) and transcobalamin in prostate cancer: can Mendelian randomization analysis provide definitive answers? Int. J. Mol. Epidemiol. Genet. 2011;2:316–327. [PMC free article] [PubMed] [Google Scholar]
- 28.Alenzi FQ. Cell type specific expression of the apoptosis stimulating protein (ASPP-2) in human tissues. Acta Microbiol. Immunol. Hung. 2010;57:419–429. doi: 10.1556/AMicr.57.2010.4.8. [DOI] [PubMed] [Google Scholar]
- 29.Long Q, Johnson BA, Osunkoya AO, Lai Y-H, Zhou W, Abramovitz M, Xia M, Bouzyk MB, Nam RK, Sugar L, et al. Protein-coding and microRNA biomarkers of recurrence of prostate cancer following radical prostatectomy. Am. J. Pathol. 2011;179:46–54. doi: 10.1016/j.ajpath.2011.03.008. [DOI] [PMC free article] [PubMed] [Google Scholar]
- 30.Sauer H, Engel S, Milosevic N, Sharifpanah F, Wartenberg M. Activation of AMP-kinase by AICAR induces apoptosis of DU-145 prostate cancer cells through generation of reactive oxygen species and activation of c-Jun N-terminal kinase. Int. J. Oncol. 2012;40:501–508. doi: 10.3892/ijo.2011.1230. [DOI] [PubMed] [Google Scholar]
- 31.Trasino SE, Harrison EH, Wang TTY. Androgen regulation of aldehyde dehydrogenase 1A3 (ALDH1A3) in the androgen-responsive human prostate cancer cell line LNCaP. Exp. Biol. Med. (Maywood) 2007;232:762–771. [PubMed] [Google Scholar]
- 32.Ribarska T, Bastian K-M, Koch A, Schulz WA. Specific changes in the expression of imprinted genes in prostate cancer–implications for cancer progression and epigenetic regulation. Asian J. Androl. 2012;14:436–450. doi: 10.1038/aja.2011.160. [DOI] [PMC free article] [PubMed] [Google Scholar]
- 33.Ren X, Wang Y, Wang J, Zhang X-S. A unified computational model for revealing and predicting subtle subtypes of cancers. BMC Bioinformatics. 2012;13:70. doi: 10.1186/1471-2105-13-70. [DOI] [PMC free article] [PubMed] [Google Scholar]
- 34.Wen Z, Liu Z, Liu ZR, Zhang Y, Chen L. An integrated approach to identify causal network modules of complex diseases with application to colorectal cancer. J. Am. Med. Inform. Assoc. 2012 doi: 10.1136/amiajnl-2012-001168. September 11 (doi:10.1136/amiajnl-2012-001168; epub ahead of print) [DOI] [PMC free article] [PubMed] [Google Scholar]
- 35.Chen L, Liu R, Liu Z, Li M, Aihara K. Detecting early-warning signals for sudden deterioration of complex diseases by dynamical network biomarkers. Sci. Rep. 2012;2:342. doi: 10.1038/srep00342. [DOI] [PMC free article] [PubMed] [Google Scholar]
Associated Data
This section collects any data citations, data availability statements, or supplementary materials included in this article.