

Abstract
We have conducted a phenotypic screening in endothelial cells exposed to elevated extracellular glucose (an in vitro model of hyperglycemia) to identify compounds that prevent hyperglycemia-induced reactive oxygen species (ROS) formation without adversely affecting cell viability. From a focused library of >6,000 clinically used drug-like and pharmacologically active compounds, several classes of active compounds emerged, with a confirmed hit rate of <0.5%. Follow-up studies focused on paroxetine, a clinically used antidepressant compound that has not been previously implicated in the context of hyperglycemia or diabetes. Paroxetine reduced hyperglycemia-induced mitochondrial ROS formation, mitochondrial protein oxidation, and mitochondrial and nuclear DNA damage, without interfering with mitochondrial electron transport or cellular bioenergetics. The ability of paroxetine to improve hyperglycemic endothelial cell injury was unique among serotonin reuptake blockers and can be attributed to its antioxidant effect, which primarily resides within its sesamol moiety. Paroxetine maintained the ability of vascular rings to respond to the endothelium-dependent relaxant acetylcholine, both during in vitro hyperglycemia and ex vivo, in a rat model of streptozotocin-induced diabetes. Thus, the current work identifies a novel pharmacological action of paroxetine as a protector of endothelial cells against hyperglycemic injury and raises the potential of repurposing of this drug for the experimental therapy of diabetic cardiovascular complications.
Phenotypic screening, cell-based screening, or high-content screening approaches can be used to identify compounds that affect complex cell functions without a priori invoking of a specific molecular pathway (1–6). This approach can be used effectively for the repurposing of clinically used therapeutics (1–8). Using a cell-based screening in endothelial cells subjected to elevated extracellular glucose concentration (an in vitro model of hyperglycemia), we have tested a focused library of clinical drugs and drug-like molecules to identify compounds with an ability to protect endothelial cells from elevated glucose-induced reactive oxygen species (ROS) production. The rationale of focusing on these classes of compounds is that this approach can facilitate the accelerated translation (repurposing) of existing compounds for potential future clinical therapy. We have followed-up one selected compound, paroxetine, for in vitro and in vivo models of hyperglycemic endothelial cell dysfunction and diabetic vascular dysfunction.
RESEARCH DESIGN AND METHODS
Cell culture.
bEnd.3 murine and EA.hy926 human endothelial cells were obtained from ATCC and maintained in Dulbecco's modified Eagle's medium (DMEM) containing 1 g/L glucose supplemented with 10% FBS, 1% nonessential amino acids, 100 IU/mL penicillin, and 100 µg/mL streptomycin at 37°C in 10% CO2.
Cell-based screening for inhibitors of the hyperglycemia-induced mitochondrial ROS production.
bEnd.3 cells (20,000/well) were plated into 96-well tissue culture plates and were cultured for 24 h. Hyperglycemia (40 mmol/L glucose) was initiated by replacing the culture medium with fresh DMEM containing 7.2 g/L glucose supplemented with 10% FBS, 1% nonessential amino acids, 100 IU/mL penicillin, and 100 µg/mL streptomycin, and were cultured for 10 days before measuring the oxidant production. The medium was supplemented with pyruvate (10 mmol/L) after 4 days of exposure. Test compounds were tested at 3 μmol/L final concentration (0.5% DMSO) in the culture medium. The Natural Products Library was screened at 1 µg/mL final concentration. Compounds were administered in a volume of 10 μL (added to 190 μL medium in each well) on day 7 of exposure.
EA.hy926 cells were used in a similar manner but were exposed to hyperglycemia in medium 199 supplemented with 15% FBS, 4 mmol/L glutamine, 7.5 U/mL heparin, 2.5 µg/mL human endothelial cell growth factor, 2 ng/mL human epidermal growth factor, 100 IU/mL penicillin, and 100 µg/mL streptomycin.
After 10 days of exposure, the cells were loaded with mitochondrial superoxide sensor MitoSOX Red (2.5 μmol/L) and DNA stain Hoechst 33342 (10 μmol/L) for 25 min. Reading medium (PBS supplemented with 1 g/L glucose and 10% bovine growth serum) was added to the cells and the oxidation of MitoSOX Red was recorded kinetically (excitation/emission wavelengths [Ex/EM]: 530/590 nm) on Synergy 2 (BioTek, Winooski, VT) at 37°C for 35 min as described (9). Vmax values were used as a measure of mitochondrial ROS production rate. The fluorescence of Hoechst 33342 (Ex/Em: 360/460 nm) was used to calculate the viability of the cells using a calibration curve created by serial dilution of bEnd.3 cells. In select experiments, test compounds were administered in 1/20 volume 3 h before the MitoSOX Red loading or immediately thereafter. ROS score (1 ROS score = 25% decrease of the average mitochondrial ROS production of hyperglycemic cells on test plate) and viability score (1 viability score = SD of the hyperglycemic cells on each test plate) was calculated to minimize interplate variability.
Measurement of cytoplasmic ROS generation.
After the hyperglycemic exposure, the cells were loaded with cell-permeable ROS indicator 5-(and-6)-chloromethyl-2′,7′-dichlorodihydrofluorescein diacetate (CM-H2DCFDA; 10 μmol/L) and DNA stain Hoechst 33342 (10 μmol/L) for 25 min. Reading medium (PBS supplemented with 1 g/L glucose and 10% bovine growth serum) was added to the cells and the oxidation of CM-H2DCFDA was measured kinetically (Ex/Em: 485/528 nm) at 37°C for 35 min. ROS production is shown as Vmax values or percent values of Vmax values of control cells. The fluorescence of Hoechst 33342 (Ex/Em: 360/460 nm) was used to calculate the viability of the cells using a calibration curve created by serial dilution of bEnd.3 cells.
In situ detection of ROS generation and oxidative damage.
Cells were plated (50,000/well) into Laboratory-Tek II eight-well chamber slides and were treated with hyperglycemia and test compounds as described. After the hyperglycemic exposure, the cells were washed with PBS and the cells were loaded with MitoSOX Red and Hoechst 33342 for 25 min. The cells were incubated in reading medium for 2 h, and then images were taken on an Eclipse 80i fluorescent microscope (Nikon, Melville, NY).
In a separate series of experiments, the cells were exposed to hyperglycemia and treated with compounds as described, and the cells were fixed in 4% buffered formalin. Then, the cells were probed with an antibody against 8-hydroxy-guanosine (1:200) overnight, followed by incubation with Alexa-546-labeled antimouse antibody and subsequent staining with nuclear stain Hoechst 33342 and Alexa-488-phalloidin conjugate. Oxidative damage of nucleic acids was visualized on the Nikon Eclipse 80i microscope and images were taken as described. The red fluorescence (sum of intensity of every pixel) of individual cells was analyzed using NIS Elements Basic Research software package and shown as relative fluorescence.
Mitochondrial ROS measurement in isolated mitochondria.
Mitochondria were isolated from the livers of male Sprague-Dawley rats (225–250 g) as described (10). Mitochondria were centrifuged at 2,000g for 20 min at 4°C, then 50 µL/well assay solution was supplemented with succinate, rotenone, ADP, and MitoSOX Red (final concentrations 10 mmol/L, 2 μmol/L, 4 mmol/L, and 1.25 μmol/L, respectively), and the test compounds (10 μL/well) were added. The oxidation of MitoSOX was recorded kinetically (Ex/Em: 530/590 nm) on Synergy 2 plate reader at 37°C for 35 min. Vmax values were used as a measure of mitochondrial ROS production rate. The functional integrity of the isolated mitochondria was confirmed on a Seahorse metabolic analyzer (10).
Xanthine oxidase assay.
Superoxide was generated by bovine xanthine oxidase (0.25 mU/mL) in 50 mmol/L potassium phosphate buffer (pH 7.5) containing 50 μmol/L xanthine and 50 μmol/L diethylenetriaminepentaacetic acid. Superoxide was measured kinetically at 37°C for 35 min on Synergy 2 plate reader either by colorimetric detection (490 nm) using 40 μmol/L nitrotetrazolium blue or by a fluorescent method using MitoSOX Red (1.25 μmol/L; Ex/Em: 530/590 nm) and 1 μg/mL Hind III digest of λ DNA to increase the signal intensity.
Detection of oxidative DNA and protein damage.
DNA strand breaks in bEnd.3 cells exposed to hyperglycemia were detected with a single-cell gel electrophoresis using a commercially available Comet assay system (Trevigen) as described (9). Protein oxidation was measured in crude mitochondrial fraction prepared by lysing bEnd.3 cells exposed to hyperglycemia in lysis buffer comprising 50 mmol/L Tris-HCl, pH 7.4, 50 mmol/L sodium fluoride, 5 mmol/L sodium pyrophosphate, 1 mmol/L EDTA, 250 mmol/L mannitol, and 1% Triton X-100 supplemented with protease inhibitors. Nuclei were removed by centrifuging the samples at 300g and mitochondrial fraction was prepared from the supernatant by centrifuging at 12,000g. The pellet was dissolved in RIPA buffer and protein concentration was measured by DC protein assay (BioRad, Hercules, CA); 2.5 µg protein was processed using the OxyBlot Protein Oxidation Detection Kit. Samples were resolved on 4–12% Nupage Bis-Tris gel and blotted to nitrocellulose.
Detection of oxidative damage of the mitochondrial DNA.
Cells were exposed to hyperglycemia and were treated with paroxetine (10 μmol/L) for 3 days. The cells were lysed in 0.8% sarcosine, 20 mmol/L EDTA, 100 mmol/L Tris pH 8.0, and treated with RNase A and proteinase K. Phenol chloroform–extracted DNA samples (200 ng) were subjected to 8-oxoguanine DNA glycosylase (hOGG1; 2 units) digestion at 37°C for 1 h, followed by heat inactivation (65°C, 15 min). An equal amount of DNA was incubated simultaneously in the same buffer without the enzyme. The amplifiable amount of mitochondrial DNA was measured by real-time PCR using primers targeting the mitochondrial Tyr-tRNA coding region (forward primer: 5′-CACCTTAAGACCTCTGGTAAAAAGA-3′; reverse primer: 5′-TGAGAATAATCAACGATTAATGAACA-3′), and the difference was calculated between the hOGG1-treated and untreated samples.
Gene expression arrays.
Total RNA was isolated from bEnd.3 cells exposed to hyperglycemia or normoglycemia for 7 days using TRIzol reagent according to the protocol provided by the manufacturer; 2 µg RNA was treated with DNase (Epicentre) and reverse transcription was performed using High-Capacity cDNA Archive kit (Applied Biosystems) following the manufacturer’s instructions; 1 μg RNA was used according to the manufacturer’s protocol for gene expression measurements using the mouse mitochondrial energy real-time PCR array (SABiosciences) on CFX96 thermo cycler (Bio-Rad).
Cellular ATP content measurement.
ATP concentration was determined by the commercially available CellTiter-Glo Luminescent Cell Viability Assay (Promega, Madison, WI). Cells were lysed in 100 µL of CellTiter-Glo reagent and the luminescent signal was recorded for 1 second on a high-sensitivity luminometer. The assay is based on ATP requiring luciferen–oxyluciferin conversion mediated by a thermostable luciferase that generates a stable “glow-type” luminescent signal. ATP standard (dilution series) was used to calculate the cellular ATP amount.
Extracellular flux analysis.
The XF24 Analyzer (Seahorse Biosciences, Billerica, MA) was used to measure metabolic changes in bEnd.3 cells as previously described (10). The XF24 creates a transient 7-µL chamber in a specialized microplate that allows real-time measurement of oxygen and proton concentration changes via specific fluorescent dyes and that calculates oxygen consumption rate (OCR) and extracellular acidification rate (ECAR), measures of mitochondrial respiration, and glycolytic activity. The proton production rate (PPR) similarly denotes the cellular acid production but as pmol/min, whereas ECAR is expressed as pH/min. After determining the basal OCR and ECAR values, oligomycin, carbonyl cyanide 4-(trifluoromethoxy) phenylhydrazone (FCCP), and antimycin A were injected through the ports of the Seahorse Flux Pak cartridge to reach final concentrations of 1 µg/mL, 0.3 μmol/L, and 2 µg/mL, respectively, to determine the amount of oxygen consumption linked to ATP production, the level of non-ATP-linked oxygen consumption (proton leak), and the maximal respiration capacity and the nonmitochondrial oxygen consumption. After the metabolic measurements, the cells were lysed in mammalian protein extraction reagent (M-PER) and protein content was determined using the bicinchoninic acid method (Pierce). The OCR and ECAR values were normalized to protein content and are shown as OCR or ECAR per protein.
Vascular studies of in vitro hyperglycemia.
Thoracic aortic rings from Sprague-Dawley rats were incubated for 48 h under normoglycemic (5 mmol/L) or hyperglycemic (30 mmol/L) conditions in DMEM in the presence or absence of 10 μmol/L paroxetine, followed by the determination of acetylcholine-induced relaxations as described (9).
Vascular studies of streptozotocin-induced diabetes.
Diabetes in male Sprague-Dawley rats was induced with a single streptozotocin injection (60 mg/kg intraperitoneally in pH 4.5 citrate buffer). On day 14, animals were implanted with Alzet osmotic pumps filled with paroxetine (releasing a dose of 10 mg/kg per day) or vehicle. Rats were divided into groups as follows: vehicle-treated control rats (n = 10); paroxetine-treated control rats (n = 10); vehicle-treated streptozotocin diabetic rats (n = 10); and paroxetine-treated streptozotocin diabetic rats (n = 10). Mini-pumps were replaced at 2 weeks; 28 days after the start of vehicle or paroxetine treatment, thoracic aortae were obtained and acetylcholine-induced relaxations were measured as described (9).
Statistical analysis.
Data are shown as mean ± SEM. One-way ANOVA and Tukey post hoc test were used to detect differences between groups. P < 0.05 was considered statistically significant.
RESULTS
Cell-based screening for inhibitors of hyperglycemia-induced mitochondrial ROS production in endothelial cells.
To induce enhanced mitochondrial ROS production in endothelial cells, we exposed bEnd.3 murine microvascular endothelial cells to hyperglycemia for various time periods. Extended hyperglycemic exposure progressively increased the mitochondrial ROS generation after 10–14 days (Fig. 1A–D). The enhanced ROS production was not associated with marked alterations in the expression level of genes related to the mitochondrial respiration and ATP production (Fig. 1E, Supplementary Tables 1 and 2).
FIG. 1.

Long-term hyperglycemia induces mitochondrial oxidant production in endothelial cells. A–D: bEnd.3 cells were exposed to hyperglycemia (high) or maintained in 5 mmol/L glucose (low) containing medium for 10 days or for the indicated time period, then the cells were loaded with superoxide sensor MitoSOX Red and Hoechst 33342. The oxidation of MitoSOX was recorded on kinetic reader; the maximum reaction rates (Vmax) (A) and typical kinetic curves are shown (B). Micrographs of cells maintained in normoglycemic (C) or hyperglycemic (D) medium were taken 2 h after the superoxide sensor loading. E: Gene expression changes in bEnd.3 cells exposed to hyperglycemia for 7 days were analyzed with mitochondrial energy array. The gene symbols and relative expression (fold change) in hyperglycemic cells are shown compared with normoglycemic cells (*P < 0.05).
By measuring the oxidation of MitoSOX in cultured bEnd.3 endothelial cells, we conducted cell-based screening to identify compounds that inhibit the mitochondrial ROS production induced by elevated extracellular glucose. We have tested a focused library consisting of 6,766 compounds, which included clinical stage drugs, biologically active compounds with defined pharmacological activity, and natural compounds (compound libraries tested in the primary screen are listed in Table 1). Compound exposure (3 μmol/L) started on day 7 of the experiment. The measurement of mitochondrial ROS production was combined with cell viability measurements, performed in the same wells (Fig. 2).
TABLE 1.
Bioactive compound libraries and confirmed inhibitors of the hyperglycemia-induced mitochondrial ROS production
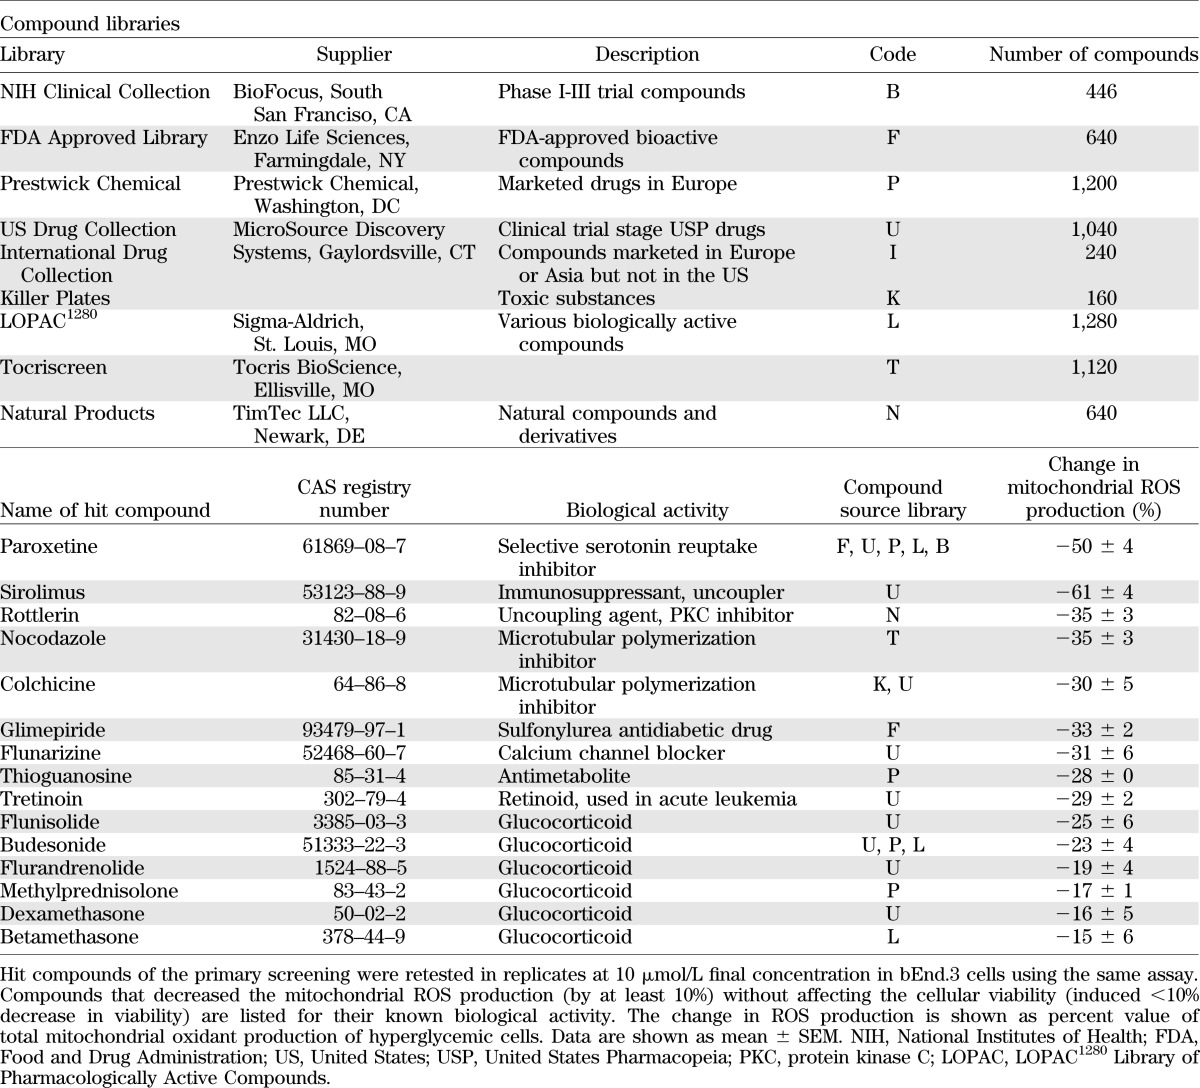
FIG. 2.

Cell-based screening for compounds that decrease the mitochondrial ROS production in endothelial cells. A: Timeline of the cell-based screening: bEnd.3 cells were exposed to hyperglycemia for 10 days with 3-day-long compound treatment (3 μmol/L). Mitochondrial ROS production was measured with the superoxide MitoSOX Red with simultaneous assessment of viability. B: Dot graph showing the individual ROS/viability results of the tested 6,766 compounds. Oxidant production data are shown as ROS score (1 ROS score = 25% decrease in ROS production compared with hyperglycemic average value) and viability values are plotted as percent values. The yellow area denotes the compounds that decreased the ROS production without marked reduction of cellular viability. Distribution of viability (C) and ROS (D) data (SD of viability = 24.69%, SD of ROS score = 0.717, or SD of ROS production = 17.93%).
Both cellular ROS production and cell viability showed a Gaussian distribution, and the majority of the compounds did not affect mitochondrial ROS generation. Detailed results of the primary screen are shown (Supplementary Table 5). Compounds that decreased mitochondrial ROS production (ROS score >1) were in two categories: they either decreased the viability (viability score <−1) or did not affect it. Cytotoxic compounds (i.e., compounds that simultaneously decreased ROS production and cell viability) were excluded from further analysis. The nontoxic compounds that inhibited hyperglycemia-induced ROS production at 3 μmol/L by >25% in the primary screen were retested in replicates at 10 μmol/L using the same assay. Results of the hit confirmation assay are summarized (Supplementary Table 3). Compounds whose activity on ROS production was confirmed in the secondary assay are listed in the Table 1. Hit molecules included steroids, nonsteroidal anti-inflammatory agents, microtubular agents, mitochondrial uncouplers, and antimetabolites. Statins, which previously have been shown to suppress hyperglycemic ROS production in endothelial cells (11,12), also inhibited ROS production in our experimental conditions; however, these effects also were associated with a suppression of cellular viability (Supplementary Fig. 1).
From the multiple classes of pharmacologically active compounds identified from the screen, we have focused our subsequent studies on the clinically used antidepressant compound paroxetine. This compound (both its hydrochloride and maleate salts, as present in different libraries) consistently reduced the mitochondrial ROS production in the screens and showed preference to inhibit mitochondrial ROS production, as opposed to total cellular ROS generation (as measured by the DCFDA assay) (Fig. 3). Paroxetine remained effective against the hyperglycemia-induced mitochondrial ROS generation in human endothelial cells (Fig. 3). The effect of paroxetine involves an immediate mode of action, because it remained effective in shorter treatment schedules (Fig. 3) and did not affect the expression of any of the mitochondrial genes studied during hyperglycemia (Supplementary Fig. 2, Supplementary Table 4).
FIG. 3.

Paroxetine inhibits the mitochondrial oxidant production in endothelial cells. bEnd.3 murine (top panels) and EA.hy926 human endothelial cells (bottom panels) were exposed to hyperglycemia for 10 days with 3-day-long (chronic) paroxetine treatment at the indicated concentration or immediately before the ROS measurement (acute). Mitochondrial ROS, viability, and cytoplasmic ROS production were measured with MitoSOX Red, Hoechst 33342, and CM-H2DCFDA (DCFDA), respectively, and are expressed as percent values compared with normoglycemic control cells (low). #P < 0.05 compared with normoglycemic control; *P < 0.05 compared with hyperglycemic cells.
Paroxetine acts as a mitochondrial superoxide scavenger.
To test whether the paroxetine-mediated decrease in hyperglycemic ROS production is a result of inhibition of the mitochondrial respiration and oxidative phosphorylation, we have characterized the metabolic profile of bEnd.3 cells exposed to hyperglycemia in the presence or absence of paroxetine using extracellular flux analysis. Elevated extracellular glucose increased the cellular oxygen consumption (an indicator of aerobic metabolism) with no change in the degree of acid production (Fig. 4). Elevated glucose caused an increase in the mitochondrial potential (total respiratory capacity, measured in response to the uncoupling agent FCCP) in the absence of any detectable anaerobic compensation (Fig. 4B). Paroxetine did not affect the cellular ATP content or oxygen consumption (Fig. 4D), whereas it decreased mitochondrial superoxide generation (Fig. 4E).
FIG. 4.

The paroxetine-mediated mitochondrial antioxidant effect is not associated with perturbed cellular respiration. bEnd.3 cells were exposed to hyperglycemia (high) with or without paroxetine (PRX; 3 μmol/L for 3 days) treatment, and control cells were maintained in medium containing 5 mmol/L glucose (low). A–C: Cellular metabolism was measured with the Seahorse metabolic analyzer. ATP-production linked OCR (A) and ECAR (B) were measured, followed by determination of the non-ATP-linked oxygen consumption (proton leak), maximal respiration capacity, and the nonmitochondrial oxygen consumption by adding oligomycin, FCCP, and antimycin A, respectively. The ATP production linked (basal) OCR values (C) and cellular ATP levels (D) are shown (*P < 0.05). E: Representative micrographs of b.END3 cells treated with paroxetine (PRX; 3 μmol/L) and loaded with MitoSOX Red. F: ROS production of isolated mitochondria was measured by the superoxide sensor MitoSOX Red in the presence of paroxetine at the indicated concentrations. Superoxide was generated by xanthine oxidase and detected by nitroblue tetrazolium (NBT) (G) or MitoSOX Red (H) in the presence of paroxetine at the indicated concentrations. *P < 0.05 compared with vehicle.
Because the action of paroxetine was rapid-onset and did not involve changes in gene expression, we next tested the activity of paroxetine on ROS production in isolated mitochondria. Paroxetine significantly reduced the detectable superoxide generation in the low micromolar range in isolated mitochondria (Fig. 4F), without affecting oxygen consumption rate (Supplementary Fig. 3). Next, we generated superoxide using the enzyme xanthine oxidase to test whether paroxetine directly interacts with superoxide. We used MitoSOX Red or nitroblue tetrazolium to measure the superoxide generation. Paroxetine reduced the superoxide signal in a dose-dependent manner in these cell-free systems (Fig. 4G, H).
Paroxetine is reported to decompose under certain conditions to trans-4-(4′-fluorophenyl)3-hydroxymethyl)-piperidine, which involves the cleavage of the sesamol part (9). Both trans-4-(4′-fluorophenyl)3-hydroxymethyl)-piperidine and sesamol decreased the mitochondrial ROS production by themselves, but sesamol was more potent than the piperidine compound. Sesamol significantly decreased the hyperglycemia-induced mitochondrial ROS generation at 1 μmol/L, and the combination of trans-4-(4′-fluorophenyl)3-hydroxymethyl)-piperidine potentiated the antioxidant activity of sesamol (Fig. 5A–D). Further decomposition of paroxetine can be attained by photolysis that includes the cyclization of the piperidine compound. We degraded paroxetine in aqueous solution by ultraviolet irradiation and found that the partially degraded paroxetine retained its activity to a certain extent, but the end products of the complete photolysis no longer showed an inhibitory effect on ROS production (Supplementary Fig. 4).
FIG. 5.

The mitochondrial antioxidant property of paroxetine-related compounds. bEnd.3 cells were exposed to hyperglycemia (high) for 10 days and loaded with MitoSOX Red. A–C: Paroxetine building blocks sesamol, trans-4-(4′-fluorophenyl)3-hydroxymethyl)-piperidine or their combination was added to the cells at the indicated concentrations immediately before the ROS measurement. D: Structure of paroxetine, trans-4-(4′-fluorophenyl)3-hydroxymethyl)-piperidine and sesamol. The indicated serotonin or norepinephrine reuptake inhibitors were added to the cells 3 h before MitoSOX loading at 10 μmol/L (E) or immediately before (F) the ROS measurement at 1 μmol/L. Mitochondrial ROS production is shown as Vmax value of MitoSOX oxidation. #P < 0.05 compared with normoglycemic cells (low); *P < 0.05 compared with hyperglycemic cells. (A high-quality color representation of this figure is available in the online issue.)
To further elucidate whether the inhibitory function of paroxetine on the mitochondrial ROS generation depends on its antioxidant properties, we compared the effect of several serotonin reuptake inhibitors and substructures of paroxetine on hyperglycemic mitochondrial ROS production in bEnd.3 cells. None of the other serotonin reuptake inhibitor compounds (or norepinephrine reuptake inhibitors) tested affected the mitochondrial ROS production either in pretreatment or when acutely added to the cells (Fig. 5E, F).
Paroxetine prevents the hyperglycemia-induced oxidative damage in vitro.
To test whether paroxetine exerts cytoprotective effects during hyperglycemia, we next determined the oxidative damage at DNA, RNA, and protein levels. The bEnd.3 cells were exposed to hyperglycemia with paroxetine treatment (10 μmol/L for days 7–10 of the experiment). Hyperglycemia-mediated DNA fragmentation, measured by the Comet assay, was attenuated by paroxetine, indicative of the ability of paroxetine to attenuate the downstream consequences of mitochondrial ROS production (Fig. 6A, C). The formation of 8-hydroxy-guanosine (an indicator of oxidative damage to the RNA) also was detected in hyperglycemic cells, and it was reduced by paroxetine (Fig. 6B). The relative amount of (amplifiable) mitochondrial DNA was decreased from 1.02 ± 0.03 units to 0.63 ± 0.02 units by high glucose (P < 0.05), and it was maintained at higher levels (0.76 ± 0.07) in the presence of paroxetine (10 μmol/L; n = 3). Oxidative damage of mitochondrial proteins also was detectable in hyperglycemic cells by the OxyBlot technique, as evidenced by a 1.5-fold increase in the level of oxidized proteins in the range of 20–45 kDa; this effect also was attenuated by paroxetine (Fig. 6D).
FIG. 6.

Paroxetine reduces hyperglycemia-induced oxidative damage in endothelial cells. bEnd.3 cells were exposed to hyperglycemia (high) or maintained in medium containing normal glucose (low) for 10 days and treated with paroxetine (PRX; 10 μmol/L) or vehicle (CTL) for 3 days. Representative micrographs and respective bar graphs of the Comet assay (A, C); 8-hydroxy-guanosine (red) immunostaining with simultaneous Hoechst 33342 (blue) nuclear and phalloidin (green) actin staining (B) are shown. D: Crude mitochondrial fractions were prepared and processed with OxyBlot Protein Oxidation Detection Kit. Representative blot image of oxidized proteins and densitometric analysis are shown. *P < 0.05 compared with normoglycemic cells; #P < 0.05 compared with hyperglycemic cells.
Paroxetine prevents the hyperglycemia-induced and diabetes-induced endothelial dysfunction in vascular rings.
Isolated rat aortic rings exposed to hyperglycemia ex vivo had development of endothelial dysfunction, as evidenced by an impaired relaxation in response to acetylcholine (Fig. 7A). Paroxetine attenuated the loss of endothelium-dependent relaxant responsiveness of the hyperglycemic vessels. Next, we tested the ability of paroxetine to affect the development of endothelial dysfunction in streptzotocin diabetic rats. Paroxetine did not affect body weight and did not influence the degree of hyperglycemia in the diabetic animals (Fig. 7B). However, the diabetes-induced impairment of the endothelium-dependent relaxations ex vivo was prevented by paroxetine treatment (Fig. 7C).
FIG. 7.

The protective effect of paroxetine in ex vivo vessels and in vivo. A: Rat thoracic aortic rings were exposed to 30 mmol/L hyperglycemia (high) for 48 h or incubated in culture medium containing 5 mmol/L glucose (low) and were treated with paroxetine (PRX; 10 μmol/L) or vehicle. Endothelium-mediated relaxation to acetylcholine (Ach) was measured at the indicated concentrations of acetylcholine and expressed as percent of precontraction. B: Paroxetine treatment of streptozotocin-diabetic rats failed to affect hyperglycemia or body weight loss. C: Rat thoracic aortic rings prepared from streptozotocin-diabetic (STZ) or control nondiabetic (CTL) rats treated with vehicle or paroxetine (PRX; 10 mg/kg per day). Endothelium-mediated relaxation to acetylcholine was measured at the indicated concentrations of acetylcholine and expressed as percent of precontraction. #P < 0.05 hyperglycemia/diabetes compared with normoglycemic samples (low); *P < 0.05 paroxetine treatment compared with hyperglycemia/diabetes.
DISCUSSION
ROS formation, from various cellular sources, has been implicated in the pathogenesis of diabetic endothelial dysfunction, which lays at the core of the pathogenesis of multiple diabetes complications (diabetic microvascular and macrovascular disease, retinopathy, nephropathy, and neuropathy) (13–15). Mitochondria represent one of the most important sources of ROS generation, which, in concert with other sources or ROS and reactive nitrogen species, exert deleterious effects via the initiation of posttranslational protein modifications and changes in gene transcription (14–16). Although there are a number of molecular sources of mitochondrial ROS generation (16), the site of hyperglycemic mitochondrial ROS generation is complex III/coenzyme Q (14,15,17–19). Some of the downstream processes involved in the hyperglycemic endothelial ROS production include inhibition of GAPDH, the activation of protein kinase C isoforms, activation of the methylglyoxal pathway, activation of the hexosamine pathway, activation of the nuclear enzyme polyADP-ribose polymerase (PARP), DNA damage, and mitochondrial and extramitochondrial protein modifications (14–21).
Significant efforts have been directed on the prevention of mitochondrial ROS formation, and to the inhibition of downstream pathways of hyperglycemic cellular damage. One of the approaches involved rebalancing the glycolytic pathway in hyperglycemic cells via pharmacological activation of transketolase (22). Other approaches address the “root cause” of the problem, aiming at inhibition of hyperglycemic mitochondrial ROS production, either by partial uncoupling of the mitochondria (17) or by rebalancing the mitochondrial oxidant/antioxidant balance by resupplying the endogenous gaseous mediator hydrogen sulfide (9). An additional approach involves antioxidant therapy with mitochondrially targeted ubiquinone (23).
So far, no systematic approach has been conducted to survey a wide variety of drugs, drug-like molecules, and pharmacological agents for their potential ability to suppress hyperglycemic mitochondrial ROS overproduction. Such a survey necessitated the development of a cell-based assay of hyperglycemic ROS production that is suitable for medium-throughput screening, and one that is coupled with the simultaneous evaluation of cell viability. Although cell-based screening assays in endothelial cells previously have been conducted, these assays were focusing on other outcome variables, such as angiogenesis inhibitors (24,25). In addition, a handful of studies have conducted cell-based screening assays in nonendothelial cell systems, in order to identify cytoprotective agents (1,2,6,26–31). For the current screening campaign, we have used a cell-based, mechanism-agnostic approach, in which the only criteria were to identify compounds that inhibit hyperglycemia-induced ROS generation in such a way that does not interfere with cell viability. We gave preference to compounds that remain effective with a shorter onset of action and that work in a therapeutic regimen. The results of the screening and the subsequent hit confirmation have identified only a few compounds (<20 compounds from the >6,000 compound library) that met our criteria of significant inhibition of ROS production, without adversely affecting cell viability. Some of these compounds belong to the class of glucocorticoids and nonsteroidal anti-inflammatory compounds. To our knowledge, such a pharmacological effect has not yet been previously described in the literature. The molecular mode of action of rottlerin and sirolimus likely is related to uncoupling effects, whereas the mode of action for the microtubular polymerization inhibitors, the calcium antagonist flunarizine and the antimetabolite thioguanosine, remains to be elucidated in further studies.
For the current project, we have focused our investigations on the characterization of paroxetine, a prototypical and clinically widely used antidepressant agent. The chronic clinical utility of this compound makes this compound theoretically amenable to potential clinical repurposing for the experimental therapy of diabetes complications. Characterization of additional serotonin reuptake inhibitors demonstrated that paroxetine is unique as an inhibitor of hyperglycemic ROS production. The rapid onset of action and the lack of modulation of mitochondrial gene expression by paroxetine suggested a direct mode of action, which was characterized as an inhibitor of mitochondrial ROS production. The inhibition of MitoSOX oxidation, but the lack of inhibition of DCFDA oxidation, in the cell-based assays (Fig. 3) suggest that the mode of paroxetine may be at least partially preferential to mitochondrial sources of ROS, although the inhibition of the xantine–oxidase-derived ROS production suggests that paroxetine also may affect cytosolic ROS production as well. Further studies are required to further characterize the effects of paroxetine on the various ROS-producing enzyme systems in the various subcellular compartments. Partial and complete decomposition studies demonstrated that the primary site of the antioxidant action resides within the sesamol moiety of the compound. The effects of paroxetine were not associated with any adverse changes in mitochondrial electron transport or mitochondrial function. Although mitochondrial fragmentation and mitochondrial fission are known to contribute to hyperglycemic mitochondrial ROS production (32), under the current experimental conditions paroxetine did not affect these processes (D.G., C.S., unpublished observations).
In accordance with its inhibitory effect on mitochondrial ROS production, paroxetine inhibited a variety of downstream responses that are typically associated with hyperglycemic ROS production in endothelial cells, such as indices of mitochondrial oxidative protein injury, as well as injury to the mitochondrial and nuclear DNA (9,14–22). The protective effect of paroxetine also was apparent against the development of hyperglycemic endothelial dysfunction in vascular rings, both in an in vitro model (vascular rings placed in elevated extracellular glucose concentration, followed by the measurement of endothelium-dependent relaxations) and in an ex vivo model. These reductionist models should be followed-up by testing paroxetine in more chronic and more clinically relevant models of diabetic neuropathy, nephropathy, cardiomyopathy, and retinopathy.
In conclusion, the current studies have used a cell-based screening method to identify a number of drugs and drug-like molecules that beneficially affect hyperglycemic ROS production in endothelial cells. One of these compounds, the antidepressant paroxetine, has been tested in a variety of in vitro and in vivo/ex vivo models of hyperglycemic endothelial injury and diabetic vascular complications. It is interesting to note that paroxetine has been shown previously to afford certain cardiovascular benefits in terms of protection from myocardial infarction in humans (33). The current results may lay the conceptual foundation for future exploratory clinical trials in patients with diabetes, with the potential ultimate goal of its repurposing for the experimental therapy of diabetes complications. However, such studies should be preceded by careful characterization of the safety profile of this compound in diabetic patients.
Supplementary Material
ACKNOWLEDGMENTS
This work was supported by a grant from the Juvenile Diabetes Research Foundation to C.S. K.M. is a MacLaughlin Fellow of the University of Texas. C.C. is supported by a Postdoctoral Fellowship from the American Heart Association.
No potential conflicts of interest relevant to this article were reported.
D.G. and C.S. designed the experiments. D.G., P.S., K.M., K.S., G.O., and C.C. conducted the experiments. D.G. and C.S. analyzed data. D.G. prepared the figures. D.G. and C.S. wrote part of the manuscript. P.S., K.S., C.C., K.M., and G.O. conducted experiments and analyzed data. C.S. and D.G. wrote the manuscript. C.S. is the guarantor of this work and, as such, had full access to all of the data in the study and takes responsibility for the integrity of the data and the accuracy of the data analysis.
Footnotes
This article contains Supplementary Data online at http://diabetes.diabetesjournals.org/lookup/suppl/doi:10.2337/db12-0789/-/DC1.
See accompanying commentary, p. 698.
REFERENCES
- 1.An WF, Tolliday N. Cell-based assays for high-throughput screening. Mol Biotechnol 2010;45:180–186 [DOI] [PubMed] [Google Scholar]
- 2.Xu Y, Shi Y, Ding S. A chemical approach to stem-cell biology and regenerative medicine. Nature 2008;453:338–344 [DOI] [PubMed] [Google Scholar]
- 3.Korn K, Krausz E. Cell-based high-content screening of small-molecule libraries. Curr Opin Chem Biol 2007;11:503–510 [DOI] [PubMed] [Google Scholar]
- 4.Quintavalle M, Elia L, Price JH, Heynen-Genel S, Courtneidge SA. A cell-based high-content screening assay reveals activators and inhibitors of cancer cell invasion. Sci Signal 2011;4:ra49. [DOI] [PMC free article] [PubMed] [Google Scholar]
- 5.Iljin K, Ketola K, Vainio P, et al. High-throughput cell-based screening of 4910 known drugs and drug-like small molecules identifies disulfiram as an inhibitor of prostate cancer cell growth. Clin Cancer Res 2009;15:6070–6078 [DOI] [PubMed] [Google Scholar]
- 6.Guo S, Olm-Shipman A, Walters A, et al. A cell-based phenotypic assay to identify cardioprotective agents. Circ Res 2012;110:948–957 [DOI] [PMC free article] [PubMed] [Google Scholar]
- 7.O’Connor KA, Roth BL. Finding new tricks for old drugs: an efficient route for public-sector drug discovery. Nat Rev Drug Discov 2005;4:1005–1014 [DOI] [PubMed] [Google Scholar]
- 8.Huang R, Southall N, Wang Y, et al. The NCGC pharmaceutical collection: a comprehensive resource of clinically approved drugs enabling repurposing and chemical genomics. Sci Transl Med 2011;3:80ps16. [DOI] [PMC free article] [PubMed] [Google Scholar]
- 9.Suzuki K, Olah G, Modis K, et al. Hydrogen sulfide replacement therapy protects the vascular endothelium in hyperglycemia by preserving mitochondrial function. Proc Natl Acad Sci USA 2011;108:13829–13834 [DOI] [PMC free article] [PubMed] [Google Scholar]
- 10.Módis K, Gero D, Erdélyi K, Szoleczky P, DeWitt D, Szabo C. Cellular bioenergetics is regulated by PARP1 under resting conditions and during oxidative stress. Biochem Pharmacol 2012;83:633–643 [DOI] [PMC free article] [PubMed] [Google Scholar]
- 11.Christ M, Bauersachs J, Liebetrau C, Heck M, Günther A, Wehling M. Glucose increases endothelial-dependent superoxide formation in coronary arteries by NAD(P)H oxidase activation: attenuation by the 3-hydroxy-3-methylglutaryl coenzyme A reductase inhibitor atorvastatin. Diabetes 2002;51:2648–2652 [DOI] [PubMed] [Google Scholar]
- 12.Haas MJ, Horani MH, Parseghian SA, Mooradian AD. Statins prevent dextrose-induced endothelial barrier dysfunction, possibly through inhibition of superoxide formation. Diabetes 2006;55:474–479 [DOI] [PubMed] [Google Scholar]
- 13.Piconi L, Quagliaro L, Ceriello A. Oxidative stress in diabetes. Clin Chem Lab Med 2003;41:1144–1149 [DOI] [PubMed] [Google Scholar]
- 14.Szabo C. Role of nitrosative stress in the pathogenesis of diabetic vascular dysfunction. Br J Pharmacol 2009;156:713–727 [DOI] [PMC free article] [PubMed] [Google Scholar]
- 15.Giacco F, Brownlee M. Oxidative stress and diabetic complications. Circ Res 2010;107:1058–1070 [DOI] [PMC free article] [PubMed] [Google Scholar]
- 16.Murphy MP. How mitochondria produce reactive oxygen species. Biochem J 2009;417:1–13 [DOI] [PMC free article] [PubMed] [Google Scholar]
- 17.Nishikawa T, Edelstein D, Du XL, et al. Normalizing mitochondrial superoxide production blocks three pathways of hyperglycaemic damage. Nature 2000;404:787–790 [DOI] [PubMed] [Google Scholar]
- 18.Garcia Soriano F, Virág L, Jagtap P, et al. Diabetic endothelial dysfunction: the role of poly(ADP-ribose) polymerase activation. Nat Med 2001;7:108–113 [DOI] [PubMed] [Google Scholar]
- 19.Du X, Matsumura T, Edelstein D, et al. Inhibition of GAPDH activity by poly(ADP-ribose) polymerase activates three major pathways of hyperglycemic damage in endothelial cells. J Clin Invest 2003;112:1049–1057 [DOI] [PMC free article] [PubMed] [Google Scholar]
- 20.Ihnat MA, Thorpe JE, Kamat CD, et al. Reactive oxygen species mediate a cellular ‘memory’ of high glucose stress signalling. Diabetologia 2007;50:1523–1531 [DOI] [PubMed] [Google Scholar]
- 21.Madsen-Bouterse SA, Zhong Q, Mohammad G, Ho YS, Kowluru RA. Oxidative damage of mitochondrial DNA in diabetes and its protection by manganese superoxide dismutase. Free Radic Res 2010;44:313–321 [DOI] [PMC free article] [PubMed] [Google Scholar]
- 22.Hammes HP, Du X, Edelstein D, et al. Benfotiamine blocks three major pathways of hyperglycemic damage and prevents experimental diabetic retinopathy. Nat Med 2003;9:294–299 [DOI] [PubMed] [Google Scholar]
- 23.Chacko BK, Reily C, Srivastava A, et al. Prevention of diabetic nephropathy in Ins2(+/)⁻(AkitaJ) mice by the mitochondria-targeted therapy MitoQ. Biochem J 2010;432:9–19 [DOI] [PMC free article] [PubMed] [Google Scholar]
- 24.Evensen L, Micklem DR, Link W, Lorens JB. A novel imaging-based high-throughput screening approach to anti-angiogenic drug discovery. Cytometry A 2010;77:41–51 [DOI] [PubMed] [Google Scholar]
- 25.Hada K, Suda A, Asoh K, et al. Angiogenesis inhibitors identified by cell-based high-throughput screening: synthesis, structure-activity relationships and biological evaluation of 3-[(E)-styryl]benzamides that specifically inhibit endothelial cell proliferation. Bioorg Med Chem 2012;20:1442–1460 [DOI] [PubMed] [Google Scholar]
- 26.Degterev A, Huang Z, Boyce M, et al. Chemical inhibitor of nonapoptotic cell death with therapeutic potential for ischemic brain injury. Nat Chem Biol 2005;1:112–119 [DOI] [PubMed] [Google Scholar]
- 27.Gerö D, Módis K, Nagy N, et al. Oxidant-induced cardiomyocyte injury: identification of the cytoprotective effect of a dopamine 1 receptor agonist using a cell-based high-throughput assay. Int J Mol Med 2007;20:749–761 [PubMed] [Google Scholar]
- 28.Módis K, Gerö D, Nagy N, Szoleczky P, Tóth ZD, Szabó C. Cytoprotective effects of adenosine and inosine in an in vitro model of acute tubular necrosis. Br J Pharmacol 2009;158:1565–1578 [DOI] [PMC free article] [PubMed] [Google Scholar]
- 29.Zhang B, Au Q, Yoon IS, et al. Identification of small-molecule HSF1 amplifiers by high content screening in protection of cells from stress induced injury. Biochem Biophys Res Commun 2009;390:925–930 [DOI] [PubMed] [Google Scholar]
- 30.Pieper AA, Xie S, Capota E, et al. Discovery of a proneurogenic, neuroprotective chemical. Cell 2010;142:39–51 [DOI] [PMC free article] [PubMed] [Google Scholar]
- 31.Szoleczky P, Módis K, Nagy N, et al. Identification of agents that reduce renal hypoxia-reoxygenation injury using cell-based screening: purine nucleosides are alternative energy sources in LLC-PK1 cells during hypoxia. Arch Biochem Biophys 2012;517:53–70 [DOI] [PMC free article] [PubMed] [Google Scholar]
- 32.Yu T, Robotham JL, Yoon Y. Increased production of reactive oxygen species in hyperglycemic conditions requires dynamic change of mitochondrial morphology. Proc Natl Acad Sci USA 2006;103:2653–2658 [DOI] [PMC free article] [PubMed] [Google Scholar]
- 33.Sauer WH, Berlin JA, Kimmel SE. Effect of antidepressants and their relative affinity for the serotonin transporter on the risk of myocardial infarction. Circulation 2003;108:32–36 [DOI] [PubMed] [Google Scholar]
Associated Data
This section collects any data citations, data availability statements, or supplementary materials included in this article.