

Abstract
Defects in the RAS small G protein or its associated network of regulatory proteins that disrupt GTPase cycling are a major cause of cancer and developmental RASopathy disorders. Lack of robust functional assays has been a major hurdle in RAS pathway-targeted drug development. We used NMR to obtain detailed mechanistic data on RAS cycling defects conferred by oncogenic mutations, or full-length RASopathy-derived regulatory proteins. By monitoring the conformation of wild-type and oncogenic RAS in real-time, we show that opposing properties integrate with regulators to hyperactivate oncogenic RAS mutants. Q61L and G13D exhibited rapid nucleotide exchange and an unexpected susceptibility to GAP-mediated hydrolysis, in direct contrast with G12V, indicating different approaches must be taken to inhibit these oncoproteins. An NMR methodology was established to directly monitor RAS cycling by intact, multidomain proteins encoded by RASopathy genes in mammalian cell extracts. By measuring GAP activity from tumor cells, we demonstrate how loss of neurofibromatosis type 1 (NF1) increases RAS-GTP levels in NF1-derived cells. We further applied this methodology to profile Noonan Syndrome (NS)-derived SOS1 mutants. Combining NMR with cell-based assays allowed us to differentiate defects in catalysis, allosteric regulation, and membrane targeting of individual mutants, while revealing a membrane-dependent compensatory effect that attenuates dramatic increases in RAS activation shown by Y337C, L550P, and I252T. Our NMR method presents a precise and robust measure of RAS activity, providing mechanistic insights that facilitate discovery of therapeutics targeted against the RAS signaling network.
Keywords: nuclear magnetic resonance, real-time bioassay, guanine nucleotide exchange factor inhibition
RAS functions downstream of membrane-bound receptors to control cell proliferation, differentiation, and survival pathways crucial to development. Deregulated RAS signaling leads to disorders ranging from cancer to developmental syndromes termed RASopathies (1). RAS and its associated signaling network represent extremely attractive therapeutic targets, yet there has been minimal success at exploiting these for drug development (2, 3).
RAS exists in two distinct conformations dependent on the state of bound nucleotide. Following stimulation, a GDP-to-GTP exchange is catalyzed by guanine nucleotide exchange factors (GEFs), transmitting downstream signals through RAS-GTP to diverse effector proteins (4). Inactivation via GTP hydrolysis is assisted by GTPase-activating proteins (GAPs), which enhance the slow intrinsic activity of the enzyme. Disorders stemming from aberrations in RAS GTPase cycling (Fig. 1A) are driven by abnormally high levels of activated RAS. Single amino acid mutations in RAS proteins are found in a remarkable 30% of human tumors, often in those with high-risk clinical features (1). Oncogenic mutations are most common at three loci, considered “hotspots” for transformation: Gly12, Gly13, and Gln61. The most frequently found G12V and Q61L mutations lower intrinsic hydrolysis rates (5–8) and are widely believed to be insensitive to GAPs (9, 10). The biochemistry of G13D remains poorly studied, but clinical data suggest the biologic behavior of tumors carrying K-RAS mutations is highly codon-dependent (11, 12). This finding directly correlates underlying RAS biochemical defects with cancer pathology, and a better appreciation of the intrinsic properties of RAS and its surrounding regulatory network could facilitate the design of specific, mechanism-based therapeutic approaches for patients carrying these mutations.
Fig. 1.

Monitoring GTPase activity by NMR. (A) RAS signaling revolves around the GTPase cycle, whereby RAS is activated when GDP is exchanged for GTP, a process facilitated by GEFs. Slow intrinsic hydrolysis is enhanced by the activity of GAPs. Disease states can occur by several mechanisms, including loss of NF1 GAP activity (NFt1, Neurofibromatosis type 1), increased GEF activity, or RAS mutation. (B) NMR-based analysis of nucleotide-dependent changes in RAS conformation. Overlay of 2D 1H/15N HSQC spectra showing select amide resonances of RAS bound to GDP (black) or GMPPNP (red). RAS-GTP-derived peaks eventually shift to GDP positions as hydrolysis occurs (shown for Y157). (C) Use of peak intensity data to determine rates of intrinsic hydrolysis for wild-type and mutant RAS. 15N-RAS proteins were loaded with GTP and hydrolysis monitored by sequential HSQCs. (D) Monitoring exchange reactions of wild-type and mutant RAS. GDP-bound RAS intrinsically exchanges in 10-fold molar excess GTPγS. Also see Fig. S1 and Table S2.
RASopathies are a group of hereditary developmental syndromes triggered by germ-line mutations in genes encoding components of the RAS/MAPK pathway (1, 13). Neurofibromatosis type 1 (NF1), resulting from deficiency in the RASGAP neurofibromin (NF1) (14, 15), and Noonan Syndrome (NS), caused by gain-of-function mutations in the RASGEF SOS1 (in addition to other RAS/MAPK pathway components such as PTPN11, RAS, RAF, and MEK) (16, 17), are two RASopathies that directly affect GTPase cycling (Fig. 1A). Characterizing specific mutations has proven difficult, as they evoke only a slight increase in RAS-GTP levels and they affect large, intricately regulated proteins.
In this article we apply our recently developed GTPase assay (18) to directly measure RAS cycling defects and the regulatory impact of intact, multidomain RASopathy proteins in mammalian cell extracts. We characterize how opposing intrinsic properties integrate with regulators to hyperactivate oncogenic RAS. Our approach could detect NF1-deficiency in tumor cells and enable profiling of NS-associated SOS1 mutants. This methodology demonstrates the utility of NMR as a powerful readout probe for cell-based enzymatic activity, distinct from in-cell NMR or metabolite screening techniques. Our NMR assay does not rely on modified nucleotides (19) or effector-based interactions, and is amenable to high-throughput approaches toward drug discovery. As a proof of concept, we exploit the ability of an RAS binding domain (RBD) to inhibit hydrolysis, and take a synthetic approach to obstruct both GEF-mediated and intrinsic exchange activity of wild-type and oncogenic RAS.
Results
Exchange and Hydrolysis Defects in Oncogenic RAS.
To develop a robust, real-time NMR approach to monitoring defects in RAS GTPase cycling, we began by characterizing intrinsic exchange and hydrolysis. Overlays of 2D 1H/15N heteronuclear single quantum coherence (HSQC) spectra in the active (GTP-bound) versus inactive (GDP-bound) state reveal significant chemical-shift perturbations in wild-type and oncogenic RAS (Fig. 1B and Fig. S1). To measure hydrolysis, we loaded RAS proteins with GTP and recorded successive HSQC spectra. G12V (10×) and Q61L (80×) had drastically reduced hydrolysis rates (Fig. 1C, all rates are detailed in Table S1), consistent with data obtained using radio-labeled nucleotides (7, 20). G13D showed a lesser 2.8-fold reduction in hydrolysis rate. The influence of nucleotide exchange on the activation state of these mutants had not been well studied. To analyze intrinsic exchange, we added 10-fold molar excess GTPγS to GDP-loaded RAS, mimicking physiological nucleotide concentrations but avoiding competition with hydrolysis (Fig. 1D and Fig. S2A). Q61L undergoes 2.4-fold faster exchange than wild-type, whereas G12V has a 1.8-fold reduced rate. G13D showed rapid intrinsic exchange, 15-fold faster than wild-type. Previously determined nucleotide binding properties (wild-type, G12V, and Q61L; see summary in Table S2) clarify the contrasting rates and plateaus observed by NMR, but these real-time data remarkably demonstrate the characteristics rendering RAS mutants oncogenic.
Selective monitoring of 15N-labeled RAS permits the introduction of unlabeled proteins, which remain NMR “invisible.” This allowed design of enzymatic assays examining the capacity for regulatory proteins to control RAS cycling. Using such an approach, we first monitored activity of the catalytic regions from two RAS regulators: SOScat from the SOS1 exchange factor (Rem/Cdc25 domains) (21), and GAP-334 from p120GAP (10) (Fig. 2A). When SOScat was added to 15N-RAS in the presence of GTP, nucleotide exchange was observed by chemical-shift perturbations, and the subsequent addition of GAP-334 stimulated hydrolysis (Fig. 2B). We were able to precisely quantify activity from these catalytic fragments using decreasing molar ratios (Fig. S2 B and C). Fig. 2C presents the full characteristics of wild-type RAS in our assay.
Fig. 2.

GEF/GAP-mediated exchange and hydrolysis properties. (A) Domain architecture of SOS1 and p120GAP. The catalytic fragments SOScat and GAP-334 are outlined. (B) Overlay of HSQC spectra reveals SOScat and GAP-334 regulation of RAS. Shown are 15N-RAS-GDP alone (black), in the presence of GTP and 1:1 SOScat (red), and after addition of 1:1 GAP-334 (blue). Coomassie-stained gel displays resultant proteins at right. (C) Summary of wild-type RAS hydrolysis and exchange properties. The intrinsic hydrolysis rate is stimulated 14-fold by 1:2,500 GAP-334. GDP-to-GTPγS exchange is increased 7-fold by 1:5,000 SOScat. (D) Summary of intrinsic (Upper) and GAP/GEF-mediated (Lower) hydrolysis and exchange. Thickness of arrows denoting hydrolysis (gray) and exchange (red) cycling are derived from the calculated rates, and presented relative to wild-type. SOS-mediated exchange of G13D was not determined as it was too rapid (N.D.). Also see Fig. S2.
In addition to reduced intrinsic GTPase activities, oncogenic RAS proteins are believed to resist GAP-mediated hydrolysis (9, 10). Indeed, G12V showed complete resistance to even stoichiometric amounts of GAP-334 (Fig. S2 D and E). In contrast, addition of equimolar quantities of GAP-334 actually increased the hydrolysis rates of Q61L (148×) and G13D (9×) (Fig. S2 F and G). Nonetheless, these rates remain markedly slower than wild-type rates using 1:5,000 GAP-334. We next considered SOS1-mediated activation of these mutants, and found that G12V required increased SOScat to achieve wild-type exchange rates (Fig. S2D). Conversely, Q61L required less SOScat, consistent with its high intrinsic exchange (Fig. S2F). The extremely rapid exchange rate of G13D prevented measurements with SOScat. As summarized in Fig. 2D and Fig. S2H, G12V is activated at a slower rate than wild-type, but its reduced catalytic activity and complete resistance to GAP sustain an active state. Conversely, Q61L is somewhat sensitive to GAP inactivation, but maintains a predominantly GTP-bound state via increased nucleotide exchange. This is extended even further in G13D, which has a less severe hydrolysis defect but an exceptionally high exchange rate. These results established a capacity for studying both positive and negative regulatory inputs to RAS using NMR, and revealed properties of G12V, G13D, and Q61L that render them transforming.
Probing NF1-Deficiency in Tumor-Derived Cells.
GAPs are large, multidomain proteins that are routinely studied following purification of their catalytic regions. These analyses overlook potential autoregulatory mechanisms, differential association with cellular cofactors, or posttranslational modifications. Work on p120GAP, for example, suggests the full-length protein has 20-fold more activity than the C-terminal fragment alone (22). We therefore sought to directly monitor the activity of full-length GAPs from mammalian cell extracts by NMR. To start, we stably incorporated a Tet-inducible, Flag-tagged p120GAP construct into HEK 293 cells. Fig. 3A illustrates how exogenously expressed p120GAP stimulated RAS-GTP hydrolysis 9-fold, whereas control lysates showed only a 2-fold increase (attributable to endogenous GAPs). These data established our capacity to study the activity of full-length GAPs expressed in cells.
Fig. 3.

Monitoring GAP activity from cell extracts using NMR. (A) Tet-induced cells expressing Flag-tagged p120GAP highly stimulated RAS GTP hydrolysis compared with control lysates. Expression of p120GAP was confirmed by anti-Flag immunoblot (Inset). (B) No significant differences in control and MPNST cells, excepting NF1-deficiency. (Upper) Expression of NF1, p120GAP, and RAS in normalized cell lysates. Tubulin is used for loading control. RAS-GTP levels as determined by binding to GST-BRAF RBD are as shown (Lower) [anti-RAS (PD)]. (C) NMR measurements of RAS GTP hydrolysis stimulated by control and MPNST-derived cells. Lysates were normalized by total protein concentration. Lysis buffer alone was used as control. (Right) Quantified rates after several replications of the GTP hydrolysis assay. *Unpaired, two-tailed t tests confirm significant differences between mean hydrolysis rates of buffer and MPNST cells vs. Schwann control (P < 0.05).
Patients diagnosed with NF1 are characterized by pigmentation defects, osseous lesions, cognitive deficits, and predisposition to malignancies, such as neurofibrosarcoma and leukemia. Although it is believed that NF1 pathogenesis involves excessive RAS activation, it has been difficult to detect increased RAS-GTP in many NF1-deficient tumor cells (23, 24). Our approach could therefore prove valuable in identifying RAS cycling defects in GAP-deficient cells. To test this possibility, we obtained two Schwann-like cell lines: CRL-2884, derived from a malignant peripheral nerve sheath tumor (MPNST) isolated from an NF1 patient (25), and CRL-2768 control Schwannoma cells (26). Expression levels of relevant proteins were profiled using immunoblots on whole-cell extracts (Fig. 3B). These results revealed equivalent levels of p120GAP and RAS, and confirmed NF1-deficiency in CRL-2884. To assess whether a conventional approach could detect accumulated RAS-GTP, we performed an RBD interaction assay (Fig. 3B) but observed no difference in RAS-GTP levels. This finding attests to a lack of sensitivity of the effector-binding approach, and exemplifies the challenges in studying disorders such as NF1.
In contrast, NMR-based measurements showed a clear defect in RAS-GTP hydrolysis activity conferred by MPNST-derived cell extracts (Fig. 3C). CRL-2884 cells exhibited only 66% of the total hydrolysis capacity of controls (attributable to activity from GAPs other than NF1). Much less material was required compared with standard assays, and samples could be frozen, thawed, and stored on ice with no perceptible loss in activity. Therefore, our NMR-based approach is more sensitive and more robust than current biochemical methods for studying GAP activities in cell extracts.
Activation and Regulation of Full-Length SOS1.
SOS1 is regulated by an allosteric mechanism, whereby a network of PH, DH, and HF domain interactions control access to an Rem domain allosteric site that binds RAS, which in turn controls exchange of a second RAS protein at the active site (21, 27, 28). This makes it a paradigm for the requisite study of full-length proteins. Recruitment of SOS1 to membranes serves two functions: relief of autoinhibition and proximity to RAS. To monitor its exchange activity by NMR, SOS1 was transiently expressed in HEK 293 cells and lysates mixed with 15N-RAS and GTPγS. Increasing rates of nucleotide exchange were observed, with curves shifting from an exponential to sigmoidal fit (Fig. 4A). These NMR assays contain detergent, reporting on SOS1 activity in the absence of membrane and the concentration of soluble RAS is sufficient to displace the regulatory HF-DH-PH module from the allosteric site. We therefore reasoned the exponential-sigmoidal shift reflected a requirement to accumulate RAS-GTP, a better allosteric substrate than RAS-GDP (28). Indeed, addition of unlabeled RAS preloaded with GTPγS, but not GDP, eliminated the sigmoidal fit and augmented the exchange rate (Fig. S3 A and B).
Fig. 4.

Monitoring activity of full-length SOS1 in cell extracts. (A) Titration of lysates containing wild-type SOS1 to 15N-RAS and 10-fold GTPγS. The fit shifts from a sigmoidal to an exponential model. Transfection of vector alone showed intrinsic exchange rate. (B) SOS1 mutants differentially activate the RAS/ERK pathway. Position of mutations noted in schematic (Lower). Membrane-targeted SOS1-ΔC-CaaX was a control. Immunoblots show expressed SOS1 (anti-Flag), activated ERK (anti-pERK), loaded ERK (anti-ERK), loaded RAS (anti-RAS), and activated RAS (GST-BRAF RBD pull-down, anti-RAS) in serum-starved cells. Results are representative of multiple repeated experiments. (C) Quantification of ERK activation using densitometry. One-way ANOVA confirms a significant difference in mean pERK levels (P < 0.05). (D) Quantification of NMR-derived SOS1 exchange activity. Lysates were normalized for SOS1 expression. One-way ANOVA confirms a significant difference in mean exchange activities (P < 0.05). (E) Plot correlating ERK activation in starved cells vs. intrinsic exchange as measured by NMR. A region correlating with allosteric control was extrapolated from vector alone through SOS1-WT (autoinhibited) and SOS1-DH/Link (allosteric-exposed). The SOS1-HF and CaaX proteins lay outside of the area (circled). Also see Figs. S3 and S4.
Analysis of SOS1 enzymatic activity requires lipid vesicles (27) or RAS-pathway activation in cells (29). We considered that a combination of NMR-based exchange assays and cell-based analyses could delineate how specific mutations activate full-length SOS1, and help interpret the complex interplay between its regulatory domains and lipid membranes. A panel of mutants based on known NS mutations and structural data were used to establish this approach (Fig. S4). Included were mutants thought to relieve allosteric occlusion [DH-E268A/M269A/D271A (28) and Link-R552G (27)], stabilize association with membranes [HF-E108K (29)], and reduce affinity for allosteric RAS [Allo-W729E (30)]. The activity of these SOS1 variants in serum-starved or EGF-stimulated cells was assessed by RBD pull-down assays and pERK immunoblotting (Fig. 4 B and C and Fig. S3 C and D). Mutations thought to relieve autoinhibition (DH/Link) or enhance membrane binding (HF) increased RAS/MAPK output compared with wild-type. Next, we used NMR to directly assess RAS nucleotide exchange in lysates normalized for SOS1 expression (Fig. 4D and Fig. S3 E and F). Exchange activation was decreased by the allosteric mutation, but augmented by single DH or Link mutations, while increasing synergistically in the double mutant. SOS-HF had a wild-type exchange rate, consistent with the notion it does not alter the autoinhibitory conformation. To validate this result, the relationship between exchange activity and pERK induction was plotted (Fig. 4E). SOS1-HF, like SOS1-CaaX, falls outside an area extrapolated from vector control through SOS1-WT (representing autoinhibited) and SOS1-DH/Link (representing allosteric-exposed), rationalized by their increased membrane association. Thus, by combining membrane-independent NMR measurements with cell-based analyses of SOS1 activity, we can deconvolute mechanisms by which SOS1 mutants stimulate RAS exchange.
Profiling NS Mutations in Full-Length SOS1.
Aberrant SOS1 activation is a major underlying symptom of NS (16, 17). Available structural and biochemical data are not sufficient to predict the efficacy of many NS mutations. We therefore profiled 13 previously sequenced mutants (16, 17, 31) for which there are no data pertaining to their activity or molecular mechanism (Fig. 5A and Fig. S5 A–C). Fig. 5 B and C show the capacity of these mutants to induce ERK activation in starved cells. Six variants increased pERK (K170E, Y337C, G434R, L550P, Y702H, I733F), five induced levels comparable to wild-type (T37A, I252T, C441Y, S548R, P894R), and two actually reduced ERK activation (P655L, Q977R). The innate, membrane-independent exchange properties of these NS mutants were then determined by NMR (Fig. 5D). T37A, C441Y, P655L, and P894R activated RAS exchange only slightly better than wild-type, whereas Q977R showed reduced activity. K170E, G434R, and S548R exhibited a significant 1.5-fold increase in exchange rate, and I252T, Y702H, and I733F imparted an even greater 2- to 3-fold increase. Y337C and L550P showed dramatically increased exchange rates (5×, 8×), yet this was not detectable in cells. Relating ERK activation to exchange revealed good correlation between the NMR-derived activities and pERK levels (Fig. 5E). However, Y337C, L550P, and I252T fall outside the correlation area because of lower than expected pERK stimulation. These residues lie in close proximity (Fig. 5F), with Y337C tethering the DH and PH domains, L550 bridging the HF/Linker and DH domains, and I252 residing in the hydrophobic core of the DH domain. Although these mutations relieve autoinhibition, we postulated that other factors must compensate their effect in cells where activity is membrane-dependent. To investigate whether enhanced membrane recruitment would reveal their exchange potential, we repeated the assays using serum-stimulated cells (Fig. S5 D and E). Only wild-type levels of pERK induction were observed from the three hyperactivated NS mutants. We next considered that these mutants may have a defect in membrane binding, and performed cell fractionation. All three hyperactive mutants associated with membrane in the same ratio as wild-type (Fig. S5F). This finding suggests a membrane-dependent mechanism is abrogating their activity in cells. Our analyses demonstrate the value of NMR-based enzymatic assays incorporating cell extracts, and provide new insight to the molecular mechanisms of individual NS mutations.
Fig. 5.
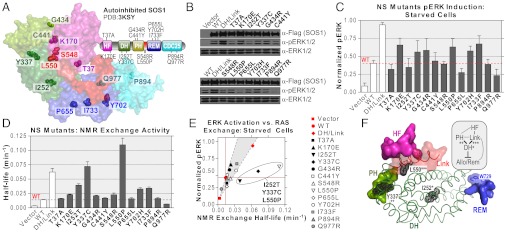
Profiling NS mutations. (A) Location of 13 NS mutations in crystal structure of autoinhibited SOS1, colored by corresponding domain in the modular outline. (B) NS mutants differentially activate the RAS/ERK pathway. Vector alone, SOS1-WT, and SOS1-DH/Link were controls. Immunoblots show SOS1 expression (anti-Flag), activated ERK (anti-pERK), and loaded ERK (anti-ERK) for serum-starved cells. Results are representative of repeated experiments. (C) Quantification of ERK activation in serum-starved cells. One-way ANOVA indicates significant differences in mean pERK levels (P < 0.05). (D) Quantification of NMR-based SOS1 exchange activity on lysates normalized for SOS1 expression. One-way ANOVA confirms a significant difference in mean activities (P < 0.05). (E) Plot correlating ERK activation in starved cells vs. intrinsic exchange activity. I252T, Y337C, and L550P lay outside the correlation area (circled). (F) Structural analysis of three high-exchange, low pERK NS mutants. DH domain is displayed as ribbons, surrounded by interacting regions of the PH (green), HF (purple), Linker (red) and Rem (blue) domains as surface representations. Mutated residues are highlighted (black). Schematic showing important interdomain contacts is boxed, with asterisks denoting these residues. Also see Fig. S5.
Inhibition of RAS Exchange and Hydrolysis by Rationally Designed RBDs.
Our NMR assay requires small amounts of material, functions in real-time with precise kinetics, and can directly evaluate mutant RAS and RASopathy-associated regulators from cell lysates. We asked whether our approach could be used to screen for inhibitors of hydrolysis or exchange. GAPs compete directly with effectors, and previous data have suggested that GAP-mediated hydrolysis is inhibited by the c-RAF1 RBD (32). Consistent with this finding, when GTP-loaded RAS was mixed with GAP-334 in the presence of BRAF RBD, sensitivity to GAP was abolished (Fig. 6A). Full-length p120GAP activity from whole-cell extracts was also inhibited (Fig. S6A). These experiments demonstrate a direct competition between GAPs and effector domains, and that inhibitors of RAS regulators can be detected by our assay.
Fig. 6.

Inhibition of GAP and GEF activity using RBDs. (A) 2-fold molar excess of BRAF RBD inhibits GAP-334-mediated RAS GTP hydrolysis. (B) 2-fold BRAFGDP inhibits SOScat activity on RASQ61L to a rate slower than intrinsic. Intrinsic exchange is also inhibited. (C) Summary of nucleotide exchange rates in the presence or absence of BRAFGDP. Addition of SOScat stimulates exchange of wild-type, G12V or Q61L RAS (Upper, intrinsic and +SOScat). SOS activation of all RAS proteins was inhibited by complex with BRAFGDP (Lower, shaded). (D) BRAFGDP also inhibits full-length SOS-DH/Link exchange activity from lysates. Also see Fig. S6.
RBDs do not possess high affinity for GDP-bound RAS (Fig. S6B) (33), so we took a synthetic approach to occlude GEFs. Recently identified point mutations in the c-RAF1 RBD enhance its interaction with RAS-GDP (34), and we constructed analogous mutations in the RBD of BRAF (hereafter BRAFGDP) (Fig. S6C). We verified binding of this mutant to inactive RAS using both NMR and a cell-based approach (Fig. S6 D and E). To determine whether our synthetic RBD could occlude and inhibit GEFs, we monitored SOScat-mediated exchange of 15N-RAS. As shown in Fig. S6F, BRAFGDP inhibited exchange of wild-type RAS (11×). Nucleotide exchange of the oncogenic mutant G12V was also reduced (50×) (Fig. S6G). As revealed earlier, Q61L exhibits both a high intrinsic rate of exchange and increased sensitivity to SOScat. Both rates were significantly decreased in the presence of BRAFGDP (Fig. 6B). Results are summarized in Fig. 6C. Furthermore, the synthetic RBD could prevent RAS activation by lysates expressing the full-length, hyperactivated SOS1-DH/Link mutant (Fig. 6D). Thus, we were able to effectively occlude GEF from the RAS nucleotide binding site to prevent its activation. These data establish our NMR assay as a viable and potentially high-throughput method toward drug discovery.
Discussion
We have applied real-time NMR to monitor defects in RAS cycling. Our approach permits analysis of multidomain regulatory proteins, such as p120GAP, NF1, and SOS1 expressed in cells, and can distinguish defects involving expression, catalysis, allosteric regulation, and membrane targeting.
As demonstrated by our NMR assays, nucleotide binding properties combine with hydrolysis defects to alter the active state of RAS mutants. G12V, G13D, and Q61L show opposing defects in exchange and hydrolysis, yet all hyperactivate RAS. This finding implies that different approaches are required for therapeutic interventions seeking to directly target these proteins. GTP is in 10-fold excess over GDP in cells, and both G13D and Q61L are likely to be hypersensitive to GEF activation, or unlikely to even require GEF. Thus, approaches targeting their weakened hydrolysis would likely be unsuccessful, but the reverse is true of G12V. Recent clinical data reveal a codon-dependent efficacy for drugs targeting RAS-driven tumors, further substantiating that the individual biochemical properties of these mutants play a vital role in tumor pathology (12, 35).
NF1 is a GAP that negatively regulates RAS, but many of the mechanisms controlling the activation, localization, and specificity of this >250-kDa protein remain unknown. We were able to detect NF1-deficiency in tumor-derived cells, which had previously required meticulous radio-labeling experiments (15, 36). We observed a decrease in the total hydrolysis capacity of these lysates, which appears sufficient to cause accumulation of RAS-GTP levels able to promote tumourigenesis. Studies must now establish whether replenishing global loss of hydrolysis activity is enough to aid patients with NF1, or whether specific activity from neurofibromin is required at precise cellular locales. Details of NF1 activation, such as a role for phosphorylation (37), can now be studied using NMR in essentially any cell type or tissue system.
SOS1 mutations are a major underlying element of NS (16, 17). Elegant structural and biochemical studies by Kuriyan and colleagues have elucidated key elements controlling SOS1 autoregulation, including HF and PH domain lipid interactions, and RAS association with the allosteric site (27–29, 38). As autoinhibition of full-length SOS1 is detectable by NMR, we can combine membrane-independent measurements of RAS activation with cell-based pERK induction to rationalize activation mechanisms for the 15 NS mutations analyzed in this work. Q977R was unique in possessing overall weaker activity than wild-type SOS1, and five other mutations displayed near-identical properties as wild-type (T37A, C441Y, S548R, P655L, and P894R). A third group exhibits correlation between amplified exchange activity and pERK induction (K170E, G434R, R552G, Y702H, and I733F), as one might predict of NS mutants. The four remaining mutations are divergent and require some discussion: E108K does not alter exchange rates, but induces pERK via increased membrane association, as previously hypothesized (27, 29). Y337C, L550P, and I252T drastically elevate RAS exchange rates, yet only stimulate pERK to similar levels as other activating NS mutants. The positioning of these residues (Fig. 5F) and their involvement in orienting the PH and HF/Linker modules in relation to the DH domain indicates a role in coupling the allosteric mechanism to membrane binding. These mutants are associated with membrane at similar levels to wild-type (Fig. S5F), induce pERK upon stimulation (Fig. S5D), and correlate well with data showing a tethered DH domain alone is not capable of inhibiting SOScat (39). We can therefore postulate that I252T, Y337C, and L550P show attenuated activation in cells because of membrane-dependent conformational defects that hinder interactions with allosteric or substrate RAS on the membrane surface (Fig. S7). This effect is absent in solution, resulting in hyperactivation. Taken together, our data strongly argue that the effects of NS mutations on individual SOS1 domains are balanced by layered interdomain interactions and association with biological membranes, resulting in consistent, low-level RAS activation in cells.
In this article we present an NMR-based methodology to detect defects in RAS GTPase cycling. As GTPase networks are intricately associated with disease, our methodology should be a valuable tool toward the detection of GTPase pathway defects, as well as the identification and characterization of new therapeutics targeting these important signaling networks.
Materials and Methods
Plasmid constructs and antibodies, purification of recombinant proteins, cell culture, RBD pull downs and Western blotting, NMR spectroscopy, membrane fractionation, and statistical analysis are described in SI Materials and Methods.
For GTPase analysis, RAS concentration was held consistent at 250 μM. To calculate the GDP-bound ratio [IGDP/(IGDP + IGTP)], peak intensities were extracted from individual spectrum with NMRView on at least eight paired (GTP/GDP) resonances, plotted against time, and data fit to a one-phase exponential or sigmoidal curve using GraphPad Prism. GAP assays in the presence of BRAF RBD were plotted using only GDP intensities, as many GTP-specific resonances undergo large chemical-shift perturbations upon effector binding. Resulting hydrolysis rates were identical to those calculated using the [IGDP/(IGDP + IGTP)] ratio, providing the reaction reached completion. All exchange assays were performed in a 10-fold molar excess of GTPγS to preclude competition with hydrolysis. For NMR assays incorporating cell extracts, cells were lysed in NMR buffer [20 mM Tris (pH 7.5), 100 mM NaCl, 1 mM DTT and 5 mM MgCl2] plus detergent (1% Triton X-100) and protease inhibitors. Lysates were cleared by centrifugation and could be frozen and stored at −80 °C, or kept on ice for 24 h with no perceptible loss in activity. For direct comparison of Schwann cell-derived lysates or those expressing p120GAP, whole-cell extracts were normalized by total protein concentration. Generally, only 15 μg (exogenous p120GAP) to 70 μg (endogenous) of total protein was required in 1.7-mm CryoProbe samples to provide strong induction of RAS GTP hydrolysis. Assays comparing exchange activities from various SOS1 mutants were performed with lysates normalized for SOS1 expression through three separate rounds of immunoblotting and densitometry analysis. Only 15-μg total protein provided strong exchange activity, although SOS1 required transient expression to significantly increase protein levels over those provided by a Tet-inducible system.
Supplementary Material
Acknowledgments
We thank Greg Findlay and Chris Marshall for valuable discussion and thoughts on the manuscript. This work was supported in part by a grant from the Cancer Research Society (to M.I.); the Canadian Cancer Society (M.I.); National Institutes of Health Grant R37 CA49132 (to B.G.N.); the Ontario Ministry of Health and Long-Term Care; the Princess Margaret Hospital Foundation; and a Canadian Breast Cancer Foundation fellowship (to M.J.S.). M.I. and B.G.N. hold Canada Research Chairs. B.G.N. is a recipient of the Premier of Ontario’s Summit Award. The 800- and 600-MHz NMR spectrometers were funded by the Canada Foundation for Innovation.
Footnotes
The authors declare no conflict of interest.
This article is a PNAS Direct Submission.
This article contains supporting information online at www.pnas.org/lookup/suppl/doi:10.1073/pnas.1218173110/-/DCSupplemental.
References
- 1.Fernández-Medarde A, Santos E. Ras in cancer and developmental diseases. Genes Cancer. 2011;2(3):344–358. doi: 10.1177/1947601911411084. [DOI] [PMC free article] [PubMed] [Google Scholar]
- 2.Gysin S, Salt M, Young A, McCormick F. Therapeutic strategies for targeting Ras proteins. Genes Cancer. 2011;2(3):359–372. doi: 10.1177/1947601911412376. [DOI] [PMC free article] [PubMed] [Google Scholar]
- 3.Downward J. Targeting RAS signalling pathways in cancer therapy. Nat Rev Cancer. 2003;3(1):11–22. doi: 10.1038/nrc969. [DOI] [PubMed] [Google Scholar]
- 4.Rodriguez-Viciana P, Sabatier C, McCormick F. Signaling specificity by Ras family GTPases is determined by the full spectrum of effectors they regulate. Mol Cell Biol. 2004;24(11):4943–4954. doi: 10.1128/MCB.24.11.4943-4954.2004. [DOI] [PMC free article] [PubMed] [Google Scholar]
- 5.Der CJ, Finkel T, Cooper GM. Biological and biochemical properties of human rasH genes mutated at codon 61. Cell. 1986;44(1):167–176. doi: 10.1016/0092-8674(86)90495-2. [DOI] [PubMed] [Google Scholar]
- 6.Gibbs JB, Sigal IS, Poe M, Scolnick EM. Intrinsic GTPase activity distinguishes normal and oncogenic ras p21 molecules. Proc Natl Acad Sci USA. 1984;81(18):5704–5708. doi: 10.1073/pnas.81.18.5704. [DOI] [PMC free article] [PubMed] [Google Scholar]
- 7.McGrath JP, Capon DJ, Goeddel DV, Levinson AD. Comparative biochemical properties of normal and activated human ras p21 protein. Nature. 1984;310(5979):644–649. doi: 10.1038/310644a0. [DOI] [PubMed] [Google Scholar]
- 8.Manne V, Bekesi E, Kung HF. Ha-ras proteins exhibit GTPase activity: Point mutations that activate Ha-ras gene products result in decreased GTPase activity. Proc Natl Acad Sci USA. 1985;82(2):376–380. doi: 10.1073/pnas.82.2.376. [DOI] [PMC free article] [PubMed] [Google Scholar]
- 9.Bollag G, McCormick F. Differential regulation of rasGAP and neurofibromatosis gene product activities. Nature. 1991;351(6327):576–579. doi: 10.1038/351576a0. [DOI] [PubMed] [Google Scholar]
- 10.Scheffzek K, et al. The Ras-RasGAP complex: Structural basis for GTPase activation and its loss in oncogenic Ras mutants. Science. 1997;277(5324):333–338. doi: 10.1126/science.277.5324.333. [DOI] [PubMed] [Google Scholar]
- 11.Guerrero S, et al. K-ras codon 12 mutation induces higher level of resistance to apoptosis and predisposition to anchorage-independent growth than codon 13 mutation or proto-oncogene overexpression. Cancer Res. 2000;60(23):6750–6756. [PubMed] [Google Scholar]
- 12.Morelli MP, Kopetz S. Hurdles and complexities of codon 13 KRAS mutations. J Clin Oncol. 2012;30(29):3565–3567. doi: 10.1200/JCO.2012.43.6535. [DOI] [PubMed] [Google Scholar]
- 13.Tidyman WE, Rauen KA. The RASopathies: Developmental syndromes of Ras/MAPK pathway dysregulation. Curr Opin Genet Dev. 2009;19(3):230–236. doi: 10.1016/j.gde.2009.04.001. [DOI] [PMC free article] [PubMed] [Google Scholar]
- 14.Legius E, Marchuk DA, Collins FS, Glover TW. Somatic deletion of the neurofibromatosis type 1 gene in a neurofibrosarcoma supports a tumour suppressor gene hypothesis. Nat Genet. 1993;3(2):122–126. doi: 10.1038/ng0293-122. [DOI] [PubMed] [Google Scholar]
- 15.Bollag G, et al. Loss of NF1 results in activation of the Ras signaling pathway and leads to aberrant growth in haematopoietic cells. Nat Genet. 1996;12(2):144–148. doi: 10.1038/ng0296-144. [DOI] [PubMed] [Google Scholar]
- 16.Roberts AE, et al. Germline gain-of-function mutations in SOS1 cause Noonan syndrome. Nat Genet. 2007;39(1):70–74. doi: 10.1038/ng1926. [DOI] [PubMed] [Google Scholar]
- 17.Tartaglia M, et al. Gain-of-function SOS1 mutations cause a distinctive form of Noonan syndrome. Nat Genet. 2007;39(1):75–79. doi: 10.1038/ng1939. [DOI] [PubMed] [Google Scholar]
- 18.Marshall CB, et al. Probing the GTPase cycle with real-time NMR: GAP and GEF activities in cell extracts. Methods. 2012;57(4):473–485. doi: 10.1016/j.ymeth.2012.06.014. [DOI] [PubMed] [Google Scholar]
- 19.Mazhab-Jafari MT, et al. Real-time NMR study of three small GTPases reveals that fluorescent 2′(3′)-O-(N-methylanthraniloyl)-tagged nucleotides alter hydrolysis and exchange kinetics. J Biol Chem. 2010;285(8):5132–5136. doi: 10.1074/jbc.C109.064766. [DOI] [PMC free article] [PubMed] [Google Scholar]
- 20.Temeles GL, Gibbs JB, D’Alonzo JS, Sigal IS, Scolnick EM. Yeast and mammalian Ras proteins have conserved biochemical properties. Nature. 1985;313(6004):700–703. doi: 10.1038/313700a0. [DOI] [PubMed] [Google Scholar]
- 21.Margarit SM, et al. Structural evidence for feedback activation by Ras.GTP of the Ras-specific nucleotide exchange factor SOS. Cell. 2003;112(5):685–695. doi: 10.1016/s0092-8674(03)00149-1. [DOI] [PubMed] [Google Scholar]
- 22.Gideon P, et al. Mutational and kinetic analyses of the GTPase-activating protein (GAP)-p21 interaction: The C-terminal domain of GAP is not sufficient for full activity. Mol Cell Biol. 1992;12(5):2050–2056. doi: 10.1128/mcb.12.5.2050. [DOI] [PMC free article] [PubMed] [Google Scholar]
- 23.The I, et al. Neurofibromatosis type 1 gene mutations in neuroblastoma. Nat Genet. 1993;3(1):62–66. doi: 10.1038/ng0193-62. [DOI] [PubMed] [Google Scholar]
- 24.Johnson MR, Look AT, DeClue JE, Valentine MB, Lowy DR. Inactivation of the NF1 gene in human melanoma and neuroblastoma cell lines without impaired regulation of GTP.Ras. Proc Natl Acad Sci USA. 1993;90(12):5539–5543. doi: 10.1073/pnas.90.12.5539. [DOI] [PMC free article] [PubMed] [Google Scholar]
- 25.Muir D, Neubauer D, Lim IT, Yachnis AT, Wallace MR. Tumorigenic properties of neurofibromin-deficient neurofibroma Schwann cells. Am J Pathol. 2001;158(2):501–513. doi: 10.1016/S0002-9440(10)63992-2. [DOI] [PMC free article] [PubMed] [Google Scholar]
- 26.Cichowski K, Santiago S, Jardim M, Johnson BW, Jacks T. Dynamic regulation of the Ras pathway via proteolysis of the NF1 tumor suppressor. Genes Dev. 2003;17(4):449–454. doi: 10.1101/gad.1054703. [DOI] [PMC free article] [PubMed] [Google Scholar]
- 27.Gureasko J, et al. Role of the histone domain in the autoinhibition and activation of the Ras activator Son of sevenless. Proc Natl Acad Sci USA. 2010;107(8):3430–3435. doi: 10.1073/pnas.0913915107. [DOI] [PMC free article] [PubMed] [Google Scholar]
- 28.Sondermann H, et al. Structural analysis of autoinhibition in the Ras activator Son of sevenless. Cell. 2004;119(3):393–405. doi: 10.1016/j.cell.2004.10.005. [DOI] [PubMed] [Google Scholar]
- 29.Yadav KK, Bar-Sagi D. Allosteric gating of Son of sevenless activity by the histone domain. Proc Natl Acad Sci USA. 2010;107(8):3436–3440. doi: 10.1073/pnas.0914315107. [DOI] [PMC free article] [PubMed] [Google Scholar]
- 30.Freedman TS, et al. A Ras-induced conformational switch in the Ras activator Son of sevenless. Proc Natl Acad Sci USA. 2006;103(45):16692–16697. doi: 10.1073/pnas.0608127103. [DOI] [PMC free article] [PubMed] [Google Scholar]
- 31.Lepri F, et al. SOS1 mutations in Noonan syndrome: Molecular spectrum, structural insights on pathogenic effects, and genotype-phenotype correlations. Hum Mutat. 2011;32(7):760–772. doi: 10.1002/humu.21492. [DOI] [PMC free article] [PubMed] [Google Scholar]
- 32.Scheffler JE, et al. Characterization of a 78-residue fragment of c-Raf-1 that comprises a minimal binding domain for the interaction with Ras-GTP. J Biol Chem. 1994;269(35):22340–22346. [PubMed] [Google Scholar]
- 33.Herrmann C, Martin GA, Wittinghofer A. Quantitative analysis of the complex between p21ras and the Ras-binding domain of the human Raf-1 protein kinase. J Biol Chem. 1995;270(7):2901–2905. doi: 10.1074/jbc.270.7.2901. [DOI] [PubMed] [Google Scholar]
- 34.Filchtinski D, et al. What makes Ras an efficient molecular switch: A computational, biophysical, and structural study of Ras-GDP interactions with mutants of Raf. J Mol Biol. 2010;399(3):422–435. doi: 10.1016/j.jmb.2010.03.046. [DOI] [PubMed] [Google Scholar]
- 35.Guerrero S, et al. Codon 12 and codon 13 mutations at the K-ras gene induce different soft tissue sarcoma types in nude mice. FASEB J. 2002;16(12):1642–1644. doi: 10.1096/fj.02-0050fje. [DOI] [PubMed] [Google Scholar]
- 36.Basu TN, et al. Aberrant regulation of ras proteins in malignant tumour cells from type 1 neurofibromatosis patients. Nature. 1992;356(6371):713–715. doi: 10.1038/356713a0. [DOI] [PubMed] [Google Scholar]
- 37.Leondaritis G, Petrikkos L, Mangoura D. Regulation of the Ras-GTPase activating protein neurofibromin by C-tail phosphorylation: Implications for protein kinase C/Ras/extracellular signal-regulated kinase 1/2 pathway signaling and neuronal differentiation. J Neurochem. 2009;109(2):573–583. doi: 10.1111/j.1471-4159.2009.05975.x. [DOI] [PubMed] [Google Scholar]
- 38.Gureasko J, et al. Membrane-dependent signal integration by the Ras activator Son of sevenless. Nat Struct Mol Biol. 2008;15(5):452–461. doi: 10.1038/nsmb.1418. [DOI] [PMC free article] [PubMed] [Google Scholar]
- 39.Sacco E, et al. Regulation of hSos1 activity is a system-level property generated by its multi-domain structure. Biotechnol Adv. 2012;30(1):154–168. doi: 10.1016/j.biotechadv.2011.07.017. [DOI] [PubMed] [Google Scholar]
Associated Data
This section collects any data citations, data availability statements, or supplementary materials included in this article.