

Abstract
The aim of the present work was to perform a meta-analysis to evaluate the association between the interleukin 10 (IL-10) −819C/T (rs1800871) polymorphism and cancer risk. A total of 73 studies, including 15,942 cancer cases and 22,336 controls, were identified in this meta-analysis. The odds ratios (ORs) with 95% confidence intervals (CIs) were calculated using the random-effects model. Overall, no significant association was identified between the IL-10 −819C/T polymorphism and cancer risk. In the subgroup analyses, the T allele and TT genotype were associated with a moderately reduced cancer risk in the Asian population (T allele vs. C allele: OR=0.93, 95%CI: 0.87, 0.99; TT vs. CC: OR=0.86, 95%CI: 0.76, 0.98; TT vs. CT/CC: OR=0.90, 95%CI: 0.82, 0.98). Individuals who were homozygous for the T allele (TT) were found to be associated with significantly reduced gastric cancer risk in the Asian population. The heterozygous variant (CT) and the dominant model (TT/CT vs. CC) were associated with an increased risk for cervical and ovarian cancer. However, the IL-10 −819C/T polymorphism was not significantly associated with breast cancer, colorectal cancer, lung cancer, hepatocellular carcinoma, prostate cancer, lymphoma, or melanoma. The depressed cancer risk of the TT genotype occurred in the studies of hospital-based case-control studies and the studies recruited less than 500 subjects, but no statistically significant results were found in the stratified analyses using genotyping method. The results suggest that the IL-10 −819TT genotype may be a protective factor for cancer in Asians, especially gastric cancer. In contrast, the CT genotype and the dominant model could be risk factors for cervical and ovarian cancer. The importance of stratifying by ethnicity, cancer type, study design, and sample size needs to be standardized in future studies, together with considering the association between the IL-10 −819C/T polymorphism and cancer risk. Furthermore, the linkage of −819C/T with other polymorphisms of the IL-10 gene may help explain the variability in findings.
Introduction
Gene and gene variants
Interleukin-10 (IL-10) is a multifunctional anti-inflammatory cytokine mainly produced by immune cells, such as T cells, monocytes, appropriately stimulated macrophages, some subsets of dendritic cells (DCs), and B cells (Fillatreau et al., 2008; O'Garra and Vieira, 2007; Ryan et al., 2007). Non-immune cell sources of IL-10 also exist, including keratinocytes, epithelial cells, and some tumor cells (Moore et al., 2001; Williams et al., 2004). The human IL-10 gene is located on chromosome 1q32.1 and contains five exons (Spits and de Waal Malefyt, 1992). Recently, IL-10 has been identified as an important player in the development of immunological and inflammatory responses involving in the pathogenesis of cancer (Chow et al., 2012).
The IL-10 promoter contains several single-nucleotide polymorphisms (SNPs) (Turner et al., 1997), which may influence IL-10 gene expression (Liang et al., 2011). A C-to-T single base pair substitution has been identified in the promoter region of the IL-10 gene −819 base pairs upstream of the transcriptional start site. This single base pair substitution has been named both −819C/T and rs1800871. At this time, a series of seven molecular epidemiological studies and meta-analyses have investigated the association between the IL-10 −819C/T polymorphism and the susceptibility to different cancer types among different populations (Chen et al., 2010; Persson et al., 2011; Shao et al., 2011; Wei et al., 2011; Xue et al., 2012; Zou et al., 2011). However, the results from these studies are inconsistent.
Disease
Cancer is currently a major worldwide public health problem. Etiologically, carcinogenesis is a multistep and multifactorial process resulting from complex interactions between genetic and environmental factors (Pharoah et al., 2004). There is convincing evidence that chronic inflammation is a risk factor for tumor development (Chow et al., 2012). Chronic inflammation contributes to the following: (1) cancer initiation by generating genotoxic stress; (2) cancer promotion by inducing cellular proliferation; and (3) cancer progression by enhancing angiogenesis and tissue invasion (Grivennikov et al., 2010). Activated immune cells produce and secrete inflammatory cytokines, chemokines, growth factors, prostaglandins, and reactive oxygen and nitrogen species. All of these factors affect malignant cells (de Visser et al., 2006). However, the exact mechanisms of action of inflammatory cytokines in carcinogenesis are not completely understood, and the associated risk factors must be further elucidated.
The aim of this meta-analysis was to clarify the association of the IL-10 −819C/T polymorphism with the risk of cancer by integrating published case-control studies.
Materials and Methods
We conducted this systematic review and meta-analysis according to the HuGE review guidelines (http://www.cdc.gov/genomics/hugenet/participate.htm).
Search strategy
We searched the following electronic literature databases: MEDLINE (via PubMed), EMBASE, HuGE Literature Finder, Wanfang Database (China), China National Knowledge Infrastructure (CNKI), and VIP Database (China). Our search identified all relevant articles and used the following search terms: “interleukin 10”, “interleukin-10”, “IL-10”, “IL10,” and “cancer” or the same group of interleukin-10 based search terms and “polymorphism”. One author (Zhibin Yu) identified relevant studies up to May 14, 2012. The search was without restriction with regard to language or publication date, but it was limited to studies conducted on human subjects. All of the studies identified by the search were retrieved, and their references were checked for other relevant publications. Review articles were also searched to find eligible studies. Only the most recent or complete study was selected when studies involved examination of the same population by different investigators or overlapping data by the same authors.
Inclusion/exclusion criteria
Two authors (Zhibin Yu and Yinnan Sun) reviewed all titles or abstracts of the identified studies to select those for inclusion. Studies included in our meta-analysis were required to meet the following criteria: (1) involve the evaluation of the association of the −819C/T polymorphism in the IL-10 gene and cancer risk, (2) have a case-control or cohort study design, and (3) contain sufficient published data for estimating an odds ratio (OR) with a 95% confidence interval (CI). Studies were excluded if one of the following conditions was met: (1) the study was not relevant to the IL-10 −819C/T polymorphism or cancer risk, (2) the study design was based on family or sibling pairs, (3) the study did not contain a report of genotype frequencies or number, and (4) the study was a review or an abstract.
Data extraction
The data extracted from each eligible publication included the following information: first author's name, year of publication, original country, subjects' ethnicity, sample size, cancer type, genotyping method, source of controls, and genotype numbers for cases and controls. The different ethnic origins were categorized as European, Asian, or African. If a study did not state the ethnic origin, or if it was not possible to separate participants according to such phenotypes, the group was termed “mixed.” For studies including subjects from different ethnic groups, data were extracted separately for each ethnic group whenever possible. Meanwhile, studies investigating more than one type of cancer were counted as individual data sets only in subgroup analyses by cancer type. In addition, if more than one cancer type was included in a study in the meta-analysis, it was termed “mixed cancer”. The data were extracted and independently entered into two databases by two authors (Zhibin Yu and Yinnan Sun). Any discrepancy between these two investigators was resolved by a third author (Chen Huang).
Statistical analysis
The presence of control population selective bias was evaluated using a chi-squared goodness-of-fit test to determine whether the genotype distribution of the control subjects of each individual reported population conformed to Hardy-Weinberg equilibrium (HWE; p<0.05 was considered significant). The frequencies of the T and C alleles in various ethnic groups were estimated using the studies with control groups that were in HWE (p<0.05).
The random-effects model was used to estimate the summary odds ratio (ORs) and the corresponding 95% confidence intervals (CIs) for each association from the studies (DerSimonian and Laird, 1986). The meta-analysis assessed the association between allele T and cancer risk compared with allele C (T vs. C), as well as using TT versus CC (co-dominant model, homozygote effect), CT versus CC (co-dominant model, heterozygote effect), TT versus CT, TT/CT versus CC (dominant model), TT versus CT/CC (recessive model), and TT/CC versus CT (complete overdominant model). Between-study heterogeneity was measured using a Q-statistic test and the I2 statistic with its corresponding 95% confidence (uncertainty) interval (Higgins et al., 2003; Ioannidis et al., 2007). The I2 takes values between 0% and 100%, where higher values indicate higher levels of heterogeneity (I2<25%: no heterogeneity; I2=25%–50%: moderate heterogeneity; I2=50%–75%: large heterogeneity; I2=75%–100%: extreme heterogeneity). If p<0.10 for the Q statistic or I2>25%, the between-study heterogeneity was considered to be significant. The statistical significance of the summary OR was determined with a Z test, for which p<0.05 was considered significant.
Subgroup analyses were also performed based on ethnicity, cancer type, study design, sample size, and genotyping method if a subgroup contained at least three individual studies. Additionally, sensitivity analyses were performed by including or excluding studies not in HWE. Cumulative meta-analysis was also conducted via the assortment of studies by publication time. Publication bias among the included studies was assessed graphically using a Begg's funnel plot and Egger's linear regression test (Sterne et al., 2000).
Statistical analyses were performed with SPSS for Windows (version 11.0; SPSS, Inc., Chicago, IL) and Stata software (version 11.0; Stata Corporation, College Station, TX).
Assessment of cumulative evidence
The cumulative evidence for the association between IL-10 −819C/T and cancer risk was assessed according to the Venice interim guidelines (Ioannidis et al., 2008) and was graded based on three categories: (1) the amount of evidence (grade “A” was assigned when the total number of minor alleles of cases and controls combined in the meta-analyses exceeded 1000, “B” when it was between 100 and 1000, and “C” when it was less than 100); (2) the replication consistency (grade A was assigned for I2<25%, B for I2=25%–50%, and C for I2>50%); (3) protection from bias (grade A was assigned if there was no observable bias, grade B was assigned if bias could be present or could explain the presence of the association; grade C was assigned if bias was considerable and had an effect in either the presence or absence of the association). The composite epidemiological credibility was rated as “strong” if three A grades were assigned, “moderate” if at least one B grade but no C grades were assigned, and “weak” if a C grade in any of the three assessment criteria was assigned.
Results
Characteristics of studies
As shown in Figure 1, 807 published records were retrieved based on the search criteria. A total of 73 studies from 68 eligible articles, involving 15,942 cancer cases and 22,336 controls, were identified that had investigated the association between the IL-10 −819C/T polymorphism and the risk for cancer (Ahirwar et al., 2009; Alonso et al., 2005; Alpizar-Alpizar et al., 2005; Amirzargar et al., 2005; Ando et al., 2009; Basturk et al., 2005; Bushley et al., 2004; Cacev et al., 2008; Castro et al., 2009; Colakogullari et al., 2008; Cozar et al., 2007; Crivello et al., 2006; Crusius et al., 2008; da Silva et al., 2007; de Oliveira et al., 2003; Eder et al., 2007; El-Omar et al., 2003; Faupel-Badger et al., 2008; Festa et al., 2005; Gonullu et al., 2007; Gunter et al., 2006; Guzowski et al., 2005; Hellmig et al., 2008; Howell et al., 2001; Hubner et al., 2007; Ioana Braicu et al., 2007; Kamangar et al., 2006; Kang et al., 2009; Kesarwani et al., 2009; Kong et al., 2010; Lan et al., 2006; Langsenlehner et al., 2005; Lech-Maranda et al., 2007; Lee et al., 2005; Liu et al., 2010a; Liu et al., 2011; Macarthur et al., 2005; Martinez-Escribano et al., 2002; Mazur et al., 2005; Michaud et al., 2006; Migita et al., 2005; Munro et al., 2003; Pharoah et al., 2007; Pogoda et al., 2007; Pratesi et al., 2006; Purdue et al., 2007; Roh et al., 2002; Savage et al., 2004; Seifart et al., 2005; Shih et al., 2005; Shin et al., 2003; Sicinschi et al., 2006; Singh et al., 2009; Su et al., 2010; Sugimoto et al., 2007; Tseng et al., 2006; VanCleave et al., 2010; Vogel et al., 2007; Vogel et al., 2008; Wang et al., 2009; Wei et al., 2007; Wu et al., 2003; Xiao et al., 2009; Yao et al., 2008; Zabaleta et al., 2008; Zambon et al., 2005; Zhang et al., 2004; Zoodsma et al., 2005).
FIG. 1.

Flow chart depicting the procedures for the identification of studies, including the inclusion and exclusion criteria.
A meta-analysis database was established based on the extracted information from each eligible article. Among the 73 selected studies, there were two studies of African subjects, 31 studies of Asian subjects, 27 studies of European subjects, and 13 studies of mixed-ethnicity subjects.
With regard to cancer types, there were two studies of bladder cancer, four studies of breast cancer, three studies of cervical cancer, three studies of colorectal cancer, two studies of esophageal cancer, two studies of gallbladder cancer, 15 studies of gastric cancer, four studies of hepatocellular carcinoma, one study of Kaposi sarcoma, two studies of leukemia, four studies of lung cancer, seven studies of lymphoma, five studies of melanoma, two studies of multiple myeloma, two studies of nasopharyngeal carcinoma, one study of oral cancer, three studies of ovarian cancer, seven studies of prostate cancer, two studies of renal cell cancer, one study of testicular cancer, and one study of mixed cancer.
Of the 73 included studies, 42 studies were hospital-based, 29 studies were population-based, and two studies were nested case-control studies. Multiple genotyping methods were employed in the studies, such as PCR-RFLP, TaqMan PCR, PCR-SSP, and DNA sequencing. Of these, 25 studies recruited more than 500 subjects, and 48 studies recruited less than 500 subjects. The distributions of genotypes in the controls of 11 studies were not consistent with HWE. Detailed and summary characteristics of the eligible studies are shown in Table 1 and Supplementary Table S1 (supplementary data are available online at www.liebertpub.com/omi).
Table 1.
Characteristics of Studies Included in the Meta-Analysis
| First author | Year | Cancer type | Study location | Ethnic group | Genotyping method | Study design | Case | Control | HWE |
|---|---|---|---|---|---|---|---|---|---|
| Guey | 2010 | bladder | Spain | European | GoldenGate, TaqMan | HCC | 1017 | 1062 | 0.52 |
| Ahirwar | 2009 | bladder | India | Asian | AS-PCR | HCC | 214 | 385 | 0.00 |
| Kong | 2010 | breast | China | Asian | PCR-RFLP | HCC | 315 | 322 | 0.01 |
| Schonfeld | 2010 | breast | USA | Mixed | TaqMan | PCC | 829 | 1059 | 0.40 |
| Scola | 2006 | breast | Italy | European | PCR-RFLP | HCC | 84 | 106 | 0.06 |
| Guzowski | 2005 | breast | USA | Mixed | DHPLC | HCC | 50 | 25 | 0.62 |
| Singh | 2009 | cervical | India | Asian | PCR-RFLP | HCC | 150 | 162 | 0.04 |
| Zoodsma | 2005 | cervical | Netherlands | European | TaqMan | PCC | 654 | 606 | 0.20 |
| Roh | 2002 | cervical | Korea | Asian | sequencing | HCC | 144 | 179 | 0.72 |
| Cacev | 2008 | colorectal | Croatia | European | PCR-RFLP | PCC | 160 | 160 | 0.26 |
| Cozar | 2007 | colorectal | Spain | European | TaqMan | HCC | 95 | 175 | 0.39 |
| Gunter | 2006 | colorectal | USA | Mixed | TaqMan | HCC | 222 | 209 | 0.94 |
| Savage | 2004 | esophageal | China | Asian | SNaPshot | PCC | 116 | 382 | 0.31 |
| El-El-Omar | 2003 | esophageal | USA | Mixed | TaqMan | PCC | 161 | 210 | 0.42 |
| Hsing | 2008 | gallbladder | China | Asian | TaqMan | PCC | 237 | 728 | 0.56 |
| Vishnoi | 2007 | gallbladder | India | Asian | PCR-RFLP | HCC | 82 | 45 | 0.37 |
| Kim | 2012 | gastric | Korea | Asian | MALDI-TOF | HCC | 495 | 495 | 0.04 |
| Zeng | 2012 | gastric | China | Asian | SNaPshot | HCC | 151 | 153 | 0.46 |
| Liu | 2011 | gastric | China | Asian | PCR-RFLP | HCC | 234 | 243 | 0.77 |
| Su | 2010 | gastric | China | Asian | PCR-RFLP | HCC | 43 | 100 | 0.43 |
| Kang | 2009 | gastric | Korea | Asian | PCR-RFLP | PCC | 333 | 332 | 0.59 |
| Ko | 2009 | gastric | Korea | Asian | TaqMan | PCC | 83 | 326 | 0.03 |
| Xiao | 2009 | gastric | China | Asian | PCR-RFLP | HCC | 220 | 624 | 0.71 |
| Crusius | 2008 | gastric | European | European | TaqMan | NCC | 229 | 1094 | 0.02 |
| Sugimoto | 2007 | gastric | Japan | Asian | AS-PCR | PCC | 105 | 168 | 0.19 |
| Kamangar | 2006 | gastric | Finland | European | TaqMan | PCC | 98 | 152 | 0.66 |
| Alpizar-Alpizar | 2005 | gastric | Costa Rica | Mixed | sequencing | PCC | 45 | 45 | 0.18 |
| Zambon | 2005 | gastric | Italy | European | TaqMan | HCC | 129 | 644 | 0.69 |
| Savage | 2004 | gastric | China | Asian | SNaPshot | PCC | 84 | 382 | 0.31 |
| El-El-Omar | 2003 | gastric | USA | Mixed | TaqMan | PCC | 314 | 210 | 0.42 |
| Wu | 2003 | gastric | China | Asian | sequencing | HCC | 220 | 230 | 0.23 |
| Bei | 2011 | hepatocellular | China | Asian | TaqMan | HCC | 589 | 597 | 0.68 |
| Liu | 2010b | hepatocellular | China | Asian | TaqMan | HCC | 170 | 187 | 0.29 |
| Migita | 2005 | hepatocellular | Japan | Asian | PCR-SSP | HCC | 48 | 193 | 0.38 |
| Heneghan | 2003 | hepatocellular | China | Asian | PCR, probes hybridization | HCC | 98 | 97 | 0.01 |
| Brown | 2006 | kaposi sarcoma | Italy | European | TaqMan | PCC | 132 | 168 | 0.11 |
| Amirzargar | 2005 | leukaemia | Iran | European | PCR-SSP | PCC | 30 | 40 | 0.04 |
| Guzowski | 2005 | leukaemia | USA | Mixed | DHPLC | HCC | 17 | 25 | 0.62 |
| Colakogullari | 2008 | lung | Turkey | Asian | PCR-SSP | HCC | 44 | 59 | 0.89 |
| Hosgood | 2008 | lung | China | Asian | GoldenGate | PCC | 122 | 108 | 1.00 |
| Seifart | 2005 | lung | Germany | European | PCR-RFLP | PCC | 183 | 423 | 0.24 |
| Shih | 2005 | lung | China | Asian | PCR-RFLP | HCC | 154 | 205 | 0.62 |
| Andrie | 2009 | lymphoma | Greece | European | ARMS-PCR | HCC | 85 | 85 | 0.59 |
| Hellmig | 2008 | lymphoma | European | European | - | HCC | 84 | 351 | 0.81 |
| Purdue | 2007a | lymphoma | Australia | Mixed | TaqMan | PCC | 538 | 488 | 0.81 |
| Kube | 2007 | lymphoma | Germany | European | TaqMan | PCC | 100 | 100 | 0.50 |
| Lan | 2006 | lymphoma | USA | Mixed | TaqMan | PCC | 491 | 574 | 0.98 |
| Persico | 2006 | lymphoma | Italy | European | PCR-RFLP | HCC | 250 | 110 | 0.15 |
| Lech-Maranda | 2004 | lymphoma | France | European | PCR-RFLP | HCC | 199 | 112 | 0.53 |
| Zhong | 2011 | melanoma | China | Asian | OpenArray | HCC | 30 | 30 | 0.90 |
| Gu | 2008 | melanoma | USA | Mixed | OpenArray | NCC | 210 | 204 | 0.08 |
| Alonso | 2005 | melanoma | Spain | European | TaqMan | HCC | 98 | 100 | 0.20 |
| Martinez-Escribano | 2002 | melanoma | Spain | European | PCR-SSP | HCC | 42 | 48 | 0.57 |
| Howell | 2001 | melanoma | UK | European | PCR-SSP | HCC | 150 | 158 | 0.69 |
| Lee | 2010 | multiple myeloma | USA | European | GoldenGate | PCC | 112 | 499 | 0.69 |
| Mazur | 2005 | multiple myeloma | Poland | European | PCR-SSP | HCC | 54 | 50 | 0.21 |
| Wei | 2007 | nasopharyngeal | China | Asian | PCR-RFLP | HCC | 198 | 210 | 0.83 |
| Pratesi | 2006 | nasopharyngeal | Italy | European | sequencing | PCC | 89 | 130 | 0.27 |
| Yao | 2008 | oral | China | Asian | PCR-RFLP | HCC | 280 | 300 | 0.80 |
| He | 2008 | ovarian | China | Asian | PCR-SSP | HCC | 33 | 90 | 0.00 |
| IoanaBraicu | 2007 | ovarian | Germany | European | sequencing | HCC | 147 | 129 | 0.63 |
| Bushley | 2004 | ovarian | USA | Mixed | 5′-nuclease assay | PCC | 181 | 219 | 0.00 |
| Liu | 2010a | prostate | China | Asian | PCR-RFLP | PCC | 262 | 270 | 0.47 |
| VanCleave | 2010 | prostate | USA | African | TaqMan | PCC | 191 | 635 | 0.03 |
| Kesarwani | 2009 | prostate | India | Asian | ARMS-PCR | HCC | 159 | 259 | 0.57 |
| Faupel-Badger | 2008 | prostate | Finland | European | TaqMan | PCC | 507 | 384 | 0.58 |
| Zabaleta | 2008 | prostate | USA | European | TaqMan | HCC | 462 | 375 | 0.71 |
| Zabaleta | 2008 | prostate | USA | African | TaqMan | HCC | 64 | 119 | 0.54 |
| Michaud | 2006 | prostate | USA | Mixed | TaqMan | PCC | 1246 | 1762 | 0.07 |
| Cozar | 2007 | renal | Spain | European | TaqMan | HCC | 127 | 175 | 0.39 |
| Basturk | 2005 | renal | Turkey | Asian | PCR-SSP | HCC | 29 | 50 | 0.32 |
| Purdue | 2007b | testicular | USA | Mixed | TaqMan | PCC | 504 | 605 | 0.16 |
| Pogoda | 2007 | mixed | Russia | European | MALDI-TOF, minisequencing | PCC | 120 | 600 | 0.78 |
ARMS-PCR, amplification refractory mutation specific polymerase chain reaction; AS-PCR, allele-specific polymerase chain reaction; DHPLC, denaturing high-performance liquid chromatography; HCC, hospital-based case-control; HWE, Hardy-Weinberg equilibrium; MALDI-TOF, matrix-assisted laser desorption/ionization time-of-flight mass spectrometry; NCC, nested case-control study; PCC, population-based case-control; PCR, polymerase chain reaction; PCR-SSP, polymerase chain reaction and sequence-specific primer typing; RFLP, restriction fragment length polymorphism.
Quantitative synthesis
Frequency of the IL-10 −819C/T polymorphism in control populations
We only used data from the studies with control groups that were in HWE for the estimation of the frequency distributions for the alleles and genotypes of the IL-10 −819C/T polymorphism in different ethnic groups with at least three studies. There were significant differences in terms of the T allele frequency between the Asian and European populations (6034 Asians and 6902 Europeans) (Supplementary Fig. S1). The frequency of the T allele was 60.06% (95%CI: 53.6, 66.49) among Asian controls, which was significantly higher than that in European controls (25.35%, 95%CI: 24.02, 26.68).
Overall data analyses
The association between the IL-10 −819C/T polymorphism and cancer risk was investigated in 73 separate studies with a total of 15942 cases and 22336 controls. As shown in Table 2, no association was found in any genetic models in the overall population (T allele vs. C allele: OR=0.96, 95%CI: 0.92, 1.00; TT vs. CC: OR=0.92, 95%CI: 0.83, 1.01; CT vs. CC: OR=0.98, 95%CI: 0.92, 1.04; TT vs. CT: OR=0.94, 95%CI: 0.87, 1.01; TT/CT vs. CC: OR=0.96, 95%CI: 0.91, 1.02; TT vs. CT/CC: OR=0.93, 95%CI: 0.86, 1.00; TT/CC vs. CT: OR=0.98, 95%CI: 0.94, 1.03). Between-study heterogeneity was moderate in the T allele versus C allele [Pheterogeneity=0.00, I2=35.2% (95%CI: 13, 51)] and TT/CT versus CC models [Pheterogeneity=0.03, I2=25.4% (95%CI: 0, 45)] (Table 3). Although the p values for the Q statistic were less than 0.10 in the TT versus CC model and TT versus CT/CC model, the I2 was less than 25%, implying low heterogeneity. The results did not differ significantly in the sensitivity analyses, excluding 11 studies that did not fulfill HWE (Supplementary Tables S2 and S3).
Table 2.
Odds Ratios and Corresponding 95% Confidence Intervals of Each Genotype of the IL-10 −819C/T Polymorphism in Overall and Subgroup Analyzed by a Random Effects Model
| |
|
|
T vs. C |
TT vs. CC |
CT vs. CC |
TT vs. CT |
TT/CT vs. CC |
TT vs. CT/CC |
TT/CC vs. CT |
|||||||
|---|---|---|---|---|---|---|---|---|---|---|---|---|---|---|---|---|
| Group | Na | Cases/Controls | OR (95%CI) | P | OR (95%CI) | P | OR (95%CI) | P | OR (95%CI) | P | OR (95%CI) | P | OR (95%CI) | P | OR (95%CI) | P |
| Overall | 73 | 15942/22336 | 0.96 (0.92, 1.00) | 0.09 | 0.92 (0.83, 1.01) | 0.10 | 0.98 (0.92, 1.04) | 0.53 | 0.94 (0.87, 1.01) | 0.13 | 0.96 (0.91, 1.02) | 0.30 | 0.93 (0.86, 1.00) | 0.07 | 0.98 (0.94, 1.03) | 0.64 |
| Ethnicity | ||||||||||||||||
| Asian | 31 | 5442/7911 | 0.93 (0.87, 0.99) | 0.03 | 0.86 (0.76, 0.98) | 0.03 | 0.98 (0.86, 1.12) | 0.81 | 0.91 (0.82, 1.00) | 0.05 | 0.94 (0.83, 1.06) | 0.32 | 0.90 (0.82, 0.98) | 0.02 | 0.93 (0.85, 1.02) | 0.14 |
| European | 27 | 5437/8036 | 1.00 (0.91, 1.09) | 0.99 | 0.97 (0.78, 1.21) | 0.85 | 1.01 (0.91, 1.11) | 0.78 | 0.98 (0.81, 1.20) | 0.90 | 1.00 (0.90, 1.11) | 0.89 | 0.98 (0.79, 1.20) | 0.86 | 0.98 (0.89, 1.07) | 0.73 |
| Cancer type | ||||||||||||||||
| breast | 4 | 1278/1512 | 0.90 (0.79, 1.01) | 0.08 | 0.83 (0.63, 1.09) | 0.19 | 0.90 (0.76, 1.07) | 0.26 | 0.89 (0.69, 1.14) | 0.37 | 0.88 (0.75, 1.04) | 0.14 | 0.86 (0.68, 1.08) | 0.20 | 1.04 (0.89, 1.22) | 0.57 |
| cervical | 3 | 948/947 | 1.20 (1.03, 1.40) | 0.01 | 1.12 (0.76, 1.65) | 0.54 | 1.39 (1.13, 1.72) | 0.00 | 0.89 (0.59, 1.36) | 0.61 | 1.35 (1.11, 1.65) | 0.00 | 1.05 (0.77, 1.42) | 0.74 | 0.78 (0.55, 1.12) | 0.18 |
| colorectal | 3 | 477/544 | 1.20 (0.80, 1.78) | 0.36 | 1.38 (0.33, 5.69) | 0.64 | 1.18 (0.84, 1.68) | 0.32 | 1.18 (0.30, 4.51) | 0.80 | 1.22 (0.83, 1.80) | 0.29 | 1.30 (0.33, 5.12) | 0.70 | 0.86 (0.62, 1.21) | 0.41 |
| gastric | 15 | 2783/5198 | 0.91 (0.82, 1.00) | 0.06 | 0.96 (0.77, 1.19) | 0.71 | 0.95 (0.82, 1.09) | 0.47 | 0.88 (0.75, 1.04) | 0.15 | 0.94 (0.82, 1.07) | 0.35 | 0.88 (0.74, 1.04) | 0.13 | 0.93 (0.82, 1.05) | 0.28 |
| Asian | 10 | 1968/3053 | 0.88 (0.79, 0.99) | 0.03 | 0.90 (0.73, 1.10) | 0.31 | 1.07 (0.87, 1.31) | 0.48 | 0.81 (0.71, 0.93) | 0.00 | 0.97 (0.80, 1.18) | 0.83 | 0.82 (0.71, 0.95) | 0.00 | 0.84 (0.74, 0.94) | 0.00 |
| European | 3 | 456/1890 | 0.92 (0.71, 1.19) | 0.54 | 0.99 (0.46 2.11) | 0.98 | 0.83 (0.66, 1.04) | 0.11 | 1.19 (0.58, 2.44) | 0.62 | 0.86 (0.69, 1.06) | 0.16 | 1.06 (0.50, 2.25) | 0.86 | 1.20 (0.96, 1.49) | 0.10 |
| hepatocellular | 4 | 905/1074 | 0.99 (0.86, 1.13) | 0.89 | 0.92 (0.67, 1.28) | 0.64 | 1.05 (0.84, 1.30) | 0.65 | 0.91 (0.67, 1.24) | 0.58 | 1.02 (0.83, 1.25) | 0.85 | 0.93 (0.71, 1.22) | 0.64 | 0.95 (0.77, 1.16) | 0.64 |
| lung | 4 | 503/795 | 0.87 (0.66, 1.15) | 0.33 | 0.57 (0.32, 1.03) | 0.06 | 0.82 (0.43, 1.55) | 0.55 | 0.89 (0.65, 1.22) | 0.47 | 0.77 (0.41, 1.44) | 0.42 | 0.79 (0.59, 1.07) | 0.13 | 0.93 (0.74, 1.17) | 0.57 |
| Asian | 3 | 320/372 | 0.77 (0.58, 1.01) | 0.06 | 0.47 (0.23, 0.94) | 0.03 | 0.67 (0.31, 1.46) | 0.32 | 0.93 (0.66, 1.31) | 0.69 | 0.63 (0.30, 1.32) | 0.22 | 0.79 (0.57, 1.09) | 0.16 | 1.06 (0.78, 1.45) | 0.67 |
| lymphoma | 7 | 1747/1820 | 0.95 (0.84, 1.07) | 0.45 | 0.90 (0.64, 1.27) | 0.57 | 0.96 (0.83, 1.11) | 0.59 | 0.92 (0.68, 1.26) | 0.63 | 0.95 (0.83, 1.09) | 0.49 | 0.91 (0.66, 1.26) | 0.59 | 1.02 (0.89, 1.18) | 0.69 |
| European | 5 | 718/758 | 0.95 (0.77, 1.18) | 0.69 | 0.98 (0.53, 1.81) | 0.95 | 0.92 (0.73, 1.16) | 0.50 | 1.03 (0.61, 1.74) | 0.90 | 0.92 (0.74, 1.16) | 0.51 | 1.01 (0.57, 1.79) | 0.96 | 1.07 (0.85, 1.34) | 0.54 |
| melanoma | 5 | 530/540 | 0.93 (0.76, 1.13) | 0.50 | 0.88 (0.51, 1.54) | 0.67 | 0.93 (0.72, 1.20) | 0.60 | 0.94 (0.52, 1.71) | 0.85 | 0.92 (0.72, 1.18) | 0.53 | 0.9 (0.52, 1.55) | 0.71 | 1.05 (0.82, 1.35) | 0.67 |
| European | 3 | 290/306 | 0.83 (0.64, 1.09) | 0.18 | 0.62 (0.30, 1.26) | 0.18 | 0.90 (0.64, 1.29) | 0.59 | 0.66 (0.31, 1.40) | 0.28 | 0.85 (0.61, 1.18) | 0.34 | 0.63 (0.31, 1.27) | 0.20 | 1.01 (0.67, 1.53) | 0.93 |
| ovarian | 3 | 361/438 | 1.21 (0.95, 1.54) | 0.11 | 1.19 (0.53, 2.68) | 0.65 | 1.60 (1.09, 2.35) | 0.01 | 0.66 (0.25, 1.77) | 0.41 | 1.47 (1.02, 2.10) | 0.03 | 0.91 (0.44, 1.91) | 0.81 | 0.69 (0.40, 1.17) | 0.17 |
| prostate | 7 | 2891/3804 | 0.94 (0.82, 1.06) | 0.34 | 0.89 (0.70, 1.14) | 0.38 | 0.91 (0.78, 1.07) | 0.26 | 0.97 (0.82, 1.15) | 0.77 | 0.91 (0.76, 1.08) | 0.28 | 0.93 (0.78, 1.10) | 0.42 | 1.05 (0.94, 1.17) | 0.37 |
| Study design | ||||||||||||||||
| HCC | 42 | 7476/9273 | 0.92 (0.87, 0.98) | 0.00 | 0.86 (0.75, 0.98) | 0.03 | 0.95 (0.86, 1.04) | 0.28 | 0.91 (0.82, 1.02) | 0.11 | 0.92 (0.85, 1.00) | 0.08 | 0.89 (0.81, 0.99) | 0.03 | 0.98 (0.90, 1.05) | 0.61 |
| PCC | 29 | 8027/11765 | 1.01 (0.94, 1.09) | 0.71 | 1.00 (0.87, 1.15) | 0.96 | 1.01 (0.93, 1.10) | 0.70 | 0.98 (0.88, 1.08) | 0.69 | 1.02 (0.93, 1.12) | 0.65 | 0.98 (0.88, 1.10) | 0.81 | 0.98 (0.91, 1.06) | 0.73 |
| Sample size | ||||||||||||||||
| <500 | 48 | 5471/7263 | 0.92 (0.86, 0.98) | 0.02 | 0.83 (0.71, 0.96) | 0.01 | 0.95 (0.86, 1.05) | 0.33 | 0.9 (0.79, 1.01) | 0.08 | 0.92 (0.84, 1.02) | 0.12 | 0.87 (0.78, 0.98) | 0.02 | 0.97 (0.89, 1.05) | 0.48 |
| ≥500 | 25 | 10471/15073 | 0.99 (0.93, 1.05) | 0.88 | 0.99 (0.88, 1.12) | 0.96 | 0.99 (0.92, 1.07) | 0.97 | 0.97 (0.89, 1.06) | 0.62 | 0.99 (0.92, 1.07) | 0.95 | 0.98 (0.89, 1.08) | 0.75 | 1.00 (0.93, 1.06) | 0.99 |
| Genotyping method | ||||||||||||||||
| PCR-RFLP | 16 | 3147/3724 | 0.92 (0.82, 1.02) | 0.13 | 0.77 (0.61, 0.97) | 0.03 | 0.92 (0.75, 1.12) | 0.44 | 0.92 (0.81, 1.03) | 0.18 | 0.88 (0.72, 1.08) | 0.24 | 0.88 (0.79, 0.99) | 0.04 | 0.95 (0.86, 1.06) | 0.41 |
| TaqMan | 25 | 8172/11557 | 0.99 (0.93, 1.05) | 0.80 | 0.96 (0.84, 1.11) | 0.64 | 0.97 (0.91, 1.04) | 0.49 | 1.01 (0.88, 1.16) | 0.82 | 0.97 (0.91, 1.04) | 0.51 | 1.00 (0.87, 1.15) | 0.99 | 1.02 (0.95, 1.10) | 0.45 |
| other | 32 | 4623/7055 | 0.95 (0.88, 1.03) | 0.25 | 0.99 (0.85, 1.15) | 0.90 | 0.99 (0.90, 1.09) | 0.93 | 0.90 (0.79, 1.02) | 0.11 | 0.98 (0.89, 1.07) | 0.71 | 0.91 (0.80, 1.03) | 0.16 | 0.95 (0.86, 1.04) | 0.31 |
Number of studies. CI, confidence interval; HWE, Hardy-Weinberg equilibrium; OR, odds ratio.
Table 3.
Heterogeneity Test for Studies of Each Genotype in Overall and Subgroups with Cochran's Q Test and the Quantity I2
| |
|
T vs. C |
TT vs. CC |
CT vs. CC |
TT vs. CT |
TT/CT vs. CC |
TT vs. CT/CC |
TT/CC vs. CT |
||||||||||||||
|---|---|---|---|---|---|---|---|---|---|---|---|---|---|---|---|---|---|---|---|---|---|---|
| |
|
Q-statistic |
|
Q-statistic |
|
Q-statistic |
|
Q-statistic |
|
Q-statistic |
|
Q-statistic |
|
Q-statistic |
|
|||||||
| Group | Na | Q | P | I2 (%) (95%CI) | Q | P | I2 (%) (95%CI) | Q | P | I2 (%) (95%CI) | Q | P | I2 (%) (95%CI) | Q | P | I2 (%) (95%CI) | Q | P | I2 (%) (95%CI) | Q | P | I2 (%) (95%CI) |
| Overall | 73 | 111.05 | 0.00 | 35 (13, 51) | 93.29 | 0.05 | 22 (0, 43) | 88.07 | 0.10 | 18 (0, 39) | 83.67 | 0.16 | 13 (0, 36) | 96.47 | 0.03 | 25 (0, 45) | 90.76 | 0.07 | 20 (0, 41) | 86.91 | 0.11 | 17 (0, 39) |
| Ethnicity | ||||||||||||||||||||||
| Asian | 31 | 40.93 | 0.09 | 26 (0, 53) | 34.29 | 0.27 | 12 (0, 43) | 40.77 | 0.09 | 26 (0, 53) | 38.54 | 0.14 | 22 (0, 50) | 39.03 | 0.13 | 23 (0, 51) | 37.27 | 0.17 | 19 (0, 48) | 42.46 | 0.07 | 29 (0, 55) |
| European | 27 | 52.56 | 0.00 | 50 (23, 68) | 41.96 | 0.03 | 38 (1, 61) | 36.06 | 0.09 | 27 (0, 55) | 33.67 | 0.14 | 22 (0, 52) | 43.64 | 0.02 | 40 (6, 62) | 39.32 | 0.05 | 33 (0, 59) | 32.74 | 0.17 | 20 (0, 51) |
| Cancer type | ||||||||||||||||||||||
| breast | 4 | 0.37 | 0.95 | 0 (0, 85) | 1.10 | 0.78 | 0 (0, 85) | 0.31 | 0.96 | 0 (0, 85) | 1.58 | 0.66 | 0 (0, 85) | 0.06 | 1.00 | 0 (0, 85) | 1.34 | 0.72 | 0 (0, 85) | 1.40 | 0.71 | 0 (0, 85) |
| cervical | 3 | 0.22 | 0.90 | 0 (0, 90) | 0.23 | 0.89 | 0 (0, 90) | 1.45 | 0.48 | 0 (0, 90) | 3.32 | 0.19 | 39 (0, 81) | 0.50 | 0.78 | 0 (0, 90) | 1.54 | 0.46 | 0 (0, 90) | 5.33 | 0.07 | 62 (0, 89) |
| colorectal | 3 | 7.13 | 0.03 | 72 (5, 92) | 8.88 | 0.01 | 77 (27, 93) | 3.40 | 0.18 | 41 (0, 82) | 7.75 | 0.02 | 74 (14, 92) | 4.55 | 0.10 | 56 (0, 87) | 8.59 | 0.01 | 76 (24, 93) | 3.35 | 0.19 | 40 (0, 82) |
| gastric | 15 | 22.00 | 0.08 | 36 (0, 66) | 19.46 | 0.15 | 28 (0, 61) | 10.52 | 0.72 | 0 (0, 54) | 24.12 | 0.04 | 42 (0, 68) | 12.21 | 0.59 | 0 (0, 54) | 25.98 | 0.03 | 46 (2, 70) | 20.54 | 0.11 | 31 (0, 63) |
| Asian | 10 | 12.52 | 0.18 | 28 (0, 66) | 8.86 | 0.45 | 0 (0, 62) | 5.22 | 0.81 | 0 (0, 62) | 10.19 | 0.33 | 11 (0, 53) | 6.96 | 0.64 | 0 (0, 62) | 12.03 | 0.21 | 25 (0, 64) | 8.47 | 0.48 | 0 (0, 62) |
| European | 3 | 4.05 | 0.13 | 50 (0, 86) | 6.07 | 0.04 | 67 (0, 90) | 0.09 | 0.95 | 0 (0, 90) | 5.02 | 0.08 | 60 (0, 89) | 1.19 | 0.55 | 0 (0, 90) | 6.23 | 0.04 | 67 (0, 91) | 0.17 | 0.92 | 0 (0. 90) |
| hepatocellular | 4 | 2.14 | 0.55 | 0 (0, 85) | 1.10 | 0.78 | 0 (0, 85) | 0.88 | 0.83 | 0 (0, 85) | 3.97 | 0.27 | 24 (0, 88) | 0.55 | 0.91 | 0 (0, 85) | 3.53 | 0.32 | 15 (0, 87) | 3.28 | 0.35 | 8 (0, 86) |
| lung | 4 | 6.67 | 0.08 | 55 (0, 85) | 5.14 | 0.16 | 41 (0, 80) | 11.25 | 0.01 | 73 (25, 91) | 2.13 | 0.55 | 0 (0, 85) | 12.02 | 0.01 | 75 (31, 91) | 1.82 | 0.61 | 0 (0, 85) | 3.00 | 0.39 | 0 (0, 85) |
| Asian | 3 | 2.73 | 0.25 | 26 (0, 92) | 3.13 | 0.20 | 36 (0, 80) | 5.84 | 0.05 | 65 (0. 90) | 1.70 | 0.42 | 0 (0, 90) | 5.75 | 0.05 | 65 (0, 90) | 1.82 | 0.40 | 0 (0, 90) | 1.25 | 0.53 | 0 (0, 90) |
| lymphoma | 7 | 6.57 | 0.36 | 8 (0, 73) | 7.15 | 0.31 | 16 (0, 60) | 3.33 | 0.77 | 0 (0, 71) | 5.19 | 0.52 | 0 (0, 71) | 4.63 | 0.59 | 0 (0, 71) | 6.62 | 0.36 | 9 (0, 74) | 2.86 | 0.83 | 0 (0, 71) |
| European | 5 | 5.65 | 0.22 | 29 (0, 73) | 6.91 | 0.14 | 42 (0, 79) | 1.95 | 0.74 | 0 (0, 79) | 4.91 | 0.29 | 18 (0, 83) | 3.37 | 0.49 | 0 (0, 79) | 6.39 | 0.17 | 37 (0, 77) | 1.52 | 0.82 | 0 (0, 79) |
| melanoma | 5 | 1.70 | 0.79 | 0 (0, 79) | 3.18 | 0.53 | 0 (0, 79) | 2.33 | 0.68 | 0 (0, 79) | 4.30 | 0.37 | 7 (0, 81) | 1.70 | 0.79 | 0 (0, 79) | 3.71 | 0.45 | 0 (0, 79) | 3.00 | 0.56 | 0 (0, 79) |
| European | 3 | 0.19 | 0.91 | 0 (0, 90) | 0.72 | 0.69 | 0(0, 90) | 2.07 | 0.35 | 3 (0, 90) | 2.06 | 0.35 | 2 (0, 90) | 1.08 | 0.58 | 0 (0, 90) | 1.18 | 0.55 | 0 (0, 90) | 2.78 | 0.24 | 28 (0, 93) |
| ovarian | 3 | 0.95 | 0.62 | 0 (0, 90) | 3.30 | 0.19 | 39 (0, 81) | 1.78 | 0.41 | 0 (0, 90) | 5.57 | 0.06 | 64 (0, 90) | 0.47 | 0.79 | 0 (0, 90) | 3.74 | 0.15 | 46 (0, 84) | 5.06 | 0.08 | 60 (0, 89) |
| prostate | 7 | 13.10 | 0.04 | 54 (0, 80) | 9.41 | 0.15 | 36 (0, 73) | 9.22 | 0.16 | 05 (0, 72) | 4.10 | 0.66 | 0 (0, 71) | 12.23 | 0.06 | 50 (0, 79) | 6.52 | 0.37 | 8 (0, 73) | 6.31 | 0.39 | 5 (0, 72) |
| Study design | ||||||||||||||||||||||
| HCC | 42 | 47.88 | 0.21 | 14 (0, 42) | 53.33 | 0.09 | 23 (0, 48) | 50.10 | 0.15 | 18 (0, 45) | 53.25 | 0.09 | 23 (0, 48) | 47.33 | 0.23 | 13 (0, 41) | 51.10 | 0.13 | 19 (0, 46) | 51.30 | 0.13 | 20 (0, 46) |
| PCC | 29 | 57.02 | 0.00 | 50 (25, 68) | 36.17 | 0.13 | 22 (0, 51) | 35.94 | 0.14 | 22 (0, 51) | 28.29 | 0.44 | 1 (0, 42) | 45.58 | 0.01 | 38 (4, 61) | 35.83 | 0.14 | 21 (0, 51) | 34.59 | 0.18 | 19 (0, 49) |
| Sample size | ||||||||||||||||||||||
| <500 | 48 | 60.86 | 0.08 | 22 (0, 46) | 54.98 | 0.20 | 14 (0, 41) | 53.51 | 0.24 | 12 (0, 39) | 57.44 | 0.14 | 18 (0, 43) | 54.78 | 0.20 | 14 (0, 40) | 56.72 | 0.16 | 17 (0, 43) | 55.83 | 0.18 | 15 (0, 42) |
| ≥500 | 25 | 46.80 | 0.00 | 48 (18, 68) | 33.88 | 0.09 | 29 (0, 57) | 34.08 | 0.08 | 29 (0, 57) | 24.77 | 0.42 | 3 (0, 46) | 40.52 | 0.02 | 40 (4, 63) | 30.88 | 0.16 | 22 (0, 53) | 30.66 | 0.16 | 21 (0, 52) |
| Genotyping method | ||||||||||||||||||||||
| PCR-RFLP | 16 | 28.40 | 0.02 | 47 (6, 70) | 25.76 | 0.04 | 41 (0, 68) | 32.19 | 0.01 | 53 (18, 74) | 11.72 | 0.70 | 0 (0, 52) | 36.27 | 0.00 | 58 (28, 76) | 13.80 | 0.54 | 0 (0, 52) | 15.43 | 0.42 | 2 (0, 54) |
| TaqMan | 25 | 37.41 | 0.04 | 35 (0, 60) | 29.96 | 0.19 | 19 (0, 51) | 25.38 | 0.39 | 5 (0, 37) | 32.46 | 0.12 | 26 (0, 55) | 27.92 | 0.26 | 14 (0, 47) | 35.35 | 0.06 | 32 (0, 58) | 29.94 | 0.19 | 19 (0, 51) |
| other | 32 | 43.33 | 0.07 | 28 (0, 54) | 32.49 | 0.39 | 4 (0, 34) | 30.32 | 0.50 | 0 (0, 40) | 36.20 | 0.24 | 14 (0, 45) | 31.76 | 0.43 | 2 (0, 41) | 38.46 | 0.17 | 19 (0, 48) | 38.71 | 0.16 | 19 (0, 48) |
Number of studies. CI, confidence interval; HWE, Hardy-Weinberg equilibrium.
Subgroup analyses by ethnicity
After stratification for ethnicity, we observed that in the Asian population, based on 31 studies with 5442 patients and 7911 controls, the T allele, the homozygote variant (TT), and the recessive genetic model were significantly associated with decreased risk of cancers [T allele vs. C allele: OR=0.93, 95%CI: 0.87, 0.99, Pheterogeneity=0.09, I2=26.7% (95%CI: 0, 53); TT vs. CC: OR=0.86, 95%CI: 0.76, 0.98, Pheterogeneity=0.27, I2=12.5% (95%CI: 0, 43); TT vs. CT/CC: OR=0.90, 95%CI: 0.82, 0.98, Pheterogeneity=0.13, I2=23.1% (95%CI: 0, 51)] (Tables 2 and 3, and Fig. 2). Sensitivity analyses were performed by excluding seven studies for which the data for the controls were not observed to be in HWE (Supplementary Tables S2 and S3). Significant effects were found in the allele comparison, homozygous comparison, and dominant model comparison with non-significant heterogeneity. However, the effect in the recessive model comparison did not reach statistical significance [OR=0.90, 95%CI: 0.81, 1.01, Pheterogeneity=0.10, I2=27.7% (95%CI: 0, 37)].
FIG. 2.

Forest plot of the cancer risk in Asian populations associated with the IL-10 −819C/T polymorphism (TT versus CC model).
In the European population, including 27 studies with 5437 cases and 8036 controls, no significant association between the IL-10 −819C/T polymorphism and the susceptibility to cancer was found for any of the variant genotypes (Table 2 and Table 3). Sensitivity analyses were performed after excluding two studies conducted by Amirzargar et al. (2005) and Crusius et al. (2008) because their controls were not in HWE. The results were similar and showed no genetic effects (Supplementary Tables S2 and S3).
Subgroup analyses by cancer types
By further stratifying the analysis by cancer types, we found that individuals with the T allele in different genetic models had a significantly lower risk of gastric cancer but higher risks of cervical and ovarian cancer (Table 2).
There was a significant association between the IL-10 −819C/T polymorphism and a reduced risk for gastric cancer in the Asian population in the T allele versus C allele model [OR=0.88, 95%CI: 0.79, 0.99, Pheterogeneity=0.18, I2=28% (95%CI: 0, 66)], the TT versus CT model [OR=0.81, 95%CI: 0.71, 0.93, Pheterogeneity=0.81, I2=0% (95%CI: 0, 62)], the TT versus CT/CC model [OR=0.82, 95%CI: 0.71, 0.95, Pheterogeneity=0.64, I2=0% (95%CI: 0, 62)], and the TT/CC versus CT model [OR=0.86, 95%CI: 0.74, 0.94, Pheterogeneity=0.48, I2=0% (95%CI: 0, 62)] (Fig. 3, Tables 2 and 3). The sensitivity analyses indicated that the association between the T allele and the decreased risk of gastric cancer in Asians was not significant after the exclusion of two studies with controls that were not in HWE (T allele vs. C allele: OR=0.87, 95%CI: 0.75, 1.00) (Supplementary Tables S2 and S3).
FIG. 3.

Forest plot of the gastric cancer risk in Asian populations associated with the IL-10 −819C/T polymorphism (TT versus CT/CC model).
In the three cervical cancer studies (Roh et al., 2002; Singh et al., 2009; Zoodsma et al., 2005) with 948 cases and 947 controls from one European population and two Asian populations, there was a significant association of the IL-10 −819C/T polymorphism with an increased risk for cervical cancer in the allele comparison model [T allele vs. C allele: OR=1.20, 95%CI: 1.03, 1.40, Pheterogeneity=0.90, I2=0% (95%CI: 0, 90)], the heterozygote comparison model [CT vs. CC: OR=1.39, 95%CI: 1.13, 1.72, Pheterogeneity=0.48, I2=0% (95%CI: 0, 90)], and the dominant model [TT/CT vs. CC: OR=1.35, 95%CI: 1.11, 1.65, Pheterogeneity=0.78, I2=0% (95%CI: 0, 90)] (Fig. 4, Tables 2 and 3). Sensitivity analysis was performed after excluding one study because the controls were not in HWE, but this exclusion did not alter the pattern of results (Supplementary Tables S2 and S3).
FIG. 4.
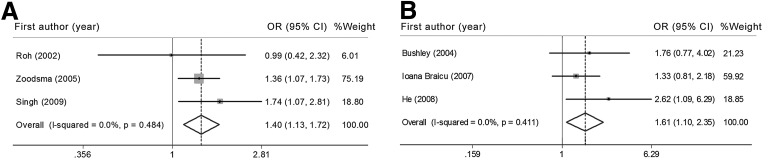
Forest plot of the risk of cervical cancer (A) and ovarian cancer (B) associated with the IL-10 −819C/T polymorphism (CT versus CC model).
Three studies (Bushley et al., 2004; He et al., 2008; Ioana Braicu et al., 2007) for ovarian cancer were retrieved comprising three different sample populations (one European, one Asian, and one mixed population) including 361 cases and 438 controls. A significantly increased risk was associated with the variant genotypes (CT and TT/CT), compared with the wild homozygote CC genotype [CT vs. CC: OR=1.61, 95%CI: 1.09, 2.35, Pheterogeneity=0.41, I2=0% (95%CI: 0, 90); TT/CT vs. CC: OR=1.47, 95%CI: 1.02, 2.10, Pheterogeneity=0.79, I2=0% (95%CI: 0, 90)] (Fig. 4, Tables 2 and 3). Because of the limited data after two studies were excluded that significantly deviated from HWE, we did not perform a sensitivity analysis.
However, the IL-10 −819C/T polymorphism was not significantly associated with breast cancer, colorectal cancer, lung cancer, hepatocellular carcinoma, prostate cancer, lymphoma, or melanoma (Tables 2 and 3). Additionally, no significant changes in other ORs were observed in any other genetic models of other cancer types in the sensitivity analyses (Supplementary Tables S2 and S3).
Subgroup analyses by study design
In the subgroup analyses by study design, pooled analysis of hospital-based case-control (HCC) studies showed that the T allele of IL-10 −819C/T polymorphism was associated with reduced cancer risk in the allele comparison model [T allele vs. C allele: OR=0.92, 95%CI: 0.87, 0.98, Pheterogeneity=0.21, I2=14% (95%CI: 0, 42)], the homozygote comparison model [TT vs. CC: OR=0.86, 95%CI: 0.75, 0.98, Pheterogeneity=0.09, I2=23% (95%CI: 0, 48)], and the recessive model [TT vs. CT/CC: OR=1.35, 95%CI: 1.11, 1.65, Pheterogeneity=0.13, I2=19% (95%CI: 0, 46)] (Tables 2 and 3). Sensitivity analysis was performed after excluding two studies and the association was observed in the T allele versus C allele, TT versus CC, CT versus CC, and TT/CT versus CC models with no significant heterogeneity, but the association disappeared in the TT versus CT/CC model (Supplementary Tables S2 and S3). None of these ORs in population-based case-control (PCC) studies were statistically significant.
Subgroup analyses by sample size
In the stratified analyses by sample size with a cutoff of 500 subjects (“sample size <500” and “sample size ≥500”), a lower risk of cancer was observed in the studies with less than 500 subjects (“sample size<500” subgroup) [T allele vs. C allele: OR=0.92, 95%CI: 0.86, 0.98, Pheterogeneity=0.08, I2=22% (95%CI: 0, 46); TT vs. CC: OR=0.83, 95%CI: 0.71, 0.96, Pheterogeneity=0.20, I2=14% (95%CI: 0, 41); TT vs. CT/CC: OR=0.92, 95%CI: 0.86, 0.98, Pheterogeneity=0.08, I2=22% (95%CI: 0, 46)] (Tables 2 and 3). No significant changes in ORs were observed in these three genetic models in the sensitivity analyses. Additionally, a significantly reduced risk was associated with the variant genotypes (CT and TT/CT), compared with the wild homozygote CC genotype [CT vs. CC: OR=0.90, 95%CI: 0.82, 0.99, Pheterogeneity=0.61, I2=0% (95%CI: 0, 35); TT/CT vs. CC: OR=0.89, 95%CI: 0.81, 0.97, Pheterogeneity=0.41, I2=3% (95%CI: 0,29)] (Supplementary Tables S2 and S3). None of these ORs in the “sample size ≥500” subgroup were statistically significant.
Subgroup analyses by genotyping method
In subgroup analyses by genotyping methods, no statistically significant results were found in either the PCR-RFLP subgroup, the TaqMan subgroup, or the other method subgroup (Tables 2 and 3). The results did not differ significantly in the sensitivity analyses excluding the studies that did not fulfill HWE (Supplementary Tables S2 and S3).
Cumulative meta-analyses
Cumulative meta-analysis of the IL-10 −819C/T polymorphism was also conducted via assortment of studies in chronologic order. Supplementary Figure S2 show the results from the cumulative meta-analyses for the association of the TT/CT genotypes compared with the CC genotype and the overall cancer risk in chronological order. The effect of the IL-10 −819C/T polymorphism tended to be not significant over time. The 95% confidence intervals became increasingly narrower with increasing data, indicating that the precision of the estimates was progressively enhanced by the continual addition of more studies.
Publication bias
The results of the Begg's funnel plots did not reveal any evidence of obvious asymmetry (Fig. 5). The results of Egger's test also did not suggest any evidence of publication bias in the overall analysis (T allele vs. C allele: p=0.70; TT vs. CC: p=0.77; CT vs. CC: p=0.95; TT vs. CT: p=0.82; TT/CT vs. CC: p=0.69; TT vs. CT/CC: p=0.81; TT/CC vs. CT: p=0.46).
FIG. 5.

Begg's funnel plot (TT versus CC model) for the identification of publication bias in the overall analysis. No significant funnel asymmetry was observed that could indicate publication bias. The horizontal line in the funnel plot indicates the random effects summary estimate, while the sloping lines indicate the expected 95% CI for a given standard error, assuming no heterogeneity between studies. Logor, natural logarithm of the OR; s.e. of: logor, standard error of the logor.
Assessment of cumulative evidence
We also assessed the cumulative evidence for the association between the IL-10 −819C/T polymorphism and cancer risk using three criteria (amount of evidence, replication, and protection from bias) of the Venice interim guidelines. For the amount of evidence, the Asian population subgroup, gastric cancer in the Asian subgroup, the cervical cancer subgroup, the HCC subgroup, and the “sample size <500” subgroup contained the largest number of subjects with minor alleles, while the ovarian cancer subgroup contained a moderate number of subjects. Furthermore, to assess replication of the associations, I2 values ranging from 12% to 26% were used in the Asian population subgroup, values ranging from 0%–28% in gastric cancer in the Asian subgroup, ranging from 14%–23% in the HCC subgroup, and ranging from 14%–22% in “sample size <500” subgroup. The I2 values were 0% in the cervical cancer and ovarian cancer subgroups. There was no obvious bias from phenotype misclassification or population stratification. However, the information on quality control procedures for genotyping was insufficient. Overall, the credibility of these associations was considered ‘moderate’.
Previous meta-analyses
There were six previous meta-analyses for the IL-10 −819C/T polymorphism and cancer risk (Supplementary Table S4). The previous meta-analyses on prostate cancer (Shao et al., 2011; Zou et al., 2011) and hepatocellular carcinoma (Wei et al., 2011) reported no statistically significant results, similar to the findings of the current meta-analysis. Three meta-analyses found that overall ORs for gastric cancer for not statistically significant (Chen et al., 2010; Persson et al., 2011; Xue et al., 2012). The IL-10 −819 TT genotype is associated with the reduced gastric cancer risk among Asians, with two meta-analyses showing statistically significant results (Chen et al., 2010; Xue et al., 2012). The OR in the TT versus CT/CC model reported by Xue et al. was 0.82, which was statistically significant and similar to the results of the current meta-analysis (Xue et al., 2012).
Discussion
In our meta-analysis, based on 73 studies that included 15,942 cases and 22,336 controls, we found that the T allele and TT genotype of the IL-10 −819C/T polymorphism demonstrated a moderately reduced risk of cancer among Asians. The carriers of the CT or TT genotypes had a higher risk of cervical and ovarian cancer, and carriers of the TT genotype had lower risk of gastric cancer in Asians. The depressed cancer risk of the TT genotype was also found in studies of hospital-based case-control studies and studies that recruited less than 500 subjects, but no statistically significant results were found in the analyses stratified by genotyping method.
It is well known that the excessive and constant production of pro-inflammatory mediators is a major contributor to tumor promotion and progression (Coussens and Werb, 2002). IL-10 is a multifunctional cytokine with both immunosuppressive and anti-angiogenic functions, suggesting that IL-10 may inhibit tumor development and progression. However, the precise mechanisms by which the IL-10 −819C/T polymorphism may modulate cancer progression remains unknown. Polymorphisms in the promoter of the IL-10 gene have been reported to influence the production capacity of IL-10 (Turner et al., 1997) and to be associated with the risk of different cancer types, including gallbladder carcinoma (Vishnoi et al., 2007), bladder cancer (Ahirwar et al., 2009), colon cancer (Cacev et al., 2008), and hepatocellular carcinoma (Liu et al., 2010b).
Although many studies have investigated the association between the IL-10 −819C/T polymorphism and cancer risk, the results have been inconsistent. Hence, it is necessary to use a quantitative approach for combining the results of these studies, and for estimating and explaining their diversity. Heterogeneity is a potential problem when interpreting the results of any meta-analysis. In this study, low or moderate heterogeneity in most comparisons for the IL-10 −819C/T polymorphism was detected using Cochran's Q test and the quantity I2. Because the data could be affected by the contributions of subgroup differences, we conducted analyses stratified by ethnicity, cancer type, study design, sample size, and genotyping method.
The incidence of the gene polymorphisms can vary substantially between different racial or ethnic populations with different genetic backgrounds, which can influence the association between polymorphisms and cancer susceptibility. In this meta-analysis, a highly significant difference in the prevalence of the −819T allele of the IL-10 gene among Asian (60.06%) and European (25.35%) controls was found. Subgroup analyses by ethnicity showed that the association between the TT variant genotypes and a decreased risk of cancer was significant in the Asian but not in the European population. This finding suggests that there is genetic diversity among the different ethnicities. These ethnic differences in the allele frequencies may be a result of natural selection or balance to other related genetic variants.
Our study represents a systematic review of the literature on the IL-10 −819C/T polymorphism and multifarious cancer risk. In the analysis stratified by cancer type, we provide the summary risk estimates for ten cancer types. While previously published meta-analyses have reported only on prostate cancer (Shao et al., 2011; Zou et al., 2011), hepatocellular carcinoma (Wei et al., 2011), and gastric cancer (Chen et al., 2010; Persson et al., 2011; Xue et al., 2012), we were able to provide a complete description of the role of the IL-10 −819C/T polymorphism in cancer risk. Our meta-analysis included two new studies (Bei et al., 2011; Liu et al., 2010b) on hepatocellular carcinoma that were not included in a 2011 meta-analysis (Wei et al., 2011) and four new studies (El-Omar et al., 2003; Kang et al., 2009; Kim et al., 2012; Zeng et al., 2012) on gastric cancer that were not included in a 2012 meta-analysis (Xue et al., 2012). However, one study for hepatocellular carcinoma included in the previous meta-analysis was excluded in our study because the genotype numbers for CT and CC genotypes were insufficient (Nieters et al., 2005). The study by Leon et al., which included 12 prostate cancer cases and 24 controls, was also excluded in this meta-analysis because the full text of this study was not assessed (Leon et al., 2010).
Our results suggest that the IL-10 −819C/T polymorphism increased risk for cervical and ovarian cancers but was a protective factor for gastric cancer in Asians. The −819 TT genotype was more protective for gastric cancer in Asians, which is a finding consistent with two previous meta-analyses (Chen et al., 2010; Xue et al., 2012). However, we did not find any significant associations among studies of breast cancer, colorectal cancer, prostate cancer, hepatocellular carcinoma, lymphoma, or melanoma in any of the genetic models. This result suggests that the influence of the genetic variation may be obscured by the presence of other unknown contributory factors involved in carcinogenesis.
Our subgroup analyses indicate that the difference in study design or the number of subjects affects the risk associations. Statistically significant associations between the carriers of the T allele and the reduced risk of cancers were identified in the HCC subgroup and the “sample size <500” subgroup but not in the PCC subgroup and the “sample size ≥500” subgroup. Therefore, more rigorous and uniform studies should be conducted to accurately explore the true association between the IL-10 −819C/T polymorphism and cancer susceptibility.
Additionally, different genotyping technologies were reported in these association studies. In our meta-analysis, no statistically significant association with cancer risk was found among any of the PCR-RFLP, TaqMan, or other method subgroups because the sensitivity and specificity of those genotyping techniques are sufficient to minimize the genotyping errors.
There were several limitations of this study. First, because of the limits of raw data and publication, some relevant studies were excluded in this meta-analysis. Second, the sample sizes in some subgroup analyses were extremely small. Third, the sources of the controls were not consistent. Both population-based healthy individuals and hospitalized patients without cancer were included in the control group. Thus, the controls may not have always been truly representative of the underlying source populations, especially when the polymorphism was also expected to affect the risk of other diseases. Finally, this meta-analysis was based on unadjusted data, and a more precise analysis could be performed if individual data were available.
A previous study reported that a haplotype formed by the IL-10 −1082 G/A, −819 C/T and −592 C/A polymorphisms is associated with the production of IL-10 (Eskdale et al., 1998). However, few studies have been conducted to evaluate the association between the haplotypes of IL-10 and cancer risk in diverse populations. Pogoda et al. (2007) reported that of IL-10 gene haplotypes determined by these polymorphisms, the ACC haplotype was more incident in cancer patients, while the ATA haplotype was more rare. A significantly higher frequency of the GCC haplotype was observed in early-stage patients in comparison to advanced prostate cancer patients, suggesting an association of GCC haplotype with prostate cancer grade in the Chinese population (Liu et al., 2010a). Our results support a role for IL-10 −819C/T polymorphism in cancer risk, but the OR values are relatively low. These results imply that other mechanisms, such as linkage with other polymorphisms, might be responsible for the association with cancer risk. Further studies estimating the effect of the haplotype of IL-10 polymorphisms interactions may eventually provide a better, more comprehensive understanding.
In conclusion, in spite of the limitations mentioned above, our meta-analysis supports the growing body of evidence that the −819TT genotype in the promoter region of the IL-10 gene is emerging as a protective factor for cancer in Asian populations, especially for gastric cancer. However, the CT genotype and dominant model present risk factors for cervical and ovarian cancer. The importance of stratifying by ethnicity, cancer type, study design, and sample size needs to be standardized in future studies, together with consideration of the association between the IL-10 −819C/T polymorphism and cancer risk. Furthermore, the linkage of the −819C/T polymorphism with other polymorphisms of IL-10 may help explain the variability in findings.
Supplementary Material
Acknowledgments
This work was supported by grants from National Natural Science Foundation of China (81272297, 81171932, 30901539) and Hunan Province Natural Sciences Foundations (11JJ1013); Research Fund for the Doctoral Program of Higher Education of China (20110162110037).
Author contributions: Chen Huang and Minghua Wu conceived and designed the experiments; Zhibin Yu and Yinnan Sun performed the experiments; Zhibin Yu and Chen Huang analyzed the data; Chen Huang contributed reagents/materials/analysis tools; Zhibin Yu, Chen Huang, and Minghua Wu wrote the article.
Author Disclosure statement
The authors declare that no potential conflicts of interest exist.
References
- Ahirwar D. Mandhani A. Mittal RD. Interleukin-10 G-1082A and C-819T polymorphisms as possible molecular markers of urothelial bladder cancer. Arch Med Res. 2009;40:97–102. doi: 10.1016/j.arcmed.2008.11.006. [DOI] [PubMed] [Google Scholar]
- Alonso R. Suarez A. Castro P. Lacave AJ. Gutierrez C. Influence of interleukin-10 genetic polymorphism on survival rates in melanoma patients with advanced disease. Melanoma Res. 2005;15:53–60. doi: 10.1097/00008390-200502000-00009. [DOI] [PubMed] [Google Scholar]
- Alpizar-Alpizar W. Perez-Perez GI. Une C. Cuenca P. Sierra R. Association of interleukin-1B and interleukin-1RN polymorphisms with gastric cancer in a high-risk population of Costa Rica. Clin Exp Med. 2005;5:169–176. doi: 10.1007/s10238-005-0082-3. [DOI] [PubMed] [Google Scholar]
- Amirzargar AA. Bagheri M. Ghavamzadeh A, et al. Cytokine gene polymorphism in Iranian patients with chronic myelogenous leukaemia. Int J Immunogenet. 2005;32:167–171. doi: 10.1111/j.1744-313X.2005.00502.x. [DOI] [PubMed] [Google Scholar]
- Ando T. Ishikawa T. Kato H, et al. Synergistic effect of HLA class II loci and cytokine gene polymorphisms on the risk of gastric cancer in Japanese patients with Helicobacter pylori infection. Int J Cancer. 2009;125:2595–2602. doi: 10.1002/ijc.24666. [DOI] [PubMed] [Google Scholar]
- Basturk B. Yavascaoglu I. Vuruskan H. Goral G. Oktay B. Oral HB. Cytokine gene polymorphisms as potential risk and protective factors in renal cell carcinoma. Cytokine. 2005;30:41–45. doi: 10.1016/j.cyto.2004.10.016. [DOI] [PubMed] [Google Scholar]
- Bei CH. Chou XQ. Ceng XY. Yang Y. Huang JM. Fan XJ. [Association of interleukin-10 gene polymorphism with hepatocellular carcinoma] Zhong Guo Gong Gong Wei Sheng. 2011;27:309–311. [Google Scholar]
- Bushley AW. Ferrell R. Mcduffie K. Terada KY. Carney ME. Thompson PJ, et al. Polymorphisms of interleukin (IL)-1alpha, IL-1beta, IL-6, IL-10, and IL-18 and the risk of ovarian cancer. Gynecol Oncol. 2004;95:672–679. doi: 10.1016/j.ygyno.2004.08.024. [DOI] [PubMed] [Google Scholar]
- Cacev T. Radosevic S. Krizanac S. Kapitanovic S. Influence of interleukin-8 and interleukin-10 on sporadic colon cancer development and progression. Carcinogenesis. 2008;29:1572–1580. doi: 10.1093/carcin/bgn164. [DOI] [PubMed] [Google Scholar]
- Castro Fa. Haimila K. Sareneva I, et al. Association of HLA-DRB1, interleukin-6 and cyclin D1 polymorphisms with cervical cancer in the Swedish population—A candidate gene approach. Int J Cancer. 2009;125:1851–1858. doi: 10.1002/ijc.24529. [DOI] [PubMed] [Google Scholar]
- Chen KF. Li B. Wei YG. Peng CJ. Interleukin-10 −819 promoter polymorphism associated with gastric cancer among Asians. J Int Med Res. 2010;38:1–8. doi: 10.1177/147323001003800101. [DOI] [PubMed] [Google Scholar]
- Chow MT. Moller A. Smyth MJ. Inflammation and immune surveillance in cancer. Semin Cancer Biol. 2012;22:23–32. doi: 10.1016/j.semcancer.2011.12.004. [DOI] [PubMed] [Google Scholar]
- Colakogullari M. Ulukaya E. Yilmaztepe Oral A, et al. The involvement of IL-10, IL-6, IFN-gamma, TNF-alpha and TGF-beta gene polymorphisms among Turkish lung cancer patients. Cell Biochem Funct. 2008;26:283–290. doi: 10.1002/cbf.1419. [DOI] [PubMed] [Google Scholar]
- Coussens LM. Werb Z. Inflammation and cancer. Nature. 2002;420:860–867. doi: 10.1038/nature01322. [DOI] [PMC free article] [PubMed] [Google Scholar]
- Cozar JM. Romero JM. Aptsiauri N, et al. High incidence of CTLA-4 AA (CT60) polymorphism in renal cell cancer. Hum Immunol. 2007;68:698–704. doi: 10.1016/j.humimm.2007.05.002. [DOI] [PubMed] [Google Scholar]
- Crivello A. Giacalone A. Vaglica M, et al. Regulatory cytokine gene polymorphisms and risk of colorectal carcinoma. Ann NY Acad Sci. 2006;1089:98–103. doi: 10.1196/annals.1386.002. [DOI] [PubMed] [Google Scholar]
- Crusius JB. Canzian F. Capella G, et al. Cytokine gene polymorphisms and the risk of adenocarcinoma of the stomach in the European prospective investigation into cancer and nutrition (EPIC-EURGAST) Ann Oncol. 2008;19:1894–1902. doi: 10.1093/annonc/mdn400. [DOI] [PubMed] [Google Scholar]
- Da Silva GN. Bacchi MM. Rainho CA. De Oliveira DE. Epstein-Barr virus infection and single nucleotide polymorphisms in the promoter region of interleukin 10 gene in patients with Hodgkin lymphoma. Arch Pathol Lab Med. 2007;131:1691–1696. doi: 10.5858/2007-131-1691-EVIASN. [DOI] [PubMed] [Google Scholar]
- De Oliveira WR. Rady PL. Grady J, et al. Polymorphisms of the interleukin 10 gene promoter in patients from Brazil with epidermodysplasia verruciformis. J Am Acad Dermatol. 2003;49:639–643. doi: 10.1067/s0190-9622(03)01567-6. [DOI] [PubMed] [Google Scholar]
- De Visser KE. Eichten A. Coussens LM. Paradoxical roles of the immune system during cancer development. Nat Rev Cancer. 2006;6:24–37. doi: 10.1038/nrc1782. [DOI] [PubMed] [Google Scholar]
- Dersimonian R. Laird N. Meta-analysis in clinical trials. Control Clin Trials. 1986;7:177–188. doi: 10.1016/0197-2456(86)90046-2. [DOI] [PubMed] [Google Scholar]
- Eder T. Mayer R. Langsenlehner U, et al. Interleukin-10 [ATA] promoter haplotype and prostate cancer risk: A population-based study. Eur J Cancer. 2007;43:472–475. doi: 10.1016/j.ejca.2006.11.003. [DOI] [PubMed] [Google Scholar]
- El-Omar EM. Rabkin CS. Gammon MD, et al. Increased risk of noncardia gastric cancer associated with proinflammatory cytokine gene polymorphisms. Gastroenterology. 2003;124:1193–1201. doi: 10.1016/s0016-5085(03)00157-4. [DOI] [PubMed] [Google Scholar]
- Eskdale J. Gallagher G. Verweij CL. Keijsers V. Westendorp RG. Huizinga TW. Interleukin 10 secretion in relation to human IL-10 locus haplotypes. Proc Natl Acad Sci USA. 1998;95:9465–9470. doi: 10.1073/pnas.95.16.9465. [DOI] [PMC free article] [PubMed] [Google Scholar]
- Faupel-Badger JM. Kidd LC. Albanes D. Virtamo J. Woodson K. Tangrea JA. Association of IL-10 polymorphisms with prostate cancer risk and grade of disease. Cancer Causes Control. 2008;19:119–124. doi: 10.1007/s10552-007-9077-6. [DOI] [PubMed] [Google Scholar]
- Festa F. Kumar R. Sanyal S, et al. Basal cell carcinoma and variants in genes coding for immune response, DNA repair, folate and iron metabolism. Mutat Res. 2005;574:105–111. doi: 10.1016/j.mrfmmm.2005.01.026. [DOI] [PubMed] [Google Scholar]
- Fillatreau S. Gray D. Anderton SM. Not always the bad guys: B cells as regulators of autoimmune pathology. Nat Rev Immunol. 2008;8:391–397. doi: 10.1038/nri2315. [DOI] [PubMed] [Google Scholar]
- Gonullu G. Basturk B. Evrensel T. Oral B. Gozkaman A. Manavoglu O. Association of breast cancer and cytokine gene polymorphism in Turkish women. Saudi Med J. 2007;28:1728–1733. [PubMed] [Google Scholar]
- Grivennikov SI. Greten FR. Karin M. Immunity, inflammation, and cancer. Cell. 2010;140:883–899. doi: 10.1016/j.cell.2010.01.025. [DOI] [PMC free article] [PubMed] [Google Scholar]
- Gunter MJ. Canzian F. Landi S. Chanock SJ. Sinha R. Rothman N. Inflammation-related gene polymorphisms and colorectal adenoma. Cancer Epidemiol Biomarkers Prev. 2006;15:1126–1131. doi: 10.1158/1055-9965.EPI-06-0042. [DOI] [PubMed] [Google Scholar]
- Guzowski D. Chandrasekaran A. Gawel C, et al. Analysis of single nucleotide polymorphisms in the promoter region of interleukin-10 by denaturing high-performance liquid chromatography. J Biomol Tech. 2005;16:154–166. [PMC free article] [PubMed] [Google Scholar]
- He XP. Wang LL. Zhao H. Wu D. Tang HD. Cao FL. [Association of interleukin-10 polymorphisms with susceptibility to ovarian cancer in Chinese Han population.] Zhong Guo You Sheng Yu Yi Chuan Za Zhi. 2008;16:37–38. [Google Scholar]
- Hellmig S. Bartscht T. Fischbach W. Folsch UR. Schreiber S. Interleukin-10 (-819 C/T) and TNF-A (-308 G/A) as risk factors for H. pylori-associated gastric MALT-lymphoma. Dig Dis Sci. 2008;53:2007–2008. doi: 10.1007/s10620-008-0231-0. [DOI] [PubMed] [Google Scholar]
- Higgins JP. Thompson SG. Deeks JJ. Altman DG. Measuring inconsistency in meta-analyses. BMJ. 2003;327:557–560. doi: 10.1136/bmj.327.7414.557. [DOI] [PMC free article] [PubMed] [Google Scholar]
- Howell WM. Turner SJ. Bateman AA. Theaker JM. IL-10 promoter polymorphisms influence tumour development in cutaneous malignant melanoma. Genes Immun. 2001;2:25–31. doi: 10.1038/sj.gene.6363726. [DOI] [PubMed] [Google Scholar]
- Hubner RA. Muir KR. Liu JF. Logan RF. Grainge MJ. Houlston RS. Polymorphisms in PTGS1, PTGS2 and IL-10 do not influence colorectal adenoma recurrence in the context of a randomized aspirin intervention trial. Int J Cancer. 2007;121:2001–2004. doi: 10.1002/ijc.22942. [DOI] [PubMed] [Google Scholar]
- Ioana Braicu E. Mustea A. Toliat MR, et al. Polymorphism of IL-1alpha, IL-1beta and IL-10 in patients with advanced ovarian cancer: Results of a prospective study with 147 patients. Gynecol Oncol. 2007;104:680–685. doi: 10.1016/j.ygyno.2006.10.014. [DOI] [PubMed] [Google Scholar]
- Ioannidis JP. Boffetta P. Little J, et al. Assessment of cumulative evidence on genetic associations: Interim guidelines. Int J Epidemiol. 2008;37:120–132. doi: 10.1093/ije/dym159. [DOI] [PubMed] [Google Scholar]
- Ioannidis JP. Patsopoulos NA. Evangelou E. Uncertainty in heterogeneity estimates in meta-analyses. BMJ. 2007;335:914–916. doi: 10.1136/bmj.39343.408449.80. [DOI] [PMC free article] [PubMed] [Google Scholar]
- Kamangar F. Abnet CC. Hutchinson AA, et al. Polymorphisms in inflammation-related genes and risk of gastric cancer (Finland) Cancer Causes Control. 2006;17:117–125. doi: 10.1007/s10552-005-0439-7. [DOI] [PubMed] [Google Scholar]
- Kang JM. Kim N. Lee DH, et al. The effects of genetic polymorphisms of IL-6, IL-8, and IL-10 on Helicobacter pylori-induced gastroduodenal diseases in Korea. J Clin Gastroenterol. 2009;43:420–428. doi: 10.1097/MCG.0b013e318178d1d3. [DOI] [PubMed] [Google Scholar]
- Kesarwani P. Ahirwar DK. Mandhani A, et al. IL-10 −1082 G>A: A risk for prostate cancer but may be protective against progression of prostate cancer in North Indian cohort. World J Urol. 2009;27:389–396. doi: 10.1007/s00345-008-0361-1. [DOI] [PubMed] [Google Scholar]
- Kim J. Cho YA. Choi IJ, et al. Effects of interleukin-10 polymorphisms, Helicobacter pylori infection, and smoking on the risk of noncardia gastric cancer. PLoS One. 2012:7. doi: 10.1371/journal.pone.0029643. [DOI] [PMC free article] [PubMed] [Google Scholar]
- Kong F. Liu J. Liu Y. Song B. Wang H. Liu W. Association of interleukin-10 gene polymorphisms with breast cancer in a Chinese population. J Exp Clin Cancer Res. 2010;29:72. doi: 10.1186/1756-9966-29-72. [DOI] [PMC free article] [PubMed] [Google Scholar]
- Lan Q. Zheng T. Rothman N, et al. Cytokine polymorphisms in the Th1/Th2 pathway and susceptibility to non-Hodgkin lymphoma. Blood. 2006;107:4101–4108. doi: 10.1182/blood-2005-10-4160. [DOI] [PMC free article] [PubMed] [Google Scholar]
- Langsenlehner U. Krippl P. Renner W, et al. Interleukin-10 promoter polymorphism is associated with decreased breast cancer risk. Breast Cancer Res Treat. 2005;90:113–115. doi: 10.1007/s10549-004-3607-7. [DOI] [PubMed] [Google Scholar]
- Lech-Maranda E. Baseggio L. Charlot C, et al. Genetic polymorphisms in the proximal IL-10 promoter and susceptibility to non-Hodgkin lymphoma. Leuk Lymphoma. 2007;48:2235–2238. doi: 10.1080/10428190701615926. [DOI] [PubMed] [Google Scholar]
- Lee JY. Kim HY. Kim KH, et al. Association of polymorphism of IL-10 and TNF-A genes with gastric cancer in Korea. Cancer Lett. 2005;225:207–214. doi: 10.1016/j.canlet.2004.11.028. [DOI] [PubMed] [Google Scholar]
- Leon A. Leon V. Garcia J. Urrutia M. Interleukin gene polymorphism in patients with prostate cancer. Tissue Antigens. 2010;75:637. [Google Scholar]
- Liang L. Zhao YL. Yue J, et al. Interleukin-10 gene promoter polymorphisms and their protein production in pleural fluid in patients with tuberculosis. FEMS Immunol Med Microbiol. 2011;62:84–90. doi: 10.1111/j.1574-695X.2011.00791.x. [DOI] [PubMed] [Google Scholar]
- Liu J. Song B. Bai X, et al. Association of genetic polymorphisms in the interleukin-10 promoter with risk of prostate cancer in Chinese. BMC Cancer. 2010a;10:456. doi: 10.1186/1471-2407-10-456. [DOI] [PMC free article] [PubMed] [Google Scholar]
- Liu J. Song B. Wang JL. Li ZJ. Li WH. Wang ZH. Polymorphisms of interleukin-10 promoter are not associated with prognosis of advanced gastric cancer. World J Gastroenterol. 2011;17:1362–1367. doi: 10.3748/wjg.v17.i10.1362. [DOI] [PMC free article] [PubMed] [Google Scholar]
- Liu JJ. Gao YT. Du Z, et al. Relationship between IL-10 gene promoter polymorphisms and outcome of hepatitis B virus infection. World Chin J Digestol. 2010b;18:1656–1663. [Google Scholar]
- Macarthur M. Sharp L. Hold GL. Little J. El-Omar EM. The role of cytokine gene polymorphisms in colorectal cancer and their interaction with aspirin use in the northeast of Scotland. Cancer Epidemiol Biomarkers Prev. 2005;14:1613–1618. doi: 10.1158/1055-9965.EPI-04-0878. [DOI] [PubMed] [Google Scholar]
- Martinez-Escribano JA. Moya-Quiles MR. Muro M, et al. Interleukin-10, interleukin-6 and interferon-gamma gene polymorphisms in melanoma patients. Melanoma Res. 2002;12:465–469. doi: 10.1097/00008390-200209000-00008. [DOI] [PubMed] [Google Scholar]
- Mazur G. Bogunia-Kubik K. Wrobel T, et al. IL-6 and IL-10 promoter gene polymorphisms do not associate with the susceptibility for multiple myeloma. Immunol Lett. 2005;96:241–246. doi: 10.1016/j.imlet.2004.08.015. [DOI] [PubMed] [Google Scholar]
- Michaud DS. Daugherty SE. Berndt SI, et al. Genetic polymorphisms of interleukin-1B (IL-1B), IL-6, IL-8, and IL-10 and risk of prostate cancer. Cancer Res. 2006;66:4525–4530. doi: 10.1158/0008-5472.CAN-05-3987. [DOI] [PubMed] [Google Scholar]
- Migita K. Miyazoe S. Maeda Y, et al. Cytokine gene polymorphisms in Japanese patients with hepatitis B virus infection—Association between TGF-beta1 polymorphisms and hepatocellular carcinoma. J Hepatol. 2005;42:505–510. doi: 10.1016/j.jhep.2004.11.026. [DOI] [PubMed] [Google Scholar]
- Moore KW. De Waal Malefyt R. Coffman RL. O'garra A. Interleukin-10 and the interleukin-10 receptor. Annu Rev Immunol. 2001;19:683–765. doi: 10.1146/annurev.immunol.19.1.683. [DOI] [PubMed] [Google Scholar]
- Munro LR. Johnston PW. Marshall NA, et al. Polymorphisms in the interleukin-10 and interferon gamma genes in Hodgkin lymphoma. Leuk Lymphoma. 2003;44:2083–2088. doi: 10.1080/1042819031000119316. [DOI] [PubMed] [Google Scholar]
- Nieters A. Yuan JM. Sun CL, et al. Effect of cytokine genotypes on the hepatitis B virus-hepatocellular carcinoma association. Cancer. 2005;103:740–748. doi: 10.1002/cncr.20842. [DOI] [PubMed] [Google Scholar]
- O'garra A. Vieira P. T(H)1 cells control themselves by producing interleukin-10. Nat Rev Immunol. 2007;7:425–428. doi: 10.1038/nri2097. [DOI] [PubMed] [Google Scholar]
- Persson C. Canedo P. Machado JC. El-Omar EM. Forman D. Polymorphisms in inflammatory response genes and their association with gastric cancer: A HuGE systematic review and meta-analyses. Am J Epidemiol. 2011;173:259–270. doi: 10.1093/aje/kwq370. [DOI] [PMC free article] [PubMed] [Google Scholar]
- Pharoah PD. Dunning AM. Ponder BA. Easton DF. Association studies for finding cancer-susceptibility genetic variants. Nat Rev Cancer. 2004;4:850–860. doi: 10.1038/nrc1476. [DOI] [PubMed] [Google Scholar]
- Pharoah PD. Tyrer J. Dunning AM. Easton DF. Ponder BA. Association between common variation in 120 candidate genes and breast cancer risk. PLoS Genet. 2007;3:e42. doi: 10.1371/journal.pgen.0030042. [DOI] [PMC free article] [PubMed] [Google Scholar]
- Pogoda TV. Marsheva OV. Kostin PA, et al. Association of haplotypes of interleukin-10 gene with the risk of cancer. Bull Exp Biol Med. 2007;144:385–389. doi: 10.1007/s10517-007-0339-9. [DOI] [PubMed] [Google Scholar]
- Pratesi C. Bortolin MT. Bidoli E, et al. Interleukin-10 and interleukin-18 promoter polymorphisms in an Italian cohort of patients with undifferentiated carcinoma of nasopharyngeal type. Cancer Immunol Immunother. 2006;55:23–30. doi: 10.1007/s00262-005-0688-z. [DOI] [PMC free article] [PubMed] [Google Scholar]
- Purdue MP. Lan Q. Kricker A. Grulich AE. Vajdic Cm. Turner J, et al. Polymorphisms in immune function genes and risk of non-Hodgkin lymphoma: Findings from the New South Wales non-Hodgkin Lymphoma Study. Carcinogenesis. 2007;28:704–712. doi: 10.1093/carcin/bgl200. [DOI] [PubMed] [Google Scholar]
- Roh JW. Kim MH. Seo SS, et al. Interleukin-10 promoter polymorphisms and cervical cancer risk in Korean women. Cancer Lett. 2002;184:57–63. doi: 10.1016/s0304-3835(02)00193-3. [DOI] [PubMed] [Google Scholar]
- Ryan JJ. Kashyap M. Bailey D, et al. Mast cell homeostasis: A fundamental aspect of allergic disease. Crit Rev Immunol. 2007;27:15–32. doi: 10.1615/critrevimmunol.v27.i1.20. [DOI] [PubMed] [Google Scholar]
- Savage SA. Abnet CC. Haque K, et al. Polymorphisms in interleukin −2, −6, and −10 are not associated with gastric cardia or esophageal cancer in a high-risk Chinese population. Cancer Epidemiol Biomarkers Prev. 2004;13:1547–1549. [PubMed] [Google Scholar]
- Seifart C. Plagens A. Dempfle A, et al. TNF-alpha, TNF-beta, IL-6, and IL-10 polymorphisms in patients with lung cancer. Dis Markers. 2005;21:157–165. doi: 10.1155/2005/707131. [DOI] [PMC free article] [PubMed] [Google Scholar]
- Shao N. Xu B. Mi YY. Hua LX. IL-10 polymorphisms and prostate cancer risk: A meta-analysis. Prostate Cancer Prostatic Dis. 2011;14:129–135. doi: 10.1038/pcan.2011.6. [DOI] [PubMed] [Google Scholar]
- Shih CM. Lee YL. Chiou HL, et al. The involvement of genetic polymorphism of IL-10 promoter in non-small cell lung cancer. Lung Cancer. 2005;50:291–297. doi: 10.1016/j.lungcan.2005.07.007. [DOI] [PubMed] [Google Scholar]
- Shin HD. Park BL. Kim LH, et al. Interleukin 10 haplotype associated with increased risk of hepatocellular carcinoma. Hum Mol Genet. 2003;12:901–906. doi: 10.1093/hmg/ddg104. [DOI] [PubMed] [Google Scholar]
- Sicinschi LA. Lopez-Carrillo L. Camargo MC, et al. Gastric cancer risk in a Mexican population: Role of Helicobacter pylori CagA positive infection and polymorphisms in interleukin-1 and −10 genes. Int J Cancer. 2006;118:649–657. doi: 10.1002/ijc.21364. [DOI] [PubMed] [Google Scholar]
- Singh H. Jain M. Sachan R. Mittal B. Association of TNFA (-308G>A) and IL-10 (-819C>T) promoter polymorphisms with risk of cervical cancer. Int J Gynecol Cancer. 2009;19:1190–1194. doi: 10.1111/IGC.0b013e3181a3a3af. [DOI] [PubMed] [Google Scholar]
- Spits H. De Waal Malefyt R. Functional characterization of human IL-10. Int Arch Allergy Immunol. 1992;99:8–15. doi: 10.1159/000236329. [DOI] [PubMed] [Google Scholar]
- Sterne JA. Gavaghan D. Egger M. Publication and related bias in meta-analysis: Power of statistical tests and prevalence in the literature. J Clin Epidemiol. 2000;53:1119–1129. doi: 10.1016/s0895-4356(00)00242-0. [DOI] [PubMed] [Google Scholar]
- Su SP. Yang ZB. Tian YL. Relationship between polymorphisms of IL-1(beta)-31, IL-10-819 and TNF-(alpha)-1031 genes and susceptibilities to H. pylori infection-associated gastric ulcer and cancer. Chin J Biol. 2010;23:517–520. [Google Scholar]
- Sugimoto M. Furuta T. Shirai N, et al. Effects of interleukin-10 gene polymorphism on the development of gastric cancer and peptic ulcer in Japanese subjects. J Gastroenterol Hepatol. 2007;22:1443–1449. doi: 10.1111/j.1440-1746.2006.04613.x. [DOI] [PubMed] [Google Scholar]
- Tseng LH. Lin MT. Shau WY, et al. Correlation of interleukin-10 gene haplotype with hepatocellular carcinoma in Taiwan. Tissue Antigens. 2006;67:127–133. doi: 10.1111/j.1399-0039.2006.00536.x. [DOI] [PubMed] [Google Scholar]
- Turner DMm. Williams DM. Sankaran D. Lazarus M. Sinnott PJ. Hutchinson IV. An investigation of polymorphism in the interleukin-10 gene promoter. Eur J Immunogenet. 1997;24:1–8. doi: 10.1111/j.1365-2370.1997.tb00001.x. [DOI] [PubMed] [Google Scholar]
- Vancleave TT. Moore JH. Benford ML, et al. Interaction among variant vascular endothelial growth factor (VEGF) and its receptor in relation to prostate cancer risk. Prostate. 2010;70:341–352. doi: 10.1002/pros.21067. [DOI] [PMC free article] [PubMed] [Google Scholar]
- Vishnoi M. Choudhuri G. Mittal B. Is IL-10 −819C/T gene polymorphism modulating the risk of gallbladder disease in North Indian population? J Gastrointest Cancer. 2007;38:46–51. doi: 10.1007/s12029-008-9016-0. [DOI] [PubMed] [Google Scholar]
- Vogel U. Christensen J. Dybdahl M, et al. Prospective study of interaction between alcohol, NSAID use and polymorphisms in genes involved in the inflammatory response in relation to risk of colorectal cancer. Mutat Res. 2007;624:88–100. doi: 10.1016/j.mrfmmm.2007.04.006. [DOI] [PubMed] [Google Scholar]
- Vogel U. Christensen J. Wallin H, et al. Polymorphisms in genes involved in the inflammatory response and interaction with NSAID use or smoking in relation to lung cancer risk in a prospective study. Mutat Res. 2008;639:89–100. doi: 10.1016/j.mrfmmm.2007.11.004. [DOI] [PubMed] [Google Scholar]
- Wang MH. Helzlsouer KJ. Smith MW, et al. Association of IL10 and other immune response- and obesity-related genes with prostate cancer in CLUE II. Prostate. 2009;69:874–885. doi: 10.1002/pros.20933. [DOI] [PMC free article] [PubMed] [Google Scholar]
- Wei YG. Liu F. Li B, et al. Interleukin-10 gene polymorphisms and hepatocellular carcinoma susceptibility: A meta-analysis. World J Gastroenterol. 2011;17:3941–3947. doi: 10.3748/wjg.v17.i34.3941. [DOI] [PMC free article] [PubMed] [Google Scholar]
- Wei YS. Kuang XH. Zhu YH, et al. Interleukin-10 gene promoter polymorphisms and the risk of nasopharyngeal carcinoma. Tissue Antigens. 2007;70:12–17. doi: 10.1111/j.1399-0039.2007.00806.x. [DOI] [PubMed] [Google Scholar]
- Williams LM. Ricchetti G. Sarma U. Smallie T. Foxwell BM. Interleukin-10 suppression of myeloid cell activation—A continuing puzzle. Immunology. 2004;113:281–292. doi: 10.1111/j.1365-2567.2004.01988.x. [DOI] [PMC free article] [PubMed] [Google Scholar]
- Wu MS. Wu CY. Chen CJ. Lin MT. Shun CT. Lin JT. Interleukin-10 genotypes associate with the risk of gastric carcinoma in Taiwanese Chinese. Int J Cancer. 2003;104:617–623. doi: 10.1002/ijc.10987. [DOI] [PubMed] [Google Scholar]
- Xiao H. Li C. Jiang Y. Li R. Xia B. [The relationship among IL-10, TNF gene polymorphisms, Helicobacter pylori infection and gastroduodenal diseases in Hubei Han ethnic] Zhonghua Nei Ke Za Zhi. 2009;48:552–556. [PubMed] [Google Scholar]
- Xue H. Lin B. An J. Zhu Y. Huang G. Interleukin-10-819 promoter polymorphism in association with gastric cancer risk. BMC Cancer. 2012;12:102. doi: 10.1186/1471-2407-12-102. [DOI] [PMC free article] [PubMed] [Google Scholar]
- Yao JG. Gao LB. Liu YG. Li J. Pang GF. Genetic variation in interleukin-10 gene and risk of oral cancer. Clin Chim Acta. 2008;388:84–88. doi: 10.1016/j.cca.2007.10.012. [DOI] [PubMed] [Google Scholar]
- Zabaleta J. Lin HY. Sierra RA, et al. Interactions of cytokine gene polymorphisms in prostate cancer risk. Carcinogenesis. 2008;29:573–578. doi: 10.1093/carcin/bgm277. [DOI] [PubMed] [Google Scholar]
- Zambon CF. Basso D. Navaglia F, et al. Pro- and anti-inflammatory cytokines gene polymorphisms and Helicobacter pylori infection: Interactions influence outcome. Cytokine. 2005;29:141–152. doi: 10.1016/j.cyto.2004.10.013. [DOI] [PubMed] [Google Scholar]
- Zeng X. Li Y. Liu T. Zhang J. Diverse H. pylori strains, IL-10 promoter polymorphisms with high morbidity of gastric cancer in Hexi area of Gansu Province, China. Mol Cell Biochem. 2012;361:241–248. doi: 10.1007/s11010-011-1149-y. [DOI] [PubMed] [Google Scholar]
- Zhang Z. Liu W. Jia X. Gao Y. Hemminki K. Lindholm B. Use of pyrosequencing to detect clinically relevant polymorphisms of genes in basal cell carcinoma. Clin Chim Acta. 2004;342:137–143. doi: 10.1016/j.cccn.2003.12.010. [DOI] [PubMed] [Google Scholar]
- Zoodsma M. Nolte IM. Schipper M, et al. Interleukin-10 and Fas polymorphisms and susceptibility for (pre)neoplastic cervical disease. Int J Gynecol Cancer. 2005;15(Suppl 3):282–290. doi: 10.1111/j.1525-1438.2005.00433.x. [DOI] [PubMed] [Google Scholar]
- Zou YF. Wang F. Feng XL, et al. Lack of association of IL-10 gene polymorphisms with prostate cancer: Evidence from 11,581 subjects. Eur J Cancer. 2011;47:1072–1079. doi: 10.1016/j.ejca.2010.11.034. [DOI] [PubMed] [Google Scholar]
Associated Data
This section collects any data citations, data availability statements, or supplementary materials included in this article.