

Abstract
Pulmonary hypertension (PH) and cancer pathology share growth factor- and MAPK stress-mediated signaling pathways resulting in endothelial and smooth muscle cell dysfunction and angioproliferative vasculopathy. In this study, we assessed sorafenib, an antineoplastic agent and inhibitor of multiple kinases important in angiogenesis [VEGF receptor (VEGFR)-1–3, PDGF receptor (PDGFR)-β, Raf-1 kinase] as a potential PH therapy. Two PH rat models were used: a conventional hypoxia-induced PH model and an augmented PH model combining dual VEGFR-1 and -2 inhibition (SU-5416, single 20 mg/kg injection) with hypoxia. In addition to normoxia-exposed control animals, four groups were maintained at 10% inspired O2 fraction for 3.5 wk (hypoxia/vehicle, hypoxia/SU-5416, hypoxia/sorafenib, and hypoxia/SU-5416/sorafenib). Compared with normoxic control animals, rats exposed to hypoxia/SU-5416 developed hemodynamic and histological evidence of severe PH while rats exposed to hypoxia alone displayed only mild elevations in hemodynamic values (pulmonary vascular and right ventricular pressures). Sorafenib treatment (daily gavage, 2.5 mg/kg) prevented hemodynamic changes and demonstrated dramatic attenuation of PH-associated vascular remodeling. Compared with normoxic control rats, expression profiling (Affymetrix platform) of lung RNA obtained from hypoxia [false discovery rate (FDR) 6.5%]- and hypoxia/SU-5416 (FDR 1.6%)-challenged rats yielded 1,019 and 465 differentially regulated genes (fold change >1.4), respectively. A novel molecular signature consisting of 38 differentially expressed genes between hypoxia/SU-5416 and hypoxia/SU-5416/sorafenib (FDR 6.7%) was validated by either real-time RT-PCR or immunoblotting. Finally, immunoblotting studies confirmed the upregulation of the MAPK cascade in both PH models, which was abolished by sorafenib. In summary, sorafenib represents a novel potential treatment for severe PH with the MAPK cascade a potential canonical target.
Keywords: microarrays, SU-5416, bioinformatics
Pulmonary arterial hypertension (PH) is characterized by a progressive increase in pulmonary arterial pressure (PAP) with a mean pressure of >25 mmHg at rest or 30 mmHg during exercise (43), with severe PH exhibiting PAP values >50 mmHg (2, 59). Severe PH manifests as both an acute and a chronic presentation, with chronic PH leading to progressive right ventricular (RV) systolic pressure overload and ventricular dilatation, resulting in gradual RV dysfunction, heart failure, and death (21). Idiopathic PH has an estimated annual incidence of 1–2 per million (1) with mutations of the bone morphogenetic protein receptor type 2 gene (BMPR2) identified in ~50% of cases of familial PH (7). However, because only 20% of persons with a BMPR2 mutation develop PH (32), external stimuli, coupled with a susceptible genetic profile, likely contribute to the majority of PH cases (5, 9, 17, 43).
Currently several agents have proven efficacy in PH: anticoagulants, calcium channel blockers, prostanoids, endothelin receptor antagonists, and phosphodiesterase-5 inhibitors (2). Despite advances with new therapeutics, PH remains a devastating disease, because most approved therapies are expensive, fail to reverse vascular remodeling, and consequently offer only limited improvement in exercise capacity. Thus there is a strong rationale to consider novel targeted therapies related to key pathogenic mechanisms (30). The multikinase inhibitor sorafenib, an FDA-approved treatment for renal cell and hepatocellular cancer (8, 27), affects multiple targets including Raf (52, 53, 62), ERK, PDGF receptor (PDGFR)-β, and VEGF receptor (VEGFR)-1–3 (63) kinases implicated in angiogenesis, proliferation, inhibition of apoptosis, and development of malignancy (34, 37, 53, 62). Given the increasing awareness of the involvement of these processes in the vascular remodeling of chronic PH, we hypothesized that sorafenib could inhibit the neoplastic-like vasculopathy (54) and angiogenic dysregulation characteristic of severe PH (4, 56).
In the present study, we have employed two rodent models of PH that differ in the severity of the vascular abnormalities. Our prior work (17) using a hypoxia-induced rodent PH model demonstrated the vascular-protective benefit of statin treatment. However, as hypoxia alone produces only modest and reversible PH (17, 33, 54), we have now implemented a well-characterized model of severe PH that adds to hypoxia administration of SU-5416, an inhibitor of VEGFR-1 and -2, and more closely mimics the histological abnormalities of human PH (54). Applying both rodent PH models, we investigated the prophylactic effects of sorafenib and used whole genome microarray profiling and bioinformatics to identify novel candidate genes involved in the development of PH and in the attenuation of PH by sorafenib.
METHODS
Reagents
Unless otherwise specified, all reagents were obtained from Sigma (St. Louis, MO). Reagents for SDS-PAGE electrophoresis were purchased from Bio-Rad (Richmond, CA), Immobilon-P transfer membranes from Millipore (Bedford, MA). Rabbit anti-transforming growth factor (TGF)-β3 antiserum was purchased from Santa Cruz Biotechnology (Santa Cruz, CA). Mouse anti-phospho (Tyr951) VEGFR-2, rabbit anti-VEGF-2, rabbit anti-phospho (Ser217/221) MEK1/2, rabbit anti-MEK1/2, rabbit anti-phospho (Thr183/Tyr185) ERK, rabbit anti-ERK (p42/44 MAPK), mouse anti-phospho (Thr180/Tyr182) p38 MAPK, and rabbit anti-p38 MAPK antibodies were all purchased from Cell Signaling Technologies (Boston, MA). Mouse anti-C1q antibody was purchased from Novus Biologicals (Littleton, CO). Mouse anti-Ki-67 antibody was purchased from Dako (Carpinteria, CA). Rabbit anti-cleaved caspase-3 antibody was purchased from Biocare Medical (Concord, CA). Rabbit anti-von Willebrand factor (vWF) antibody was purchased from Abcam (Cambridge, MA) Secondary horseradish peroxidase (HRP)-labeled antibodies were purchased from Amersham Biosciences (Piscataway, NJ). Sorafenib tosylate tablets were supplied by Bayer (West Haven, CT).
Experimental protocols
All experimental protocols were approved by the Animal Care and Use Committee of the University of Chicago. Adult male Dahl salt-sensitive (SS) rats (250–300 g) utilized for all experiments were obtained from Charles Rivers Laboratories (Wilmington, MA). Five groups of rats were studied: normoxia, hypoxia, hypoxia with SU-5416, hypoxia with sorafenib treatment, and hypoxia/SU-5416 with sorafenib treatment. Animals were housed in a chamber (Plexiglas) open to room air (normoxia) or to 10% inspired O2 fraction for 3.5 wk (for the 4 hypoxia-exposed conditions). Chronic hypoxia was validated via a Pro:Ox sensor (BioSpherix, Redfield, NY) attached to the chamber after administration of nitrogen to reduce the fractional concentration of O2 in the inspired gas. Animals had free access to food and water throughout the duration of the experiments. At the study onset, rats in the two SU-5416 groups received a single subcutaneous injection of SU-5416 (20 mg/kg) as previously described (54). Rats in the treatment groups received a daily oral gavage of sorafenib at a dose of 2.5 mg/kg. Stock sorafenib solutions were prepared every 3 days, in EL-ethanol (50:50; Sigma Cremophor EL, 95% ethyl alcohol) at a final concentration of 4 mg/ml, protected from light exposure, and stored at room temperature. Final dosing solutions were prepared on the day of use by dilution of the stock solution to 1 mg/ml with water, and the control groups received vehicle.
Hemodynamic and PH severity measurements
Assessment of RV systolic pressure (RVP) and PAP were achieved in anesthetized animals (125 mg/kg ketamine and 1.25 mg/kg acepromazine mixture) injected intraperitoneally. These rats were previously intubated (14-gauge angiocath) and mechanically ventilated (tidal volume 1.5 ml, respiratory rate 76 breaths/min) with a Harvard Apparatus ventilator (Holliston, MA). The thorax was shaved, and a midincision was made to expose the left internal carotid artery for monitoring of systemic systolic blood pressures. An 18-gauge catheter was inserted into the pulmonary artery (PA) and into the RV, connected to a pressure transducer and monitor/terminal (HP 78534C). After pressures were recorded, animals were euthanized by exsanguination, and the heart and lungs were removed en bloc. RV hypertrophy (RVH) was determined by the ratio of the weight of the RV wall divided by the sum of the weights of the left ventricle and the septum as previously reported (17). Lungs were perfused with PBS, removed, and frozen in liquid nitrogen for microarray and Western blot analyses as well as being immersed in 10% paraformaldehyde for subsequent histopathological analysis.
Histopathological analysis
Formalin-embedded tissues from each animal were cut in paraffin sections (5 μm thick) and mounted onto slides. Lung sections were stained with hematoxylin and eosin (H & E) for assessment of vascular remodeling with the Heath-Edwards grading system as described previously (42). In this system, grade I represents hypertrophy of the media of muscular PAs and extension of smooth muscle into the wall of pulmonary arterioles. Grade II represents muscle hypertrophy plus proliferation of intimal cells in arterioles and small muscular arteries. Grade III represents muscle hypertrophy plus subendothelial fibrosis and vessel lumen obliteration. In grade IV, remodeling contains evidence of plexiform lesions with smooth muscle hypertrophy less apparent, but with progressive dilatation of small arteries, especially those near vessels with intimal fibrous occlusion. Grade V is associated with plexiform and angiomatoid lesions plus intra-alveolar infiltration. Finally, grade VI exhibits necrotizing arteritis with thrombosis.
RNA isolation for microarray analysis
Lung mRNA was isolated from whole rodent lung tissue for expression profiling data as we have described previously (39), and Affymetrix GeneChip Expression Analysis Manual protocols (Affymetrix, Santa Clara, CA) were followed as recommended by the manufacturer. The signal intensity fluorescent images produced during Affymetrix GeneChip Rat Genome 230 2.0 Array hybridizations were read with the Hewlett-Packard GeneArray Scanner G2500A and converted into GeneChip Cell (CEL) files by GCOS software (Affymetrix).
Expression data filtering, analysis, and visualization
Data generated in this study may be accessed via the GEO database (http://www.ncbi.nlm.nih.gov/geo/) with the series accession number GSE 8134. The original CEL files were read into the R software (55) and normalized with the GC Robust Multichip Average (GCRMA) (64) over the whole set of arrays unless otherwise specified. Chip and experimental quality were evaluated with the Bioconductor package (40), and RNA integrity was confirmed with the Affymetrix RNA degradation controls (GAPDH and actin 3′-5′ratios <3) as well as an RNA degradation plot. The global gene expression profile analysis of the transformed expression data was conducted with significance analysis of microarrays (SAM) for EXCEL after extraction of normalized data from R (57). The false discovery rate (FDR) of the list of significantly differentially expressed genes in SAM is a discontinuous (nonlinear) function of several parameters. In the specific arrays analyzed in this study as well as in studies conducted previously (26), the observed FDR often varied discontinuously from a few percent to well over 50% with small changes in SAM parameters (data not shown). Therefore, a single preset FDR across the analyses was not achievable. In each SAM analysis, we systematically adjusted these SAM parameters in order to obtain the larger list of genes for a FDR between 1% and 10%. With this approach, significantly differentially regulated genes were identified in the following pairwise comparison sets: normoxia and hypoxia, normoxia and hypoxia/SU-5416, and finally, hypoxia/SU-5416 and hypoxia/SU-5416/sorafenib (specific parameters, FDRs, and analysis results can be found in Supplemental Tables S1A, S1B, and S1C).1 The hypoxia/SU-5416 vs. hypoxia/SU-5416/sorafenib pair comparison was performed with samples from the two groups normalized in isolation from others in the experiment.
Significantly differentially expressed transcripts between hypoxia/SU-5416 and hypoxia/SU-5416/sorafenib were visualized as a heat map in R. Transcripts without an official annotated gene name (“NA”) were referenced against the NetAffx tool (www.affymetrix.com/netaffx) and updated as appropriate. This process led to the replacement of one NA with an official gene name (Gja7) and several “Transcribed locus” annotations in Fig. 7 (original figure, Supplemental Fig. S1).
Fig. 7.

Heat map and gene ontology (GO) depiction of sorafenib-driven differentially regulated transcripts in the hypoxia-SU-5416 PH model. Microarray analysis of Dahl SS rat lungs (n = 4 chips/group) at 3.5 wk revealed 38 differentially regulated transcripts between the hypoxia/SU-5416 groups with and without sorafenib intervention. These transcripts were then clustered with a conventional heat map analysis, with red blocks representing upregulation and green blocks representing down-regulated expression of the relative transcript. The transcript names were manually highlighted to show the significantly enriched GO classes that fall into the 6 most highly represented general categories and GO superclasses: “developmental processes,” “muscle development and regulation of muscle contraction,” “defense response/immune system,” “cell proliferation,” “cell differentiation,” and “cellular metabolic processes/metabolism.” Transcripts marked with a star were found significant across all 3 comparison pairs (see Fig. 8).
Gene ontology (GO) analyses were performed on three sets of gene expression comparisons, normoxia vs. hypoxia (Supplemental Table S2A), normoxia vs. hypoxia/SU-5416 (Supplemental Table S2B), and hypoxia/SU-5416 vs. hypoxia/SU-5416/sorafenib (Supplemental Table S2C), with Onto-Express (23) to link candidate genes to biologically relevant processes with an FDR-adjusted cutoff significance value of P < 0.05. We analyzed and identified the significantly overrepresented biological processes (significant GO terms) in the three data sets. We next determined the relationships between these GO terms, retrieved from the GO ontology files (http://www.geneontology.org/GO.downloads.ontology.shtml). The relationships between significant GO terms were defined, counted, and compared across the three sets in three ways for each of the six most highly represented overarching GO functional classes (Supplemental Table S3) originally found in the hypoxia/SU-5416 vs. hypoxia/SU-5416/sorafenib comparison set. These three frames of comparison included 1) identical GO terms, where a GO term representing the same biological process is found in more than one comparison set; 2) related GO terms, where two (or more) GO terms found in more than one comparison set are associated with one another through hierarchical ancestry in the structure of the GO either as an ancestor or as a descendant (e.g., regulation of cell proliferation is the ancestor of positive regulation of epithelial cells in Supplemental Fig. S2); and 3) unrelated GO terms, two (or more) GO terms found in more than one comparison set that do not possess ancestor-descendant relationships (e.g., negative regulation of fibroblast proliferation is neither an ancestor nor a descendant of the positive regulation of epithelial cell proliferation in Supplemental Fig. S2).
The relevance of newly identified candidate genes to PH was then evaluated with PubMatrix (http://pubmatrix.grc.nia.nih.gov), the automated biomedical literature search engine (3) that measures the co-occurrence of two keywords in the NCBI literature search service PubMed. In our analysis of PubMatrix-selected citations of journal articles, we searched each identified candidate gene against a series of keywords including “pulmonary hypertension,” “cell proliferation,” “hypoxia,” “vascular remodeling,” “cancer,” and “angiogenesis.”
Comparison of microarray study results to published PH array data
We also compared our microarray data against available in vivo lung tissue-based PH microarray studies reported in PubMed, representing work across a variety of species (human, mouse, rat) (10, 11, 18, 29). For example, one previous study utilized for comparison included significantly differentially expressed genes between normoxia and hypoxia conditions for male Dahl SS rats (29). A list of significantly differentially expressed genes in Homo sapiens diagnosed with PH was taken from Table 3 and Supplemental Table S1 from a study by Geraci et al. (10). Two additional sets of differentially expressed genes were obtained from our own prior report on the effect of simvastatin on hypoxic PH (18) and a second previous study of chronic hypoxia in a murine model (11). We then identified common genes between the various data sets available from these studies and the list of significantly differentially expressed genes from each of the three experimental sets of our study: 1) normoxia vs. hypoxia, 2) normoxia vs. hypoxia/SU-5416, and 3) hypoxia/SU-5416 vs. hypoxia/SU-5416/sorafenib (refer to Supplemental Methods and Supplemental Tables S5–S10 for details on comparisons and gene lists.).
Real-time RT-PCR
Relative quantification of transcript levels of five representative candidate genes in rat lungs (same lung sample as for microarray analysis, n = 3 per condition) was performed in 96-well microtiter plates with ABI Prism 7700 Sequence Detector Systems (Perkin-Elmer/Applied Biosystems). These five genes, including transforming growth factor, β3 (Tgfβ3), complement component 1, q subcomponent, γ chain (C1qg), nexilin (Nexn), frizzled-related protein (Frzb), and plasminogen activator, urokinase receptor (Plaur), were chosen on the basis of their general classification into different functional categories observed in studies of PH and in our gene ontology analysis. For example, C1qg was randomly selected as a representative of inflammation and the immune system. Similarly, Plaur was chosen as a representative coagulation gene, Nexn as representative of a cytoskeleton-associated gene, Tgfβ3 as a representative gene of cellular proliferation and differentiation, and Frzb as a representative gene involved in developmental processes. TaqMan 18S rRNA Control Reagent was used as internal control for normalization. Primers and probes were purchased from Applied Biosystems in a ×20 mixture. All experimental protocols were based on manufacturer’s recommendations and used the TaqMan Gold RT-PCR Core Reagents Kit (Perkin-Elmer/Applied Biosystems, P/N 402876). Experimental parameters were 48°C for 30 min followed by 40 cycles of 95°C for 15 s and 60°C for 1 min.
Immunoblotting
Rat lung tissues were extracted for immunoblotting studies and homogenized in solubilization buffer containing (in mM) 50 HEPES (pH 7.5), 150 NaCl, 20 MgCl2, 0.4 Na3VO4, 40 NaF, and 0.2 phenylmethylsulfonyl fluoride, with 50 μM okadaic acid, 1% Triton X-100, 0.2% SDS, and Complete protease inhibitor cocktail (Amersham Biosciences). Lung samples were equalized for total protein content with a DC protein assay kit II (Bio-Rad). Three to four samples for each condition were run on SDS-PAGE in 4–15% polyacrylamide gels. These gels were then transferred onto Immobilon membranes and developed with specific primary and secondary antibodies. Visualization of immunoreactive bands was achieved with enhanced chemiluminescence (Amersham Biosciences). In specific cases, arbitrary units for immunoreactive bands were generated with the standardized average gray value (SAGV, obtained from Image-Quant software, Amersham Biosciences) of an immunoreactive band of interest as we have previously described (50).
Immunohistochemistry
Antigen retrieval was carried out by heating sections in Tris-EDTA (pH = 9) or citrate buffer for 15 min, followed by incubation for 1 h at room temperature with Ki-67 antibody (clone Ki-S5, 1:300), rabbit polyclonal anti-cleaved caspase-3 antibody (1:50), or anti-vWF antibody (1:800). This step was followed by incubation (30 min) with goat anti-mouse or anti-rabbit IgG conjugated to a HRP-labeled polymer (EnVisionTM+, Dako). Slides were then developed for 5 min with 3,3′-diaminobenzidine chromogen and counterstained with hematoxylin. Positive controls were performed by staining tonsils, proliferating cells, or colon cancer tissue.
For immunohistochemical studies, tissue microarrays (TMAs) were constructed by the Human Tissue Resource Center (http://pathcore.bsd.uchicago.edu/) at the University of Chicago. TMAs were produced by relocating small cylindrical rat lung tissue cores from individual donor rat lung blocks and placing them in a recipient “master” block with defined array coordinates. Arrays were constructed from formalin-fixed paraffin-embedded rat lung tissues by the removal of 1-mm-diameter tissue cores from donor blocks. Nearly all small to medium-sized PAs (an average of ~20 vessels per rat lung) from the donor block were identified under the microscope by a pathologist using a hematoxylin and eosin (H & E)-stained section of a glass slide as a guide to select the tissue cores. With the use of a precise spacing pattern on an automated TMA instrument (ATA-27, Beecher Instruments), 10 cores per rat lung from 3 rats per condition (normoxia, hypoxia, hypoxia/SU-5416, hypoxia/sorafenib, and hypoxia/SU-5416/sorafenib) were transferred to a recipient block in a gridlike fashion, retaining a link to the original block and its pathology. Multiple consecutive 4-μm-thick sections were cut from each master TMA, and these recipient slides were then processed for immunohistochemistry. The microscopic images of each slide were then acquired and stored on the Chromavision Automated Cellular Imaging System (ACIS, Clarient, Aliso Viejo, CA), a computer program that creates a histological reconstruction of an entire section image composed of all individual microscopic fields. A “hot spot” tool was activated to highlight areas of high chromogenic (brown threshold) activity and counterstain (blue threshold). For immunohistochemistry, color thresholds were set to define pixels that correspond to chromogen and counterstain, which were checked with an overlay tool and modified as necessary. ACIS immediately quantified this staining intensity and converted to a score over different user-defined parameters such as brown integrated optical density (IOD) per 10 μm2. IOD is a proxy for total antigen content, is directly proportional to the concentration of molecule recognized by the stain (Ki-67 or cleaved caspase-3), and is calculated by the intensity of stain multiplied by the brown area in micrometers. Analysis on all visible vascular areas was performed, thereby improving analytical accuracy and resolution over manual slide analysis.
Statistical analysis
Values are expressed as means ± SE. Intergroup differences were determined by the Student’s unpaired t-test, while multiple group differences were assessed by a simple ANOVA with post hoc analysis using the Newman-Keuls multiple-comparison test. A value of P < 0.05 was considered statistically significant (GraphPad Software, San Diego, CA).
RESULTS
Effect of sorafenib on hemodynamic and RV indexes in rodent PH
Our initial experiments verified the previously reported differences between the two PH rodent models (hypoxia- and hypoxia/SU-5416-exposed rats; Ref. 54) in the development of PH reflected by alterations in PA and RV hemodynamics (Fig. 1). Rats subjected to hypoxia alone developed significantly higher PAPs and RVH compared with normoxic control rats. Even greater and significant rises in PAPs, RV pressures, and RVH were observed in rats exposed to hypoxia/SU-5416 (Fig. 1, A and B). Systemic systolic blood pressures in these groups were not significantly different from those in normoxic rats (Fig. 1C). The effect of sorafenib on PA remodeling and RV hemodynamics induced by hypoxia/SU-5416 demonstrated significant reductions in PAPs, RV pressures (Fig. 1, A and B), and RVH (Fig. 2). Systemic blood pressures in hypoxia/SU-5416/sorafenib-treated rats were significantly higher than in hypoxia/SU-5416-exposed rats (Fig. 1C).
Fig. 1.

Effect of sorafenib on hemodynamic measurements. A and B: pulmonary artery (PA; A) and right ventricle (RV; B) systolic pressures obtained in Dahl salt-sensitive (SS) rodents at 3.5 wk of exposure to normoxia (n = 7), hypoxia (n = 6), hypoxia/SU-5416 (H-SU-5416, n = 5), hypoxia/sorafenib (H-sorafenib, n = 5), or hypoxia/SU-5416/sorafenib treatments (H-SU-Sor, n = 5). C: systemic systolic blood pressures in the same conditions. *P < 0.01, **P < 0.001, #P < 0.05.
Fig. 2.
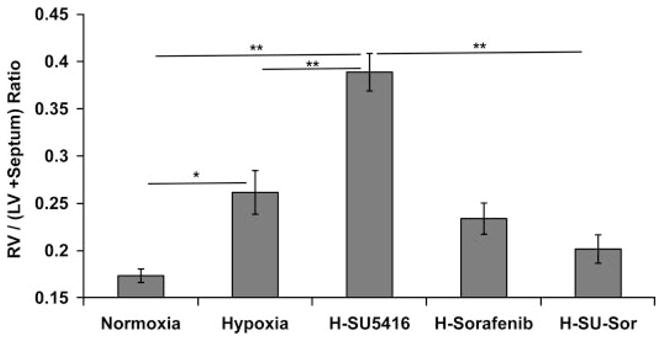
Effect of sorafenib on RV hypertrophy (RVH). Displayed are RVH measurements across all of the tested conditions represented by the ratio of RV mass divided by the sum of the mass of left ventricle (LV) + septum. *P < 0.01, **P < 0.001.
Effect of sorafenib on vascular morphology in rodent PH
Representative histological images stained with H & E and the endothelial cell (EC) marker vWF demonstrated remarkable medial wall thickening, fibrosis, and luminal obliteration with plexiform-like lesions in hypoxia/SU-5416-exposed rat lungs (Fig. 3C), whereas exposure to hypoxia alone showed only mild changes (Fig. 3B). Hypoxia/SU-5416/sorafenib-treated rat lungs exhibited dramatic attenuation in remodeling (Fig. 3D) compared with hypoxia/SU-5416-exposed rats and were not significantly different compared with normoxic control rats (Fig. 3A). The degree of infiltration and remodeling was quantified with the Heath-Edwards grading system (Fig. 4), which incorporates EC and smooth muscle cell (SMC) derangement based on H & E staining as previously described (59). This revealed a significantly higher average histological grade of remodeling per animal in the hypoxia/SU-5416-exposed rats, with complete attenuation of vascular remodeling (average grade of 0) in rats receiving sorafenib treatment. To further refine the functional roles of sorafenib in lung vascular remodeling, more in-depth histological analyses were conducted quantifying levels of both apoptosis (using anti-cleaved caspase-3 antibody) and cell proliferation (using anti-Ki-67 antibody) with TMAs and ACIS (Fig. 5). Both cellular processes (apoptosis and cell proliferation) were enhanced, as demonstrated by increased staining in rodent lung vasculature exposed to hypoxia and hypoxia/SU-5416 over normoxia (quantified by brown IOD per 10 μm2). PH-induced evidence of apoptosis was mainly localized to the endothelium and the adventitia in the lung vasculature, as shown by the arrows in the representative images in Fig. 6, while staining for cell proliferation was present in all layers of the vessel wall. Sorafenib-treated rats had minimal evidence of these cellular processes in both PH models.
Fig. 3.

Effect of sorafenib on the development of pulmonary hypertension (PH) histopathology. Representative images for each group (hematoxylin and eosin staining) with inset [anti-von Willebrand factor (vWF) staining] demonstrate that compared with normoxic rats (A), rats exposed to hypoxia alone for 3.5 wk displayed only mild lung vascular remodeling (B). In contrast, hypoxia/SU-5416-exposed rats showed marked vascular remodeling with medial wall thickening, endothelial cell hyperproliferation, and formation of plexiform lesions with exuberant vWF-positive endothelial cell proliferation (arrows in 3 representative insets, C). Sorafenib treatment completely prevented the chronic hypoxia-SU-5416-induced vascular remodeling (D).
Fig. 4.
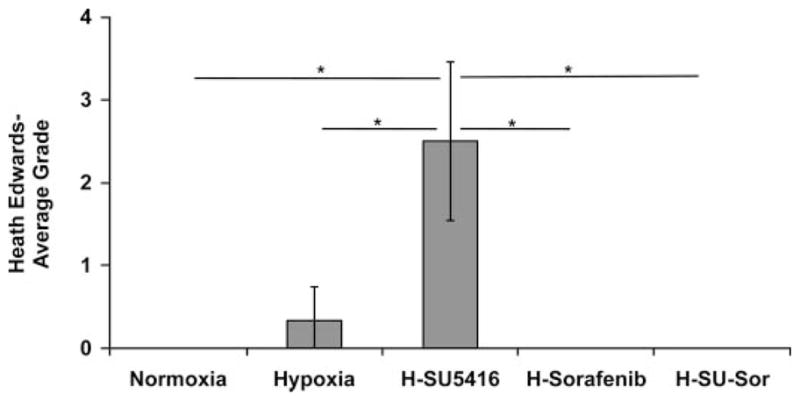
Effect of sorafenib on Heath-Edwards grading histology in rodent model of PH. Examination of Dahl SS rat lung histology of hypoxia/SU-5416-exposed rats (n = 5) revealed an average Heath-Edwards grade of 2.5 (see METHODS for details), indicating increased vascular remodeling with medial wall thickening and plexiform lesions. Normoxia (n = 7)-, hypoxia (n = 6)-, and sorafenib (n = 5)-treated animals were staged at grade 0 or 0/1 without significant histological changes in the pulmonary vasculature at 3.5 wk (hematoxylin and eosin staining). The average Heath-Edwards grade was determined by individually grading the lung histology of each animal and calculating the average for each condition. *P < 0.01.
Fig. 5.

Tissue microarray quantification of apoptosis and cell proliferation in rodent lung vasculature. Differences in the level of apoptosis detected by cleaved caspase-3 staining and the level of cell proliferation by Ki-67 staining were quantified as brown integrated optical density (IOD) per 10 μm2 with Automated Cellular Imaging System (ACIS) (as defined in METHODS). A: averages (from n = 3 rats/condition) for apoptosis. B: similar averages (from n = 3 rats/condition) for cell proliferation. A stepwise increase in staining for both apoptosis and cell proliferation is demonstrated with both hypoxia and hypoxia/SU-5416 exposures compared with normoxia. Sorafenib treatment produced dramatic inhibition of these cellular processes compared with the hypoxia/SU-5416 model, with less attenuation compared with hypoxia. #P < 0.05.
Fig. 6.

Effect of sorafenib on apoptosis and cellular proliferation detected by tissue microarray analysis. Representative images used for ACIS quantification of apoptosis and cell proliferation are shown for each condition. Interestingly, cleaved caspase-3 staining was primarily localized to the adventitia and the endothelium (arrows) in hypoxia/SU-5416 and hypoxia, while Ki-67 staining was prevalent in all vessel layers, as demonstrated by arrows in hypoxia- and hypoxia/SU-5416-based images.
Effect of sorafenib on lung gene expression profiles in rodent PH
To study potential mechanisms of sorafenib effects on PH, we integrated bioinformatic analyses of expression profiles that revealed 1,019 transcripts that were differentially regulated between hypoxia and normoxia. A comparison between the hypoxia/SU-5416 and normoxia groups revealed an additional 465 differentially regulated transcript sets likely involved in the development of the severe PH phenotype. The subsequent comparison of sorafenib treatment in hypoxia/SU-5416-exposed rats yielded 38 additional differentially regulated transcripts (Fig. 7) potentially involved in the pathway of sorafenib-mediated PH attenuation. The decrease in the observed list of differentially regulated genes with addition of SU-5416 to hypoxia may be explained by a potential drug effect. As a VEGFR inhibitor disrupting downstream signaling, SU-5416 may reduce the expression of numerous genes that are otherwise involved in lung responses to hypoxia. This may also explain the potential for an augmented PH phenotype.
To derive the potential biological significance of the sorafenib-driven genes, we first identified their significantly over-represented biological processes in GOs, utilizing Onto-Express. While the sorafenib-driven gene profile derived from a comparison between the hypoxia/SU-5416 group and the hyp-oxia/SU-5416/sorafenib group identified a number of biological process GO terms, a manual examination of these terms revealed six repeatedly represented overarching functional categories including cellular metabolic processes/metabolism (10 genes), developmental processes (7 genes), muscle development and regulation of muscle contraction (6 genes), defense response and immune system (5 genes), cell differentiation (4 genes), and cell proliferation (2 genes) (see Supplemental Table S2C for details and gene lists). These genes are highlighted in the heat map of 38 differentially expressed transcripts between hypoxia/SU-5416 and hypoxia/SU-5416/sor-afenib shown in Fig. 7.
For each of these six overarching functional classes observed in the sorafenib-driven genes, we next compared the number of distinct significant biological processes (represented as GO terms) across the three data sets (normoxia vs. hypoxia, normoxia vs. hypoxia/SU-5416, and hypoxia/SU-5416 vs. hypoxia/SU-5416/sorafenib). Significance was based on the frequency of these biological process terms representing the differentially expressed genes compared with those observed for all genes on the microarray chip (adjusted P < 0.05; see Supplemental Table S3 for the list of GO terms). To compare the relative enrichment of the biological process terms across the interventions, we analyzed the number of GO terms that were identical, related, or unrelated to each other between the different experimental conditions as illustrated in Fig. 8 (see METHODS for definitions). The majority of muscle-related and cell proliferation GO terms involved in normoxia vs. hypoxia or normoxia vs. hypoxia/SU-5416 were found to be either related or identical to those affected by the hypoxia/SU-5416 vs. hypoxia/SU-5416/sorafenib set. Additionally, for the other four functional GO categories, nearly half of the GO terms could be explained by similar relationships to hypoxia/SU-5416 vs. hypoxia/SU-5416/sorafenib, indicating that sorafenib regulates the majority of biological processes implicated in both the hypoxia and the hypoxia/SU-5416 models of PH. Supplemental Table S4 describes the exact frequency of distinct biological processes significantly overrepresented in the three compared groups. Supplemental Fig. S2 demonstrates the hierarchical relationships between the significant GO terms, defined as identical or related across all three conditions, within the example of “cell proliferation” and illustrates how the majority of these terms are related to cell proliferation of (but not limited to) B lymphocytes, fibroblasts, neuroblasts, or epithelial cells.
Fig. 8.
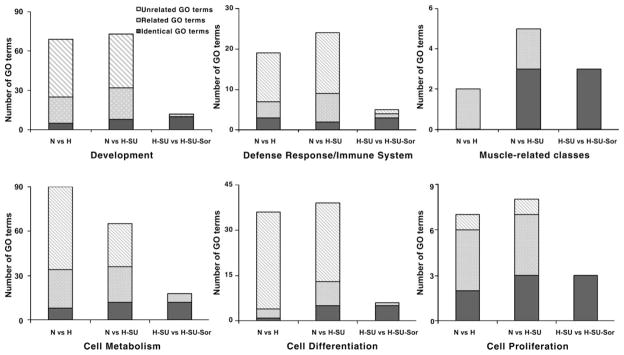
Relative enrichment of the overrepresented biological processes derived from differentially expressed genes in the 3 comparison sets. y-Axes show the count of gene ontology (GO)/biological process terms significantly overrepresented in the overarching functional category. Black bar segments represent biological processes in normoxia (N) vs. hypoxia (H) or in normoxia vs. hypoxia/SU-5416 (H-SU) identical to those corresponding to hypoxia/SU-5416 vs. hypoxia/SU-5416/sorafenib (H-SU-Sor). Dotted bar segments represent biological processes in N vs. H or in N vs. H-SU related through GO hierarchies (ancestors or descendants) to those in H-SU vs. H-SU-Sor and the reciprocal of this relationship. Hatched bar segments represent biological processes in N vs. H or in N vs. H-SU unrelated to those in H-SU vs. H-SU-Sor and vice versa (see METHODS for the definition of these relationships and Supplemental Fig. S2 for an example of a hierarchy between GO terms under cell proliferation). The majority of muscle-related and cell proliferation GO terms involved in N vs. H and N vs. H-SU are related or identical to those affected by sorafenib (H-SU vs. H-SU-Sor). The other functional categories have nearly half of GO terms that are related or identical to those of H-SU vs. H-SU-Sor.
To complement our GO analysis, we performed PubMatrix evaluation (number of associated PubMed citations) of a selection of 10 microarray-derived sorafenib candidate genes with a pair of genes representative of the most frequently appearing ontologies in our study (Table 1). This approach revealed a single previously identified PH candidate gene (Tgfβ3) and several potentially novel candidates as defined by limited or absent PubMed citations. Several of these latter genes have been reported, however, to be involved in biological pathways that have been linked to PH, as evidenced by the number of citations in search terms such as cell proliferation, cancer, and angiogenesis.
Table 1.
PubMatrix evaluation of selected sorafenib-driven genes across pulmonary hypertension-related search terms
| Gene Name | Gene Symbol | Ontology | Pulmonary Hypertension | Cell Proliferation | Hypoxia | Vascular Remodeling | Angiogenesis | Cancer |
|---|---|---|---|---|---|---|---|---|
| Actin, γ2 | Actg2 | Muscle | 2 | 85 | 2 | 6 | 8 | 132 |
| Tropomyosin 3, γ | Tpm3 | Muscle | 0 | 3 | 0 | 0 | 0 | 25 |
| Complement component 1, q subcomponent, γ polypeptide | C1qg | Defense and immune | 0 | 0 | 0 | 0 | 0 | 0 |
| RT1 class I, CE12 | Rt1-CE12 | Defense and immune | 0 | 0 | 0 | 0 | 0 | 0 |
| Caldesmon 1 | Cald1 | Cell proliferation | 0 | 42 | 4 | 7 | 9 | 145 |
| V-maf musculoaponeurotic fibrosarcoma oncogene homolog | Maf | Cell proliferation | 0 | 45 | 4 | 0 | 6 | 221 |
| Transforming growth factor, β3 | Tgfb3 | Cell differentiation | 46 | 2,520 | 109 | 120 | 309 | 2,373 |
| Protein tyrosine phosphatase, receptor type R | Ptprr | Cell differentiation | 0 | 13 | 0 | 0 | 2 | 22 |
| 3-Hydroxy-3-methylglutaryl-coenzyme A synthase 1 | Hmgcs1 | Metabolism | 0 | 3 | 1 | 0 | 0 | 9 |
| Isopentenyl-diphosphate δ isomerase | Idi1 | Metabolism | 0 | 3 | 0 | 0 | 0 | 4 |
Given both the ontology and PubMatrix analyses, we next sought to identify a subset of genes that have an increased likelihood of involvement in PH. Each of the 38 transcripts differentially regulated between hypoxia/SU-5416 and hypoxia/SU-5416/sorafenib groups (data set 1) was intersected with those SAM-derived transcripts that were differentially regulated between normoxia and hypoxia/SU-5416 (data set 2) as well as between normoxia and hypoxia (data set 3). Therefore, the expression of particular genes arising from these three SAM data sets represents a dual screen for PH candidate genes, in terms of their universal presence in all condition-based comparisons, as well as strong statistical significance in expression levels given their SAM-based selection. We found a directional expression pattern for six genes across all four conditions with the values obtained from the original GCRMA-normalized data for each chip. This pattern is shown in Fig. 9 and clearly mirrors both the exacerbating effect of SU-5416 on the hypoxic PH phenotype as well as the potent mitigating effect of sorafenib.
Fig. 9.
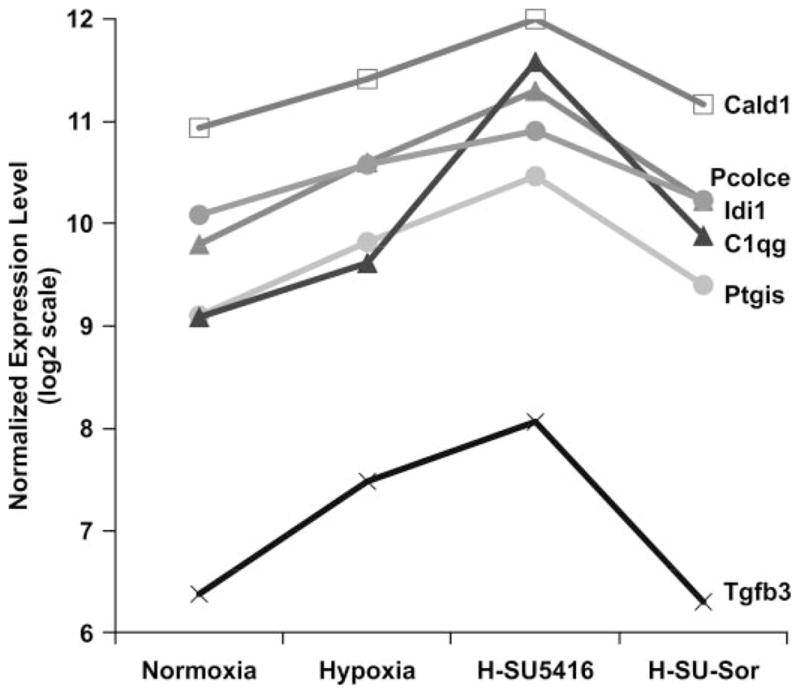
Comparison of the expression patterns of sorafenib-driven genes in the rodent groups. The 38 differentially expressed transcripts in rodent lung responses between H-SU-5416 and H-SU-Sor were assessed for significant directional expression pattern, yielding 6 genes that appeared across all 4 conditions. y-Axis shows the normalized expression level of the probe sets representing the 6 genes in log 2 scale. These 6 genes (Cald1, Pcolce, C1qg, Idi1, Tgfβ3, Ptgis) consistently displayed an increase in expression levels in hypoxia compared with normoxia, an even greater expression level in the hypoxia/SU-5416 model of PH, and a reduction in expression following sorafenib treatment to levels nearly that of normoxia. Bars are SD.
Comparison with microarray data sets from prior PH studies
We next intersected our microarray data with previously reported microarray studies of PH. We calculated the total number of common genes (Supplemental Table S11) between the two comparison sets derived from our two models of PH and those of four previous studies (10, 11, 18, 29). We observed 57 common hypoxia-driven genes in the overlap between the Malek et al. report (29) and our study (Supplemental Table S5). We also compared the differentially expressed hypoxia-driven rat genes from the Malek et al. study to the hypoxia/SU-5416-driven rat genes from our study and observed 35 common genes in the two gene lists (Supplemental Table S6). Comparison of our present hypoxia-driven and hypoxia/SU-5416-driven data sets and our previous differentially expressed gene set between normoxia and hypoxia in the simvastatin study in PH (18) resulted in 20 (Supplemental Table S7) and 17 (Supplemental Table S8) common genes. We next determined 47 common differentially expressed hypoxia-driven genes (Supplemental Table S9) from the mouse study by Gharib et al. (11) and hypoxia-driven rat genes from our study at a similar time period (3 wk) as well as 26 common genes (Supplemental Table S10) when compared with differentially expressed hypoxia/SU-5416-driven rat genes from our study. In our comparison with the Geraci et al. (10) study set, the rat orthologs of the differentially expressed human PH genes were compared with data sets from our two models of PH. We identified four genes (Slc25a1, Shmt2, Plcb4, Pts) common to our normoxia vs. hypoxia group and 1 gene (Fyn) common to our normoxia vs. hypoxia/SU-5416 group. Finally, we also identified two microarray studies (11, 18) available for comparison to our sorafenib treatment effects in PH. We failed, however, to identify any common genes after intersecting the orthologous rat genes derived from the differential expression between hypoxia and hypoxia with subsequent reexposure to normoxia treatment (hypoxia/reoxygenation) in mice (11) to those differentially expressed between hypoxia/SU-5416 and hypoxia/SU-5416/sorafenib. Similarly, there were no overlapping genes in the comparison of the hypoxia/SU-5416 vs. hypoxia/SU-5416/sorafenib data set with the hypoxia vs. hypoxia/simvastatin group from our previous study (18).
Thus our ortholog approach led to the observation that the hypoxia and hypoxia/SU-5416 groups share a significant number of rodent genes differentially expressed with previously published mouse, rat, and human microarray experiments in PH, providing strong validation of the experimental model of our study. Although no single gene was found to be common across all study sets, the various comparisons draw attention to established hypoxia and PH candidate genes including bone morphogenetic protein 6, tissue plasminogen activator, and members of the prostaglandin receptor family. Solute carrier family 28 (sodium-coupled nucleoside transporter), member 2 (Slc28a2) was especially unique (identified in 3 of the 5 total studies), and members of this transporter family were found in all but two total comparisons. Two of the genes highlighted in Fig. 7, a member of the C1q family and isopentenyl-diphosphate δ isomerase (Idi1), were also commonly present in multiple comparison sets.
Validation of expression profiling analysis by RT-PCR and Western blot analysis
RT-PCR analysis from total RNA depicts validation of expression of five selected genes that were differentially regulated in the two models of PH compared with normoxia (Fig. 10). Two genes were differentially regulated between hypoxia/SU-5416 and hypoxia/SU-5416 with sorafenib treatment (Fig. 10). Expression levels of the gene products were also confirmed by immunoblotting of rat lung homogenates for TGFβ3 and C1q proteins (Fig. 11). Interestingly, although transcript levels of Tgfβ3 were similar between normoxia and hypoxia/SU-5416, TGFβ3 protein levels were significantly higher in hypoxia/SU-5416. This paradox may be explained by a number of regulatory mechanisms that contribute to greater TGFβ3 protein stability (steady-state levels) such as posttranslational modifications, sequestrations, and ubiquitinations compared with the turnover rate of the transcript. C1q levels, in contrast, appear more consistent at both gene and protein levels because the lungs may continually regulate both to respond to the increasing stress and inflammation.
Fig. 10.
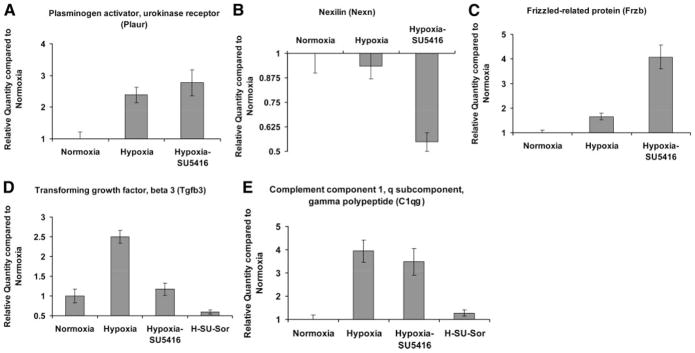
RT-PCR validation of differentially regulated rodent lung genes compared with normoxia. A–C: RT-PCR validation of microarray-generated expression levels of 3 selected candidate genes (hypoxia alone and hypoxia/SU-5416) compared with normoxia-generated expression. D and E: RT-PCR validation of 2 genes in the hypoxia/SU-5416/sorafenib group compared with normoxia. The gene selection for RT-PCR validation was based on representative functional classes involved in PH (described in METHODS) and resulted in the selection of 3 genes (A–C) that were not differentially regulated in the microarray data set derived from the hypoxia/SU-5416/sorafenib group compared with normoxia. All data are presented as mean ± SE fold change in PCR values in the SS strain.
Fig. 11.

Western immunoblot validation of microarray-derived expression levels of Tgfβ3 and C1q genes. Depicted is graphical quantitation of the protein expression of 2 selected genes (Tgfβ3 and C1q) expressed in rat lung homogenates across all conditions. The immunoreactivity of the specific bands from several experiments (n = 3) was analyzed with Image-Quant software (see METHODS), with SD bars shown. Arbitrary units on the y-axis refer to % standardized average gray value (SAGV) for immunoreactive band of interest divided by SAGV for actin-immunoreactive band. Inset: immunoblot bands confirming microarray-derived differential Tgfβ3 and C1q regulation. Actin represents loading normalization across all conditions. *P < 0.001, **P < 0.05.
Role of MAPK pathway components in rodent PH
The MAPK pathway exhibits ubiquitous involvement in cell proliferation and in responses to hemodynamic and environmental stress. Given the putative role of MAPK elements in the development of PH and pharmacodynamics of sorafenib, we surveyed the posttranslational modification and protein expression levels of phosphorylated (p-) and unphosphorylated MEK1/2, ERK, and p38 MAPK (in addition to VEGFR-2) in PH lung homogenates. Levels of p-ERK and p-MEK1/2 were increased incrementally from hypoxia- to hypoxia/SU-5416-exposed rats compared with normoxia, while p-p38 showed a similar level of increased posttranslational modification in the two groups. The total amount of MAPK components was not changed compared with normoxia for all three proteins, again consistent with this observation as posttranslational in nature. Finally, we also observed the reduction in levels of p-VEGFR-2 with hypoxia/SU-5416, confirming the recognized inhibition of VEGFR-2 kinase activity by SU-5416. Interestingly, levels of p-VEGFR-2 are increased in hypoxia compared with normoxia but remain downregulated by hypoxia/SU-5416/sorafenib exposure. Total VEGFR-2 did not change significantly throughout the various conditions (Fig. 12).
Fig. 12.
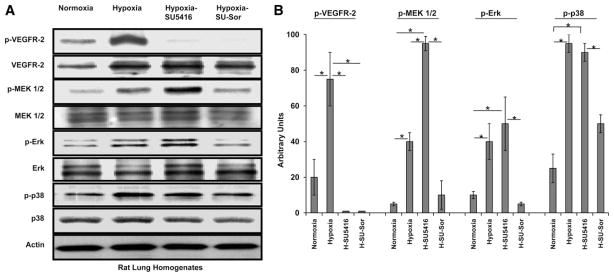
Western immunoblot analysis of the growth factor-activated [VEGF receptor (VEGFR)-2] MAPK cascade pathway in PH models. A: Western blots of Dahl SS rat lungs stained for 4 selected MAPK proteins. An upregulation of phosphorylated (p)-p38 and a stepwise upregulation of multiple MAPK cascade agents including p-MEK1/2 and p-Erk was observed in both models of PH (hypoxia alone and hypoxia/SU-5416), with subsequent downregulation of these signaling molecules with sorafenib treatment. Total expressed levels of these proteins did not show differences across the 3 conditions. Interestingly, the level of p-VEGFR-2, known to induce MAPK cascade activation, is downregulated in both the hypoxia/SU-5416- and hypoxia/SU-5416/sorafenib-exposed rodent lungs. Actin was used to normalize for loading. B: graphical quantitation of immunoreactive bands from experiments (n = 3) depicted in A, which were analyzed with ImageQuant software (see METHODS). Arbitrary units on the y-axis refer to % SAGV for phosphorylated protein-immunoreactive band of interest divided by SAGV for total protein-immunoreactive band; SD bars are shown. *P < 0.001.
DISCUSSION
The conceptual basis for the present study is the observation that the development of chronic PH involves vascular remodeling marked by enhanced cell proliferation, angiogenesis, and impaired apoptosis (51), alterations commonly encountered in neoplastic processes. Severe PH can present with unique tumorlets of hyperproliferating ECs that obliterate medium-sized precapillary arteries, forming structures known as plexiform lesions that express angiogenic and inflammatory factors including members of the VEGF and TGF-β families (54, 56, 59). Recently, imatinib, an effective agent in chronic myelogenous leukemia with PDGFR and c-Kit inhibitory activity, showed a significant survival effect in a conventional monocrotaline-induced rodent model of PH (48) and objective evidence of clinical improvement in two advanced PH patients (15, 41). These findings and now the results of this study justify further development of antineoplastic kinase inhibitors of vascular cell proliferation and angiogenesis as future PH therapies (12–14, 16).
In the initial report of SU-5416, a first-generation inhibitor of VEGFR-1 and -2, this agent unexpectedly exacerbated rather than ameliorated PH in the hypoxia/rodent model of PH. In fact, the addition of SU-5416 generated a striking angioproliferative vasculopathy including SMC hyperproliferation, EC apoptosis, and, later, the development of plexiform lesions due to apoptosis-resistant EC hyperproliferation (54). Furthermore, in view of VEGFR-2 as the major mitogenic and angiogenic VEGFR (38, 45, 49), the authors suggested that plexiform lesion formation was VEGFR-2 independent. Our immunoblot and immunohistochemistry data support this contention, because increased VEGFR-2 kinase activity (a potentially compensatory response) was detected in the conventional hypoxia model.
Because sorafenib inhibits the processes of EC growth, migration, and proliferation that contribute to plexiform lesion formation (44, 63), we hypothesized that sorafenib would not exacerbate PH in the conventional model of rodent PH but would attenuate the irreversible and pronounced vascular remodeling of the augmented hypoxia/SU-5416 rodent model, which resembles severe PH in humans (54). Our results support this hypothesis. Sorafenib was markedly effective in decreasing PAPs, RV pressures, and RVH in the augmented PH model and dramatically attenuated the vascular lesions in both models. Furthermore, we employed extensive biochemical, immunohistochemical, and novel bioinformatic analyses of gene expression profiling to integrate genomic and physiological influences of this novel PH treatment.
A recent follow-up study of exposure of human pulmonary microvascular ECs to hypoxia/SU-5416 provided additional insights into the pathophysiology of PH in this model (46, 47). Cells expressing CD34 and c-kit constituted increasing proportions of the cells surviving multiple passages in the presence of hypoxia/SU-5416. These cells also acquired characteristics of proliferative SMCs, suggesting that the augmentation of hypoxic PH by SU-5416 was not only due to influx of bone marrow-derived endothelial progenitor cells but also due to selection and proliferation of pulmonary microvascular ECs with similar phenotypes. Though sorafenib shares pharmacological inhibition of VEGFR-1 and -2 with SU-5416, this agent did not cause any appreciable medial muscular thickening and luminal obliteration with hypoxia. Rather, sorafenib treatment reduced levels of cell proliferation and apoptosis in both PH models. These data suggest that other targets of sorafenib are critically involved in the pathophysiology of PH and its therapeutic effect. Furthermore, although the mechanisms regarding these seemingly contradictory findings (antiproliferative and antiapoptotic) require further investigation, it can be speculated that the ability of sorafenib to prevent EC apoptosis seen in the hypoxia/SU-5416 model may be an indirect secondary event from its potency to prevent the full spectrum of vascular remodeling seen in severe PH.
In addition to VEGFR-1–3 inhibition, sorafenib also disrupts PDGFR-β, c-kit, Raf, and p38α MAPK. The suggestion that VEGFR-2-independent pathways cause severe PH (54) led us to explore other activities contributing to the attenuated PH phenotype. Previous reports have demonstrated increased SMC proliferation to hypoxia both in vivo and in vitro via the protein kinase C (PKC)/MAPK pathway (24, 31, 60, 61). In this study, compared with the hypoxia-alone group the combined hypoxia/SU-5416 group had higher levels of phosphorylated MEK1/2 and ERK. Additionally, although MAPK cascade activation may evolve via VEGFR-2 signaling during cell growth and angiogenesis, the upregulation of phosphorylated ERK and MEK1/2 with SU-5416 treatment again highlights the VEGFR-2-independent induction of MAPK pathway activation in PH. In agreement with its original discovery as an inhibitor of the Raf-1/MAPK pathway, sorafenib treatment resulted in decreased phosphorylated levels of MEK1/2, ERK, and p38 proteins ascertained by Western blot analysis, with no reduction in total MEK, ERK, or p38 protein levels. We speculate that this posttranslational disruption of MAPK cascade contributes to sorafenib’s prevention of significant SMC and EC hyperproliferation as evidenced by immunohistochemistry. These findings additionally suggest that the MAPK cascade is a canonical pathway whereby VEGFR-2 phosphorylation is only one of multiple upstream signaling events involved in regulating cell growth and differentiation in PH.
We also report the novel use of microarray-derived genome-wide gene expression analysis coupled with bioinformatics to provide global genomic profile-based mechanistic insights into both the development of PH and the attenuation by sorafenib. As expected, our microarray results yielded a large range of differentially expressed genes based on the condition-based comparisons, i.e., ranging from 38 to >1,000 genes, traditionally presenting a daunting challenge in the interpretation of such vast data sets. We have addressed this barrier by utilizing both conventional and novel bioinformatic methods to further delineate sorafenib’s biological effects and the pathophysiology of PH. GO analysis identified known biological pathways underlying the development of PH and suggested general mechanisms by which sorafenib attenuates PH. The GO categories most represented in the differential expression analysis derived between hypoxia/SU-5416 and hypoxia/SU-5416/sorafenib were muscle-related classes, immune system, and metabolism. To our knowledge, our PH study is the first to expand this standard GO analysis to compare the enrichment of biological process-labeled GO terms across three large differentially expressed gene sets.
Unlike conventional analyses, our comparison was founded on the relationships between GO terms in six highly affected functional categories under the hypoxia/SU-5416/sorafenib treatment arm against the two models of PH (Fig. 8). On the basis of the relative enrichment of identical or related GO terms, we were able to stratify sorafenib’s physiological impact and prioritize two GO functional classes, muscle related and cell proliferation, because the drug appeared to regulate a larger number of biological processes in these two GO categories. These findings are further validated with the immunohistochemistry data that display sorafenib’s potent inhibition of cell proliferation (both SMCs and ECs). To further capitalize on this analysis, the genes present in these broad categories can then be further prioritized as PH candidate genes with function-specific associations. For example, both TGFβ3 (cell proliferation GO) and caldesmon 1 (Cald1) genes (muscle-related class) are potentially more relevant PH candidate genes because they are upregulated during hypoxia- or hypoxia/SU-5416-induced PH, where SMC proliferation is observed and downregulated with sorafenib treatment, which prevented this SMC phenotype. In summary, these GO term-based enrichment comparisons support our hypothesized physiological rationale to use sorafenib in regulating the cell proliferation involved in the development of PH while adding novel physiological insights as evidenced by the relatively large proportion of muscle-related classes affected by sorafenib.
Beyond ontological analyses, our study is the first to integrate extensively available published microarray analyses of PH studies that parallel our study models. Through this process, we have validated our prior reports of hypoxia-driven genes (18) and several genes with established roles in PH (10) and successfully narrowed the extensive list of PH-related genes for future PH studies. For example, genes such as Idi1 and Slc28a2 as well as members of the C1q family are novel potential targets for PH studies given the frequency of their appearance in microarray-based PH studies and across various species. The study by Geraci et al. was extremely valuable in creating expression profiles of human idiopathic and familial PH and to help substantiate the rat data and their clinical implications. Although the low numbers of common genes (<4) may potentially highlight the lack of potential clinical similarity of our rodent data from the hypoxia/SU-5416 model of PH to that of severe PH patients, more likely explanations stem from the comparison of different microarray platforms and the comparison of different baseline subjects. For example, nearly all of the severe PH patients in the study by Geraci et al. had a primary diagnosis of cancer or trauma. In addition, we were hampered to some degree by the lack of access to the complete list of differentially regulated genes from older reports. Similarly relevant to our PH study, Gharib et al. (11) investigated global gene transcription profiling during both progression and regression (with return to normoxia) of hypoxia-induced PH and clustered genes into groups on the basis of their temporal expression patterns. One advantage of the latter study was the use of the BALB/c murine strain, reported to undergo pulmonary vascular remodeling under chronic hypoxia (20). To stress the importance of capturing the full spectrum of vascular remodeling of severe human PH, our study is the first known to perform expression profiles during both progression and prevention by drug therapy of both the conventional rat hypoxic model and the augmented model of PH using SU-5416.
Expression pattern analysis allowed us to highlight and prioritize a subset of candidate genes involved in both the development of PH and its attenuation by sorafenib. The six-gene subset derived from cumulative microarray transcript filtering exhibited a unique expression pattern across the contrasting conditions, with upregulation in conditions demonstrating the “PH” phenotype, i.e., hypoxia- or hypoxia/SU-5416-mediated PH, and attenuated expression in the presence of sorafenib. This gene subset includes potentially novel PH candidates such as procollagen C-endopeptidase enhancer protein (Pcolce), Cald1, C1qg, and Idi1, as well as prostacyclin synthase (Ptgis) and Tgfβ3, which have already established roles in PH studies (19, 35, 36).
We recognize that two potential limitations of our studies were the testing of sorafenib in the prevention of PH pathophysiology without addressing potential reversal of established PH pathology and the minimal therapeutic effect of sorafenib in the hypoxia-alone group (no significant change in PAP, reduced Heath-Edwards score). Because hypoxia is a common inducer of clinical PH in humans, the question of a model-specific benefit of sorafenib can be raised, although this conventional model lacks luminal obliteration with significant EC remodeling and leads to only modest rises in PAPs. The full phenotypic spectrum of severe PH by exposure to hypoxia/SU-5416 supports the basis for conducting pharmacological testing for PH in this potentially superior preclinical model. This observation is supported by the failure in clinical translation of multiple PH drugs initially found to be successful in preclinical trials using conventional models, including hypoxia and monocrotaline (6, 22). Nonetheless, the greatest concern for effective translation was that sorafenib, as a VEGFR-1–3 inhibitor like SU-5416, might exacerbate PH. The absence of any promotion of PH in the hypoxia model and the overall safety profile of sorafenib in thousands of human cancer patients imply that sorafenib may be a viable human PH therapy. We have begun a phase I testing protocol at our institution with anticipation of assessing sorafenib in established or end-stage PH. These findings in turn should inform further development of sorafenib as a PH therapeutic in different disease settings.
In summary, we have described the successful and novel prophylactic application of the multikinase inhibitor sorafenib in two rodent models of PH with improved hemodynamic parameters and attenuation of significant structural PH changes. Notably, sorafenib also improves hemodynamic parameters in two other rodent models of PH (25). Our investigation revealed biochemical and genomic evidence supporting the potential involvement of the MAPK cascade system and TGF-β3 in PH development and response to therapy. The observed increased systemic blood pressures in animals receiving sorafenib were consistent with previous clinical studies in cancer patients receiving sorafenib (28, 52, 58). We speculate that the combination of hyperproliferative findings (targeting the hypoxia-induced upregulation of the MAPK pathway) along with the oxygen-sensing mechanisms in the pulmonary circulation may specifically contribute to the predisposition of the beneficial effects to be limited to the lung circulation. Because sorafenib is already a well-tolerated FDA-approved therapy in cancer, the clinical application of this novel therapy for PH can represent an excellent example of bedside-to-bench-to-bedside translation.
Supplementary Material
Acknowledgments
We thank Bayer HealthCare and Pharmaceutical Research Associates Scott Wilhelm and Mark Lynch for providing sorafenib tablets and for manuscript review. We also thank Jinarong Li and Sherry Wanderling for their technical assistance, Dr. Maria Tretiakova for her assistance in tissue microarray construction and analysis, as well as Georgeanne Lammertin and Keith Collins for their expert assistance in the echocardiographic studies and analysis.
GRANTS
This work was supported by National Institutes of Health (NIH) Grants P01-HL-58064 (J. G. N. Garcia), T32-HL-07381 (A. A. Desai), and U54-CA-121852 (Y. A. Lussier), the Lowell T. Coggeshall endowment (J. G. N. Garcia), the Doris Duke Charitable Foundation Clinical Scientist Development Award (M. Gomberg-Maitland), and Howard University Pulmonary Hypertension NIH Grant R01-HL079912 (J. G. N. Garcia).
Footnotes
The online version of this article contains supplemental material.
References
- 1.Adatia I. Recent advances in pulmonary vascular disease. Curr Opin Pediatr. 2002;14:292–297. doi: 10.1097/00008480-200206000-00002. [DOI] [PubMed] [Google Scholar]
- 2.Badesch DB, Abman SH, Simonneau G, Rubin LJ, McLaughlin VV. Medical therapy for pulmonary arterial hypertension: updated ACCP evidence-based clinical practice guidelines. Chest. 2007;131:1917–1928. doi: 10.1378/chest.06-2674. [DOI] [PubMed] [Google Scholar]
- 3.Becker KG, Hosack DA, Dennis G, Jr, Lempicki RA, Bright TJ, Cheadle C, Engel J. PubMatrix: a tool for multiplex literature mining. BMC Bioinformatics. 2003;4:61. doi: 10.1186/1471-2105-4-61. [DOI] [PMC free article] [PubMed] [Google Scholar]
- 4.Budhiraja R, Tuder RM, Hassoun PM. Endothelial dysfunction in pulmonary hypertension. Circulation. 2004;109:159–165. doi: 10.1161/01.CIR.0000102381.57477.50. [DOI] [PubMed] [Google Scholar]
- 5.Bull TM, Coldren CD, Nana-Sinkam P, Sotto-Santiago SM, Moore M, Voelkel NF, Geraci MW. Microarray analysis of peripheral blood cells in pulmonary arterial hypertension, surrogate to biopsy. Chest. 2005;128:584S. doi: 10.1378/chest.128.6_suppl.584S. [DOI] [PubMed] [Google Scholar]
- 6.Campian ME, Hardziyenka M, Michel MC, Tan HL. How valid are animal models to evaluate treatments for pulmonary hypertension? Naunyn Schmiedebergs Arch Pharmacol. 2006;373:391–400. doi: 10.1007/s00210-006-0087-9. [DOI] [PubMed] [Google Scholar]
- 7.Cogan JD, Pauciulo MW, Batchman AP, Prince MA, Robbins IM, Hedges LK, Stanton KC, Wheeler LA, Phillips JA, 3rd, Loyd JE, Nichols WC. High frequency of BMPR2 exonic deletions/duplications in familial pulmonary arterial hypertension. Am J Respir Crit Care Med. 2006;174:590–598. doi: 10.1164/rccm.200602-165OC. [DOI] [PMC free article] [PubMed] [Google Scholar]
- 8.Escudier B, Eisen T, Stadler WM, Szczylik C, Oudard S, Siebels M, Negrier S, Chevreau C, Solska E, Desai AA, Rolland F, Demkow T, Hutson TE, Gore M, Freeman S, Schwartz B, Shan M, Simantov R, Bukowski RM TARGET Study Group. Sorafenib in advanced clear-cell renal-cell carcinoma. N Engl J Med. 2007;356:125–134. doi: 10.1056/NEJMoa060655. [DOI] [PubMed] [Google Scholar]
- 9.Geraci MW, Gao B, Hoshikawa Y, Yeager ME, Tuder RM, Voelkel NF. Genomic approaches to research in pulmonary hypertension. Respir Res. 2001;2:210–215. doi: 10.1186/rr59. [DOI] [PMC free article] [PubMed] [Google Scholar]
- 10.Geraci MW, Moore M, Gesell T, Yeager ME, Alger L, Golpon H, Gao B, Loyd JE, Tuder RM, Voelkel NF. Gene expression patterns in the lungs of patients with primary pulmonary hypertension: a gene microarray analysis. Circ Res. 2001;88:555–562. doi: 10.1161/01.res.88.6.555. [DOI] [PubMed] [Google Scholar]
- 11.Gharib SA, Luchtel DL, Madtes DK, Glenny RW. Global gene annotation analysis and transcriptional profiling identify key biological modules in hypoxic pulmonary hypertension. Physiol Genomics. 2005;22:14–23. doi: 10.1152/physiolgenomics.00265.2004. [DOI] [PubMed] [Google Scholar]
- 12.Ghofrani HA, Grimminger F. Treatment of pulmonary arterial hypertension: phosphodiesterase-5 inhibitors. Dtsch Med Wochenschr. 2006;131:S311–S314. doi: 10.1055/s-2006-957199. [DOI] [PubMed] [Google Scholar]
- 13.Ghofrani HA, Rosenkranz S, Grimminger F. Future aspects of the treatment of pulmonary arterial hypertension. Dtsch Med Wochenschr. 2006;131:S338–S340. doi: 10.1055/s-2006-957207. [DOI] [PubMed] [Google Scholar]
- 14.Ghofrani HA, Schermuly RT, Weissmann N, Seeger W, Grimminger F. Reverse remodeling—paradigm shift in the treatment of pulmonary hypertension. Dtsch Med Wochenschr. 2006;131:871–874. doi: 10.1055/s-2006-939860. [DOI] [PubMed] [Google Scholar]
- 15.Ghofrani HA, Seeger W, Grimminger F. Imatinib for the treatment of pulmonary arterial hypertension. N Engl J Med. 2005;353:1412–1413. doi: 10.1056/NEJMc051946. [DOI] [PubMed] [Google Scholar]
- 16.Ghofrani HA, Voswinckel R, Reichenberger F, Weissmann N, Schermuly RT, Seeger W, Grimminger F. Hypoxia- and non-hypoxia-related pulmonary hypertension—established and new therapies. Cardiovasc Res. 2006;72:30–40. doi: 10.1016/j.cardiores.2006.07.025. [DOI] [PubMed] [Google Scholar]
- 17.Girgis RE, Li D, Zhan X, Garcia JG, Tuder RM, Hassoun PM, Johns RA. Attenuation of chronic hypoxic pulmonary hypertension by simvastatin. Am J Physiol Heart Circ Physiol. 2003;285:H938–H945. doi: 10.1152/ajpheart.01097.2002. [DOI] [PubMed] [Google Scholar]
- 18.Girgis RE, Ma SF, Ye S, Grigoryev DN, Li D, Hassoun PM, Tuder RM, Johns RA, Garcia JG. Differential gene expression in chronic hypoxic pulmonary hypertension: effect of simvastatin treatment. Chest. 2005;128:579S. doi: 10.1378/chest.128.6_suppl.579S. [DOI] [PubMed] [Google Scholar]
- 19.Gong LM, Du JB, Shi L, Shi Y, Tang CS. Effects of endogenous carbon monoxide on collagen synthesis in pulmonary artery in rats under hypoxia. Life Sci. 2004;74:1225–1241. doi: 10.1016/j.lfs.2003.07.046. [DOI] [PubMed] [Google Scholar]
- 20.Hales CA, Kradin RL, Brandstetter RD, Zhu YJ. Impairment of hypoxic pulmonary artery remodeling by heparin in mice. Am Rev Respir Dis. 1983;128:747–751. doi: 10.1164/arrd.1983.128.4.747. [DOI] [PubMed] [Google Scholar]
- 21.Higenbottam T, Cremona G. Acute and chronic hypoxic pulmonary hypertension. Eur Respir J. 1993;6:1207–1212. [PubMed] [Google Scholar]
- 22.Jiang BH, Maruyama J, Yokochi A, Iwasaki M, Amano H, Mitani Y, Maruyama K. Prolonged nitric oxide inhalation fails to regress hypoxic vascular remodeling in rat lung. Chest. 2004;125:2247–2252. doi: 10.1378/chest.125.6.2247. [DOI] [PubMed] [Google Scholar]
- 23.Khatri P, Draghici S, Ostermeier GC, Krawetz SA. Profiling gene expression using Onto-Express. Genomics. 2002;79:266–270. doi: 10.1006/geno.2002.6698. [DOI] [PubMed] [Google Scholar]
- 24.Kim S, Iwao H. Stress and vascular responses: mitogen-activated protein kinases and activator protein-1 as promising therapeutic targets of vascular remodeling. J Pharmacol Sci. 2003;91:177–181. doi: 10.1254/jphs.91.177. [DOI] [PubMed] [Google Scholar]
- 25.Klein M, Janssen W, Ellinghaus P, Riedl B, Grimminger F, Schermuly RT, Schaefer S. Combined inhibition of tyrosine- and serine-/threonine kinases in pulmonary hypertension: Sorafenib prevents vascular and myocardial remodeling (Abstract) Eur J Heart Fail. 2007;6(Suppl 1):31. [Google Scholar]
- 26.Larsson O, Wahlestedt C, Timmons JA. Considerations when using the significance analysis of microarrays (SAM) algorithm. BMC Bioinformatics. 2005;6:129. doi: 10.1186/1471-2105-6-129. [DOI] [PMC free article] [PubMed] [Google Scholar]
- 27.Llovet J, Ricci S, Mazzaferro V, Hilgard P, Raoul J, Zeuzem S, Poulin-Costello M, Moscovici M, Voliotis D, Bruix J SISG. Randomized phase III trial of sorafenib versus placebo in patients with advanced hepatocellular carcinoma (HCC) (Abstract) J Clin Oncol. 2007;25:LBA1. [Google Scholar]
- 28.Maitland ML, Moshier K, Imperial J, Kasza KE, Karrison T, Elliott W, Undevia SD, Stadler W, Desai AA, Ratain MJ. Blood pressure as a biomarker for sorafenib, an inhibitor of the vascular endothelial growth factor signaling pathway (Abstract) J Clin Oncol. 2006;24:2035. [Google Scholar]
- 29.Malek RL, Wang HY, Kwitek AE, Greene AS, Bhagabati N, Borchardt G, Cahill L, Currier T, Frank B, Fu X, Hasinoff M, Howe E, Letwin N, Luu TV, Saeed A, Sajadi H, Salzberg SL, Sultana R, Thiagarajan M, Tsai J, Veratti K, White J, Quackenbush J, Jacob HJ, Lee NH. Physiogenomic resources for rat models of heart, lung and blood disorders. Nat Genet. 2006;38:234–239. doi: 10.1038/ng1693. [DOI] [PubMed] [Google Scholar]
- 30.McLaughlin VV, McGoon MD. Pulmonary arterial hypertension. Circulation. 2006;114:1417–1431. doi: 10.1161/CIRCULATIONAHA.104.503540. [DOI] [PubMed] [Google Scholar]
- 31.Morrell ED, Tsai BM, Wang M, Crisostomo PR, Meldrum DR. p38 Mitogen-activated protein kinase mediates the sustained phase of hypoxic pulmonary vasoconstriction and plays a role in phase I vasodilation. J Surg Res. 2006;134:335–341. doi: 10.1016/j.jss.2006.01.028. [DOI] [PubMed] [Google Scholar]
- 32.Morrell NW. Pulmonary hypertension due to BMPR2 mutation: a new paradigm for tissue remodeling? Proc Am Thorac Soc 3: 680–686, 2006. 33. Moudgil R, Michelakis ED, Archer SL. Hypoxic pulmonary vasoconstriction. J Appl Physiol. 2005;98:390–403. doi: 10.1513/pats.200605-118SF. [DOI] [PubMed] [Google Scholar]
- 34.Murphy DA, Makonnen S, Lassoued W, Feldman MD, Carter C, Lee WM. Inhibition of tumor endothelial ERK activation, angiogenesis, and tumor growth by sorafenib (BAY43-9006) Am J Pathol. 2006;169:1875–1885. doi: 10.2353/ajpath.2006.050711. [DOI] [PMC free article] [PubMed] [Google Scholar]
- 35.Nagaya N, Yokoyama C, Kyotani S, Shimonishi M, Morishita R, Uematsu M, Nishikimi T, Nakanishi N, Ogihara T, Yamagishi M, Miyatake K, Kaneda Y, Tanabe T. Gene transfer of human prostacyclin synthase ameliorates monocrotaline-induced pulmonary hypertension in rats. Circulation. 2000;102:2005–2010. doi: 10.1161/01.cir.102.16.2005. [DOI] [PubMed] [Google Scholar]
- 36.Nana-Sinkam P, Oyer RJ, Stearman RS, Sotto-Santiago S, Moore MD, Bull TM, Grady MC, Choudhery Q, Nemenoff RA, Lane K, Loyd JE, Geraci MW. Prostacyclin synthase promoter regulation and familial pulmonary arterial hypertension. Chest. 2005;128:612S. doi: 10.1378/chest.128.6_suppl.612S. [DOI] [PubMed] [Google Scholar]
- 37.Nathan P, Chao D, Brock C, Savage P, Harries M, Gore M, Eisen T. The place of VEGF inhibition in the current management of renal cell carcinoma. Br J Cancer. 2006;94:1217–1220. doi: 10.1038/sj.bjc.6603025. [DOI] [PMC free article] [PubMed] [Google Scholar]
- 38.Neufeld G, Cohen T, Gengrinovitch S, Poltorak Z. Vascular endothelial growth factor (VEGF) and its receptors. FASEB J. 1999;13:9–22. [PubMed] [Google Scholar]
- 39.Nonas SA, Moreno-Vinasco L, Ma SF, Jacobson JR, Desai AA, Dudek S, Flores C, Hassoun PM, Sam L, Ye SQ, Moitra J, Barnard J, Grigoryev DN, Lussier YA, Garcia JG. Use of consomic rats for genomic insights into ventilator-associated lung injury. Am J Physiol Lung Cell Mol Physiol. 2007;293:L292–L302. doi: 10.1152/ajplung.00481.2006. [DOI] [PMC free article] [PubMed] [Google Scholar]
- 40.Parman C, Halling C. R package version 1.8.0. 2005. affyQCReport: QC report generation for Affy Batch objects. [Google Scholar]
- 41.Patterson KC, Weissmann A, Ahmadi T, Farber HW. Imatinib mesylate in the treatment of refractory idiopathic pulmonary arterial hypertension. Ann Intern Med. 2006;145:152–153. doi: 10.7326/0003-4819-145-2-200607180-00020. [DOI] [PubMed] [Google Scholar]
- 42.Rabinovitch M, Keane JF, Norwood WI, Castaneda AR, Reid L. Vascular structure in lung tissue obtained at biopsy correlated with pulmonary hemodynamic findings after repair of congenital heart defects. Circulation. 1984;69:655–667. doi: 10.1161/01.cir.69.4.655. [DOI] [PubMed] [Google Scholar]
- 43.Raiesdana A, Loscalzo J. Pulmonary arterial hypertension. Ann Med. 2006;38:95–110. doi: 10.1080/07853890600622143. [DOI] [PubMed] [Google Scholar]
- 44.Rini BI. Vascular endothelial growth factor-targeted therapy in renal cell carcinoma: current status and future directions. Clin Cancer Res. 2007;13:1098–1106. doi: 10.1158/1078-0432.CCR-06-1989. [DOI] [PubMed] [Google Scholar]
- 45.Rini BI, Rathmell WK. Biological aspects and binding strategies of vascular endothelial growth factor in renal cell carcinoma. Clin Cancer Res. 2007;13:741s–746s. doi: 10.1158/1078-0432.CCR-06-2110. [DOI] [PubMed] [Google Scholar]
- 46.Sakao S, Taraseviciene-Stewart L, Cool CD, Tada Y, Kasahara Y, Kurosu K, Tanabe N, Takiguchi Y, Tatsumi K, Kuriyama T, Voelkel NF. VEGF-R blockade causes endothelial cell apoptosis, expansion of surviving CD34+ precursor cells and transdifferentiation to smooth muscle-like and neuronal-like cells. FASEB J. 2007;21:3640–3652. doi: 10.1096/fj.07-8432com. [DOI] [PubMed] [Google Scholar]
- 47.Sakao S, Taraseviciene-Stewart L, Lee JD, Wood K, Cool CD, Voelkel NF. Initial apoptosis is followed by increased proliferation of apoptosis-resistant endothelial cells. FASEB J. 2005;19:1178–1180. doi: 10.1096/fj.04-3261fje. [DOI] [PubMed] [Google Scholar]
- 48.Schermuly RT, Dony E, Ghofrani HA, Pullamsetti S, Savai R, Roth M, Sydykov A, Lai YJ, Weissmann N, Seeger W, Grimminger F. Reversal of experimental pulmonary hypertension by PDGF inhibition. J Clin Invest. 2005;115:2811–2821. doi: 10.1172/JCI24838. [DOI] [PMC free article] [PubMed] [Google Scholar]
- 49.Shibuya M. Vascular endothelial growth factor (VEGF)-receptor 2: its biological functions, major signaling pathway, and specific ligand VEGF-E. Endothelium. 2006;13:63–69. doi: 10.1080/10623320600697955. [DOI] [PubMed] [Google Scholar]
- 50.Singleton PA, Dudek SM, Chiang ET, Garcia JG. Regulation of sphingosine 1-phosphate-induced endothelial cytoskeletal rearrangement and barrier enhancement by S1P1 receptor, PI3 kinase, Tiam1/Rac1, and alpha-actinin. FASEB J. 2005;19:1646–1656. doi: 10.1096/fj.05-3928com. [DOI] [PubMed] [Google Scholar]
- 51.Stenmark KR, McMurtry IF. Vascular remodeling versus vasoconstriction in chronic hypoxic pulmonary hypertension: a time for reappraisal? Circ Res. 2005;97:95–98. doi: 10.1161/01.RES.00000175934.68087.29. [DOI] [PubMed] [Google Scholar]
- 52.Strumberg D, Clark JW, Awada A, Moore MJ, Richly H, Hendlisz A, Hirte HW, Eder JP, Lenz HJ, Schwartz B. Safety, pharmacokinetics, and preliminary antitumor activity of sorafenib: a review of four phase I trials in patients with advanced refractory solid tumors. Oncologist. 2007;12:426–437. doi: 10.1634/theoncologist.12-4-426. [DOI] [PubMed] [Google Scholar]
- 53.Strumberg D, Seeber S. Raf kinase inhibitors in oncology. Onkologie. 2005;28:101–107. doi: 10.1159/000083373. [DOI] [PubMed] [Google Scholar]
- 54.Taraseviciene-Stewart L, Kasahara Y, Alger L, Hirth P, Mc Mahon G, Waltenberger J, Voelkel NF, Tuder RM. Inhibition of the VEGF receptor 2 combined with chronic hypoxia causes cell death-dependent pulmonary endothelial cell proliferation and severe pulmonary hypertension. FASEB J. 2001;15:427–438. doi: 10.1096/fj.00-0343com. [DOI] [PubMed] [Google Scholar]
- 55.Team RDC. R: A Language and Environment for Statistical Computing. Vienna: R Foundation for Statistic Computing; 2005. [Google Scholar]
- 56.Tuder RM, Chacon M, Alger L, Wang J, Taraseviciene-Stewart L, Kasahara Y, Cool CD, Bishop AE, Geraci M, Semenza GL, Yacoub M, Polak JM, Voelkel NF. Expression of angiogenesis-related molecules in plexiform lesions in severe pulmonary hypertension: evidence for a process of disordered angiogenesis. J Pathol. 2001;195:367–374. doi: 10.1002/path.953. [DOI] [PubMed] [Google Scholar]
- 57.Tusher VG, Tibshirani R, Chu G. Significance analysis of microarrays applied to the ionizing radiation response. Proc Natl Acad Sci USA. 2001;98:5116–5121. doi: 10.1073/pnas.091062498. [DOI] [PMC free article] [PubMed] [Google Scholar]
- 58.Veronese ML, Mosenkis A, Flaherty KT, Gallagher M, Stevenson JP, Townsend RR, O’Dwyer PJ. Mechanisms of hypertension associated with BAY 43-9006. J Clin Oncol. 2006;24:1363–1369. doi: 10.1200/JCO.2005.02.0503. [DOI] [PubMed] [Google Scholar]
- 59.Voelkel NF, Tuder RM. Severe pulmonary hypertensive diseases: a perspective. Eur Respir J. 1999;14:1246–1250. doi: 10.1183/09031936.99.14612469. [DOI] [PubMed] [Google Scholar]
- 60.Welsh DJ, Peacock AJ, MacLean M, Harnett M. Chronic hypoxia induces constitutive p38 mitogen-activated protein kinase activity that correlates with enhanced cellular proliferation in fibroblasts from rat pulmonary but not systemic arteries. Am J Respir Crit Care Med. 2001;164:282–289. doi: 10.1164/ajrccm.164.2.2008054. [DOI] [PubMed] [Google Scholar]
- 61.Welsh DJ, Scott P, Plevin R, Wadsworth R, Peacock AJ. Hypoxia enhances cellular proliferation and inositol 1,4,5-triphosphate generation in fibroblasts from bovine pulmonary artery but not from mesenteric artery. Am J Respir Crit Care Med. 1998;158:1757–1762. doi: 10.1164/ajrccm.158.6.9706054. [DOI] [PubMed] [Google Scholar]
- 62.Wilhelm S, Carter C, Lynch M, Lowinger T, Dumas J, Smith RA, Schwartz B, Simantov R, Kelley S. Discovery and development of sorafenib: a multikinase inhibitor for treating cancer. Nat Rev. 2006;5:835–844. doi: 10.1038/nrd2130. [DOI] [PubMed] [Google Scholar]
- 63.Wilhelm SM, Carter C, Tang L, Wilkie D, McNabola A, Rong H, Chen C, Zhang X, Vincent P, McHugh M, Cao Y, Shujath J, Gawlak S, Eveleigh D, Rowley B, Liu L, Adnane L, Lynch M, Auclair D, Taylor I, Gedrich R, Voznesensky A, Riedl B, Post LE, Bollag G, Trail PA. BAY 43-9006 exhibits broad spectrum oral antitumor activity and targets the RAF/MEK/ERK pathway and receptor tyrosine kinases involved in tumor progression and angiogenesis. Cancer Res. 2004;64:7099–7109. doi: 10.1158/0008-5472.CAN-04-1443. [DOI] [PubMed] [Google Scholar]
- 64.Wu Z, Irizarry RA, Gentleman R, Murillo FM, Spencer F. A model based background adjustment for oligonucleotide expression arrays. J Am Stat Assn. 2004;99:909–917. [Google Scholar]
Associated Data
This section collects any data citations, data availability statements, or supplementary materials included in this article.