

Abstract
Mucus clearance is the primary defense mechanism that protects airways from inhaled infectious and toxic agents. In the current Gel-on-Liquid mucus clearance model mucus gel is propelled on top of a “watery” periciliary layer surrounding the cilia. However, this model fails to explain the formation of distinct mucus layer in health or why mucus clearance fails in disease. We propose a Gel-on-Brush model in which the periciliary layer is occupied by membrane spanning mucins and mucopolysaccharides densely tethered to the airway surface. This brush prevents mucus penetration into the periciliary space and causes mucus to form a distinct layer. The relative osmotic moduli of the mucus and periciliary brush layers explain both the stability of mucus clearance in health and its failure in airway disease.
Mucus clearance in the mammalian lung has evolved to trap and clear a wide variety of inhaled toxicants and infectious agents from airway surfaces (1–3). The system consists of two components (4, 5): (1) a mucus layer, that traps inhaled particles and transports them out of the lung by cilia-generated forces; and (2) a periciliary layer (PCL) that provides a favorable environment for ciliary beating and cell surface lubrication (Fig. 1A). The importance of mucus clearance is illustrated by its failure in human lung diseases, including chronic obstructive pulmonary disease (COPD) (6) and cystic fibrosis (CF) (7). Both diseases are characterized by “dehydrated” airway mucus, with mucin and globular protein concentrations several times higher than in normal mucus (8, 9). Despite studies linking increased mucus concentration to the pathogenesis of airway disease, e.g., via reduced rates of mucus clearance (10), inflammation (11), and infection (12), quantitative models are needed to predict when mucus clearance fails and to develop therapies to treat this aspect of lung disease (13, 14). A predictive airway surface clearance model requires an accurate description of the PCL structure and an understanding of the functional interactions between the PCL and the overlaying mucus layer.
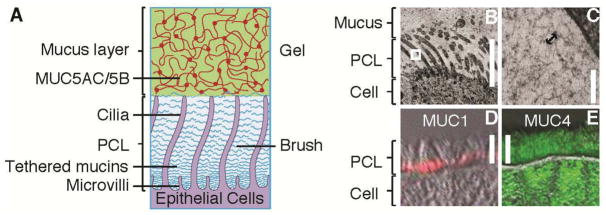
Fig. 1. The periciliary layer is not a simple liquid layer.

(A) Light microscopy view of the airway surface layer, comprising the mucus layer and the periciliary layer (PCL). HBE cultures were fixed with Osmium Tetraoxide in perfluorocarbon, Epon-embedded, and stained with Richardson’s (42). Scale bar = 7 μm. (B) Schematic representation of the traditional Gel-on-Liquid model showing a mucus layer (comprised of gel-forming mucins, MUC5AC and MUC5B) and the PCL being a liquid-filled domain. (C) Schematic illustration showing penetration of small (d ≈ 6 nm (43)) fluorescently-labeled albumin (green) into the PCL, whereas 40 nm polystyrene particles (red) are completely excluded from the PCL. The experiments were performed after thorough washings that remove mucus, leaving solely the clean PCL, to avoid possible trapping of these particles by the mucus (44, 45). (D, E) Representative XZ confocal images of well-differentiated HBE cultures with (D) normally beating cilia and (E) paralyzed, i.e., immobile, cilia (pre-treated for 10 minutes with 1% isoflurane to produce reversible ciliastasis (46)). Here, the exclusion zone (green region) was accessible to the green albumin, but not the larger particles, while the yellow region was accessible to both. Note: the wavy streaks in image (D) are an artifact of beating cilia during image acquisition. Scale bars = 7 μm.
Based on light microscopy view of the airway surface (e.g., Fig. 1A) and the presumed requirement for a low viscosity liquid layer to facilitate ciliary beating, the mucus clearance system has been represented by a two-layer Gel-on-Liquid model (15–19) (Fig. 1B). In this model a “gel-like” mucus layer is propelled by cilia beating in a “watery” periciliary, i.e. “sol”, layer (20). However, the current Gel-on-Liquid model does not explain why there are two layers. For instance, it does not explain why the major macromolecules (21–25) of the mucus layer, MUC5AC and MUC5B with hydrodynamic radii of ~150–200 nm (26, 27), do not penetrate into the ~200 nm interciliary space to form a single layer. In fact, this 200 nm interciliary space is impenetrable even to objects significantly smaller than mucins, including fluorescent beads with diameter of 40 nm (Fig. 1C, D). It has been proposed that impenetrability of the interciliary space is due to the thixotropic actions of beating cilia (15, 28). However, our observation that 40 nm particles are also excluded from the PCL when cilia beating was arrested, argues against this explanation (Fig. 1E). Collectively, these data demonstrate that the Gel-on-Liquid model of a two-layered airway surface is qualitatively incorrect.
Gel-on-Brush Model of the Airway Surface
We propose an alternative Gel-on-Brush model of the mucus clearance system. In this model, the PCL is occupied by membrane-spanning mucins and large mucopolysaccharides that are tethered to cilia, microvilli, and epithelial surface (Fig. 2A) (29). We postulate that these tethered macromolecules form an extracellular brush with a sufficiently high concentration to establish a mesh that prevents both MUC5AC/B mucins in the mucus layer and inhaled particles deposited on the airway surface from penetrating the PCL. We also predict that the relatively high concentration of membrane-tethered macromolecules in this extracellular brush produces inter-molecular repulsion within this layer, which stabilizes the PCL against compression by an osmotically active mucus layer. Stabilization of the PCL is required for formation of the distinct mucus layer and for the effective mucus clearance. In contrast, dehydration-induced destabilization of this two-layer system produces failure of clearance. Thus, the Gel-on-Brush model both describes the cell biological basis of the two layers and the biophysical interactions between these layers that control mucus clearance. The following experiments test the key aspects of the new model.
Fig. 2. Gel-on-Brush model of the PCL.
(A) Schematic representation of the Gel-on-Brush hypothesis of the periciliary layer: tethered macromolecules, such as membrane-bound mucins, form a brush-like structure of the PCL. (B, C) Morphological evidence for the Gel-on-Brush model is revealed by rapid freeze imaging of HBE cultures exhibiting extensive mesh-like structure with mesh (depicted by the arrow in (C)) on the order of ~ 20–40 nm in the PCL. Immunological evidence showing the presence of tethered mucins on freshly excised human airway tissue: (D) MUC1 (red) is located at the bottom of the PCL; (E) MUC4 (green) spans the whole PCL. Scale bars in (B, D, E) = 7 μm, bar in (C) = 100 nm, double-head arrow in (C) = 30 nm. White box in (B) denotes area of magnification.
Evidence for a macromolecular mesh in the PCL
Utilizing rapid freezing techniques coupled with electron microscopy, an electron-dense meshwork with apparent mesh size on the order of ~ 20–40 nm was observed in the PCL region of human bronchial epithelial (HBE) cell cultures (Fig. 2B, C). Unlike the overlying mucus layer, this PCL mesh could not be extracted by vigorous washings expected to remove adherent secreted mucins. We, therefore, hypothesized that the PCL mesh consists of large macromolecules, such as membrane-spanning mucins (MUC1, MUC4, MUC16, and MUC20 (29, 30)) and tethered mucopolysaccharides (e.g., heparin sulfate (31)). Immunohistochemistry studies of freshly excised human airways identified several of these membrane-tethered macromolecules, including mucins MUC1 (Fig. 2D) and MUC4 (Fig. 2E) and heparin sulfate (not shown), attached to cilia, microvilli, and the cell surface of conducting airways.
Mesh size of the PCL
Mesh size is a parameter that describes important physical properties of polymer solutions, gels, and brushes, including their permeability to particles/macromolecules and their osmotic pressure. In polymer physics, the mesh size, called correlation length ξ, is defined as the average distance between nearest segments of neighboring macromolecules (32). Images of the PCL generated from the rapid fixation/EM approach (Fig. 2B, C) may not provide reliable values of mesh size due to fixation and staining artifacts. Therefore, a technique was developed to quantify the PCL mesh size in living HBE cultures. This technique is based on the partitioning concept that as probes of size d enter the PCL layer from dilute solutions (32), they are repelled by crowded tethered macromolecules within the PCL and have to pay a free energy penetration price, F ≈ kBT(d/ξ)γ (where γ = 2 for polymers and γ = 3 for particles, kB is Boltzmann constant and T is absolute temperature; Supplementary Text). Note that scaling prefactors on the order of unity have been omitted from this and following equations. The partition coefficient P(d) of probes of size d, defined as the ratio of concentration of the probes in the PCL to their concentration in the dilute solution outside the PCL, is the Boltzmann weight corresponding to this free energy penalty: P(d) = exp(−F/kBT) ≈ exp(−[d/ξ(z)]γ). ξ(z) in this expression describes variations of mesh sizes ξ in the PCL with distance z from the cell surface. Since an exponential is a rapidly varying function, this expression can be approximated by a step function (33), with a simple interpretation that probe molecules or particles penetrate the PCL from dilute solutions down to the depth z(d) at which the probe size (d) is equal to the mesh size (ξ) (Fig. 3A). Within this step function approximation, the depth profile of mesh sizes z(ξ) is identical to the exclusion profile z(d). More rigorous analyses accounting for both the exponential form of the partition coefficient and the polydispersity of probe molecules led only to a small correction in the depth profile of mesh sizes z(ξ) (Supplementary Text; fig. S2; table S1).
Fig. 3. Size exclusion gradient in the PCL.

(A) Schematic illustration of the two-dye technique used to probe the mesh size distribution within the PCL. Insert: probe molecules are expected to penetrate part of the PCL down to a distance z from the cell surface at which the PCL mesh size ξ is on the order of molecular diameter d. (B) Representative XZ-confocal images of: small (d ≈ 2 nm) dextran fluorescently labeled with Texas Red exploring the whole PCL; green dextran with hydrodynamic diameter d ≈ 40 nm, labeled by FITC; merged image showing the exclusion thickness z defined as the height of the red region bounded by the cell layer (black due to lack of staining) and the yellow (green + red) layer; exclusion of dextran molecules with decreasing sizes. Scale bars = 7 μm. (C) Exclusion for dilute solution of polystyrene beads with diameter d = 40 nm added to unwashed cultures, washed 3 times with PBS, washed (15 min) with 10 mM Dithiothreitol (DTT), to completely remove all mucus and adsorbed macromolecules from the cell surface (34). Data are shown as mean ± SD with the number of samples (patients) n = 3. Measurement of each sample contains 5 HBE cultures, with > 50 confocal images per culture. (D) Summary plot showing the dependence of exclusion thickness z on the size of dextran molecules (green circles). The exclusion of fluorescently labeled 20 and 40 nm polystyrene particles (red squares) are added for comparison. Data points are mean ± SD (n = 3–5). Solid curve is the best fit to the data by an empirical equation: z(d) ≈ 7μm[1−exp(−d/15nm)], and dash-dotted line at 7 μm represents the height of the outstretched cilia.
The PCL exclusion profile z(d) was measured by two-color fluorescent imaging of two probes of well-defined sizes: 1) “large” green fluorescent dextran molecules of hydrodynamic diameter d and 2) “small” red fluorescent dextran molecules. A mixture of these red and green molecules was applied in dilute solutions to HBE cultures washed free of the overlying mucus layer (Fig. 3B). The small (d ≈ 2 nm) Texas red fluorescently labeled dextrans completely penetrated the PCL and reached the cell surface (Fig. 3B, left), as evidenced by the complete overlap of the fluorescence profile with that of a sub-nanometer dye, Rhodamine 110 (fig. S4). In contrast, fractionated large green fluorescein isothiocyanate (FITC)-labeled dextran molecules with d ≈ 40 nm, were excluded from the PCL (Fig. 3B). The exclusion zone z(d), defined as the part of the PCL accessible to small dextrans but not to large ones, had a height z ≈ 6.5 μm, close to the height of outstretched cilia. The yellow region above the exclusion zone represents the region accessible to both large (green) and small (red) dextrans. The 6.5 μm exclusion zone is in agreement with the results using the 40 nm fluorescent beads (Fig. 1C–E). Importantly, this exclusion persisted after extensive washing of the cell surface in the absence or presence of a reducing agent (10 mM Dithiothreitol), sufficient to remove adsorbed macromolecules, including the gel-forming mucins (34) (Fig. 3C). Thus, these findings confirm the main hypothesis of our Gel-on-Brush model that the PCL is occupied by macromolecules that are strongly tethered to the cell surface. Furthermore, these tethered macromolecules are at sufficiently high concentrations to produce a ‘tight’ mesh with a maximum size ξ of ~ 40 nm (fig. S3), which prevents the 40 nm dextran and beads from penetrating the PCL (Fig. 1C, 3B).
By systematically changing the size d of the green probes and measuring their depth of penetration into the PCL, variations of the exclusion thickness z(d) for probes of varying size d were observed. This variation is consistent with a PCL macromolecular mesh that becomes “tighter” towards the cell surface (Fig. 3B, D; fig. S5). This PCL gradient mesh likely functions as a permeability barrier to prevent penetration of small infectious agents (e.g., Influenza A with d ≈ 80–120 nm (35)) to the cell surface.
Osmotic modulus of the mucus layer and PCL
In addition to forming a permeability barrier (36), the Gel-on-Brush model predicts that the densely tethered macromolecules within the PCL repel each other and thus generate osmotic pressure that regulates the hydration of the PCL. The rate of osmotic pressure variation with polymer concentration (c) defines the osmotic modulus (K), a parameter that quantifies the hydration (water-drawing) power of the system: K=c(∂π/∂c).
Utilizing a modified osmometer (37) incorporating a membrane permeable to ions and small proteins, we measured the osmotic pressure and calculated the osmotic modulus of the mucus layer on HBE cultures with concentrations spanning from normal to “abnormally” high values (fig. S1). The osmotic modulus (K) of the mucus layer strongly increased with mucus concentration, from 200 Pa at normal mucus concentrations (10) (roughly 0.01 g/ml, which is equivalent to ~ 2% solids (38)) to 3,000–8,000 Pa for severely dehydrated (concentrated) mucus in ranges reported in CF patients (> 0.07 g/ml, i.e. > 8% solids (10, 39)).
We measured the PCL osmotic modulus by exposing washed HBE cultures to solutions containing very large (d > 50 nm) PCL-impenetrable polymers of varying concentrations and, hence, osmotic moduli (Fig. 4). Similar to the PCL penetration experiments (Fig. 3), measurements of PCL osmotic moduli were performed utilizing a two-fluorescent-probe technique. Unlike the PCL penetration experiments, only the concentration of the large green dextrans, and hence the osmotic modulus of the test solution, was varied.
Fig. 4. Osmotic compression of the PCL-brush by mucus and mucus simulants.

(A) Representative XZ-confocal images showing progressive compression of the PCL brush by large dextran molecules (d > 50 nm) of increasing osmotic moduli. Scale bars = 7 μm. (B) Summary data of the exclusion thickness (z) of the large dextran molecules (green circles) and endogenous mucus (red squares) versus their osmotic moduli. Data points are mean ± SD (n = 3–5). Dashed black line represents the best linear fit to the dependence of PCL height on the logarithm of osmotic modulus of mucus/mucus simulants for z < 6 μm: z ≈ 7μm − 3.15Log(K/340Pa). The highlighted region represents the osmotic modulus of a fully-hydrated (healthy) PCL, K0 ≈ 300±60 Pa, above which noticeable decrease of the PCL height was observed.
Solutions containing large dextrans with osmotic moduli smaller/comparable to the modulus of normal mucus (K ≈ 200 Pa) did not affect the height of the PCL (Fig. 4A, B). Only when K of the dextran solution exceeded ~ 300 Pa, did the PCL begin to compress, as evidenced by the decrease in the exclusion height. Therefore, 300 Pa represents the osmotic modulus of a fully-hydrated (healthy) PCL (K0) (Fig. 4B – grey zone). Exposure to a higher concentration of dextran with a K ~ 4,000 Pa resulted in a significant collapse of the PCL (Fig. 4A, B).
The probe penetration experiments described above (Fig. 3) identified a gradient of mesh sizes ξ(z) in the PCL, strongly suggesting that the grafting density of macromolecules tethered to cilia increases towards the cell surface. Based on this observation, we predicted that the repulsion between these macromolecules, and therefore, the osmotic modulus of the PCL would also increase towards the cell surface. Indeed, the exclusion zone for the probes was observed to decrease systematically as a function of the osmotic modulus K of the mucus simulants (green circles, Fig. 4B). These findings were validated by the experiments in which the PCL was compressed by endogenous mucus at various concentrations (and osmotic moduli) (red squares, Fig. 4B). Note that mucus with high concentrations, mimicking those found in immobile airway secretions from diseased lungs such as CF (i.e. > 0.07 g/ml (10, 39) with K > 3,000 Pa), removed sufficient water from the PCL to cause its collapse (Fig. 4A, B).
These data suggest that the Gel-on-Brush model accurately describes the forces that govern hydration of airway surfaces. The model predicts that water distributes between the two airway surface layers, i.e., the mucus layer and PCL, according to their relative osmotic moduli (Fig. 5). The layer with a lower osmotic modulus changes its concentration more readily than the layer with the higher osmotic modulus. This relationship is analogous to the deformation of a pair of springs connected in series (Fig. 5B). Upon deformation of the pair, the softer spring (with lower modulus) deforms more than the stiffer one. Because the PCL is a “constrained” (tethered) system, its concentration saturates upon hydration and, therefore, it has a “minimal” osmotic modulus (K0) when the PCL is fully hydrated. In contrast, since the mucus layer is under no such constraint, its osmotic modulus can become very small upon extensive hydration. As a result, liquid added to the hydrated/healthy airway surface preferentially enters the mucus layer, leaving the PCL unchanged (Fig. 5A). Conversely, when the airway surface is dehydrated, liquid is drawn first from the mucus layer, increasing its concentration and, therefore, osmotic modulus. As the osmotic modulus of the mucus layer exceeds K0 of the PCL, water is extracted from both layers, increasing their concentrations and osmotic moduli, resulting in compression of the PCL (Fig. 5C). Thus, the Gel-on-Brush model posits that 1) for health, the osmotic modulus (K0 of the PCL must be larger than that of the mucus layer (Fig. 5B) to ensure the required hydration and lubricating properties of the PCL, for normal mucus clearance; and 2) in disease, strong dehydration of the airway surface produces a mucus layer osmotic modulus (Kmucus) that significantly exceeds K0 of the healthy PCL, collapsing the PCL and slowing/abolishing mucus clearance (Fig. 5C).
Fig. 5. (A – C) Schematic illustration showing the effects of the relative water-drawing powers of the mucus gel and the PCL.
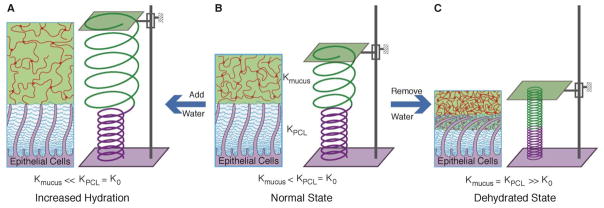
(B), Normal state: the osmotic modulus of normal mucus is smaller than that of the PCL, represented by a green spring (Kmucus) with diameter larger than a purple spring (KPCL=K0). The volume of water in the system is depicted by the fixed distance between two plates. (A), Increased hydration: water added to the healthy airway surface (distance between plates increased) with Kmucus < K0 preferentially enters and thus dilutes the mucus layer, leaving the PCL unchanged. The resulting osmotic modulus of the mucus layer is much smaller than that of the PCL (Kmucus ≪ K0). This state is depicted by increase length and diameter of the green spring with no change in the purple spring. (C), Dehydrated state (plates close to each other): as water is removed it first preferentially leaves the mucus gel due to its lower osmotic modulus. Further dehydration leads to removal of water from both the mucus gel and the PCL. The moduli of both layers are increased and equal, represented by smaller diameters of shortened springs. This state corresponds to diseased airways (COPD, CF).
There are contrasting scenarios for PCL collapse upon osmotic compression that have important implications for cilia beating dynamics and mechanisms of mucus adhesion to the airway surface. For example, one possibility is that the tethered macromolecular brush is compressed against “extended” cilia upon exposure to dehydrated mucus or mucus simulants with high osmotic moduli, allowing penetration of mucus into the interciliary space (Fig. 6A). This scenario is expected if cilia are elastically stiffer than the surrounding brush of tethered macromolecules and dehydrated mucus. An alternative possibility is that the cilia are compressed towards the epithelial surface (Fig. 6B). To distinguish between these two possibilities, bright-field microscopy of HBE cultures mounted in profile was utilized to directly measure the maximal height of the cilia during the exposure to solutions of varying osmotic moduli. Large dextran (d > 50 nm) or agarose (d ≈ 44 nm) solutions with osmotic moduli < 800 Pa had negligible effects on the height of the cilia (Fig. 6C and points to the left of the highlighted zone in Fig. 6E). However, cilia height decreased significantly with increasing solution osmotic moduli (Fig. 6D and points to the right of the highlighted zone in Fig. 6E). The value of 800 Pa represents the minimum osmotic modulus (Kcc) required to compress the cilia. With exposure to solutions with K > Kcc, the cilia still beat within this restricted space, but not at their full height. These data, coupled with dye measurements of K0 (see Fig. 4), suggest that with moderate increases in osmotic modulus of the overlaying polymer layer, e.g., between K0 = 300 Pa and Kcc = 800 Pa, there was compression of the brush towards the cilia. Polymer solutions with higher osmotic moduli caused cilia to collapse. Experiments with HBE mucus (red squares, Fig. 6E) revealed that mucus with osmotic modulus K = 5,700 Pa, similar to that observed in CF, also produced complete ciliary collapse. Based on these data, it is apparent that airway cilia do not exhibit sufficient stiffness to resist osmotic collapse during severe airway surface dehydration (Supplementary Text).
Fig. 6. Collapse of cilia by mucus and mucus simulants.

Possible scenarios for the compression of the PCL brush by mucus or mucus simulants with high osmotic modulus (concentration): (A) tethered macromolecules are compressed towards the cilia surface without significant deformation of the cilia in comparison to the uncompressed PCL brush in Fig. 2A; (B) in addition to the compressed tethered macromolecules, the cilia are also deformed by solutions with high osmotic modulus; (C, D) Representative bright-field microscopy images showing the effects of low (C; ~ 300 Pa) and high (D; ~ 5,000 Pa) osmotic moduli of agarose on cilia height from HBE cultures (viewed in profile). White bars denote the length of fully extended cilia (7 μm). (E) Summary plot of the cilia height versus the osmotic moduli of the overlying mucus/mucus simulants, using large, PCL-impermeable dextran (d > 50 nm; green solid circles), low-melting point agarose (d ≈ 44 nm; blue solid diamonds), endogenous mucus (red solid squares), and small PCL permeable dextran (d ≈ 2 nm; black empty circles). Data points are mean ± SD (n = 3–5). Note that the PCL-permeant 2 nm dextran did not alter the height of the cilia. “C” and “D” above the x-axis represent conditions illustrated above. Solid green line represents the best linear fit to the dependence of cilia height on the logarithm of osmotic modulus of mucus/mucus simulants for K > 1,000 Pa: z ≈ 7μm − 3.33Log(K/807Pa). Dependence of the exclusion zone z(K) on osmotic modulus of mucus/mucus simulants (Fig. 4B) is shown for comparison by the dashed black line. Highlighted zone represents the crossover osmotic modulus, Kcc ≈ 800±120 Pa, above which noticeable decrease of the cilia height was observed.
The interface between the mucus layer and the PCL brush is semipermeable. Thus only the large macromolecules that cannot penetrate the mesh of the opposing layer, and not the freely permeant salts and small globular proteins, generate the “partial” osmotic pressures/moduli that govern water distribution between the two layers. To test this prediction, HBE cultures were exposed to luminal solutions containing small dextrans (d ≈ 2 nm) with varying concentrations, and thus, ‘total’ osmotic moduli. These small dextrans freely enter into the PCL, and hence, are predicted not to produce osmotic compression of the PCL brush. Indeed, no changes in the cilia height were observed, even for solutions of small dextrans producing osmotic moduli exceeding 15,000 Pa (empty circles, Fig. 6E). Based on these findings, we conclude that it is the large macromolecules in the mucus layer (e.g., secreted mucins which cannot penetrate the PCL) that are the ‘partially’ osmotically active molecules with respect to the PCL brush.
Conclusion
The Gel-on-Brush model postulates that the densely tethered macromolecules occupy periciliary layer, stabilizing the two-layer mucus clearance system by preventing mucus from penetrating the interciliary space. The PCL brush controls the distribution of water between the two layers required for normal mucus clearance. For example, the Gel-on-Brush model predicts that the normal mucus layer, with a partial osmotic modulus (~ 200 Pa) lower than the minimal modulus of the PCL (K0 ≈ 300 Pa), acts as a reservoir for water in healthy airways, ensuring efficient clearance over a range of airway surface dehydration states (10). If the airway surface is sufficiently dehydrated that the partial osmotic modulus of the mucus layer exceeds K0, mucus layer compresses the PCL brush and cilia, slowing down and eventually stopping mucus clearance observed in disease, e.g., CF (7). The resulting immobile mucus forms a nidus for inflammation and bacterial infections (40, 41), leading to chronic lung disease associated with CF and COPD. The increase in the partial osmotic modulus of the mucus layer can reflect either a decrease in the amount of solvent (water), e.g., in CF (7), or an increase in amount of secreted mucins, e.g., in COPD (6). Therefore, the Gel-on-Brush model has the capacity to unify the pathogenesis of human airway diseases that have in common mucus stasis, inflammation, and infection.
Supplementary Material
Acknowledgments
Funding for this work was provided by Cystic Fibrosis Foundation grants BUTTON07XX0 (to B.B.), BUTTON11G0 (to B.B.), RUBIN09XX0 (to M.R.), and R026-CRII (to R.C.B.), the National Science Foundation grants CHE-0911588, DMR-0907515, DMR-1121107, DMR-1122483, PHY11-25915 (in part), and CBET-0609087 (to M.R.), and the National Institutes of Health grants K01DK080847 (to B. B.), R01HL077546 (in part to M.R.), P50HL107168, P01HL34322, P01HL108808, P01HL110873-01, P50HL107168-01, P30DK065988, HHSN268200900020, and UL1-RR025747 (to R.C.B.), and R01HL103940 (to M.K.). We thank Dr. Sergey Panyukov and Dr. Ekaterina B. Zhulina for illuminating discussions, Ms. Lisa Brown for graphical and editorial assistance, Dr. Scott Randell for the human airway epithelial cells, Ms. Kimberly Burns for histology assistance, and Dr. Robert Tarran for use of the Leica SP5 confocal microscope.
Footnotes
M.R. conceived the study and B.B., L.-H.C., R.C.B., and M.R. designed the experiments. B.B. developed experimental approaches for the osmotic pressure measurements, and the PCL permeability and osmotic compression experiments. L.-H.C. prepared regents, and along with B.B. performed the PCL permeability and osmotic compression experiments. C.E. conducted the TEM and immunological experiments. M.K., D.B.H., and J.K.S. provided technical assistance in preparing reagents. M.R., L.-H.C., B.B., and R.C.B. discussed and analyzed the results. M.R. and R.C.B. supervised the whole study. B.B., L.-H.C., R.C.B., and M.R. wrote the paper.
The authors declare that they have no competing financial interests.
References and Notes
- 1.Fahy JV, Dickey BF. N Engl J Med. 2010;363:2233. doi: 10.1056/NEJMra0910061. [DOI] [PMC free article] [PubMed] [Google Scholar]
- 2.Quinton PM. Physiol Rev. 1999;79:S3. doi: 10.1152/physrev.1999.79.1.S3. [DOI] [PubMed] [Google Scholar]
- 3.Wine JJ, Joo NS. Proc Am Thorac Soc. 2004;1:47. doi: 10.1513/pats.2306015. [DOI] [PubMed] [Google Scholar]
- 4.Kaliner M, Marom Z, Patow C, Shelhamer J. J Allergy Clin Immun. 1984;73:318. doi: 10.1016/0091-6749(84)90403-2. [DOI] [PubMed] [Google Scholar]
- 5.Knowles MR, Boucher RC. J Clin Invest. 2002;109:571. doi: 10.1172/JCI15217. [DOI] [PMC free article] [PubMed] [Google Scholar]
- 6.Hogg JC, et al. New Engl J Med. 2004;350:2645. doi: 10.1056/NEJMoa032158. [DOI] [PubMed] [Google Scholar]
- 7.Boucher RC. Annu Rev Med. 2007;58:157. doi: 10.1146/annurev.med.58.071905.105316. [DOI] [PubMed] [Google Scholar]
- 8.Tarran R, et al. Mol Cell. 2001;8:149. doi: 10.1016/s1097-2765(01)00286-6. [DOI] [PubMed] [Google Scholar]
- 9.Clunes LA, et al. Faseb J. 2011;26:533. [Google Scholar]
- 10.Tarran R. Proc Am Thorac Soc. 2004;1:42. doi: 10.1513/pats.2306014. [DOI] [PubMed] [Google Scholar]
- 11.Mall M, Grubb BR, Harkema JR, O’Neal WK, Boucher RC. Nat Med. 2004;10:487. doi: 10.1038/nm1028. [DOI] [PubMed] [Google Scholar]
- 12.Matsui H, et al. P Natl Acad Sci USA. 2006;103:18131. doi: 10.1073/pnas.0606428103. [DOI] [PMC free article] [PubMed] [Google Scholar]
- 13.Boucher RC. Eur Respir J. 2004;23:146. doi: 10.1183/09031936.03.00057003. [DOI] [PubMed] [Google Scholar]
- 14.Wanner A, Salathe M, O’Riordan TG. Am J Respir Crit Care Med. 1996;154:1868. doi: 10.1164/ajrccm.154.6.8970383. [DOI] [PubMed] [Google Scholar]
- 15.Lucas AM, Douglas LC. Arch Otolaryngol. 1934;20:518. [Google Scholar]
- 16.Houtmeyers E, Gosselink R, Gayan-Ramirez G, Decramer M. Eur Respir J. 1999;13:1177. doi: 10.1034/j.1399-3003.1999.13e39.x. [DOI] [PubMed] [Google Scholar]
- 17.Kalhoff H. Eur J Clin Nutr. 2003;57:S81. doi: 10.1038/sj.ejcn.1601906. [DOI] [PubMed] [Google Scholar]
- 18.Smith DJ, Gaffney EA, Blake JR. Bull Math Biol. 2007;69:817. doi: 10.1007/s11538-006-9163-z. [DOI] [PubMed] [Google Scholar]
- 19.Iravani J, As van A. J Pathol. 1972;106:81. doi: 10.1002/path.1711060204. [DOI] [PubMed] [Google Scholar]
- 20.Hilding AC. Minn Med. 1967;50:915. [PubMed] [Google Scholar]
- 21.Rose MC. Am J Physiol. 1992;263:L413. doi: 10.1152/ajplung.1992.263.4.L413. [DOI] [PubMed] [Google Scholar]
- 22.Wickstrom C, Davies JR, Eriksen GV, Veerman ECI, Carlstedt I. Biochem J. 1998;334:685. doi: 10.1042/bj3340685. [DOI] [PMC free article] [PubMed] [Google Scholar]
- 23.Thornton DJ, Rousseau K, McGuckin MA. Annu Rev Physiol. 2008;70:459. doi: 10.1146/annurev.physiol.70.113006.100702. [DOI] [PubMed] [Google Scholar]
- 24.Kesimer M, Makhov AM, Griffith JD, Verdugo P, Sheehan JK. Am J Physiol Lung Cell Mol Physiol. 2010;298:L15. doi: 10.1152/ajplung.00194.2009. [DOI] [PMC free article] [PubMed] [Google Scholar]
- 25.Hovenberg HW, Davies JR, Carlstedt I. Biochem J. 1996;318:319. doi: 10.1042/bj3180319. [DOI] [PMC free article] [PubMed] [Google Scholar]
- 26.Sheehan JK, et al. Biochem J. 2000;347:37. [PMC free article] [PubMed] [Google Scholar]
- 27.Raynal BD, Hardingham TE, Thornton DJ, Sheehan JK. Biochem J. 2002;362:289. doi: 10.1042/0264-6021:3620289. [DOI] [PMC free article] [PubMed] [Google Scholar]
- 28.Widdicombe JH, Widdicombe JG. Respir Physiol. 1995;99:3. doi: 10.1016/0034-5687(94)00095-h. [DOI] [PubMed] [Google Scholar]
- 29.Hattrup CL, Gendler SJ. Annu Rev Physiol. 2008;70:431. doi: 10.1146/annurev.physiol.70.113006.100659. [DOI] [PubMed] [Google Scholar]
- 30.Finkbeiner WE, et al. Am J Physiol Lung Cell Mol Physiol. 2011;301:L402. doi: 10.1152/ajplung.00210.2010. [DOI] [PMC free article] [PubMed] [Google Scholar]
- 31.Monzon ME, Casalino-Matsuda SM, Forteza RM. Am J Respir Cell Mol Biol. 2006;34:135. doi: 10.1165/rcmb.2005-0256OC. [DOI] [PMC free article] [PubMed] [Google Scholar]
- 32.Rubinstein M, Colby RH. Polymer Physics. Oxford Univ. Press; Oxford: 2003. [Google Scholar]
- 33.Arfken GB, Weber HJ. Mathematical Methods for Physicists. 6. Elsevier; Boston: 2005. [Google Scholar]
- 34.Tarran R, Grubb BR, Gatzy JT, Davis CW, Boucher RC. J Gen Physiol. 2001;118:223. doi: 10.1085/jgp.118.2.223. [DOI] [PMC free article] [PubMed] [Google Scholar]
- 35.Zuckerman AJ, Banatvala JE, Pattison JR. In: Principles and Practice of Clinical Virology. 4. Wiley J, Sons Chichester, editors. 2000. [Google Scholar]
- 36.Lai SK, Wang YY, Hanes J. Adv Drug Deliv Rev. 2009;61:158. doi: 10.1016/j.addr.2008.11.002. [DOI] [PMC free article] [PubMed] [Google Scholar]
- 37.Kinsky MP, Milner SM, Button B, Dubick MA, Kramer GC. J Trauma: Inj, Infect, Crit Care. 2000;49:844. doi: 10.1097/00005373-200011000-00009. [DOI] [PubMed] [Google Scholar]
- 38.Materials and methods are available as supplementary materials on Science Online.
- 39.Matthews LW, Spector S, Lemm J, Potter JL. Am Rev Respir Dis. 1963;88:199. doi: 10.1164/arrd.1963.88.2.199. [DOI] [PubMed] [Google Scholar]
- 40.Baltimore RS, Christie CD, Smith GJ. Am Rev Respir Dis. 1989;140:1650. doi: 10.1164/ajrccm/140.6.1650. [DOI] [PubMed] [Google Scholar]
- 41.Worlitzsch D, et al. J Clin Invest. 2002;109:317. doi: 10.1172/JCI13870. [DOI] [PMC free article] [PubMed] [Google Scholar]
- 42.Schwab U, et al. Infect Immun. 2002;70:4547. doi: 10.1128/IAI.70.8.4547-4555.2002. [DOI] [PMC free article] [PubMed] [Google Scholar]
- 43.Jachimska B, Wasilewska M, Adamczyk Z. Langmuir. 2008;24:6866. doi: 10.1021/la800548p. [DOI] [PubMed] [Google Scholar]
- 44.Lai SK, et al. P Natl Acad Sci USA. 2007;104:1482. [Google Scholar]
- 45.Tang BC, et al. P Natl Acad Sci USA. 2009;106:19268. doi: 10.1073/pnas.0905998106. [DOI] [PMC free article] [PubMed] [Google Scholar]
- 46.Raphael JH, Selwyn DA, Mottram SD, Langton JA, O’Callaghan CO. Brit J Anaesth. 1996;76:116. doi: 10.1093/bja/76.1.116. [DOI] [PubMed] [Google Scholar]
Associated Data
This section collects any data citations, data availability statements, or supplementary materials included in this article.