

Abstract
The antibody repertoire is not uniform. Some variable, diversity and joining genes are used more frequently than others. Non-uniform usage can result from the rearrangement process, or from selection. In order to study how the antibody repertoire is selected, we analyzed one part of diversity generation that cannot be driven by the rearrangement mechanism: the reading frame usage of DH genes. We have used two high-throughput sequencing methodologies, multiple subjects and advanced algorithms to measure the DH reading frame usage in the human antibody repertoire. In most DH genes, a single reading frame is used predominantly, and inverted reading frames are practically never observed. The choice of a single DH reading frame is not limited to a single position of the DH gene. Rather, each DH gene participates in rearrangements of differing CDR3 lengths, restricted to multiples of three. In non-productive rearrangements, there is practically no reading frame bias, but there is still a striking absence of inversions. Biases in DH reading frame usage are more pronounced, but also exhibit greater inter-individual variation, in IgG+ and IgA+ than in IgM+ B cells. These results suggest that there are two developmental checkpoints of DH reading frame selection. The first occurs during VDJ recombination, when inverted DH genes are usually avoided. The second checkpoint occurs after rearrangement, once the BCR is expressed. The second checkpoint implies that DH reading frames are subjected to differential selection. Following these checkpoints, clonal selection induces a host specific DH reading frame usage bias.
Keywords: D gene, immunoglobulin, high-throughput, selection
Introduction
Antibodies are proteins produced by B cells. Antibodies consist of two H chains and two L chains. Antibody H chains and L chains consist of C and V regions, which are so named because they vary in their level of sequence diversity when different antibody molecules are compared. The V regions that encode the greatest diversity correspond to the regions in the antibody that are important for binding to a vast array of antigens. Antibody diversity is achieved through a series of somatic mechanisms that produce many different sequences but conserve genetic space. These diversification mechanisms include recombination of V, D and J gene segments (V(D)J recombination), junctional modifications between the rearranged gene segments, pairing of different H and L chains and somatic hypermutation (SHM) (reviewed in (1, 2)). V(D)J recombination occurs in an ordered and stage-specific fashion in the bone marrow, with H chain rearrangement producing a V region that contains juxtaposed VH, DH and JH gene segments.
The fate of the B cell depends in large part on the specificity of its BCR. Self-reactive B cells must be edited, killed or inactivated to maintain self-tolerance (3, 4). B cells that respond to pathogens are, instead, activated, clonally expanded and undergo differentiation into specialized effector cells. During an immune response, antibodies can undergo further sequence modification to optimize their effector functions (isotype switching from IgM to a different H chain constant region such as IgG or IgA, while keeping the same VH region). Antibodies of mature B cells can also undergo SHM. SHM, coupled with selection for the B cells that bind to a particular antigen with the highest affinity, results over time in the successive improvement in affinity for the antigen, a process termed affinity maturation.
Within the antibody V region, there are more conserved and more variable sequences referred to as framework regions and CDRs, respectively (5). The CDRs form loops that are important for antigen binding. Amongst the CDRs, CDR3 is the most hypervariable in sequence because it encompasses the junctions between the recombining VH, DH and JH gene segments. The position of DH in the sequence often brings it to the center of the antibody combining site. DH gene usage has been proposed to be different in autoimmunity (6). The addition and deletion of non-templated nucleotides at the junctions between the recombining gene segments allows the DH segment (which is flanked on one side by the VH gene segment and on the other by the JH gene segment) to be read in one of three forward facing reading frames (RFs). As long as the junctional modifications at the D-J side of the rearrangement return to the +1 RF in the JH gene segment, the rearrangement is potentially functional. Despite the availability of three forwards facing RFs, the usage of RFs is biased. For example, studies in mice (7, 8) have shown that there is selection against RFs containing a stop codon or charged residues (7–11). Other mechanisms, such as a Dμ-mediated suppression, have also been proposed to explain the preference for a single RF in mice (10–12).
In addition to the usage of up to three different forward RFs, DH rearrangement can occur by deletion or by inversion. Inversional rearrangements increase the number of potential RFs to 6 (three forward facing RFs and three reverse.) Rearrangements to all six possible DH RFs (DRF) have been reported in mice, and the use of inverted DRF has been described in autoimmune-prone strains of mice (13–16).
While the joining probability of VH, DH and JH may be affected by the structure of the locus and properties of the RAG complex, as well as by the dynamics of the rearrangement mechanism (e.g. editing (3, 17–19)), the DRF probability distribution, appears to be purely driven by selection, as we will show further herein. The usage of forward and inverted DRF, on the other hand, can be based on selection, but also on possible limitations imposed by the recombination signal (20). In humans, previous reports have claimed that essentially only forward RFs are used (21) and that there are practically no D-D fusions, findings that we will confirm more definitively herein (22–24).
Up until now, the analysis of DH gene sequences in humans has been limited to relatively few sequences. Because selection of antibodies is influenced by the VH gene used (25, 26), earlier studies in which only a few dozen rearrangements from different VHs were analyzed were insufficient to rigorously evaluate DH selection (which requires controlling for the VH gene used). A second difficulty is to precisely identify DH segments in rearranged antibody genes, which are often truncated due to exonucleolytic nibbling by non-homologous end-joining machinery that can ultimately remove practically the entire DH gene. Sometimes it is difficult to discern which nucleotides in the sequence are derived from the DH segment as opposed to those that result from junctional modifications or SHMs that target the CDR3 (e.g. (27, 28)). The confounding effects introduced by SHMs may reduce the reliability of DH segment identification in mature B cell populations. Some DH genes are more similar to each other than others, which means that DH identification fidelity depends not only upon the length of the DH germline sequence (11–37 bp), but also upon its degree of similarity to the other germline DH gene alleles. Finally, some DH genes are much more frequently used than others (see for example (29)). Thus, in a limited number of sequences, only the most abundantly utilized DH genes will be sampled, as the precise distribution in relatively rarely used DH genes is hard to measure.
With the advent of high-throughput sequencing, it has become possible to sample a large enough number of naïve B cell receptor (BCR) sequences to capture a large enough number of DH s with a limited number of SHMs, even those with short DH gene sequences. We here present the DRF distribution from 12 human subjects. We describe a new computational method for defining DH segments and provide information on which DH segments are most vs. least reliably identified, which is of interest to those using high-throughput sequencing to analyze the antibody repertoire. In agreement with previous publications, we find that inverted DRF are practically never used (22, 24). However, even in the forward RF, we show that there is very strong selection of DRFs that eventually leads to the selection of 1 or 2 dominant RFs out of the 3 possible forward RFs in the expressed antibody repertoire. These results have implications for the overall level of IgH diversity and the timing of H chain selection checkpoints in humans. An understanding of these selection checkpoints may be useful in future studies of how B cell selection is altered in disease.
Materials and Methods
Study Subjects
Twelve apparently healthy adult subjects (see Table I for demographic characteristics), were recruited for high-throughput sequencing using the 454 platform. Two 45 ml blood draws were collected in heparin tubes from each subject at a single time point. Mononuclear cells were isolated using Ficoll-Paque Plus (GE Healthcare), and then sorted by flow cytometry into naïve (CD20+, CD27−) and memory (CD20+, CD27+) populations. Informed consent was obtained from all donors. This work was performed in accordance with an IRB-approved protocol at Pfizer. Inc.
Table I.
Donor demographics for 454 and Illumina sequencing.
| Sequencing technology | ID | Gender | Ethnographics | Age |
|---|---|---|---|---|
| 454 | 91 | F | Caucasian | 54 |
| 104 | F | Hispanic | 28 | |
| 130 | M | Hispanic | 39 | |
| 136 | M | Caucasian | 54 | |
| 158 | M | Asian | 25 | |
| 182 | F | Caucasian | 27 | |
| 219 | F | Asian | 44 | |
| 231 | F | Asian | 29 | |
| 272 | M | Asian | 57 | |
| 273 | M | Caucasian | 27 | |
| 275 | M | Hispanic | 50 | |
| 276 | F | Hispanic | 47 | |
| Illumina | 1 | F | Caucasian | 49 |
| 2 | F | Caucasian | 22 |
Two apparently healthy adult subjects were also recruited for high-throughput sequencing using the Illumina platform at a single time point (Table I). Twenty-five cc of venous peripheral blood were drawn in sodium EDTA tubes from each of the 2 subjects and sequenced using the Illumina platform. Informed consent was obtained and subjects were asked to fill out a medical questionnaire. This work was performed in accordance with an IRB-approved protocol at the University of Pennsylvania.
Target Amplification and 454 Sequencing
Unbiased amplification of repertoires was performed by 25 cycles of 5’RACE, using individual isotype-specific reverse primers. Primers were optimized for efficiency, fidelity and completeness of repertoire recovery by informatic screening, gel-analysis and high-throughput sequencing of recovered products. The degree of germline-dependent amplification bias was assessed by comparing amplified products of stimulated naïve B cell pools to direct sequencing of the same pools. Cycle-dependent effects on diversity estimates were evaluated by high-throughput sequencing. All products received multiplex identifiers (barcodes) to allow unambiguous identification of all products by sequence analysis in subsequent processing steps. Multiplex identifiers differed by at least three base pairs from any other multiplex identifier sequence, and only reads with exact-matches were included in the analysis. Products were sequenced with 454 Titanium. Sequencing quality was assessed by keypass control. Sample QC was confirmed by demultiplexing and VH segment genotype. Sequencing depth was determined by diversity estimate rarefaction and simulations of germline-profile stabilization as a function of sequencing depth. A detailed discussion of the sequencing methodology has been described previously (30).
Antibody DNA CDR3 Analysis by Illumina Sequencing
Peripheral blood lymphocytes were enriched over Ficoll Hypaque and CD19+ cells were isolated by magnetic bead separation (Miltenyi Biotech.). Genomic DNA was extracted using a Puregene Kit (Qiagen, Valencia CA) and 800 ng were used for IgH CDR3 amplification and library construction. IgH CDR3 variable regions were amplified and sequenced as described in Larimore et al. (31). Briefly, a multiplexed PCR method was employed to amplify rearranged IgH sequences at the genomic level, using seven VH segment primers (one specific to each VH segment family) and six JH segment primers (one for each functional JH segment). Reads of 110 bp extending from the JH segment, across the NDN junction, and into the VH segment were obtained using the Illumina HiSeq sequencing platform. The immunoSEQ assay was used for the sequencing. The BCR CDR3 region was defined according to the IMGT convention (32), beginning with the second conserved cysteine encoded by the 3′ portion of the VH gene segment and ending with the conserved phenylalanine encoded by the 5′ portion of the JH gene segment. The resulting sequences were analyzed for DH usage, orientation and RF as described in the section on DH detection. A total of 12,948,437 sequence reads representing 47,358 unique sequences, of which 82% were productive, were analyzed for subject 1 and 12,851,153 sequence reads representing 20,374 unique sequences, of which 84% were productive, were analyzed for subject 2.
Germline VH, DH and JH Genes Used for Sequence Composition
Human Ig germline sequences for VH, DH and JH genes of B cells were extracted from the IMGT database (33). In our study, we used 34 germline sequences of DH, categorized under ‘functional genes’ that included ORF, 13 sequences of JH genes, and 188 sequences of VH genes.
454 Sequence Analysis
We used two different approaches to analyze the DRF usage. In the first approach, we used all unique sequences. In the second approach, we attempted to detect clones by clustering together sequences with similar CDR3 sequences, in order to minimize the effect of potential biases in the sequence copy numbers. Both approaches led to similar results.
Sequences were grouped into clones using a two-step approach. First, the germline VH and JH of each sequence were determined by aligning all possible germline VH and JH (based on the IMGT germline library) (33) against the sequence and finding the highest number of overlapping nucleotides and assuming that no deletions or insertions occurred. A full alignment using BLAST produced similar VH and JH assignments for all tested sequences that were classified clearly enough in the alignment.
Next, in order to count the clones1, we grouped all sequences according to their VH and JH usage as well as the distance between VH and JH, since SHMs usually do not produce additions or deletions of nucleotides. Thus, every clone emerging from the same founder cell should have the same distance between VH and JH. We then took all of the sequences with the same VH, JH and distance between VH and JH and grouped them using a phylogenic approach. The distance between VH and JH was computed by positioning the IMGT germline VH and JH genes on the observed sequence and determining the distance between the last nucleotide of VH and the first nucleotide of JH. All the sequences with equal VH, JH and distance were aligned together with an artificial sequence composed of the germline and gaps between them. Within each group, the sequences were aligned (using MUSCLE 3.6) (34), and a phylogenetic tree was built using maximum parsimony (35) and/or neighbor joining (36) methods (from the PHYLIP 3.69 program package). We then parsed this tree with a cutoff distance of 4 mutations into clones. Thus, a clone was defined as a set of sequences that are similar one to each other, up to a distance of 4 mutations.
DH Detection
We have computed the maximal similarity between each DH germline gene segment in each RF and all the possible subsequences of same length in the region spanning the last 30 nucleotides before the 3’ end of the VH gene to the end of the JH gene. The similarity of a given sequence to a germline DH has been defined as the fraction of nucleotides equal to the one of the germline DH. We only further analyzed sequences with a similarity of at least 0.75.
Validation Set Production
In silico, we generated a set of 10,000 sequences by random V-D-J joining (with equal probability for each DH gene). In this data set, the DH gene could be inserted in forward or backward orientation. We then added mutations between each pair of genes (V-D and D-J) to create the following: (a) replacements of 1–3 nucleotides at each inner edge of the DH gene and (b) replacement of 1–3 nucleotides in random positions in the DH gene. In both methods, purines and pyrimidines had a 2/3 probability of being mutated into a base in the same group (transition) and a 1/3 probability to be mutated to the opposite group (transversion). We then computed the best fit DH and its orientation for each of these “known” rearrangements, using the same methodology as was used for the real (unknown) sequences. The fraction of high precision fits was affected by the DH gene length: as expected, longer DH genes were properly classified more often.
Results
While, the RF usage of VH and JH is constrained, the RF of DH is flexible because nucleotide additions or deletions are present at both ends of the rearranged DH gene segment. Furthermore, DH genes can potentially undergo inversion. Thus DH segments can be read in up to 6 RFs. The presence of multiple possible RFs increases the variability of the CDR3. We here show that the DH gene actually uses a limited number of RFs.
The analysis of DH gene sequences in the antibody repertoire is not easy because some DH genes are similar to each other and nibbling of the DH genes by the non-homologous end-joining machinery can result in very short DH gene sequences. Thus, the robust identification of DH gene segments from CDR3 sequences involves a trade-off between sensitivity and specificity.
This analysis required the development and validation of a robust computational method for the identification of DH gene segments and their RFs from high-throughput sequencing data. We have performed several analyses to rule out certain technical artifacts in the sequencing or sampling methodology. We have further validated the precision of the DH gene determination using computer simulations of DH rearrangements and found the results to be highly precise for long DH genes. We have tested our computational methodology on artificial datasets, to ensure that the results are not due to artifacts of the computation. The code for V(D)J detection and the code to analyze and detect DH genes can be requested from the authors.
To rule out potential biases that could have been introduced as a result of the sample type, IgH amplification process or sequencing platform, we analyzed the DRF usage using two completely different methodologies. The first method utilized RNA extracted from sorted B cell subsets, amplification of cDNA by 5’RACE and pyrosequencing (by 454). The second method employed genomic DNA from CD19+ enriched peripheral blood lymphocytes, amplification using cocktails of VH and JH primers and Illumina sequencing. The results with both approaches were very similar for the in-frame (IF) sequences. In this analysis we have sequenced the IgH repertoire of multiple human subjects to ensure that the observed DH selection is reproducible and robust.
Subjects and 454 IgH Sequences
We have sequenced the antibody heavy chain repertoire from 12 healthy human adult volunteers. For each subject, we sorted CD20+ lymphocytes into naïve (CD27−) and memory (CD27+) subsets. We then applied a RACE protocol to separately amplify IgM, IgG and IgA B cell receptors from each sample, using isotype-specific primers at the constant region. The resulting sequences were compared to all germline VH genes at all possible positions. Sequences were discarded from the analysis if a VH gene could not be detected with a high enough accuracy (at least 70% overlap with germline VH and at least 120 nucleotides of VH sequence length were required). Nearly all sequences had a much better fit than 70%. VH genes that were highlyrelated (e.g. alleles of the same VH gene) were grouped into a single gene. We then compared the sequences downstream of the identified VH to all possible germline JH genes, and assumed that the JH gene could not start more than 50 nucleotides before the 3' end of the VH gene. We found that practically all sequences for which a VH gene could be identified, the JH gene could also be detected with a high enough accuracy (over 70% similarity to germline VH and JH). Note that even if the precise VH gene could not be identified, its final position could almost always be known precisely, since similar VH genes have similar lengths. Given the position of VH and JH, we extracted the sequence regions that included the DH gene segment(s), starting with the sequence that was 30 nucleotides before the end of the VH germline gene and ending with the 3' end of the germline JH sequence. We looked for the best fit to all germline DH genes in the IMGT database. The optimal fitting DH gene was given a score representing the fraction of the germline DH gene nucleotides fitting the observed sequence (see Fig. 1). The position of the DH gene was then determined relative to the end of the region where the sequence was identical to the corresponding germline sequence and relative to the beginning of the germline JH sequence. The position determines the DRF relative to the beginning of the VH germline sequence.
Figure 1. Computation of the DRF.
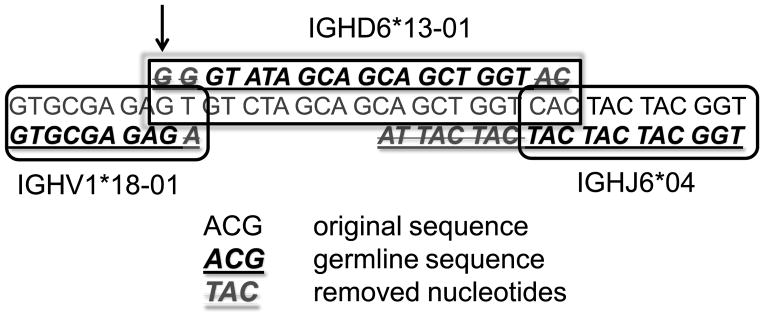
We first compute the position of VH (from ACGA to GAGA in the first row and the beginning of the second row). The upper line is the full sequence, and the lower line is the germline gene (VH. in this case). We then compute how the codons are aligned with respect to the beginning of VH (see for example the GAG at the end of V). On the 3' end of the sequence we compute the position of JH (lower right hand part of figure). Again the sequence is above the germline JH gene. In between, we compute DH (central lower part). The sequence above the text is the germline and we compute its position versus the reading frame of VH. In this case it starts at the third RF (the first G of the germline DH, indicated by the arrow, is above a G in the third reading frame of the VH germline). Crossed out nucleotides are germline nucleotides that were removed from either VH, DH or JH in the join region.
Note that many previous algorithms have been created for the detection of VH, DH and JH (e.g. among many others, Soda (37), IHMMune (38) and JOINSOLVER (23)). However, our algorithm allowed us to precisely check the precision on our own dataset, and to perform large-scale off-line computations.
Methodology Validation
We first tested whether our DH detection methodology properly identifies the DH germline gene and the corresponding DRF. We have produced artificial V-D-J sequences and have introduced random mutations in these sequences (see Materials and Methods). We have then checked the fraction of cases in which the algorithm properly classified the results.
We have limited the analysis to contain up to 3 mutations in the body of the DH gene and 3 nucleotides changes/removed in the 3’ and 5’ ends of the DH gene, since sequences with more mutations than that had a too high error level and where not used, as will be further discussed. Within the misclassified ones, we checked the type of misclassification that occurred: either an error with respect to the RF or a misidentification of the DH, or both. Finally, we checked whether the error was due to failure to detect an inverted DH. We found that the error level is a function of the number of mutations in the DH segment (nucleotide differences compared to the germline DH sequence) and the number of nucleotides that are added and/or removed from the DH gene. At or above a level of 75% overlap (the percentage of nucleotides overlapping between the query sequence and the germline DH sequence), fewer than 10% of the query sequences are misclassified (Fig. 2). Note that even amongst these 10%, most errors are due to a misclassification of the DH gene as a similar gene, and not due to errors in the assignment of the DRF (compare Supplemental Fig. 1A to 1B). This misclassification occurs because some DHs have highly similar nucleotide sequences (e.g. D-4-11 vs. D-4-17). This precision is much better than currently used algorithms such as SoDA, JS and V-Quest (50–73% precision for 2–6 mutations as used in the simulation). However, the comparison is not fair, since here we discard a large fraction of the sequences.
Figure 2. Effect of mutation frequency on DH and DRF-identification accuracy.
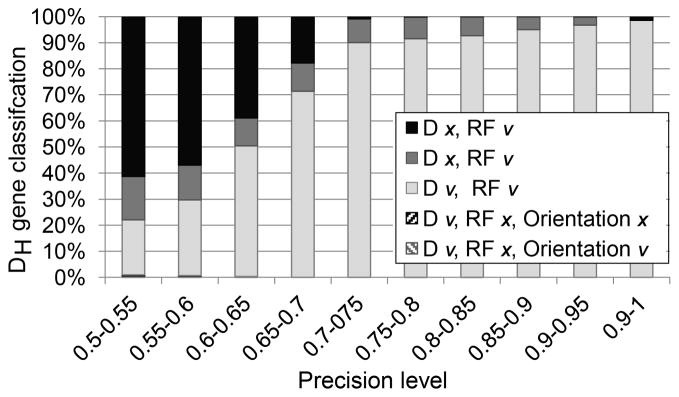
The X-axis is the fraction of nucleotides in the sampled sequence that overlaps with the full DH germline sequence. The Y-axis is the fraction of properly classified DH genes in simulated rearrangements. The errors were divided into multiple categories including errors in DH identification or in the DRF classification or both. A detailed analysis of the effect of the DH gene on the precision is provided in Supplemental Fig. 1. One can clearly see that as soon as the overlap is higher than 0.7, the fraction of sequences with a reading frame error is less than 1 % and the DH identification error is less than 10 %. Most of those occur in highly similar DH genes. Reading frames with a negative number are inverted reading frames. Those are observed only in very short DH genes.
Even a low mutation frequency results in a non-negligible error rate for highly homologous DH genes (Fig. 2). Therefore, we have restricted our analysis to DH genes that can be identified with a precision of at least 0.75. Thus, this analysis excludes some of the shorter DH genes that practically never reach this level of precision (see Supplemental Fig. 1C and 1D).
Absence of Inverted DH Reading Frame
We first checked the DRF usage in the total sample (without taking into account the specific DH used). We then computed how many unique clones (see Materials and Methods) used each RF for each DH. The inverted DRF usage frequency is lower than the precision level of the methodology (fewer than 1 % of the unique clones contained a possible inverted DRF, compared with an error level of 5%). Thus, sequences that are identified as having potential DH inversions may not really contain inverted DH segments. Indeed, for each DH gene found to be in the “inverted” DRF, there was also a reasonable fit to a DH in a forward DRF (not always in the same DH gene). Thus, we conclude (as was previously suggested based upon smaller datasets (22)) that the use of inverted DH segments, if it occurs at all, is very infrequent in the IgH repertoire of healthy human adults.
The frequencies at which DH genes are used in our sample vary widely among DH genes. One caveat is that we are only analyzing DH genes where the fraction of original nucleotides is maintained in the rearranged sequence is over 75%. This selection induces a bias toward long DH genes that can be classified properly with a better accuracy (Supplemental Fig. 1).
We have repeated the analysis separately for each DH. When averaging over each DH separately (instead of over all clones), some inverted DH genes are observed in rare short DH genes (Fig. 3A). However, in short DH genes, a small number of fitting nucleotides can be enough to ensure a 75 % match. As mentioned above, for each candidate inverted DH, a reasonable candidate forward DH can be found. One can thus conclude that in very large cohorts, if inverted DH exist, they are very rare and limited to short DH genes. We repeated the analysis using all the sequences and not only clones, in order to make sure that this bias is not a result of artifacts from our clone detection methodology (Fig. 3B). When using all the sequences, there are again practically no inverted DH genes.
Figure 3. Fraction of sequences using each DRF in each DH (454 data).

A) DRF usage of all sequences. B) DRF usage of clone sequences. Each column is a DH gene. Each color is a DRF. We have removed IGHD4*04, IGHD5*05 and IGHD7*27, since we had too few sequences classified to these DH genes. One can clearly see that the DRF usage varies significantly among DH genes. The first DH genes are very short and are more error prone than the others. C) Effect of precision on DRF usage (average over different DH genes). The X-axis is the required precision (fraction of overlapping nucleotides between a sequenced DH with the germline DH). The Y-axis is the percentage of sequences using each DRF. Even at high precision levels, the DRF usage remains and is not affected.
Note that most inverted DHs do not contain stop codons. Thus, there is no a priori reason that these DRF should not be used. Their absence seems to highlight the presence of mechanistic differences in the inverted and forward rearrangements.
Forward DH Gene Reading Frame Usage Distribution
The absence of inverted DRF may be mediated by aspects of the rearrangement mechanism. A surprising feature of the DRF usage that cannot be explained by the rearrangement mechanism is the restricted usage of particular forward RFs. In the forward direction, the DRF usage is highly skewed towards the third forward RF for most clones, whereas a minority of the clones uses first and second forward DRF (Fig. 3A) Again, as was the case for the inverted DRF, most forward DRF do not contain stop codons, which would reduce their likelihood of usage in circulating B cells. Moreover, as will be further explained, there is no a priori advantage for one DRF over the others, and no element of the rearrangement process that could readily explain this preference. This unequal distribution thus seems to hint to the presence of a clear selection mechanism for one DRF for a given DH segment.
In order to check that this result is not the peculiarity of a single individual, we have compared the DRF usage among subjects and amongst antibody heavy chain isotypes (data not shown). In all cases, the DRF usage is skewed and the manner of skewing is very similar in different individuals. Thus, if specific DRF are indeed selected, this selection mechanism is similar in most individuals. Note also that there is no reason for the PCR amplification to over amplify one DRF rather than the other since the region of the amplification product that contains the DRF is internal to and non-overlapping with the primer.
As mentioned above, the frequencies at which DH genes are used in our sample vary widely among DH genes. Thus, the average results could be the result of a small number of highly frequent DH genes. As was the case for the inverted DRF, we have repeated the analysis separating each DH. The DRF usage varies among DH genes, but it is again highly non-uniform for each DH gene (Fig. 3A). The non-uniform distribution is not the result of stop codons, since DRFs without stop codons are practically absent. Moreover, the DRF usage pattern is highly reproducible among samples from different individuals (Supplemental Fig. 2) and is the result of a large number of clones for each sample and each DH (data not shown). Supplemental Fig. 2 shows the DRF usage of clones and not of total sequences but the results for total sequences are similar. Thus, the biased distribution cannot be the result of amplification errors or biases, since those would not affect the clone number (remember that similar sequences comprising each clone are only counted once). For the same reason, the biased distribution is not affected by very large clones, since again all sequences in the same clone are only counted once. Thus, if selection occurs, it is not the result of the amplification of some clones, but rather the selection of individual clones. Moreover, the RACE protocol minimizes artifactual skewing of VH or JH gene usage since the primers are neither VH nor JH-specific.
In order to test that the total DRF usage is not the result of errors (that comprise fewer than 10% of classified sequences) in the either the DH or the DRF classification, we repeated the analysis, and increased the precision level requested, until only sequences with a 100% precise classification were used (i.e. the full DH gene is observed in the original sequence). Note that in such a case, the error level is negligible, and a limited number of sequences are used (most of these sequences have only insertions and no deletions at the VD and DJ junctions). Even under these conditions, the average DRF usage did not change (Fig. 3C). Thus, the non-uniform DRF usage seems to be a real feature of the sequences, and not an artifact of the methodology. On the other hand, one may worry that since we are looking only at sequences with a good enough classification of the DH gene, the results may be biased toward a given DRF. However, the comparison to the DH gene is only performed with the germline and is not affected by additions around the DH gene, and the DRF preference is also observed in CDR3 sequences where the distance between VH and DH, and between DH and JH is positive, where the majority of sequences are taken into account (Supplemental Fig. 3).
Comparison of DH Reading Frame in IgM+, IgG+ and IgA+ B cell Subsets
In order to determine if DRF skewing could be mediated by selection in the periphery, we compared DRF usage in naïve (CD27−) and memory (CD27+) sorted B cell subsets. We amplified IgM rearrangements (from cDNA) of the naïve B cells and to further analyze the memory B cell pool, we amplified IgM, IgA and IgG rearrangements from the CD27+ fraction (see Materials and Methods).
The relative DRF usage distribution can be treated as a 3*18 frequency matrix (3 DRF and 18 out of 34 DH genes that had more than 100 sequences in most tested donors) where the sum of each column is 1. We rearranged this matrix as a vector and computed the correlation of this vector between all samples (12 subjects, 4 compartments – naïve (IgM) and memory (CD27+) IgM, IgG or IgA). We observed a very similar distribution among all samples, with the maximal similarity being among technical repeats of the same sample followed by different isotypes from the same donor (corr = 0.8) (Fig. 4A). But even between individuals, the correlation was typically over 0.75 (Fig. 4A). The correlation between naïve IgM repertoires was 0.8, while the correlations within and between memory isotypes, were 0.7 and 0.77, respectively(t-test, p<1.e-10 for all comparisons). The higher similarity between naïve IgM sequences than between IgA and IgG suggests that there is a shared bone marrow-based selection mechanism that drives the uniform selection in IgM sequences, followed by diversification in the memory compartment.
Figure 4. DRF usage in different donors and isotypes.

A) Average correlation between DRF usage within and between donors. The correlation is computed as the Pearson correlation of the frequency of each DRF in each DH gene among samples. The highest correlation is among technical repeats, followed by the correlation between different isotypes in the same donor and similar isotypes among subjects. The lowest correlation is between samples of different isotypes in different subjects. Technical repeats are from the same donor and the same isotype. Same donor represents the same subject and different isotype. Same Isotype represents the same isotype in different subjects. All samples represent different isotypes and donors (i.e. those are all sample combinations, except for the ones considered in the previous columns). B) Average standard deviation of DRF usage as a function of isotype. A uniform distribution would represent a standard deviation of 0, while a single DRF used for each DH gene leads to a standard deviation of 0.57. The standard deviation is lowest for naïve IgM, followed by memory IgM and then IgG. IgA has a lower variance than IgG. The differences between all groups are significant (p<1.e-10) except for the memory IgM and the IgA. The distribution is over all samples within the same isotype. C) Average DRF usage among all samples (donors and isotypes). Each column is a sample and the Y-axis is the fraction of sequences using each DRF. We have first averaged the results for each DH gene and then averaged over DH genes. Thus rare DH genes are over expressed in this analysis. One can clearly see that the average pattern is very similar among all samples. The presence of inverted DRF is fully due to short DH genes. However, in these sequences, the determination of the DRF is error prone.
The analysis of selection can be taken one step further by comparing the variability of DRF usage in naïve vs. memory B cell IgH repertoires. Completely uniform DRF usage would lead to a standard deviation of 0 in the DRF usage (per DH gene). Conversely, in the extreme case of usage of a single DRF, the standard deviation would be 0.57 (the std. of (1,0,0)). The standard deviation in the naïve compartment is around 0.3, and it rises progressively to 0.37 in the memory IgM repertoire and to 0.43, almost the maximal variability (i.e. most limited DRF usage), in the IgG compartment (Fig. 4B). The rise in the DRF variance may be partially due to clonotypic enlargement. However, there is typically much more than one clone per DH gene. Thus, clonotypic enlargement is far from being the only source of the high variance.
Amongst the memory subsets, we found the highest degree of variance in the IgG+ sequences, where DRF usage is limited to practically a single DRF (t-test, p<0.01 vs. naïve IgM cells).As expected memory IgM has a variance between the naïve and IgG variances. The DRF usage is less skewed in memory IgA than in IgG sequences for reasons that are not clear.
The average overall DH gene DRF distribution was practically equal among all subjects and compartments (Fig. 4C), which again favors a two (or more) stage selection model: a common selection stage amongst naïve cells or their precursors, and further selection/diversification in the IgG/IgA pools, which is subject-specific.
Distance between VH, DH and JH
One possible explanation for the skewed usage of DRFs in the IgM compartment is a rearrangement bias. Such a bias could arise if there were preferred rearrangement distances between VH and DH or between DH and JH. If biased rearrangement had been the source of the skewed DRF usage, we would have expected to observe a very narrow distribution of the distances between VH and DH (or DH and JH). We have measured this distance for each DH. For most DH genes, one observes a very wide distribution covering more than 30 nucleotides, with jumps of 3 nucleotides (Fig. 5). Thus, for example, the frequency of a distance between VH and DH of 3 nucleotides is much higher than 2 or 1 nucleotides, but is similar to a distance of 0 nucleotides. The same can be observed in the distance between DH and JH (data not shown). Although the JH segment used influences the CDR3 length, the range of rearrangement lengths cannot be readily ascribed to skewed JH usage for a particular DH gene segment. Furthermore, the wide range of CDR3 lengths that occur at 3 nt intervals in the preferred DRF exists even at the level of specific V-D-J combinations (Fig. 6); Note again that the RACE protocol is not expected to produce any length or VH-JH bias. Such a bias in intervals of three over a wide range of rearrangement lengths is therefore highly unlikely to be the result of biased rearrangement. One is thus left with positive or negative selection as the most likely potential explanations for the common bias in DRF usage.
Figure 5. Frequency of position of end of DH for each DH gene.

Each column is a position at the end of DH starting from 10 positions into VH. Each row is a DH gene. The colors represent frequency, as showed in the colorbar. One can clearly see in most DH genes jumps of three in the position, but beyond the clear selection for a DRF, the position distribution is quite wide.
Figure 6. DJ region length distribution for different VDJ rearrangement in naïve B cell samples.
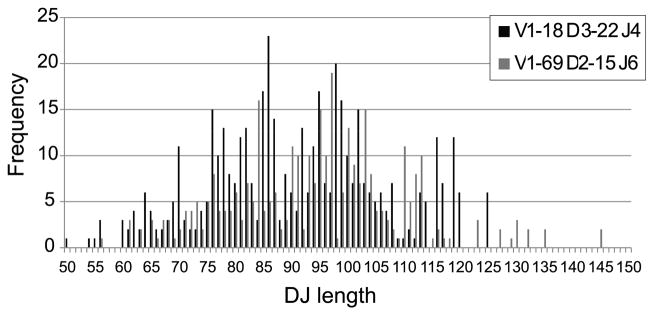
We computed in the clone sequences the length distribution of the region spanning the full germline DH and JH regions.
DH Reading Frame Usage is Uniform in Out-of-frame IgH Rearrangements
In order to further demonstrate that the DRF bias is likely to be due to selection rather than biased recombination, we have analyzed out-of-frame (OF) rearrangements in B cell genomic DNA. If biased rearrangement contributes to the DRF bias, then this should also be observed in OF rearrangements. We thus compared the DRF bias in rearrangements that are IF to those that are OF. In order to obtain sufficient numbers of OF sequences, we sequenced genomic DNA using the Illumina platform (see Materials and Methods). First, we checked whether we observe the same average DRF usage using a different sequencing technology (Fig. 7A). Indeed, one can clearly see the similar biased DRF usage between the cDNA 454 samples, and the DNA Illumina samples. The fit shows again that the DRF usage is not an artifact of the sequencing methodology.
Figure 7. DRF usage in the Illumina data.

A) Fraction of sequences using each DRF in each DH. Each column is a DH gene. Each color is a DRF. One can clearly see the similar DRF usage as observed in Fig. 3. Differences may arise due to the fact that different donors were recruited for each sequencing. B) Standard deviation of DRF usage in IF and OF sequences. Each column is the standard deviation of the DRF usage in a given gene, as computed in Fig. 4B, using the Illumina based sequences. The expected standard deviation was computed as one over the square root of the sample size. The OF RF standard deviation is only slightly higher than the one expected by the size of the sample, since the sample size for OF rearrangements was limited. The IF standard deviation of DRF usage approaches the maximal possible in this case (0.57=root of (1/3)), and much more than expected by the sample size. One can thus conclude that most of the variance in the DRF usage is determined by selection. DH genes for which there were not enough OF or IF sequences (fewer than 100) were not incorporated in the analysis.
Consistent with selection, the OF DRF usage was practically uniform for all DH genes in the forward direction. Indeed the OF variance is not very different than what was expected due to random chance in most DH genes. Conversely, in the IF rearrangements, the observed bias is similar to the one observed in the cDNA sequence analysis described using 454 sequencing (Fig. 7B), and significantly different from random for most alleles (p<1.e-100). Because the number of OF sequences was much smaller than the number of IF sequences, the expected variance in the OF DRF was much larger than the expected variance in the IF DRF.
The Junction between DH and JH Exhibits a Small Degree of Reading Frame bias Compared to DH Reading Frame bias
We wondered if counter-selection for the Dμ protein could account for the DRF bias. The Dμ protein is generated by DH to JH rearrangement prior to complete VDJ rearrangement in pro-B cells. The Dμ protein is often encoded in RF2 and, based upon the analysis of Dμ transgenic mice, Dμ signaling can inhibit VH to DJ rearrangement. The Dμ protein can associate with the surrogate light chain as well as Igβ (11) and, intriguingly, the signaling adaptor and tumor suppressor protein called SLP-65 (39) is required for Dμ selection (40).
Since the Dμ protein is generated by rearrangement between DH and JH only at the N2 junction, it cannot account for skewing in the DRF of the fully rearranged VDJ unless the N1 junction is somehow constrained. To test this idea, we analyzed the RF usage of N2 in isolation (without regard for N1). If the Dμ protein is counter-selected and contributes significantly to the final VDJ DRF usage, then we expect to find counter-selection of N2 RF2. Indeed this is the case (Fig. 8A). RF2 is under-represented. Intriguingly, N2 RF3 is more frequently utilized than either N1 or N2. But the effect sizes are small compared to the skewing observed when both the N1 and N2 junctions are taken into account (Fig. 8B). These data indicate that the skewing introduced by the Dμ RF is insufficient to fully account for the DRF bias.
Figure 8. DJ rearrangement RF.

A) DJ rearrangement RF usage of all isotypes and donors (454 data). As in Fig. 6, we used the segment containing the DH, N2 and JH regions, and replaced the DH and JH with the full germline sequences. We then computed the RF of this segment with respect to the beginning of the C region. There is a general small bias in favor of the second RF (RF 2). B) DJ rearrangement RF usage in IF and OF sequences (Illumina data). We observe a uniform usage in OF sequences. However, we see again a bias toward RF 2
Stop Codon Usage is Insufficient to Account for DRF Bias
We next wondered if negative selection for disfavored DRFs arose due to higher frequencies of stop codon usage in the disfavored DRFs. This possibility seems unlikely because stop codons are only found in 30 % of the forward DRF2. Moreover, stop codons often reside in the extremities of the DH gene and tend to be eliminated through nucleotide deletion and addition. DRF usage exhibited a low correlation with the presence or absence of a stop codon in a given DRF for a given DH gene. Thus stop codons are unlikely to be significant drivers of DRF selection. Furthermore, there are alternative DRF that contain no stop codon (for example DRF 2 and 3 of IGHD1-20*01), that nonetheless display a very clear bias (0.8 versus 0.2 in the case of IGHD1-20*01).
This leaves two final scenarios that are not mutually exclusive. Either specific DRF are selected at the amino acid level in the germline through evolution (41), or specific properties of DH genes are selected somatically (either positively or negatively) during the life of the B cell (9–11, 16, 42–45).
Correlation of Amino Acid with DH Reading Frame Frequency
In order to test if skewed DRF usage correlates with the presence (or absence) of particular amino acids, we computed a DRF usage probability matrix (3 DRF *18 DH genes - represented as a single 54 position vector) and compared it to an occupancy matrix for each amino acid in each DH in each DRF. Thus, each amino acid was assigned a (3*18) matrix representing the number of times it appears in each DH and DRF (represented again as a single 54 position vector). We then computed for each sample and each amino acid the Pearson correlation between the DRF usage probability matrix and the amino acid occupancy matrix. The result was a correlation value for each amino acid for each sample. For most amino acids, this correlation is highly significant (p<0.01 for 16 out of 20 amino acids using a t-test over the correlation in all samples vs. 0). Moreover, the correlation is highly consistent among all samples. While the overall average correlation in the DRF usage among all samples is 0.75–0.8, the list of the 10 most highly correlated amino acids (both positive and negative) is actually conserved in 95 % of the samples. Strikingly, some amino acids are highly positively correlated with DRF usage, such as Threonine, Tyrosine or Serine, and some are highly negatively correlated (Leucine, Glutamine and others, Fig. 9). Moreover, except for Methionine, Asparagine and Valine, all amino acids are either always positively correlated with expression or negatively correlated in the vast majority of samples.
Figure 9. Pearson correlation of DRF usage with the number of times each amino acid appears in each reading frame.

The X-axis represents amino acids. The values on the Y-axis are the Pearson correlation coefficients of the DRF usage and the amino acid frequency vectors. Only correlations with a p-value of 0.05 or lower were used. Lysine and Proline are practically never used in DH genes so they are not incorporated in the analysis. Each box contains all the samples (8 samples were analyzed for each one of the 12 subjects: IgA, IgG, IgM naïve, IgM memory, each performed in duplicate). As one can clearly see, some of the amino acids are practically always positively correlated with the DRF usage, and some practically always negatively correlated. Note that the correlation is biased by the presence of stop codons. For example, Leucine is often present near stop codons. We present in Supplemental Fig. 4 a similar analysis when only sequences with no SCs are used.
Effect of DRF and DH gene usage on DH gene position
A possible explanation for the DRF bias may be that each DH gene and DRF use a different part of the DH gene. For example, for a given gene, the end of the gene may be typically used, while for other genes the initial part may be used, and the end deleted in the junction production. Interestingly, there are clear differences between the different DH genes (Fig. 10). This figure shows for each position along the DH gene, for each DH gene and each RF, how often this position is used starting at the beginning of the DH in the rearranged gene. Each triplet of rows is one DH gene in 3 different forward RFs (DRF1, DRF2 and DRF3), and each position along the X-axis represents the nucleotide position along the DH germline gene sequence. The colors represent the relative frequency at which a position is used (the number of times that that nucleotide is used divided by the number of rearrangements involving that particular DH in that particular DRF). As one can clearly see, there are preferred positions used by each DH gene. However, these preferred positions are quite similar among the different DRF for the same gene. Still some specific differences exist, and some DH genes tend to use preferred positions in some specific RFs (the red boxes in Fig. 10). We have thus analyzed the amino acid sequences that are encoded by nucleotides in these positions, and there seems to be a preferred usage of a QLV sequence for some of the DH genes (see Table II). This preference is unlikely to be explained by frequent usage of Q and L amongst germline DH genes, since reading frames individually containing Q and L individually are actually infrequently used (Fig. 9). Rather, this specific combination of amino acids seems to be favored. Thus, while selection for the starting point of a DH gene is probably based on the rearrangement mechanism for most DH genes, there are some specific sequences that are highly positively selected.
Figure 10. Relative frequency of the starting position in the DH gene.
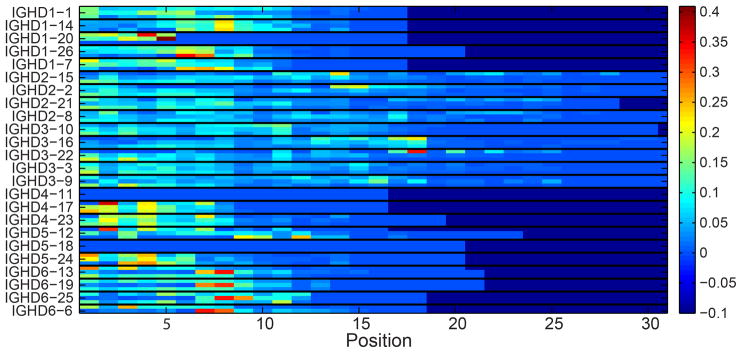
Each position in the X axis is a nucleotide along the DH gene and each triplet of rows represent of DH gene. Within each triplet, each row is a DRF. The colors represent the frequency of this position in the DNA samples. Only RFs (i.e. rows) with at least 100 sequences were taking into account (otherwise, the values are zeros).
Table II.
Specific DH gene starting positions and reading frames that are over presented. The first column is the DH gene, the second column the DRF, the third column is the position in the DH gene used as a beginning of the DH gene. The last columns represent the nucleotide and amino acids of the resulting DH genes. An interesting QLV motif appears in many of the sequences. The nucleotide sequences are not the full germline sequences, but the relative regions translated, taking into account the DRF and the starting position in each case.
| DH gene | DRF | Starting position (nucleotide) | nt sequence | aa sequence |
|---|---|---|---|---|
| IGHD1–20 | 1 | 4 | ATAACTGGAACGAC | ITGT |
| IGHD1–20 | 2 | 5 | AACTGGAACGAC | NWND |
| IGHD1–26 | 3 | 6 | TGGGAGCTACTAC | WELL |
| IGHD3–22 | 1 | 18 | TGGTTATTACTAC | WLLL |
| IGHD4–17 | 1 | 2 | CTACGGTGACTAC | LR*L |
| IGHD6–13 | 2 | 8 | CAGCAGCTGGTAC | QQLV |
| IGHD6–19 | 2 | 8 | CAGTGGCTGGTAC | QWLV |
| IGHD6–25 | 2 | 8 | CAGCGGCTAC | QRL |
| IGHD6–6 | 2 | 7 | CAGCTCGTCC | QLV |
| IGHD6–6 | 2 | 8 | CAGCTCGTCC | QLV |
Discussion
We show here in human peripheral blood B cells that a single DRF predominates for most DH. Thus, in reality there is much less freedom in DRF usage and the expressed IgH repertoire is therefore not as diversified by alternative DRF as is theoretically possible. The skewing towards particular DRFs mapped not only to individual DH genes but tended to be similar in members of the same DH gene family. One of the most striking findings was that the skewing towards a particular DRF in the rearrangements of a given DH gene was preserved over a wide range of rearrangement lengths. This finding suggests that the DRF bias reflects a selective process that is intrinsic to the DH gene sequence itself. Furthermore, the DRF bias was highly similar in different individuals and was most marked in naïve IgM+ B cells. Collectively, these findings indicate that there is something about the DRF bias that is hardwired into the pre-immune repertoire. But how and why does this happen?
There are two general ways in which DRF bias could arise. The first is that bias could be introduced at the time of rearrangement. The second possibility is that rearrangements are random but that selection (operating either negatively or positively) favors certain DRFs. Biased rearrangement would predict that OF rearrangements should also exhibit biases in DRF, yet this is not observed: instead, the usage of DRF is fairly uniform amongst OF rearrangements. As naïve IgM+ B cells exhibited the most striking and consistent DRF bias, we reasoned that the major checkpoint for DRF selection must occur early during B cell development. The earliest stage in which this could occur is in pro-B cells (when H chain rearrangement is occurring) and could involve the Dμ protein. However, when we analyzed the RF skewing in the N2 junction between DH and JH, the effect sizes were small compared to the level of skewing when N1 and N2 junctions were viewed in aggregate in the completed VDJ rearrangement. Furthermore, there was no specific distance between the N1 and N2 rearrangement junctions that was favored. Instead, the DRF bias existed over a wide range of rearrangement lengths. Thus, counter-selection for the Dμ protein appears to be insufficient to account for the DRF bias. Furthermore, the frequency of stop codon usage in the different DRFs was also insufficient to account for the DRF bias. Collectively, these findings favor the remaining alternative, namely that selection for particular amino acid motifs within the DH gene sequence is occurring. Consistent with amino acid based selection, the usage of particular amino acids within particular DRFs is highly non-random.
Currently we have no clear explanation for the mechanism relating the amino acid usage with the DRF usage. The simplest explanation would be that some target antigens bind to specific amino acids. Thus, the main element that shapes the DRF bias could be simply the need to express or avoid certain specific amino acids in the CDR3 region. As such, these results may provide a map of “permissive” CDR3 amino acid motifs that could be helpful in the analysis of antibody and autoantibody repertoires. The DRF bias could be altered if there is relaxed selection stringency, as could occur in autoimmunity.
In parallel to the current analysis, DRF bias in human B cells has been studied by Larimore et al (31), which confirm our observation on the larger DRF bias in productive than in non-productive rearrangements, the authors observed biases against longer CDR3 sequences with higher hydrophobicity (GRAVY) scores amongst productive rearrangements. Counter-selection against longer CDR3 sequences has also been documented during early B cell development in humans (46), and is observed in our sequences. However, we did not observe the skewing toward hydrophobic residues. In our analysis, we computed the correlation between the DRF usage with the presence or absence of the different amino acids (Fig. 9). Therefore, we should expect a negative correlation with hydrophobic amino acids. Instead, we show that hydrophobic amino acids either positively (Phenylalanine, Isoleucine) or negatively (Leucine, Tryptophan) correlated with the DRF usage, and some did not correlated at all (Methionine, Valine).
Our analysis shows that in addition to major shifts during early B cell development, DRF usage appears to be further shaped by peripheral selection, as could arise through exposure and immune responses to foreign antigens produced by pathogens. We have compared the naïve and memory B cell repertoires. Biases in DRF usage are most pronounced and consistent between different individuals in the naïve B cell repertoire. Amongst the CD27+ B cell pools there are greater inter-individual differences. Amongst IgG+ CD27+ B cells the DRF bias is less pronounced and overall the repertoire appears to contract, with a smaller and shorter range of CDR3 lengths. Additionally, there are differences in DRF usage between IgA+ and IgG+ subsets. Collectively, these data suggest that DRF is subjected to more than one selection checkpoint, the first occurring in the bone marrow, followed by a second occurring peripherally. We have no clear explanation why IgG selection appears to be more stringent than IgA selection. It does not appear to be due to differences in sample size and because unique sequences rather than total copies were analyzed, thus these data are not likely to be significantly skewed by clonal expansion.
The conclusion from all these observations is that the repertoire is shaped by a common and seemingly quite stringent selection mechanism that operates primarily in the naive pool, followed by further selection in the periphery. This interpretation is reinforced by the very clear correlation between the presence of specific amino acids in the CDR3 with the usage of a given DRF. This correlation is very similar in samples from different individuals, again highlighting a common selection mechanism. However, it is not clear how this selection operates. Selection could be influenced by self-antigens that are highly expressed in the bone marrow or in the periphery, as proposed in the context of natural antibodies. Alternatively or in addition, the selection could be negative, disfavoring antibodies with certain biochemical properties in their CDR3s. In mice, we and others (7–11, 47) have shown that charged amino acids induce negative selection, which constrains the DRF (8).
This study advances our understanding of B cell repertoire selection in two basic ways:
First, this study shows that DH gene segments do not afford maximal diversity, due to the biased usage of particular DRFs. This restriction in diversity arises after V(D)J recombination because OF rearrangements do not exhibit a similar bias. This implies that selection for particular RFs occurs after their generation. Intriguingly, the restricted usage of a subset of amino acids in a particular DH is seen over a large range of rearrangement lengths. This suggests that there is an important region at the core of the DH gene sequence that may be getting selected. We show that the Dμ protein and the frequency of stop codons in the different DRFs are insufficient to account for the degree of DRF skewing. Finally, we show that most of the DRF skewing occurs in naïve IgM+ B cells and that DRF usage shifts slightly in the more mature (CD27+) B cell pools. Taken together, these findings indicate that there are two windows for DRF selection during B cell development. By defining the skewed DRF usage in healthy individuals, we can use this information to study how B cell selection may be altered in B cell disorders such as autoimmunity or cancer.
Second, we show that the bias in DRF varies by individual DH gene segment and is reproducible in different individuals. This implies that the selection mechanism leading to DRF bias may be evolutionarily conserved. Analyzing the DRF distribution in different species may provide insight into the potential (self) antigens that drive this process.
There are three potential limitations to this analysis. First, the amino acid: DRF correlation is biased by the presence of stop codons. For example, Leucine is often present near a stop codon. However, even when only sequences without stop codons are used, clear correlations are observed (Supplemental Fig. 4). Second, this analysis utilizes the entire germline DH sequence. Since DH genes are frequently nibbled from both ends during non-homologous end joining, the amino acid occupancy matrix may not adequately reflect the true amino acid usage. Indeed, one can for example observe a very limited negative correlation of the DRF frequency with the presence of stop codons. The correlation is limited, since stop codons are often near the borders of the DH gene and are nibbled away. Note that herein we have not analyzed the effect of somatic hypermutation on DRF. This is a fascinating issue and one that requires far more analysis in the future.
Supplementary Material
Abbreviations
- VH
heavy chain V region
- DH
heavy chain D region
- JH
heavy chain J region
- RF
reading frame
- DRF
DH gene reading frame
- IF
in-frame
- OF
out-of-frame
- SHM
somatic hypermutation
Footnotes
Funding for ELP was provided by the Lupus Research Institute and the NIH (R56-AI-090842).
A detailed example of clone detection can be found at this link: http://peptibase.cs.biu.ac.il/homepage/Lymphocyte_clone_detection.htm
A table of human DH genes and amino acid conversion in each reading frame can be found at this link: http://peptibase.cs.biu.ac.il/homepage/Lymphocyte_trans_aa.htm
References
- 1.Blackwell TK, Alt FW. Mechanism and developmental program of immunoglobulin gene rearrangement in mammals. Annu Rev Genet. 1989;23:605–636. doi: 10.1146/annurev.ge.23.120189.003133. [DOI] [PubMed] [Google Scholar]
- 2.Fugmann SD, Lee AI, Shockett PE, Villey IJ, Schatz DG. The RAG proteins and V (D) J recombination: complexes, ends, and transposition. Annu Rev Immunol. 2000;18:495–527. doi: 10.1146/annurev.immunol.18.1.495. [DOI] [PubMed] [Google Scholar]
- 3.Nemazee D. Receptor editing in lymphocyte development and central tolerance. Nat Rev Immunol. 2006;6:728–740. doi: 10.1038/nri1939. [DOI] [PubMed] [Google Scholar]
- 4.Nemazee D, Weigert M. Revising B cell receptors. J Exp Med. 2000;191:1813–1818. doi: 10.1084/jem.191.11.1813. [DOI] [PMC free article] [PubMed] [Google Scholar]
- 5.Kabat EA, Wu TT, Bilofsky H. Variable region genes for the immunoglobulin framework are assembled from small segments of DNA—A hypothesis. Proc Natl Acad Sci U S A. 1978;75:2429. doi: 10.1073/pnas.75.5.2429. [DOI] [PMC free article] [PubMed] [Google Scholar]
- 6.Schroeder HW, Walter MA, Hofker MH, Ebens A, Willems van Dijk K, Liao LC, Cox DW, Milner E, Perlmutter RM. Physical linkage of a human immunoglobulin heavy chain variable region gene segment to diversity and joining region elements. Proc Natl Acad Sci U S A. 1988;85:8196. doi: 10.1073/pnas.85.21.8196. [DOI] [PMC free article] [PubMed] [Google Scholar]
- 7.Volpe J, Kepler T. Large-scale analysis of human heavy chain V (D) J recombination patterns. Immunome research. 2008;4:3. doi: 10.1186/1745-7580-4-3. [DOI] [PMC free article] [PubMed] [Google Scholar]
- 8.Louzoun Y, Luning PE, Litwin S, Weigert M. D is for different-differences between H and L chain rearrangement. 2002. p. 239. [DOI] [PubMed] [Google Scholar]
- 9.Schelonka RL, Zemlin M, Kobayashi R, Ippolito GC, Zhuang Y, Gartland GL, Szalai A, Fujihashi K, Rajewsky K, Schroeder HW. Preferential use of DH reading frame 2 alters B cell development and antigen-specific antibody production. J Immunol. 2008;181:8409. doi: 10.4049/jimmunol.181.12.8409. [DOI] [PMC free article] [PubMed] [Google Scholar]
- 10.Zemlin M, Schelonka RL, Ippolito GC, Zemlin C, Zhuang Y, Gartland GL, Nitschke L, Pelkonen J, Rajewsky K, Schroeder HW. Regulation of Repertoire Development through Genetic Control of DH Reading Frame Preference. J Immunol. 2008;181:8416–8424. doi: 10.4049/jimmunol.181.12.8416. [DOI] [PMC free article] [PubMed] [Google Scholar]
- 11.Gu H, Kitamura D, Rajewsky K. B cell development regulated by gene rearrangement: arrest of maturation by membrane-bound D mu protein and selection of DH element reading frames. Cell. 1991;65:47. doi: 10.1016/0092-8674(91)90406-o. [DOI] [PubMed] [Google Scholar]
- 12.Reth MG, Alt FW. Novel immunoglobulin heavy chains are produced from DJH gene segment rearrangements in lymphoid cells. Nature. 1984;312:418–423. doi: 10.1038/312418a0. [DOI] [PubMed] [Google Scholar]
- 13.Alt FW, Baltimore D. Joining of immunoglobulin heavy chain gene segments: implications from a chromosome with evidence of three D-JH fusions. Proc Natl Acad Sci U S A. 1982;79:4118–4122. doi: 10.1073/pnas.79.13.4118. [DOI] [PMC free article] [PubMed] [Google Scholar]
- 14.Meek KD, Hasemann CA, Capra JD. Novel rearrangements at the immunoglobulin D locus. Inversions and fusions add to IgH somatic diversity. J Exp Med. 1989;170:39–57. doi: 10.1084/jem.170.1.39. [DOI] [PMC free article] [PubMed] [Google Scholar]
- 15.Sollbach AE, Wu GE. INVERSIONS PRODUCED DURING V(D)J REARRANGEMENT AT IGH, THE IMMUNOGLOBULIN HEAVY-CHAIN LOCUS. Mol Cell Biol. 1995;15:671–681. doi: 10.1128/mcb.15.2.671. [DOI] [PMC free article] [PubMed] [Google Scholar]
- 16.Radic M, Mackle J, Erikson J, Mol C, Anderson W, Weigert M. Residues that mediate DNA binding of autoimmune antibodies. J Immunol. 1993;150:4966. [PubMed] [Google Scholar]
- 17.Nemazee D. Receptor editing in B cells. Adv Immunol. 1999;74:89–126. doi: 10.1016/s0065-2776(08)60909-8. [DOI] [PubMed] [Google Scholar]
- 18.Chen C, Nagy Z, Luning Prak E, Weigert M. Immunoglobulin heavy chain gene replacement: a mechanism of receptor editing. Immunity. 1995;3:747–755. doi: 10.1016/1074-7613(95)90064-0. [DOI] [PubMed] [Google Scholar]
- 19.Prak EL, Trounstine M, Huszar D, Weigert M. Light chain editing in kappa-deficient animals: a potential mechanism of B cell tolerance. J Exp Med. 1994;180:1805–1815. doi: 10.1084/jem.180.5.1805. [DOI] [PMC free article] [PubMed] [Google Scholar]
- 20.Gauss GH, Liebr MR. THE BASIS FOR THE MECHANISTIC BIAS FOR DELETIONAL OVER INVERSIONAL V(D)J RECOMBINATION. Genes Dev. 1992;6:1553–1561. doi: 10.1101/gad.6.8.1553. [DOI] [PubMed] [Google Scholar]
- 21.Ohm-Laursen L, Nielsen M, Larsen SR, Barington T. No evidence for the use of DIR, D–D fusions, chromosome 15 open reading frames or VHreplacement in the peripheral repertoire was found on application of an improved algorithm, JointML, to 6329 human immunoglobulin H rearrangements. Immunology. 2006;119:265–277. doi: 10.1111/j.1365-2567.2006.02431.x. [DOI] [PMC free article] [PubMed] [Google Scholar]
- 22.Corbett SJ, I, Tomlinson M, Sonnhammer EL, Buck D, Winter G. Sequence of the human immunoglobulin diversity (D) segment locus: a systematic analysis provides no evidence for the use of DIR segments, inverted D segments, “minor” D segments or D-D recombination. J Mol Biol. 1997;270:587–597. doi: 10.1006/jmbi.1997.1141. [DOI] [PubMed] [Google Scholar]
- 23.Souto-Carneiro MM, Longo NS, Russ DE, Sun H, Lipsky PE. Characterization of the human Ig heavy chain antigen binding complementarity determining region 3 using a newly developed software algorithm, JOINSOLVER. J Immunol. 2004;172:6790. doi: 10.4049/jimmunol.172.11.6790. [DOI] [PubMed] [Google Scholar]
- 24.Briney BS, Willis JR, Hicar MD, Thomas JW, Crowe JE. Frequency and genetic characterization of V(DD)J recombinants in the human peripheral blood antibody repertoire. Immunology. 2012 doi: 10.1111/j.1365-2567.2012.03605.x. [DOI] [PMC free article] [PubMed] [Google Scholar]
- 25.ten Boekel E, Melchers F, Rolink AG. Changes in the V(H) gene repertoire of developing precursor B lymphocytes in mouse bone marrow mediated by the pre-B cell receptor. Immunity. 1997;7:357–368. doi: 10.1016/s1074-7613(00)80357-x. [DOI] [PubMed] [Google Scholar]
- 26.Meng W, Yunk L, Wang LS, Maganty A, Xue E, Cohen PL, Eisenberg RA, Weigert MG, Mancini SJ, Prak ET. Selection of individual VH genes occurs at the pro-B to pre-B cell transition. J Immunol. 2011;187:1835–1844. doi: 10.4049/jimmunol.1100207. [DOI] [PMC free article] [PubMed] [Google Scholar]
- 27.Cohen R, Kleinstein S, Louzoun Y. Somatic hypermutation targeting is influenced by location within the immunoglobulin V region. Mol Immunol. 2011 doi: 10.1016/j.molimm.2011.04.002. [DOI] [PMC free article] [PubMed] [Google Scholar]
- 28.Dorner T, Brezinschek HP, Brezinschek RI, Foster SJ, Domiati-Saad R, Lipsky PE. Analysis of the frequency and pattern of somatic mutations within nonproductively rearranged human variable heavy chain genes. J Immunol. 1997;158:2779. [PubMed] [Google Scholar]
- 29.Xue W, Luo S, Adler WH, Schulze DH, Berman JE. Immunoglobulin Heavy Chain Junctional Diversity in Young and Aged Humans. Hum Immunol. 1997;57:80–92. doi: 10.1016/s0198-8859(97)00184-5. [DOI] [PubMed] [Google Scholar]
- 30.Glanville J, Zhai W, Berka J, Telman D, Huerta G, Mehta GR, Ni I, Mei L, Sundar PD, Day GMR. Precise determination of the diversity of a combinatorial antibody library gives insight into the human immunoglobulin repertoire. Proc Natl Acad Sci U S A. 2009;106:20216–20221. doi: 10.1073/pnas.0909775106. [DOI] [PMC free article] [PubMed] [Google Scholar]
- 31.Larimore K, McCormick MW, Robins HS, Greenberg PD. Shaping of human germline IgH repertoires revealed by deep sequencing. J Immunol. 2012;189:3221–3230. doi: 10.4049/jimmunol.1201303. [DOI] [PubMed] [Google Scholar]
- 32.Monod MY, Giudicelli V, Chaume D, Lefranc MP. IMGT/JunctionAnalysis: the first tool for the analysis of the immunoglobulin and T cell receptor complex V–J and V–D–J JUNCTIONs. Bioinformatics. 2004;20:i379–i385. doi: 10.1093/bioinformatics/bth945. [DOI] [PubMed] [Google Scholar]
- 33.Lefranc MP, Giudicelli V, Ginestoux C, Bodmer J, Muller W, Bontrop R, Lemaitre M, Malik A, Barbie V, Chaume D. IMGT, the international ImMunoGeneTics database. Nucleic Acids Res. 1999;27:209–212. doi: 10.1093/nar/27.1.209. [DOI] [PMC free article] [PubMed] [Google Scholar]
- 34.Edgar RC. MUSCLE: multiple sequence alignment with high accuracy and high throughput. Nucleic Acids Res. 2004;32:1792–1797. doi: 10.1093/nar/gkh340. [DOI] [PMC free article] [PubMed] [Google Scholar]
- 35.Kolaczkowski B, Thornton JW. Performance of maximum parsimony and likelihood phylogenetics when evolution is heterogeneous. Nature. 2004;431:980–984. doi: 10.1038/nature02917. [DOI] [PubMed] [Google Scholar]
- 36.Saitou N, Nei M. The neighbor-joining method: a new method for reconstructing phylogenetic trees. Mol Biol Evol. 1987;4:406–425. doi: 10.1093/oxfordjournals.molbev.a040454. [DOI] [PubMed] [Google Scholar]
- 37.Volpe JM, Cowell LG, Kepler TB. SoDA: implementation of a 3D alignment algorithm for inference of antigen receptor recombinations. Bioinformatics. 2006;22:438–444. doi: 10.1093/bioinformatics/btk004. [DOI] [PubMed] [Google Scholar]
- 38.Gaëta BA, Malming HR, Jackson KJL, Bain ME, Wilson P, Collins AM. iHMMune-align: hidden Markov model-based alignment and identification of germline genes in rearranged immunoglobulin gene sequences. Bioinformatics. 2007;23:1580–1587. doi: 10.1093/bioinformatics/btm147. [DOI] [PubMed] [Google Scholar]
- 39.Guo B, Kato RM, Garcia-Lloret M, Wahl MI, Rawlings DJ. Engagement of the human pre-B cell receptor generates a lipid raft-dependent calcium signaling complex. Immunity. 2000;13:243–253. doi: 10.1016/s1074-7613(00)00024-8. [DOI] [PubMed] [Google Scholar]
- 40.Hayashi K, Yamamoto M, Nojima T, Goitsuka R, Kitamura D. Distinct signaling requirements for Dmu selection, IgH allelic exclusion, pre-B cell transition, and tumor suppression in B cell progenitors. Immunity. 2003;18:825–836. doi: 10.1016/s1074-7613(03)00142-0. [DOI] [PubMed] [Google Scholar]
- 41.Cohn M, Langman RE. The protection: the unit of humoral immunity selected by evolution. Immunol Rev. 1990;115:7–147. doi: 10.1111/j.1600-065x.1990.tb00783.x. [DOI] [PubMed] [Google Scholar]
- 42.Louzoun Y, Friedman T, Luning Prak E, Litwin S, Weigert M. Light chain rearrangement. Elsevier; 2002. Analysis of B cell receptor production and rearrangement* 1:: Part I; pp. 169–190. [DOI] [PubMed] [Google Scholar]
- 43.Li Y, Louzoun Y, Weigert M. Editing anti-DNA B cells by Vλx. J Exp Med. 2004;199:337. doi: 10.1084/jem.20031712. [DOI] [PMC free article] [PubMed] [Google Scholar]
- 44.Li H, Jiang Y, Prak EL, Radic M, Weigert M. Editors and editing of anti-DNA receptors. Immunity. 2001;15:947–957. doi: 10.1016/s1074-7613(01)00251-5. [DOI] [PubMed] [Google Scholar]
- 45.Reth MG, Alt FW. Novel immunoglobulin heavy chains are produced from DJH gene segment rearrangements in lymphoid cells. Nature. 1984 doi: 10.1038/312418a0. [DOI] [PubMed] [Google Scholar]
- 46.Wardemann H, Yurasov S, Schaefer A, Young JW, Meffre E, Nussenzweig MC. Predominant autoantibody production by early human B cell precursors. Science. 2003;301:1374–1377. doi: 10.1126/science.1086907. [DOI] [PubMed] [Google Scholar]
- 47.Kabat EA, Wu TT. Identical V region amino acid sequences and segments of sequences in antibodies of different specificities. Relative contributions of VH and VL genes, minigenes, and complementarity-determining regions to binding of antibody-combining sites. J Immunol. 1991;147:1709–1719. [PubMed] [Google Scholar]
Associated Data
This section collects any data citations, data availability statements, or supplementary materials included in this article.