

Abstract
We show that microRNA-155 (miR-155) is upregulated in primary effector and effector memory CD8+ T cells but is low in naive and central memory cells. Anti-viral CD8+ T cell responses and viral clearance were impaired in miR-155 deficient (miR-155-KO) mice, and this defect was intrinsic to CD8+ T cells as miR-155-KO CD8+ T cells mounted greatly reduced primary and memory responses. Conversely, miR-155 overexpression augmented anti-viral CD8+ T cell responses in vivo. Gene expression profiling of miR-155-KO CD8+ T cells revealed increased type I interferon signaling and sensitivity. Inhibiting STAT1 or IRF7 increased miR-155-KO CD8+ T cell responses in vivo. We report a novel role for miR-155 in regulating IFN responsiveness and CD8+ T cell responses against pathogens in vivo.
Introduction
CD8+ T cells or Cytotoxic T lymphocytes (CTLs) form a critical arm of the adaptive immune system, providing immunity to various intracellular pathogens and malignant cells. MicroRNAs are small non-coding RNAs, approximately 22 nucleotides long, recently identified as key modulators of post-transcriptional gene modulation in mammals1-4. The importance of microRNAs in T cell immunity is highlighted by the finding that CD4+ T cells lacking the enzyme Dicer, a critical enzyme for the maturation of microRNA1, 5-7, exhibit impaired responses8. Deletion of Dicer in CD8+ T cells results in a reduced effector CD8+ T cell population as a consequence of impaired migration and survival9. The role of individual microRNAs, however, in the CD8+ T cell response is largely unexplored.
One microRNA with an emerging role in regulating immune responses is microRNA-155 (miR-155)10. MiR-155 is essential for normal B cell differentiation and antibody production11-13 and is involved in inflammation by regulating members of the TNF receptor or ligand superfamilies, such as TNF and TRAMP (TNFRSF25)14, 15. MiR-155 deficient (miR-155-KO) dendritic cells fail to efficiently present antigens11 while miR-155 in CD4+ T cells controls TH1, TH2 and TH17 subset differentiation11, 12 16 and affects Treg cell development17, 18. Recently miR-155 was also reported to regulate CD8+ T cells19, 20. Thus, miR-155 may control protective immune responses and inflammation at multiple levels.
In the current study we show that miR-155 expression is greatly increased in CD8+ T cells upon activation in vitro as well as by antigen-specific effector CD8+ T cells in vivo. Naive and central memory cells express low levels while effector memory cells express intermediate levels of miR-155. We identified miR-155 as being intrinsically required for optimal primary CD8+ T cell responses mounted against influenza virus and Listeria monocytogenes infection and crucial for the generation of CD8+ T cell memory against these pathogens. MiR-155 was determined to be important for CD8+ T cell proliferation, affecting multiple predicted target and other genes associated with type I IFN signaling. MiR-155 regulated the antiproliferative effect of type I IFN and may explain the paradox between IFN serving as both a positive signal 321, 22 and its negative anti-proliferative effect23–25.
Results
MiR-155 expression by CD8+ T cells
We first examined whether the activation and differentiation status of CD8+ T cells affects miR-155 expression. Upon in vitro stimulation, naive CD8+ T cells rapidly increase miR-155 RNA expression. Activation of purified CD8+ T cells with solid phase anti-CD3/anti-CD28 antibodies for 24h resulted in a 42-fold increase of miR-155 compared to unstimulated naive CD8+ T cells. On days 3 and 5 of activation, the levels of miR-155 further increased to 83- and 104-fold, respectively, over naive unstimulated controls (Fig. 1a). Treatment of unstimulated naive CD8+ T cells with 10ng/ml of TNF, IFN-γ, IL-1β or 1000U/ml IFN-β for 24h did not affect miR-155 levels while in activated cells it increased miR-155 levels by 2-fold (Supplementary Fig. 1a).
Figure 1.
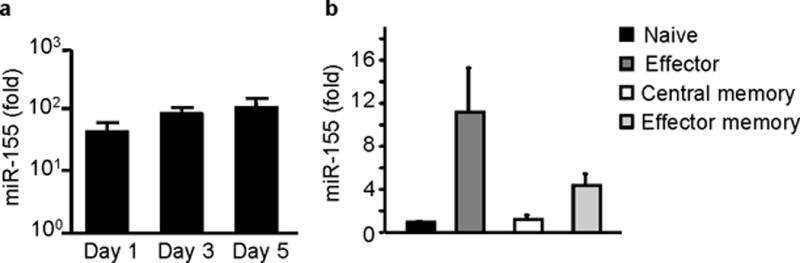
miR-155 is expressed in CD8+ T cells. (a) miR-155 is highly upregulated with in vitro activation of CD8+ T cells. Sorted splenic CD8+ T cells from wild-type C57BL/6 mice were stimulated in vitro with anti-CD3, anti-CD28 antibodies for 1, 3 and 5 days and miR-155 expression was quantified by RT-PCR. Graph shows fold increase of miR-155 expression over sorted unstimulated CD8+ T cells. Bars represent mean and standard errors of 5 animals per group tested in 3 independent experiments. (b) miR-155 is expressed in vivo in primary effector and effector memory CD8+ T cells. Donor day 10 lung effector CD44+CD62L- CD8+ T cells and donor day 60 splenic effector memory CD44+CD62L- or central memory CD44+CD62L+ CD8+ T cells were sorted from congenic animals that had received OT-I adoptive transfers and been infected with WSN-OVA influenza virus. Naive CD44-CD62L+ CD8+ T cells were sorted from spleens of naive OT-I mice. MiR-155 expression was quantified by RT-PCR. Graph depicts fold increase of miR-155 over naive CD8+ T cells. Bars represent mean and SEM from 3-5 mice/groups and 2 independent experiments. All values were normalized to 18S rRNA expression.
To determine if miR-155 is also expressed in vivo during CD8+ T cell responses, we measured miR-155 in sorted donor OT-I CD8+ T cells isolated from congenic Thy-1.2+ mice that had been adoptively transferred with Thy-1.1 OVA(257–264)-specific TCR-transgenic OT-I cells, and then infected with the OVA(257–264) peptide-expressing WSN-OVA influenza virus. Donor lung day 10 effector CD44+CD62L- OT-I cells were found to express 11-fold more miR-155 relative to naive CD44-CD62L+ OT-I cells (Fig. 1b). In contrast, donor day 60 splenic central memory CD44+CD62L+ OT-I cells downregulated miR-155 to naive cell levels (1.2-fold relative to naive CD8+ T cells, Fig. 1b). The donor day 60 splenic effector memory CD44+CD62L- OT-I cell subset showed a 4.4-fold increase in miR-155 levels (Fig. 1b) that was intermediate between primary effector and central memory cells. The sustained induction of miR-155 expression seen in in vitro and ex vivo CD8+ T cells suggests that miR-155 may play a role in regulating CD8+ T cell responses.
MiR-155 is required for CD8+ T cell responses
To test whether miR-155 plays a role in CD8+ T cell responses in vivo, we infected miR-155-KO and congenic wild-type C57BL/6 mice with a sublethal dose of A/PR/8/34 influenza virus. Antigen-specific CD8+ T cells were identified by surface staining with MHC class I tetramers loaded with the NP(366–374) immunodominant peptide. MiR-155-KO mice showed greatly reduced frequencies and numbers of peak day 10 lung NP(366–374)-specific CD8+ T cells compared to wild-type mice with numbers of pulmonary NP(366–374)-specific CD8+ T cells in miR-155-KO mice reduced by 6-fold compared to wild-type animals (Fig. 2a and b). This reduction of NP(366–374)-specific CD8+ T cells was also observed in mediastinal lymph nodes (MLN) and spleens (data not shown). This reduced CD8+ T cell response in miR-155-KO mice was accompanied by impaired viral clearance (Fig. 2c). The reduced CD8+ T cell response was not due defects in their generation and differentiation in miR-155-KO mice as the numbers, naive-memory phenotype (CD62L, CD44, KLRG1, CD127, CD27 and CD28) and activation status (CD69 and CD25) of splenic CD8+ T cells in uninfected miR-155-KO mice did not differ from wild type animals (Data not shown and Supplementary Fig. 1b).
Figure 2.
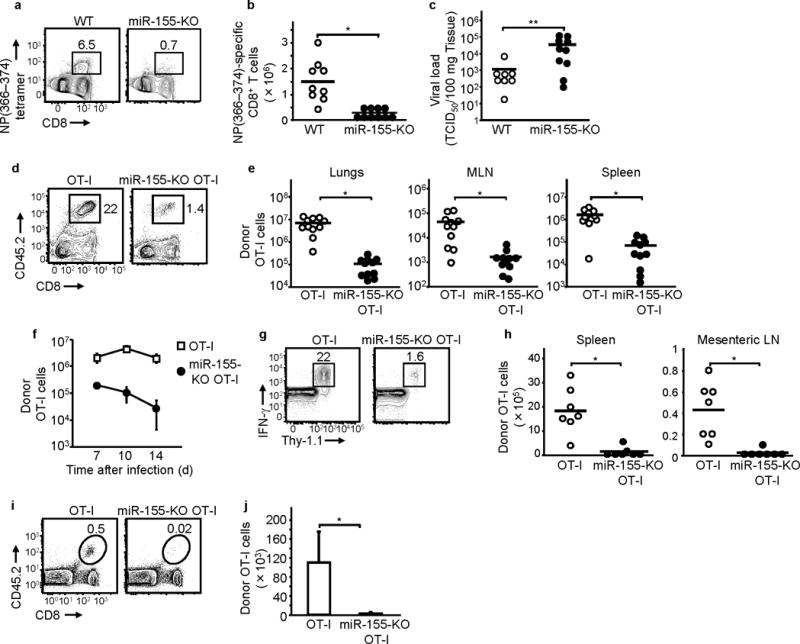
miR-155 is required for CD8+ T cell responses. Reduced CD8+ T cell responses (a), (b) and viral clearance (c) in influenza virus-infected miR-155-KO mice. (a) Representative flow cytometric plots and (b) numbers of day 10 lung NP(366–374)-specific CD8+ T cells shown. (c) Day 10 lung viral loads of wild-type and miR-155-KO mice. Data are from three experiments. * P < 0.002 and ** P < 0.05 (Student’s t-test). (d) , (e) , (f) Impaired response of miR-155-KO OT-I cells to WSN-OVA influenza virus. Representative flow cytometric plots of lung (d), and numbers (e) of donor OT-I cells in day 10 lungs, mediastinal LN (MLN) and spleens shown. Data from 4 experiments. * P < 0.001 (Student’s t-test for lungs and spleens, Mann-Whitney U test for MLN). (f) Kinetics of lung donor OT-I cell numbers shown (two experiments, n = 4 per group). (g) and (h) Reduced response of miR-155-KO OT-I against Listeria monocytogenes infection. Representative flow cytometric plots of spleens (g) and numbers (h) of day 7 post-infection donor IFN-γ+ OT-I cells in spleens and mesenteric LN are depicted. Data from two experiments. * P < 0.001 (Student’s t-test) (i) and (j) miR-155 deficiency impairs CD8+ T cell memory generation. Representative flow cytometric plots of spleens (i) and numbers in spleens (j) of day 60 donor memory OT-I cells in WSN-OVA influenza virus-infected mice shown. Means and SEM of 2 experiments ( n = 6 per group) shown. * P < 0.05 (Mann-Whitney U test). In all figures above, numbers in flow cytometric plots indicate percent of lymphocytes.
Since multiple immune cells are known to be affected by miR-15511-13, 17, 18, we sought to determine whether miR-155 deficiency conferred an intrinsic defect in the CD8+ T cell ability to respond to pathogens. We generated CD45.2+ miR-155-KO OT-I mice (on a C57BL/6 background) and adoptively transferred 104 CD45.2+ miR-155-KO OT-I or wild-type CD45.2+OT-I CD8+ T cells into congenic CD45.1+ wild-type mice and infected them with influenza virus WSN-OVA. At day 10 post-infection, donor lung OVA(257–264)-specific CD8+ T cells were reduced by 98% in hosts transferred with miR-155-KO OT-I cells compared to recipients of OT-I cells (Fig. 2d and e). This reduction was also found in MLN and spleens (Fig. 2e), indicating that survival and/or proliferation, but not trafficking, of CD8+ T cells was affected by miR-155 deficiency. The reduced peak response of miR-155-KO OT-I cell was not due to a shift in the kinetics (Fig. 2f). MiR-155 deficiency was affecting later stages of the primary CD8+ T cell response to influenza virus because early time points such as day 4 were not affected (Supplementary Fig. 1c). The naive-memory phenotype (CD62L, CD44, KLRG1, CD127, CD27 and CD28) and activation status (CD69 and CD25) of miR-155-KO OT-I cells was not different from that of wild-type OT-I cells on days 4 and 10 post-infection (data not shown).
To examine whether miR-155 deficiency affected CD8+ T cell responses to bacterial infection, we adoptively transferred Thy-1.1+ OT-I or Thy-1.1+ miR-155-KO OT-1 cells into Thy-1.2+ congenic mice and infected them with ovalbumin-expressing Listeria monocytogenes(L.m.-OVA). Mice transferred with miR-155-KO OT-I CD8+ T cells had 15-fold lower numbers of donor OVA(257–264)-specific CD8+ T cells on day 7 post-infection in spleens compared to OT-I cell recipients (Fig. 2g and h). Similar reductions were observed in the mesenteric lymph nodes (Fig. 2h). Similar to the influenza virus response, during LM-OVA infection, miR-155-KO OT-I responses were not reduced early in the response (Supplementary Fig. 1d).
Finally, to evaluate miR-155’s role in the establishment CD8+ T cell memory, we adoptively transferred 104 CD45.2+ miR-155-KO OT-I or CD45.2+ OT-I cells into CD45.1+ mice that were infected with influenza virus WSN-OVA. At day 60 post-infection, donor memory miR-155-KO OT-I cells were reduced by 37-fold in the spleens relative to the wild-type OT-I (Fig. 2i and j). This reduction in donor memory miR-155-KO OT-I cells was also apparent in the MLNs and the lungs (Supplementary Fig. 1e). When we analyzed short lived effector cells (SLEC) and memory precursor effector cells (MPEC) during the primary response, we found that miR-155 deficiency impaired the numbers of both populations (Supplementary Fig. 1f). These findings indicate that miR-155 is required for the establishment of a CD8+ T cell memory pool during pathogenic infections. This is most likely due to the requirement for miR-155 for memory precursor cell generation during the primary response, although currently we cannot exclude effects on memory cell differentiation or maintenance. However, both SLEC and MPEC are reduced during the primary response, thus miR-155 has a global effect on CD8+ T cell expansion and does not selectively affect memory precursors.
These above demonstrate that miR-155 plays an intrinsic role in regulating primary CD8+ T cell responses against viral and bacterial pathogens and affects the establishment of memory CD8+ T cells.
Overexpression of miR-155 augments CD8+ T cell responses
Since miR-155 deficiency inhibited CD8+ T cell responses, we investigated whether miR-155 overexpression would enhance CD8+ T cell immunity. To address this, we transduced Thy-1.1+ OT-I CD8+ T cells with a miR-155-expressing MIGR1 retroviral vector or a MIGR1 control vector that co-expresses GFP. After 48 hours, 102 donor GFP+ OT-I CD8+ T cells were intravenously transferred into Thy-1.2+ C57BL/6 mice, and recipients were infected with influenza virus WSN-OVA. At 10 days post-infection the pulmonary miR-155-transduced OT-I cell population had expanded five times more (3845 ± 1702 fold expansion over transferred cell number) than the control vector-transduced OT-I cells (766 ±164 fold expansion) (Fig. 3a) and produced more IFN-γ but not TNF (Fig. 3b). Similar increases were also observed in the MLNs and the spleens (data not shown). Animals transferred with miR-155-expressing MIGR1-transduced OT-I cells also had lower viral loads (Fig. 3c). Thus overexpression of miR-155 augments CD8+ T cell responses.
Figure 3.
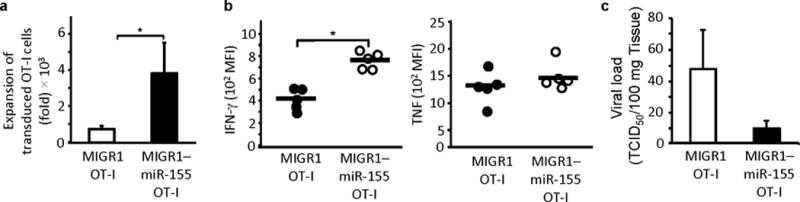
miR-155 overexpression augments CD8+ T cell responses. (a) Increased expansion of miR-155 overexpressing CD8+ T cells. Fold expansion shown of day 10 lung donor OT-I cells in animals that had received adoptive transfers of retrovirally transduced OT-I cells and were infected with WSN-OVA virus. Bars show mean ± SEM of 3 independent experiments (n = 8-10 per group). * P < 0.05 (Mann-Whitney U test). (b) miR-155 overexpression leads to increased IFN-γ but not TNF-α expression in day 10 donor OT-I cells. Data from 2 experiments ( n = 5). * P < 0.001 (Student’s t-test). (c) Adoptive transfer of miR-155 overexpressing OT-I enhances clearance of influenza virus. Data from 3 experiments ( n = 8).
miR-155 regulates proliferation and type I IFN sensitivity
To investigate whether miR-155 could affect early TCR signaling, like miR-181a26, 27, we performed calcium flux experiments. Purified CD8+ T cells were loaded with the dye Fluo-4, stimulated with anti-CD3, and Ca++ flux was measured by flow cytometry. MiR-155-KO CD8+ T cells fluxed Ca++ to a similar extent as wild-type CD8+ T cells when stimulated with anti-CD3 (Fig. 4a). In addition, activation markers CD25 and CD69 were normally expressed at 24 h post-activation in miR-155-KO CD8+ T cells (data not shown). The above shows that early TCR signaling is unaffected in miR-155-deficient CD8+ T cells.
Figure 4.
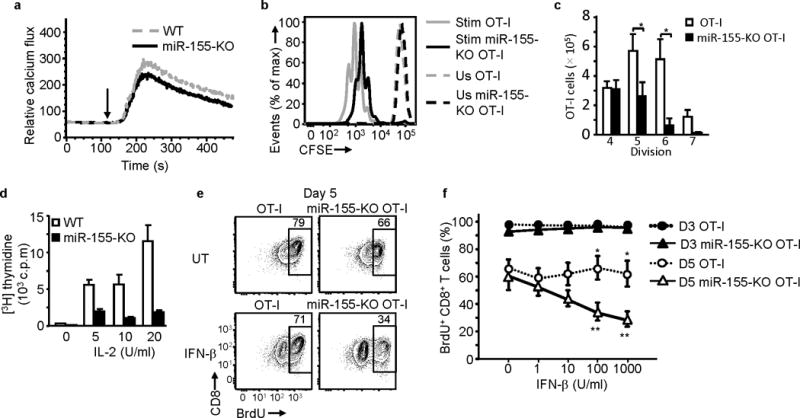
miR-155 deficiency impairs CD8+ T cell proliferation and increases the antiproliferative effect of IFN-β. (a) TCR-stimulated intracellular calcium flux is not affected in miR-155. Representative histogram of 3 experiments performed shown. Arrows indicate stimulation time point. (b) and (c) Purified and CFSE-labeled CD8+ T cells were either left unstimulated (Us) or stimulated (Stim) with OVA(257–264)-pulsed irradiated splenocytes for 4 days. (b) Representative histogram plot of CFSE dilution showing reduced proliferation of miR-155-KO OT-I CD8+ T cells compared to OT-I CD8+ T cells. (c) Bar graph shows mean ± SEM of absolute number of live CD8+ T cells in each division peak. Data from 5 independent experiments ( n = 5 per group). * P< 0.015 (Student’s t-test). (d) Reduced 3H-Thymidine incorporation by purified miR-155-KO CD8+ T cells stimulated with anti-CD3 antibody + IL-2 for 5 days. Bars show mean ± SEM of triplicates of representative experiment of 4 performed. (e) and (f) IFNβ inhibits BrdU incorporation by peptide stimulated miR-155-KO OT-I cells. IFN-β (1000U/ml) was present for the duration of the culture. (e) Representative flow cytometric plots of day 5 of culture depicting IFN-β and untreated (UT) cells. Numbers in plots indicate percent of CD8+ T cells. (f) Day 3 and day 5 BrdU incorporation in response to increasing doses of IFNβ shown. Pooled data from 5 independent experiments shown; * P<0.05 for comparison between OT-I and miR-155-KO OT-I (Student’s t-test); ** P<0.05 for comparison between IFN-β treated and untreated miR-155-KO OT-I (Student’s t-test).
To determine whether the reduced in vivo responses of miR-155-KO CD8+ T cells were due to impaired proliferation, we purified splenic miR-155-KO OT-I or wild-type OT-I cells, labeled them with carboxy fluorescein diacetate, succinimidyl ester (CFSE) and stimulated them with OVA(257–264) -pulsed irradiated splenocytes and 10 U/ml IL-2. After four days, compared to OT-I cells, miR-155-KO OT-I cells displayed 54% fewer cells in divisions 5, 87% fewer cells in division 6 and 90% fewer cells in division 7 (Fig. 4b) and this was accompanied by a significant reduction in the cell number of miR-155-KO OT-I CD8+ T cells in divisions 5-7, when compared to wild-type OT-I CD8+ T cells (Fig. 4c). A proliferative defect of miR-155-KO CD8+ T cells was also found following stimulation with solid phase anti-CD3 antibody plus IL-2 stimulation. Compared to wild-type CD8+ T cells, miR-155-KO CD8+ T cells exhibited reduced [3H]thymidine incorporation (Fig. 4d). MiR-155-KO CD8+ T cells showed no significant increase in in vitro apoptosis after peptide stimulation (Supplementary Fig. 2a). MiR-155-KO CD8+ T cells also showed no increase in spontaneous, CD95-induced apoptosis and activation-induced cell death (AICD) in 72h cultures and no increase in ex vivo apoptosis (determined by annexin V stains) in influenza virus infected animals (data not shown). Since miR-155 can regulate cytokine production11, 28 we also examined IL-2, IFN-γ, TNF, IL-4 and IL-5 production in vitro and IFN-γ and TNF expression in vivo and found no difference between miR-155-KO and wild-type CD8+ T cells (data not shown and Supplementary Fig. 2b).
Since type I IFN signaling can regulate CD8+ T cell responses21, 22, 24, 25 and our gene expression analysis (see below) indicated that there may be increased type I IFN signaling in miR-155-KO CD8+ T cells, we tested the effect of type I IFN on proliferation. For this, miR-155-KO OT-I and wild-type OT-I cells were stimulated with OVA(257–264) peptide-pulsed irradiated splenocytes, treated with IFNβ1 and at 3 and 5 days Bromodeoxyuridine (5-bromo-2'-deoxyuridine, BrdU) incorporation was measured. IFNβ1 reduced BrdU incorporation in stimulated miR-155-KO OT-I CD8+ T cells in day 5 but not day 3 cultures (Fig. 4e and f). In day 5 cultures, IFNβ1-treatment resulted in a 3-fold reduction in the frequency of BrdU+ miR-155-KO OT-I cells compared to OT-I cells (Fig. 4f). In contrast, treatment of wild-type OT-I CD8+ T cells with IFNβ1 only modestly decreased BrdU+ cells (Fig. 4e and f). Inhibition of BrdU+ miR-155-KO OT-I cells in day 6 cultures was still observed when IFNβ1 was added after day 3 of culture (Supplementary Fig. 2c and d). Adding or blocking IFN-γ had no effect on miR-155-KO cell proliferation (data not shown and Supplementary Fig. 2d). The above suggest that miR-155 deficiency confers a proliferative defect in CD8+ T cell responses and may increase their susceptibility to type I IFN-mediated inhibition.
Heightened IFN signaling in miR-155-KO CD8+ T cells
To elucidate the molecular mechanisms affected in miR-155-KO CD8+ T cells, we compared the gene expression profiles of unstimulated and activated CD8+ T cells from both wild-type and miR-155-KO mice. Significance Analysis of Microarray (SAM analysis), failed to reveal a distinct transcriptional profile between unstimulated wild-type and miR-155-KO CD8+ T cells, with only 8 genes being identified as differentially expressed (delta = 1.6, FDR = 0.066) (Fig. 5a). Activated wild-type and miR-155-KO CD8+ T cells, however, had 845 genes differentially regulated (delta = 1.6, FDR = 0.082) (Fig. 5a) the majority of which showed less than 2-fold differential expression (Supplementary Table 1), suggesting that the absence of miR-155 results in large numbers of transcripts being moderately affected, rather than having a robust effect on individual targets.
Figure 5.
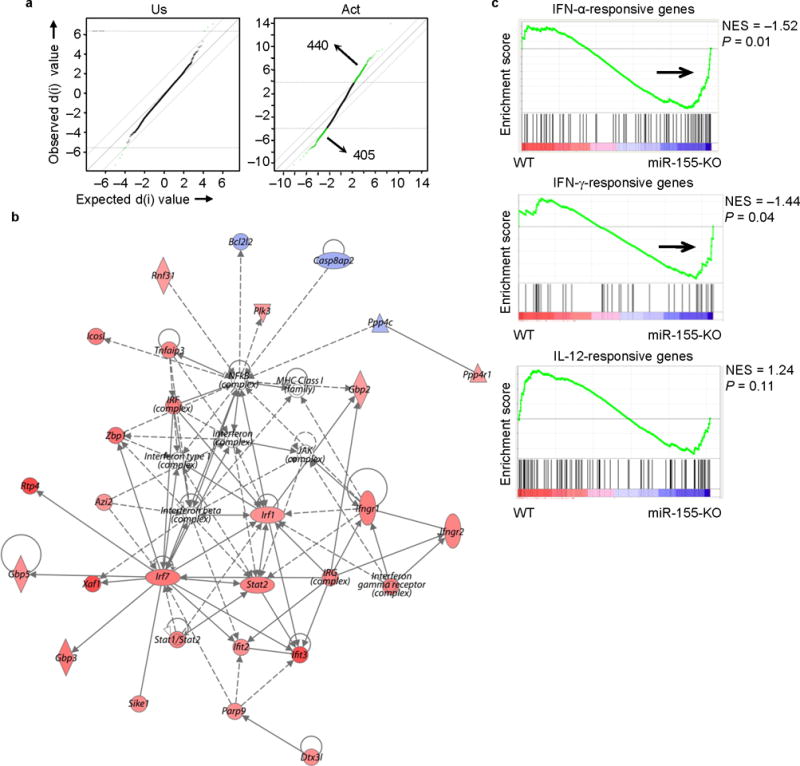
Molecular signature of activated miR-155-KO CD8+ T cells reveals enrichment of genes associated with type I IFN signaling. Microarray analysis was performed on unstimulated (Us) and in vitro activated (Act) CD8+ T cells. (a) SAM plots revealing significant changes in gene expression between activated miR-155-KO and wild-type CD8+ T cell groups (right panel) when compared to differences between naive groups (left panel). Numbers in plots indicate number of genes. (b) A network of type I IFN-related genes is up-regulated in activated miR-155-KO CD8+ T cells. The intensity of the color (red) represents expression level or upregulation. Direct (solid line) and indirect (dotted line) relationships between genes are indicated. (c) GSEA showing an enriched profile of genes associated with IFN signaling pathways in activated miR-155-KO CD8+ T cells. Microarray analysis were performed with an n = 3-4 per group.
We next used the top 250 differentially expressed genes, as identified by SAM analysis, and investigated which molecular pathways were affected by miR-155 deficiency by using an Ingenuity Pathway Analysis (IPA). The IFN signaling ( p = 0.0002), IRF-regulated ( p = 0.006), pyrimidine metabolism (p = 0.001), retinoic acid mediated apoptosis signaling (p = 0.001) and aryl hydrocarbon receptor signaling (p = 0.003) pathways were enriched in activated miR-155-KO CD8+ T cells. Multiple genes comprising an IRF-type I IFN-associated molecular network with relevance to cellular responses to infections were upregulated in activated miR-155-KO CD8+ T cells (Fig. 5b). Furthermore, using Gene Set Enrichment Analysis (GSEA) we compared the transcriptome signatures of activated wild-type and miR-155-KO CD8+ T cells with previously defined transcriptome signatures of IFN-regulated genes. The transcriptome signature of CD8+ T cells stimulated in vitro with IFN-α29, and to a lesser extent, that of IFN-γ-stimulated endothelial cells30, showed a significant enrichment in miR-155-KO CD8+ T cells, when compared to wild-type CD8+ T cells (Fig. 5c). In contrast, an IL-12-dependent molecular signature of in vitro activated CD8+ T cells29 was not enriched in either wild-type or miR-155-KO CD8+ T cells (Fig. 5c). These results demonstrate a role of miR-155 in regulating IFN signaling in CD8+ T cells.
To identify direct targets of miR-155 in CD8+ T cells, we used the Targetscan database (Release 6.1, March 2012) and found 299 predicted targets of miR-155, which were then hierarchically clustered. This revealed a cluster of 104 miR-155 target genes suppressed (>1.2-fold, q-value<0.05) during activation of wild-type CD8+ T cells (Fig. 6a). However, 28% of these genes were significantly less downregulated in activated miR-155-KO CD8+ T cells (>1.2-fold increase in activated miR-155-KO compared to activated wild-type CD8+ T cells), suggesting that miR-155 may regulate CD8+ T cells by targeting this subset (Fig. 6b and Table 1).
Figure 6.
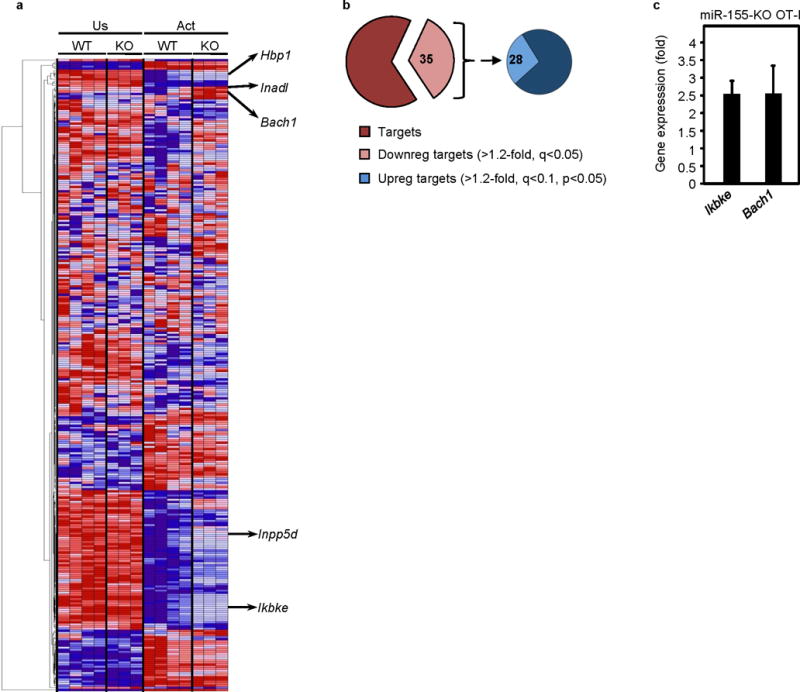
miR-155 deficiency in CD8+ T cells leads to dysregulated expression of potential miR-155 target genes. (a) Heat map showing relative expression of putative miR-155 target genes in unstimulated (Us) and in vitro activated (Act) miR-155-KO CD8+ T cells. (b) Differential expression of all predicted miR-155 target genes in miR-155-KO and wild type CD8+ T cells represented as pie charts. Left pie depicts all predicted miR-155 targets and the light brown pie piece those downregulated in activated versus unstimulated wild type CD8+ T cells. Right pie chart depicts the predicted miR-155 targets that were downregulated (Downreg) in activated wild type CD8+ T cells and the light blue pie piece depicts their subset that is increased (Upreg) in activated miR-155-KO CD8+ T cells compared to wild-type CD8+ T cells. Numbers in pie chart indicate percent of genes. (c) Validation of differential expression of Ikbke and Bach1 miR-155 target genes upregulated in miR-155-KO CD8+ T cells. CD8+ T cells were stimulated with OVA(257–264)-pulsed irradiated splenocytes for 4 days and the expression of Ikbke and Bach1 was quantified by RT-PCR. Bar graph shows mean ± SEM fold increase of mRNA expression in miR-155-KO OT-I compared to the wild-type OT-I cells (data from 2 independent experiments, n = 5 per group). All values were normalized to GAPDH mRNA expression.
Table 1.
MiR-155 target genes that are significantly increased in miR-155-KO CD8+ T cells.
| miR-155 potential target | fold change | p-value | q-value |
|---|---|---|---|
| Inadl | 2.24 | 0.02 | 0.08 |
| Zfp652 | 1.85 | 0.02 | 0.08 |
| Bach1 | 1.83 | 0.03 | 0.08 |
| Hbp1 | 1.65 | 0.04 | 0.09 |
| Ikbke | 1.61 | 0.03 | 0.09 |
| Jhdm1d | 1.54 | 0.03 | 0.09 |
| Tspan14 | 1.51 | 0.01 | 0.08 |
| Sgk3 | 1.46 | 0.00 | 0.07 |
| Fam105a | 1.39 | 0.03 | 0.09 |
| Arid4a | 1.38 | 0.01 | 0.08 |
| Rictor | 1.35 | 0.04 | 0.09 |
| Jarid2 | 1.35 | 0.00 | 0.08 |
| Ski | 1.32 | 0.04 | 0.09 |
| Ets1 | 1.29 | 0.02 | 0.08 |
| Znrf3 | 1.29 | 0.02 | 0.09 |
| Tle4 | 1.29 | 0.04 | 0.09 |
| Brwd1 | 1.28 | 0.01 | 0.08 |
| Lcor | 1.28 | 0.02 | 0.08 |
| Sdcbp | 1.28 | 0.00 | 0.08 |
| Mier3 | 1.27 | 0.01 | 0.08 |
| Mr1 | 1.26 | 0.02 | 0.09 |
| Rora | 1.26 | 0.02 | 0.08 |
| Csnk1g2 | 1.26 | 0.00 | 0.07 |
| Zfp236 | 1.23 | 0.03 | 0.09 |
| Map3k7ip2 | 1.23 | 0.00 | 0.08 |
| Mef2a | 1.22 | 0.01 | 0.08 |
| Kras | 1.22 | 0.01 | 0.08 |
| D19Wsu162e | 1.21 | 0.03 | 0.09 |
| Inpp5d | 1.20 | 0.01 | 0.08 |
To identify miR-155 targets that may mediate increased type I IFN signaling in miR-155-KO CD8+ T cells, we examined some of the miR-155 targets with the highest differential expression in the microarrays and reported to be involved in IFN signaling. Two such miR-155 targets were Ikbke (IKKε) 29, 30 and Bach131 and their increased expression in stimulated miR-155-KO OT-I was validated by quantitative RT-PCR (Fig 6c) and for IKKε at the protein level (Supplementary Fig. 3a). To directly test the involvement of IKKε and Bach1 in the phenotype of miR-155-KO CD8+ T cells, we generated IKKε-KO miR-155-KO OT-I mice and used BACH1 shRNA-expressing retroviruses. Adoptive transfer of these IKKε-KO miR-155-KO OT-I cells or BACH1 shRNA-expressing retrovirus-transduced miR-155-KO OT-I cells into wild-type mice that were subsequently infected with WSN-OVA, however, did not restore the miR-155-KO CD8+ T cell response (Supplementary Fig. 3b). We next examined a number of miR-155 target genes reported to be affected with miR-155 deficiency. SOCS-1 has been implicated in the phenotype of miR-155-KO Treg cells18. Although SOCS1 mRNA levels increased with activation in CD8+ T cells, they were not higher in miR-155-KO CD8+ T cells (Supplementary Fig. 3c and d). To further test the involvement of SOCS1, we transduced purified wild-type and miR-155-KO OT-I CD8+ T cells with either siRNA against SOCS1 or with a retrovirus expressing shRNA against SOCS1. Adoptive transfer of either SOCS1 siRNA or shRNA SOCS1-transduced miR-155-KO OT-I CD8+ T cells into wild-type animals infected with WSN-OVA influenza virus did not restore the CD8+ T cell response despite efficient knockdown of SOCS1 (Supplementary Fig. 3e, f and g). Thus, it is unlikely that SOCS-1 is the key mediator of the proliferative defect seen in miR-155-KO CD8+ T cells. Other miR-155 targets that may affect T cell activation such as SHIP132, 33 or STAT5 phosphorylation such as Smad234 were also examined by immunoblot in unstimulated or activated miR-155 deficient CD8+ T cells and were found not to be affected (Supplementary Fig. 3h).
These above results raise the possibility that the profound cellular defects of miR-155-KO CD8+ T cells may not be due to the dysregulation of a single target gene but results from the synergizing effects of multiple groups of modestly dysregulated genes that lead to type I IFN signaling and the associated proliferative defects observed in miR-155-KO CD8+ T cells.
IFN signaling contributes to the proliferative defect
Antigen-specific CD8+ T cells downregulate STAT1 as a means to overcome type I IFN-induced inhibition during LCMV infection23. Since microarray analysis suggested that type I IFN signaling and STAT pathways may be augmented in miR-155-KO CD8+ T cells, we examined the STAT1 signaling pathway. In vitro activated miR-155-KO CD8+ T cells showed increased total STAT1 expression (Fig. 7a, b). Day 10 miR-155-KO OT-I cells from WSN-OVA infected animals had increased total STAT1 expression compared to OT-I cells in vivo(Fig. 7c). In vitro-activated miR-155-KO CD8+ T cells exhibited increased STAT1 Tyr701 phosphorylation (pSTAT1) after IFNβ treatment (Fig. 7d) compared to control CD8+ T cells. Activated miR-155-KO CD8+ T cells showed a low constitutive increase in pSTAT1 relative to OT-I controls even in the absence of IFN-β stimulation (Fig. 7d). As miR-155-KO CD8+ T cell did not produce IFNα/β (assayed by RT-PCR, data not shown), this constitutive STAT1 activation appears to be independent of IFNαβ receptor engagement.
Figure 7.
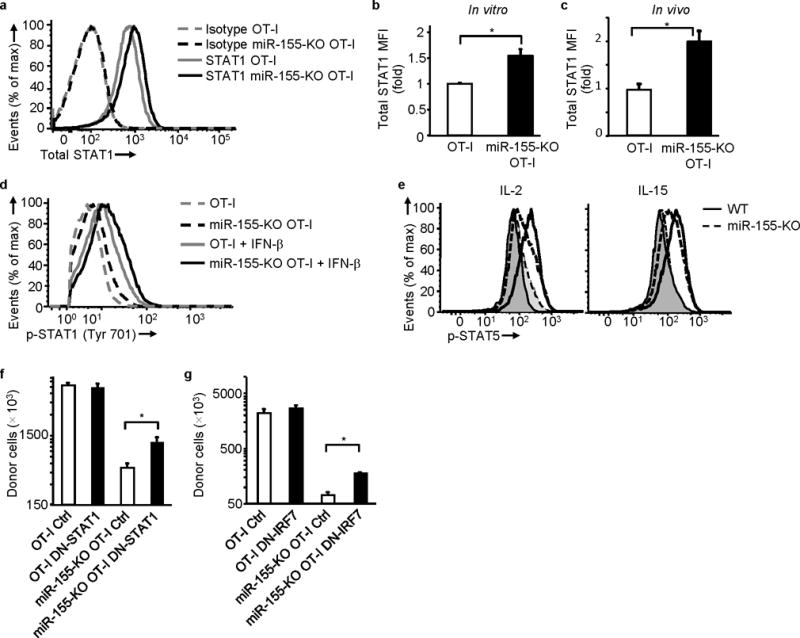
miR-155 regulates STAT1 expression and Type I IFN signaling contributes to the proliferative defect of miR-155 deficiency. (a) and (b) Increased total STAT1 in miR-155-KO OT-I cells. (a) Representative histogram showing STAT1 expression and (b) fold increase of STAT1 MFI in vitro in miR-155-KO OT-I cells over OT-I cells. Cells activated with OVA(257–264)-pulsed irradiated splenocytes for 4 days (data from 5 experiments). * P<0.03 (Student’s t-test). (c) Increased in vivo total STAT1 in donor miR-155-KO OT-I cells from WSN-OVA infected animals. Day 10 ex vivo fold increase of STAT1 MFI in miR-155-KO OT-I cells over OT-I cells. Data from 2 experiments (n = 5 per group); * P<0.006 (Student’s t-test). (d) Increased constitutive and IFN-β induced STAT1 phosphorylation in activated miR-155-KO OT-I cells. Cells were activated as in (a) and then STAT1 phosphorylation was examined in untreated or IFNβ-treated cells. Representative histogram of 4 experiments shown. (e) Reduced IL-2 (left) and IL-15 (right) induced STAT5 phosphorylation in activated miR-155-KO CD8+ T cells. Dashed lines depict miR-155-KO and full lines wild-type animals. Cytokine-stimulated (unfilled histograms) and unstimulated (filled histograms) cells shown. Representative histograms of 3 experiments shown. (f) Increased in vivo expansion of donor DN-STAT1 expressing miR-155-KO OT-I cells on day 10 of WSN-OVA infection compared to control vector (Ctrl) transduced cells. Data from 2 experiments (n = 8-10). * P<0.02 (Student’s t-test). (g) DN-IRF7 expressing miR-155-KO OT-I cells expand significantly more in vivo compared to control vector (Ctrl) transduced cells. Day 10 of WSN-OVA infection shown. Data from 3 experiments (n = 7-9). * P<0.03 (Student’s t-test).
Since STAT5 signaling defects are implicated in the phenotype of miR-155-KO Treg cells18 and type I IFNs can inhibit STAT5 signaling in T lymphocytes35 we also examined STAT5 signaling in miR-155-KO CD8+ T cells. MiR-155-KO CD8+ T cells activated for 48h exhibited reduced IL-2-induced STAT5 phosphorylation (Fig. 7e). Since at this 48h time point, IL-2Rα expression was reduced in miR-155-KO CD8+ T cells, we also treated these cells with IL-15. CD122 (IL-2Rβ) and CD132 (γc chain) expression were not affected (data not shown) and therefore IL-15 induced pSTAT5 would not be confounded by reduced receptor expression. IL-15 induced STAT5 phosphorylation was reduced in miR-155-deficient CD8+ T cells albeit to a lesser extent than IL-2 (Fig. 7e). Taken together, the above suggest that aberrant type I IFN signaling, increased activation of the STAT1 pathway and impaired γc chain signaling may contribute to miR-155-KO CD8+ T cells defects.
To directly examine the role of IFN signaling in the proliferative defect of miR-155-KO CD8+ T cells we performed adoptive transfers of miR-155-KO OT-I cells transduced with dominant negative STAT1 (DN-STAT1) or dominant negative IRF7 (DN-IRF7) expressing retroviruses. Transduction of miR-155-KO OT-I with either DN-STAT1 or DN-IRF7 significantly increased in vivo cell numbers compared to control transduced miR-155-KO OT-I cells (Fig. 7f and g). DN-STAT1 and DN-IRF7 retroviral transduction did not affect OT-I cells. Although DN-STAT1 and DN-IRF7 did not fully restore the response of miR-155-KO OT-I cells, indicating that other signaling pathways may be contributing to the phenotype, these data demonstrate that the IFN signaling pathway contributes to the defect of miR-155-KO CD8+ T cells.
Discussion
In the present study we demonstrate an essential role for miR-155 in generating optimal primary CD8+ T cell responses and establishing memory against viral and bacterial infections. Importantly, absence of miR-155 resulted in an intrinsic defect of CD8+ T cells, affecting their proliferation. Overexpression of miR-155 enhanced in vivo primary CD8+ T cell responses. Our studies reveal an important role for miR-155 in CD8+ T cell immunity.
Previous studies have reported the sustained upregulation of miR-155 in in vitro-activated human T cells36. In agreement, we detected a large and sustained increase of miR-155 expression after in vitro activation of primary murine CD8+ T cells. Inflammatory cytokines and type I IFN did not induce miR-155 expression in resting CD8+ T cells and only modestly increased miR-155 in activated cells. Our studies suggest that TCR or CD28 costimulation may be the major inducers of miR-155 in CD8+ T cells. Furthermore, we found that in vivo miR-155 is increased in effector CD8+ T cells and to a lesser extent effector memory CD8+ T cells. In contrast, miR-155 expression in central memory CD8+ T cells did not differ from naive cells. Since miR-155 overexpression enhances CD8+ T cell expansion, upregulation of miR-155 in primary CD8+ T cells may promote the rapid expansion of effector CD8+ T cells. Thus the levels of miR-155 may regulate CD8+ T cell responsiveness at different stages of differentiation.
MiR-155-deficiency in vivo resulted in a significant reduction in the post-infection size of the memory CD8+ T cell pool. Both SLEC and MPEC populations were reduced during the primary response with miR-155 deficiency. MiR-155 therefore appears to be required for memory precursor cell generation during the primary response, and this results in a greatly reduced pool of memory cells later on. These studies, however, do not address the role of miR-155 during memory differentiation or maintenance. The levels of miR-155 in central memory CD8+ T cells were similar to those of quiescent naive cells, but effector memory cells had increased miR-155 expression. This may indicate that miR-155 plays a role in established memory cells and may contribute to the functional differences between central and effector memory CD8+ T cells. Overall, our study provides evidence that miR-155 plays an important role during memory precursor CD8+ T cell generation but its role in memory differentiation or maintenance remains to be established.
TCR signaling and cytokine production were not affected by miR-155 deficiency and the global reduction of miR-155-KO CD8+ T cells in all tissues argued against trafficking defects. MiR-155-KO CD8+ T cells showed a proliferative defect and were sensitive to type I IFN mediated inhibition. Mir-155 deficiency, on the other hand, did not confer any apoptosis sensitivity. Our findings suggest that miR-155 upregulation during activation supports optimal CD8+ T cell proliferation. Other microRNA may affect responses by perturbing migration and survival as the Dicer-deficient CD8+ T cells suggest9.
An unresolved paradox for the role of type I IFN signaling in CD8+ T cell responses has been its contrasting role as an absolutely critical costimulatory signal 321, 22 and its well-known anti-proliferative effect24, 25. Activated T cells exhibit reduced induction of type I IFN-stimulated genes compared to naive T cells37 but the mechanism behind this switch in IFN sensitivity is poorly understood. Type I IFNs exert anti-proliferative effects on bystander T cells24, 25 and virus-specific CD8+ T cells can, in part, escape this effect by downregulating STAT123. Type I IFN signaling can also inhibit IL-2 and STAT5 signaling in T lymphocytes35, 38. STAT1 plays an inhibitory role in T cell proliferation because Stat1-/- T cells proliferate faster, especially in the presence of type I IFNs, as a consequence of increased STAT3 and STAT5 activation39, 40. Our studies suggest that miR-155 may regulate changes in responsiveness to type I IFN by affecting the STAT1 signaling pathway. Activated miR-155-KO CD8+ T cells were significantly enriched for genes associated with type I IFN signaling, exhibited increased constitutive and IFNα/β -induced STAT1 phosphorylation, showed impaired STAT5 phosphorylation and were more susceptible to the anti-proliferative effect of IFN-β. Importantly, STAT1 and IFN signaling was directly involved in the reduced expansion of miR-155-KO CD8+ T cells in vivo as inhibiting these signaling pathways with DN-STAT1 and DN-IRF7 significantly increased miR-155-KO CD8+ T cell responses in animals. Therefore, a hyperactive IFN signaling pathway and increased STAT1 activation in miR-155-deficient CD8+ T cells contributes to their reduced proliferation. Because miR-155-KO CD8+ T cells make no IFNα/β (data not shown) but show constitutive pSTAT1, it is possible that activation of the type I IFN pathway independent of cytokine/receptor interaction leads to inhibition of proliferation of miR-155-KO CD8+ T cells. We note however, that inhibiting IFN signaling did not fully restore the response indicating that additional pathways may be affected by miR-155 deficiency.
Microarray analysis of miR-155-KO CD8+ T cells identified a number of miR-155 targets that were found to be modestly upregulated in terms of mRNA expression. Inhibiting or deleting single miR-155 target genes that were increased with miR-155 deficiency and could participate in Type I IFN signaling, such as IKKε and Bach1, did not revert the phenotype. A caveat of the Bach 1 inhibition was that the knockdown with shRNA was partial and future studies using double knockout mice will fully exclude this. We interpret this to indicate that the biological phenotype of miR-155-KO CD8+ T cells is not due to a single miR-155 target that is highly upregulated but rather the coordinated and modest increase of a battery of genes that promotes the activation of the type I IFN pathway and its antiproliferative effect. This is consistent with independent evidence that microRNAs target multiple elements of pathways that, in aggregate, affect cellular responses27, 41, 42. If miR-155 functions as the gatekeeper of the outcome of IFN signaling in CD8+ T cells, a broad universal tempering is better than a focal and acute negative regulation. Broad tempering would adjust signaling threshold levels rather than the “off switch” effect of strongly targeting a single gene. High levels of IFN might still be able to overcome the miR155 effect which would be important in some settings such as chronic infections.
Overexpression of miR-155 led to increased expansion of primary CD8+ T cells during influenza virus infection, generating effectors that made more IFNγ thus boosting CD8+ T cell immunity and enhancing viral clearance. The effect of miR-155 overexpression on memory, however, remains to be established. The above preliminary studies indicate that enhancing miR-155 levels in CD8+ T cells may prove useful for adoptive therapy studies and vaccines.
Two other studies have also analyzed miR-155 deficiency on CD8+ T cell responses19, 20. Interestingly, there are some differences between some of our findings and these reports. One study showed a modest 2-fold difference in antigen-specific CD8+ T cell numbers 3 days post Listeria monocytogenes(L.m) infection20. In our study we observed no difference in early numbers after adoptive transfer in 2 models tested (day 3 for L.m and day 4 for influenza virus). Reasons for this discrepancy could include the use of a different genetically modified L. monocytogenes which may vary in attenuation or cytokine induction, differences in the TCR transgenic T cells used and the transfer of fewer number of TCR transgenic cells in our study. This report concluded that proliferation is not affected at day 3 of the response, however, it is unclear whether survival, altered distribution or differences in recruitment in initial activation (a concern with high numbers of TCR transgenic T cells) account for the reduced numbers. We observed no effect of miR-155 deficiency on CD8+ T cells numbers at early time points. This is not surprising as miR-155 is low in naive cells and following activation is upregulated. This would suggest that a number of days might be required for the effect of miR-155 deficiency to be observed depending on the decay of its targets. Our gene arrays and mechanistic studies suggest inflammatory cytokine signaling may be affected in miR-155KO CD8 T cells. This alters the ability of these cells to sustain proliferative responses, which may be dependent on integrating TCR and inflammatory signals.
The other study concludes that miR-155-deficient CD8+ T cells preferentially differentiate into central memory T cells that are capable of mounting secondary responses19. We observed no difference in central memory cells with miR-155 deficiency. This report, however, shows very low numbers of central memory cells in the wild-type controls, which are not typical of a cleared infection43 and the study is complicated by the use of the MHV-68 infection model where latent infection persists44 as well as the use of mixed bone-marrow chimeric mice, where the presence of other miR-155-deficient populations such as macrophages, B cells and NK cells may also affect pathogen clearance and the inflammatory response. In our study we used a non-persisting viral infection and adoptive transfers into wild-type hosts to implicate the effect of deficiency exclusively to the CD8+ T cells. Although we found that miR-155 deficiency reduced memory CD8+ T cells, this affected both effector memory and central memory cells.
Our study has revealed that miR-155 deficiency profoundly impairs in vivo CD8+ T cell responses against viral and bacterial infections. MiR-155 deficiency results in increased type I IFN signaling and reduced CD8+ T cell proliferation. MiR-155 levels may also function as a key modulator of CD8+ T cell responses in the presence of type I IFNs, determining whether type I IFNs behave as costimulatory signal 3 or as inhibitors. Overexpression of miR-155 augmented CD8+ T cell responses, something potentially important for enhancing CD8+ T cell immunity to pathogens and tumors. Our findings have revealed a novel critical role of miR-155 in the regulation of CD8+ T cell responses.
On-line methods
Animals and infections
C57Bl/6J, B6.PL-Thy1a/CyJ (Thy-1.1+), C57BL/6-Tg(TcraTcrb)1100Mjb/J (OT-I mice), B6.SJL-Ptprca Pepcb/BoyJ (CD45.1+), Ikbke-/- (all purchased from The Jackson Laboratory), Ikbke-/-OT-I, miR-155-KO mice (on C57Bl/6 background) and miR-155-KO OT-I mice were kept in an AAALAC certified barrier facility at Drexel University College of Medicine. All animal work was IACUC approved. Mice (8-10 week-old) were anesthetized with 2-2-2-tribromoethanol (250 mg/Kg i.p., Acros), and infected intranasally (i.n.) with A/Puerto Rico/8/34 (PR8) viral strain (generous gift of Dr. W. Gerhard, Wistar Institute, Philadelphia, PA) or WSN-OVA strain, an OVA(257–264)-expressing influenza A/WSN/33 virus strain (kind gift from Dr. David Topham, University of Rochester). Viral loads were measured as previously described45. Some mice were intravenously infected with 104 cfu OVA-expressing Listeria monocytogenes ( L.m.-OVA) (kind gift from Dr. Hao Shen, University of Pennsylvania).
Flow cytometry
Cells were stained as previously described46 using monoclonal antibodies against CD69 (clone H1.2F3), Thy-1.1 (clone HIS51), Thy-1.2 (clone 53-2.1), CD4 (clone L3T4), CD45.1 (clone A20), CD45.2 (clone 104), CD62L (clone MEL-14), CD44 (clone 1M7), IFN-γ (clone XMG1.2) and TNF-α (clone MP6-XT22) (all from eBioscience, San Diego, CA), CD8α (clone 53–6.7, BD Biosciences, San Jose, CA), CD25 (clone PC61, BD Biosciences), Annexin V (BD Biosciences), and H-2b MHC class I tetramers loaded with immunodominant influenza virus nuclear protein (NP) epitope NP(366–374) or OVA(257–264) peptide. Anti-CD16/32 (Fc Block, clone 2.4G2) (BD Biosciences) was used in all stains. For Annexin V stains, all buffers contained 2.5 mM CaCl2. For intracellular cytokine staining, GolgiPlug (BD Biosciences), Cytofix/Cytoperm buffer (eBioscience) and Perm/Wash buffer (eBioscience) were used according to the manufacturer′s instructions. Antibodies for total STAT1 (clone 1/STAT1), phospho-STAT1 (pY701, clone 4a), phospho-STAT5 (pY694) (all directly conjugated and from BD Biosciences), anti-IKKε (clone 72B587, Imgenex, San Diego, CA) and secondary donkey anti-mouse IgG-PE (eBioscience) were used for intracellular flow cytometry. Samples were analyzed using a FACSAria flow cytometer (BD Biosciences). For calcium flux, the Fluo-4 NW Calcium Assay Kit (Invitrogen, Carlsbad, CA) was used. Purified CD8+ T cells were incubated with biotinylated anti-CD3 antibody (eBiosciences), loaded with the Fluo-4 NW dye mix for 30min, streptavidin was added and cells were immediately analyzed on a FACSCalibur (BD Biosciences). All data were analyzed using FlowJo software (Treestar).
CD8+ T cell isolations
For all in vitro assays, splenic naive CD8+ T cells were isolated by negative selection using magnetic beads (EasySep, Stemcell Technologies, Vancouver, Canada). The purity of CD8+ T cells was >92%, as determined by FACS analysis. For in vitro miR-155 measurements, highly purified (>97%) naive CD44-CD62L+ and activated CD8+ T cells were obtained by FACS sorting using a FACSAria. For in vivo miR-155 expression studies, donor CD8+ T cell populations were isolated by staining for CD44/CD62L/CD8/Thy-1.1/Thy-1.2 and sorting them using a FACSAria sorter.
Adoptive transfer experiments
Equal numbers (5x10⁵ or 104) of Thy-1.1+ or CD45.2+ OT-I or miR-155-KO OT-I cells were transferred intravenously into Thy-1.2+ or CD45.1+ wild-type recipient mice. One day later, the recipient mice were infected with WSN-OVA or L.monocytogenes.-OVA.
BMDC culture and Cytokine detection
Bone marrow-derived DCs (BMDCs) were generated from bone marrow after depleting lymphocytes using magnetic beads (Dynabeads) and culturing with 10 ng/ml IL-4 (Peprotech, Rocky Hill, NJ) and 10 ng/ml GM-CSF (Peprotech) for 6 days. Peptide-loaded BMDC were cultured with purified CD8+ T cells, and cytokines in supernatants were quantified by Mouse TH1/TH2 Cytometric Bead Array (BD Biosciences).
In vitro OT-I CD8+ T cell cultures, STAT signaling and proliferation assays
For CFSE proliferation, C57BL/6 splenocytes at 107 cells/ml were loaded with 10μM OVA(257–264) peptide for 2 hours at 37°C, irradiated with 1500 rads, and then washed twice. Purified CD8+ T cells were labeled with 5mM CFSE (Invitrogen) and co-cultured with OVA(257–264)-pulsed splenocytes and 10 U/ml of IL-2 (Roche, Nutley, NJ) for 4 days. The % reduction of miR-155 deficient cells in division X was calculated based on the formula [(wild type cell numbers in division X)-(miR-155 deficient cell numbers in division X)/wild type cell numbers in division X)] x 100. For 3H-Thymidine incorporation assay, purified CD8+ T cells were stimulated with solid phase anti-CD3 antibody (0.2 μg/ml) and IL-2 for 5 days, pulsed with 1μCi 3H-Thymidine for 8h and Thymidine incorporation was measured with a TopCount counter (Packard). For STAT1 and IKKε levels and signaling studies, CD8+ T cells were cultured with OVA(257–264) peptide-pulsed irradiated splenocytes and IL-2 for 4 days and STAT1 and IKKε levels were measured by intracellular flow cytometry. For STAT1 signaling, after the 4 day culture, cells were stimulated for 40 min with 5000 U/ml IFNβ and then immediately stained for STAT1 (pY701) phosphorylation. For STAT5 studies, purified CD8+ T cells were stimulated with anti-CD3 antibody for 48h, exposed to IL-2/IL-15 for 15min and STAT5 phosphorylation measured by flow cytometry.
In vitro BrdU incorporation assays
CD8+ T cells were isolated and co-cultured with OVA(257–264) -pulsed irradiated splenocytes in 24-well plates in 10% FCS RPMI. On day 3 cells 30U/ml of rIL-2 were added. Cells were treated with 1-1000 U/ml rIFNβ1 (Millipore, Billerica, MA) for the duration of the culture. Cells were harvested on days 3 or 5. BrdU (10μM) was added during the last 8h, cells were stained with FITC-conjugated anti-BrdU antibody (clone BU20a, eBioscience) and BrdU labeling was determined by flow cytometry. In some experiments, rIFNβ1 was added after day 3 of culture and cells were harvested on day 6. In these day 6 cultures, 2ng/ml of murine rIL-7 and rIL-15 (Peprotech) and 5 U/ml of rIL-2 were also added on day 3.
Quantitative real-time PCR
For in vitro miR-155 measurements, sorted CD8+ T cells were stimulated 1-5 days with anti-CD3 (0.5 μg/ml) and anti-CD28 (10 μg/ml) antibodies. For in vivo studies, sorted CD8+ T cells were used. Total RNA including micro-RNA was extracted using the miRNeasy mini kit (Qiagen, Germany). cDNA was synthesized from 100ng RNA using the High capacity cDNA Reverse Transcription Assay (Applied Biosystems, Carlsbad, CA). miR-155 expression was measured by quantitative real-time PCR using the TaqMan mmu-miR-155 MicroRNA Assay (Applied Biosystems) and a 7900 HT Real-Time PCR System. 18S rRNA expression served as endogenous control. For Ikbke, Bach1, and Socs1 measurements, purified CD8+ T cells were co-cultured with OVA(257–264) peptide-pulsed irradiated splenocytes plus IL-2 for 4 days, and then CD8+ T cells were FACS sorted and RNA was isolated. For Ikbke, Bach1 (SABiosciences) and Socs1 (Applied Biosystems) primers were used to detect expression of these genes by RT-PCR. Expression of Ikbke and Bach1 were normalized to GAPDH expression while Socs1 was normalized using 18S rRNA. Relative expression was evaluated using the comparative threshold cycle (ΔΔCt) method.
siRNA and retroviral transduction experiments
For SOCS1 siRNA knockdown, purified CD8+ T cells were cultured in delivery media (Accell SMARTpool, Dharmacon, Lafayette, CO) supplemented with 3% FBS, 5ng/ml of rIL-7 and rIL-15, and 1 μM control non-targeting siRNA or SOCS1-targeting siRNA (Accell SMARTpool, Dharmacon) for 3 days. Subsequently, cells were washed and 3x10⁴ cells were adoptively transferred into congeneic recipients. The inhibition of SOCS1 expression was confirmed by RT-PCR.
For retroviral transductions, oligonucleotide sequences encoding shRNA against Socs147 and Bach148 were synthesized and inserted into the RNAi-Ready pSiren RetroQ-ZsGreen Vector (Clontech, Mountain View, CA) as per manufacturer’s instructions. Negative control shRNA vector was provided by manufacturer (Clontech). Retroviruses were produced in Platinum-E cell line (Cell Biolabs, San Diego, CA). MIGR1-vector-gfp control and MIGR1-miR-155-gfp vectors were provided by Dr. E. Vigorito (Babraham Institute). The STAT1YF-IRES-GFP-pMX (DN-STAT1) and control retroviruses49 were provided by Dr. G. Takaesu (Keio University, Tokyo, Japan). The DN-IRF7 plasmid50 was provided Dr. B. tenOever (Mount Sinai School of Medicine, New York) and the DN-IRF7 sequence was cloned into the MSCV-IRES-Thy-1.1 vector (kindly provided Dr. P. Marack, University of Colorado Health Sciences Center, Denver). Isolated CD8+ T cells were co-cultured with OVA(257–264)-pulsed irradiated splenocytes in 10% RPMI with 5ng/ml of murine rIL-7 and rIL-15 for 48 hours, cells were harvested, plated at a density of 2 x 10⁶ cells/2ml in 6 well plates in media containing 2% FCS RPMI with 8μg/ml Polybrene and 2MOI of retrovirus. Cells were centrifuged at 2000xg for 90 min at 32°C, then incubated for another 4 hours at 37°C, and washed. Transduced cells were resuspended in 10% FCS RPMI media containing 5ng/ml rIL-7 and rIL-15 for another 48 hours. Transduction efficiency was determined by GFP or Thy-1.1 expression. Cells were FACS sorted and equal number of cells (102 cells for MIGR1-miR-155, 104 cells for DN-STAT1 and DN-IRF7, or 4x10⁴ cells for shSOCS1 and shBACH1) were adoptively transferred into congenic recipients. SOCS1 and BACH1 inhibition by shRNA retrovirus was validated by RT-PCR and was between 40-50%.
Microarray
Purified CD8+ T cells were stimulated in vitro for 48 hours with solid phase anti-CD3 and anti-CD28 antibodies and total RNA was isolated from sorted CD8 T cells using TRIzol (Invitrogen). RNA was processed, amplified, labeled, and hybridized to Affymetrix GeneChip MoGene 1.0 ST microarrays (Santa Clara, CA) by the University of Pennsylvania Microarray facility. Affymetrix Power Tools software (Santa Clara, CA) was used to process and quantile normalize fluorescent hybridization signals using the Robust Multichip Averaging method51. Transcripts were then log2 normalized. Differentially expressed genes were identified using the Significance Analysis of Microarrays algorithm52 and network analysis was performed through the use of IPA (Ingenuity Systems, www.ingenuity.com). Hierarchical Clustering was performed with Gene Pattern53 and Gene Set Enrichment Analysis was performed with GSEA software54. The gene expression data were uploaded to Gene Expression Omnibus (GEO) with accession number GSE44649.
Immunoblotting
CD8+ T cells (106) were lysed with lysis buffer, run on a 4-20% Tris-glycine gel (Life technologies), transferred onto a PVDF membrane (Invitrogen), blocked with 5% BSA and incubated with antibodies to either SHIP1 (Santa Cruz Biotechnology, Santa Cruz, CA), SMAD2 (Cell Signaling Technology, Danvers, MA) or β-actin (Cell Signaling Technology).
Statistical analysis
Student T tests, Mann-Whitney U test, ANOVA and Shapiro-Wilk W test for normality were used with the JMP statistical analysis program (SAS). P < 0.05 was considered significant.
Supplementary Material
Acknowledgments
The work presented here was supported by NIH grants R01 AI66215 and R01 AI46719 and funds by the Department of Microbiology and Immunology to P.D.K. and funding from the Biotechnology and Biological Sciences Research Council and Medical Research Council (M.T.) We thank the Penn Molecular Profiling facility at the University of Pennsylvania for microarray assays. Some of this work was presented at the 2009 AAI Annual Meeting.
Footnotes
Author contributions: D.T.G. performed influenza infections, adoptive transfers, in vitro proliferation, immunoblots, siRNA transfections, retroviral transductions and RT-PCR. E.S. performed Listeria infections, adoptive transfers, in vitro proliferation, siRNA transfections and RT-PCR. J.L.H., A.C.B., J.A.F. and J.N. performed influenza infections, flow cytometry, BrdU assays, RT-PCR and bred mice. T.D., E.S. and E.J.W. performed microarray data analysis. Y.M.M. performed adoptive transfers and data analysis. E.S., D.T.G., A.C.B., E.J.W, M.T. and P.D.K. designed the study, analyzed data and wrote the manuscript. All authors discussed the results and commented on the manuscript.
Competing Interest Statement: The authors declare that they have no competing financial interests.
References
- 1.Lodish HF, Zhou B, Liu G, Chen CZ. Micromanagement of the immune system by microRNAs. Nat Rev Immunol. 2008;8:120–130. doi: 10.1038/nri2252. [DOI] [PubMed] [Google Scholar]
- 2.Lewis BP, Burge CB, Bartel DP. Conserved seed pairing, often flanked by adenosines, indicates that thousands of human genes are microRNA targets. Cell. 2005;120:15–20. doi: 10.1016/j.cell.2004.12.035. [DOI] [PubMed] [Google Scholar]
- 3.Miranda KC, et al. A pattern-based method for the identification of MicroRNA binding sites and their corresponding heteroduplexes. Cell. 2006;126:1203–1217. doi: 10.1016/j.cell.2006.07.031. [DOI] [PubMed] [Google Scholar]
- 4.Friedman RC, Farh KK, Burge CB, Bartel DP. Most mammalian mRNAs are conserved targets of microRNAs. Genome Res. 2009;19:92–105. doi: 10.1101/gr.082701.108. [DOI] [PMC free article] [PubMed] [Google Scholar]
- 5.Lee Y, Jeon K, Lee JT, Kim S, Kim VN. MicroRNA maturation: stepwise processing and subcellular localization. EMBO J. 2002;21:4663–4670. doi: 10.1093/emboj/cdf476. [DOI] [PMC free article] [PubMed] [Google Scholar]
- 6.Liu J, et al. Argonaute2 is the catalytic engine of mammalian RNAi. Science. 2004;305:1437–1441. doi: 10.1126/science.1102513. [DOI] [PubMed] [Google Scholar]
- 7.Lund E, Guttinger S, Calado A, Dahlberg JE, Kutay U. Nuclear export of microRNA precursors. Science. 2004;303:95–98. doi: 10.1126/science.1090599. [DOI] [PubMed] [Google Scholar]
- 8.Muljo SA, et al. Aberrant T cell differentiation in the absence of Dicer. J Exp Med. 2005;202:261–269. doi: 10.1084/jem.20050678. [DOI] [PMC free article] [PubMed] [Google Scholar]
- 9.Zhang N, Bevan MJ. Dicer controls CD8+ T-cell activation, migration, and survival. Proc Natl Acad Sci USA. 2010;107:21629–21634. doi: 10.1073/pnas.1016299107. [DOI] [PMC free article] [PubMed] [Google Scholar]
- 10.Clurman BE, Hayward WS. Multiple proto-oncogene activations in avian leukosis virus-induced lymphomas: evidence for stage-specific events. Mol Cell Biol. 1989;9:2657–2664. doi: 10.1128/mcb.9.6.2657. [DOI] [PMC free article] [PubMed] [Google Scholar]
- 11.Rodriguez A, et al. Requirement of bic/microRNA-155 for normal immune function. Science. 2007;316:608–611. doi: 10.1126/science.1139253. [DOI] [PMC free article] [PubMed] [Google Scholar]
- 12.Vigorito E, et al. microRNA-155 regulates the generation of immunoglobulin class-switched plasma cells. Immunity. 2007;27:847–859. doi: 10.1016/j.immuni.2007.10.009. [DOI] [PMC free article] [PubMed] [Google Scholar]
- 13.Thai TH, et al. Regulation of the germinal center response by microRNA-155. Science. 2007;316:604–608. doi: 10.1126/science.1141229. [DOI] [PubMed] [Google Scholar]
- 14.Costinean S, et al. Pre-B cell proliferation and lymphoblastic leukemia/high-grade lymphoma in E(mu)-miR155 transgenic mice. Proc Natl Acad Sci U S A. 2006;103:7024–7029. doi: 10.1073/pnas.0602266103. [DOI] [PMC free article] [PubMed] [Google Scholar]
- 15.Tili E, et al. Modulation of miR-155 and miR-125b levels following lipopolysaccharide/TNF-alpha stimulation and their possible roles in regulating the response to endotoxin shock. J Immunol. 2007;179:5082–5089. doi: 10.4049/jimmunol.179.8.5082. [DOI] [PubMed] [Google Scholar]
- 16.O'Connell RM, et al. MicroRNA-155 promotes autoimmune inflammation by enhancing inflammatory T cell development. Immunity. 2010;33:607–619. doi: 10.1016/j.immuni.2010.09.009. [DOI] [PMC free article] [PubMed] [Google Scholar]
- 17.Kohlhaas S, et al. Cutting edge: The Foxp3 target miR-155 contributes to the development of regulatory T cells. J Immunol. 2009;182:2578–2582. doi: 10.4049/jimmunol.0803162. [DOI] [PubMed] [Google Scholar]
- 18.Lu LF, et al. Foxp3-dependent microRNA155 confers competitive fitness to regulatory T cells by targeting SOCS1 protein. Immunity. 2009;30:80–91. doi: 10.1016/j.immuni.2008.11.010. [DOI] [PMC free article] [PubMed] [Google Scholar]
- 19.Tsai CY, Allie SR, Zhang W, Usherwood EJ. MicroRNA miR-155 Affects Antiviral Effector and Effector Memory CD8 T Cell Differentiation. J Virol. 2013;87:2348–2351. doi: 10.1128/JVI.01742-12. [DOI] [PMC free article] [PubMed] [Google Scholar]
- 20.Lind EF, Elford AR, Ohashi PS. Micro-RNA 155 Is Required for Optimal CD8+ T Cell Responses to Acute Viral and Intracellular Bacterial Challenges. J Immunol. 2013;190:1210–1216. doi: 10.4049/jimmunol.1202700. [DOI] [PubMed] [Google Scholar]
- 21.Kolumam GA, Thomas S, Thompson LJ, Sprent J, Murali-Krishna K. Type I interferons act directly on CD8 T cells to allow clonal expansion and memory formation in response to viral infection. J Exp Med. 2005;202:637–650. doi: 10.1084/jem.20050821. [DOI] [PMC free article] [PubMed] [Google Scholar]
- 22.Curtsinger JM, Valenzuela JO, Agarwal P, Lins D, Mescher MF. Type I IFNs provide a third signal to CD8 T cells to stimulate clonal expansion and differentiation. J Immunol. 2005;174:4465–4469. doi: 10.4049/jimmunol.174.8.4465. [DOI] [PubMed] [Google Scholar]
- 23.Gil MP, Salomon R, Louten J, Biron CA. Modulation of STAT1 protein levels: a mechanism shaping CD8 T-cell responses in vivo. Blood. 2006;107:987–993. doi: 10.1182/blood-2005-07-2834. [DOI] [PMC free article] [PubMed] [Google Scholar]
- 24.Marshall HD, Urban SL, Welsh RM. Virus-induced transient immune suppression and the inhibition of T cell proliferation by type I interferon. J Virol. 2011;85:5929–5939. doi: 10.1128/JVI.02516-10. [DOI] [PMC free article] [PubMed] [Google Scholar]
- 25.McNally JM, et al. Attrition of bystander CD8 T cells during virus-induced T-cell and interferon responses. J Virol. 2001;75:5965–5976. doi: 10.1128/JVI.75.13.5965-5976.2001. [DOI] [PMC free article] [PubMed] [Google Scholar]
- 26.Ebert PJ, Jiang S, Xie J, Li QJ, Davis MM. An endogenous positively selecting peptide enhances mature T cell responses and becomes an autoantigen in the absence of microRNA miR-181a. Nat Immunol. 2009;10:1162–1169. doi: 10.1038/ni.1797. [DOI] [PMC free article] [PubMed] [Google Scholar]
- 27.Li QJ, et al. miR-181a is an intrinsic modulator of T cell sensitivity and selection. Cell. 2007;129:147–161. doi: 10.1016/j.cell.2007.03.008. [DOI] [PubMed] [Google Scholar]
- 28.Trotta R, et al. miR-155 regulates IFN-gamma production in natural killer cells. Blood. 2012;119:3478–3485. doi: 10.1182/blood-2011-12-398099. [DOI] [PMC free article] [PubMed] [Google Scholar]
- 29.Agarwal P, et al. Gene regulation and chromatin remodeling by IL-12 and type I IFN in programming for CD8 T cell effector function and memory. J Immunol. 2009;183:1695–1704. doi: 10.4049/jimmunol.0900592. [DOI] [PMC free article] [PubMed] [Google Scholar]
- 30.Sana TR, Janatpour MJ, Sathe M, McEvoy LM, McClanahan TK. Microarray analysis of primary endothelial cells challenged with different inflammatory and immune cytokines. Cytokine. 2005;29:256–269. doi: 10.1016/j.cyto.2004.11.003. [DOI] [PubMed] [Google Scholar]
- 31.Tsuchihashi S, Zhai Y, Fondevila C, Busuttil RW, Kupiec-Weglinski JW. HO-1 upregulation suppresses type 1 IFN pathway in hepatic ischemia/reperfusion injury. Transplant Proc. 2005;37:1677–1678. doi: 10.1016/j.transproceed.2005.03.080. [DOI] [PubMed] [Google Scholar]
- 32.Kashiwada M, et al. Downstream of tyrosine kinases-1 and Src homology 2-containing inositol 5'-phosphatase are required for regulation of CD4+CD25+ T cell development. J Immunol. 2006;176:3958–3965. doi: 10.4049/jimmunol.176.7.3958. [DOI] [PubMed] [Google Scholar]
- 33.O'Connell RM, Chaudhuri AA, Rao DS, Baltimore D. Inositol phosphatase SHIP1 is a primary target of miR-155. Proc Natl Acad Sci U S A. 2009;106:7113–7118. doi: 10.1073/pnas.0902636106. [DOI] [PMC free article] [PubMed] [Google Scholar]
- 34.Cocolakis E, et al. Smad signaling antagonizes STAT5-mediated gene transcription and mammary epithelial cell differentiation. J Biol Chem. 2008;283:1293–1307. doi: 10.1074/jbc.M707492200. [DOI] [PubMed] [Google Scholar]
- 35.Erickson S, et al. Interferon-alpha inhibits Stat5 DNA-binding in IL-2 stimulated primary T-lymphocytes. Eur J Biochem. 2002;269:29–37. doi: 10.1046/j.0014-2956.2002.02626.x. [DOI] [PubMed] [Google Scholar]
- 36.Haasch D, et al. T cell activation induces a noncoding RNA transcript sensitive to inhibition by immunosuppressant drugs and encoded by the proto-oncogene, BIC. Cell Immunol. 2002;217:78–86. doi: 10.1016/s0008-8749(02)00506-3. [DOI] [PubMed] [Google Scholar]
- 37.Dondi E, Rogge L, Lutfalla G, Uze G, Pellegrini S. Down-modulation of responses to type I IFN upon T cell activation. J Immunol. 2003;170:749–756. doi: 10.4049/jimmunol.170.2.749. [DOI] [PubMed] [Google Scholar]
- 38.Erickson S, et al. Interferon-alpha inhibits proliferation in human T lymphocytes by abrogation of interleukin 2-induced changes in cell cycle-regulatory proteins. Cell Growth Differ. 1999;10:575–582. [PubMed] [Google Scholar]
- 39.Gimeno R, Lee CK, Schindler C, Levy DE. Stat1 and Stat2 but not Stat3 arbitrate contradictory growth signals elicited by alpha/beta interferon in T lymphocytes. Mol Cell Biol. 2005;25:5456–5465. doi: 10.1128/MCB.25.13.5456-5465.2005. [DOI] [PMC free article] [PubMed] [Google Scholar]
- 40.Tanabe Y, et al. Cutting edge: role of STAT1, STAT3, and STAT5 in IFN-alpha beta responses in T lymphocytes. J Immunol. 2005;174:609–613. doi: 10.4049/jimmunol.174.2.609. [DOI] [PubMed] [Google Scholar]
- 41.Linsley PS, et al. Transcripts targeted by the microRNA-16 family cooperatively regulate cell cycle progression. Mol Cell Biol. 2007;27:2240–2252. doi: 10.1128/MCB.02005-06. [DOI] [PMC free article] [PubMed] [Google Scholar]
- 42.Tsang J, Zhu J, van Oudenaarden A. MicroRNA-mediated feedback and feedforward loops are recurrent network motifs in mammals. Mol Cell. 2007;26:753–767. doi: 10.1016/j.molcel.2007.05.018. [DOI] [PMC free article] [PubMed] [Google Scholar]
- 43.Wherry EJ, et al. Lineage relationship and protective immunity of memory CD8 T cell subsets. Nat Immunol. 2003;4:225–234. doi: 10.1038/ni889. [DOI] [PubMed] [Google Scholar]
- 44.Usherwood EJ, et al. Immunological control of murine gammaherpesvirus infection is independent of perforin. J Gen Virol. 1997;78(Pt 8):2025–2030. doi: 10.1099/0022-1317-78-8-2025. [DOI] [PubMed] [Google Scholar]
- 45.Borowski AB, et al. Memory CD8+ T cells require CD28 costimulation. J Immunol. 2007;179:6494–6503. doi: 10.4049/jimmunol.179.10.6494. [DOI] [PubMed] [Google Scholar]
- 46.Dolfi DV, et al. Dendritic cells and CD28 costimulation are required to sustain virus-specific CD8+ T cell responses during the effector phase in vivo. J Immunol. 2011;186:4599–4608. doi: 10.4049/jimmunol.1001972. [DOI] [PubMed] [Google Scholar]
- 47.Shen L, Evel-Kabler K, Strube R, Chen SY. Silencing of SOCS1 enhances antigen presentation by dendritic cells and antigen-specific anti-tumor immunity. Nat Biotechnol. 2004;22:1546–1553. doi: 10.1038/nbt1035. [DOI] [PubMed] [Google Scholar]
- 48.Abate A, Zhao H, Wong RJ, Stevenson DK. The role of Bach1 in the induction of heme oxygenase by tin mesoporphyrin. Biochem Biophys Res Commun. 2007;354:757–763. doi: 10.1016/j.bbrc.2007.01.050. [DOI] [PMC free article] [PubMed] [Google Scholar]
- 49.Lu Y, et al. Loss of SOCS3 gene expression converts STAT3 function from anti-apoptotic to pro-apoptotic. J Biol Chem. 2006;281:36683–36690. doi: 10.1074/jbc.M607374200. [DOI] [PubMed] [Google Scholar]
- 50.Lin R, Mamane Y, Hiscott J. Multiple regulatory domains control IRF-7 activity in response to virus infection. J Biol Chem. 2000;275:34320–34327. doi: 10.1074/jbc.M002814200. [DOI] [PubMed] [Google Scholar]
- 51.Irizarry RA, et al. Summaries of Affymetrix GeneChip probe level data. Nucleic Acids Res. 2003;31:e15. doi: 10.1093/nar/gng015. [DOI] [PMC free article] [PubMed] [Google Scholar]
- 52.Tusher VG, Tibshirani R, Chu G. Significance analysis of microarrays applied to the ionizing radiation response. Proc Natl Acad Sci USA. 2001;98:5116–5121. doi: 10.1073/pnas.091062498. [DOI] [PMC free article] [PubMed] [Google Scholar]
- 53.Reich M, et al. GenePattern 2.0. Nat Genet. 2006;38:500–501. doi: 10.1038/ng0506-500. [DOI] [PubMed] [Google Scholar]
- 54.Subramanian A, et al. Gene set enrichment analysis: a knowledge-based approach for interpreting genome-wide expression profiles. Proc Natl Acad Sci USA. 2005;102:15545–15550. doi: 10.1073/pnas.0506580102. [DOI] [PMC free article] [PubMed] [Google Scholar]
Associated Data
This section collects any data citations, data availability statements, or supplementary materials included in this article.