

Abstract
Little is known about the effects of NaCl stress on perennial ryegrass (Lolium perenne L.) photosynthesis and carbohydrate flux. The objective of this study was to understand the carbohydrate metabolism and identify the gene expression affected by salinity stress. Seventy-four days old seedlings of two perennial ryegrass accessions (salt-sensitive ‘PI 538976’ and salt-tolerant ‘Overdrive’) were subjected to three levels of salinity stress for 5 days. Turf quality in all tissues (leaves, stems and roots) of both grass accessions negatively and significantly correlated with GFS (Glu+Fru+Suc) content, except for ‘Overdrive’ stems. Relative growth rate (RGR) in leaves negatively and significantly correlated with GFS content in ‘Overdrive’ (P<0.01) and ‘PI 538976’ (P<0.05) under salt stress. ‘Overdrive’ had higher CO2 assimilation and Fv/Fm than ‘PI 538976’. Intercellular CO2 concentration, however, was higher in ‘PI 538976’ treated with 400 mM NaCl relative to that with 200 mM NaCl. GFS content negatively and significantly correlated with RGR in ‘Overdrive’ and ‘PI 538976’ leaves and in ‘PI 538976’ stems and roots under salt stress. In leaves, carbohydrate allocation negatively and significantly correlated with RGR (r2 = 0.83, P<0.01) and turf quality (r2 = 0.88, P<0.01) in salt-tolerant ‘Overdrive’, however, the opposite trend for salt-sensitive ‘PI 538976’ (r2 = 0.71, P<0.05 for RGR; r2 = 0.62, P>0.05 for turf quality). A greater up-regulation in the expression of SPS, SS, SI, 6-SFT gene was observed in ‘Overdrive’ than ‘PI 538976’. A higher level of SPS and SS expression in leaves was found in ‘PI 538976’ relative to ‘Overdrive’. Accumulation of hexoses in roots, stems and leaves can induce a feedback repression to photosynthesis in salt-stressed perennial ryegrass and the salt tolerance may be changed with the carbohydrate allocation in leaves and stems.
Introduction
Salinity is a severe and increasing threat limiting plant growth and crop yields worldwide [1], [2]. There are approximately 6% of the world’s total land area and 50% irrigated lands being severely affected by salinity [3], [4].
Previous studies have shown that salt stress affects CO2 assimilation in many plants including cotton (Gossypium hirsutum L.) [5], [6], bean (Phaseolus vulgaris L.) [7], [8], bell pepper (Capsicum annuum L.) [9], celery (Apium graveolens L.) [10], spinach (Spinacia oleracea L.) [11], rice (Oryza sativa L.) [12], sea barleygrass (Hordeum marinum Huds.), cultivated barley (Hordeum vulgare L.) [13] and tomato (Solanum lycopersicum) [14]. Meloni et al. [6] observed a lower level of CO2 assimilation and stomatal conductance with increasing NaCl concentration in cotton (Gossypium hirsutum L.) and concluded that stomatal aperture limited leaf photosynthetic capacity in the NaCl-treated plants. Similar results have been obtained for cotton and bean (Phaseolus vulgaris L.) [5], spinach [11], rice [12], and sea barleygrass and cultivated barley [13]. Other studies, however, proved that non-stomatal factors play a key role in the response of leaf CO2 assimilation to salinity environment, such as ion toxicity [9], PSII activity and photophosphorylation activity [10], enzyme activity [15] and salt tolerant gene expression [14]. Photochemistry efficiency (Fv/Fm) as an important parameter has been widely used as an indicator of photoinhibition of photosynthesis in higher plants to environmental stresses [16], [17]. Therefore, the mechanisms by which salt stress leads to a decrease in CO2 assimilation are still not yet clearly understood.
Sugars are primary products of photosynthesis in higher plants [18]. Soluble sugars (i.e. sucrose, glucose and fructose) are highly sensitive to environmental stresses and the major forms of carbohydrates. Sugars not only provide energy and solutes for osmotic adjustment, but also modulate expression of multiple genes as regulatory messenger through the sugar sensing and signaling network in many metabolic processes [19]–[22]. Soluble sugar is a very dynamic cycling process of degradation and synthesis in carbohydrates metabolism [23], [24]. Biotic and abiotic stresses alter sugar concentration and metabolic flux [25], [26]. It is important to determine soluble sugar and sugar flux for understanding feed-forward and feed-back control of photosynthesis in plants response to salinity stress.
Plants can increase a regulatory level of sugar signal molecules by reprogramming the expression of endogenous genes [27]. Lower levels of transcripts of the genes sucrose phosphate synthase (SPS), sucrose synthase (SS) and cell wall sucrose invertase (SI) were maintained in the WT sugar beet (Beta vulgaris L.) compared with the transgenic lines at 300 mM NaCl [28]. It was reported that sucrose: sucrose 6-fructosyltransferase (6-SFT) involved a signal regulating in grass fructan biosynthesis [29]. It is important to elucidate the expression of candidate genes involved in the regulation pathways in carbohydrate metabolism for understanding molecular adaptations of plants to salinity stress.
Perennial ryegrass (Lolium perenne L.) is an important forage grass and cool-season turfgrass species and cultivated in United States, Europe, Japan, Australia and New Zealand because of its rapid establishment rate and good wear tolerance [30]. Although the effects of salinity stress on germination and growth [31], [32], chlorophyll content [28], transgenic effect [33] and the antioxidant system [34] of perennial ryegrass have been investigated, there is limited information on photosynthesis and carbohydrate allocation of perennial ryegrass in response to salt stress. The objective of this study were: (1) to investigate the difference in mechanisms by which salt stress lead to a decrease in CO2 assimilation and (2) the differential responses of carbohydrate allocation and gene expression in perennial ryegrass accessions contrasting in salt tolerance.
Materials and Methods
Plant Materials and Growth Conditions
The seeds of two perennial ryegrass accessions, salt sensitive ‘PI 538976’ and salt tolerant ‘Overdrive’ were used for this study. The seeds were planted in plastic cups (10 cm in diameter and 15 cm deep) filled with sand and covered with a 0.5-cm layer of sand. The bottom of each cup was drilled (5 mm in diameter), to allow drainage of excess water and soil aeration. When the plants were 8 cm tall, they were mowed at a 5 cm height. The grass was mowed at the same height three times weekly thereafter. In addition, the seedings were irrigated daily and fertilized twice weekly with half-strength Hoagland’s solution [35]. After a 2-month of growth period, the plants were rinsed thoroughly using distill water and transferred into 300 ml erlenmeyer flasks filled with approximately 290 ml half-strength Hoagland’s solution. The flasks were wrapped with aluminum foil to prevent potential growth of algae and the bottlenecks were closed with a proper amount of absorbent paper. All flasks were kept in a greenhouse with daily temperature of 21/18°C (day/night), photosynthetic active radiation (PAR) at 300 µmol m−2 s−1, and a 14 h photoperiod. The transpiration rate of each flask was calculated based on the difference in weight of plant-flask system at the beginning of the study. Plants with similar transpiration rate were selected for each replicate of the NaCl treatments. Plants were allowed to grow in the above-mentioned conditions for 2 weeks before the NaCl treatments were initiated.
Treatments and Experiment Design
After 2-week period of pre-adaptation, perennial ryegrass was subjected to three salinity levels (0, 200 and 400 mM NaCl) in each flask by adding NaCl to the half-strength Hoagland nutrition. Each flask contained 0.1 µmol magnesium oxide for providing plants additional oxygen. The flasks were sealed with plasticene covered with preservative film and wrapped with silicon sealant to prevent escape of water or chemicals. Each treatment maintained the final concentration for 5 days. At the end of the experiment, the roots, stems and leaves were harvested separately. Treatments and grass accessions were arranged in a randomized complete block design with four replicates.
Measurements
Vertical canopy height of each grass before and after treatment was measured. Average relative growth rate (RGR) was calculated by Eq 1, where H0 and Ht denote initial and final height between two adjacent marks, respectively, and  the duration of the experiment (5 d).
| (1) |
As the second parameter for evaluating growth status, turf quality was rated visually based on turfgrass color (percentage green leaves), plant density and degree of leaf wilting on a scale of 0 to 9 with 0 score indicating grass being withered and yellow, thin and dead, and 9 score indicating the grass being green, dense, uniform and 6 being the minimum acceptable level [36].
The transpiration rate of plants is a significant physiological index reflecting toxic effects under abiotic stress [37]. The plant-flask system was weighed every day for determining transpiration rate (i.e. water loss). The relative transpiration was normalized with respect to the initial and non-contaminated transpiration. The mean normalized relative transpiration (NRT) was calculated by Eq 2:
| (2) |
where C is the concentration (mg L−1), T represents the absolute transpiration of the grass (g d−1), t is time period (0–1, 1–2 d, etc.), i is the replicate 1, 2,…, n and j is control 1, 2,…, m. The NRT of controls is always set at 100%. The NRT <100% indicates a inhibition of grass’s transpiration, the NRT >100% stimulation.
CO2 assimilation (Pn), stomatal conductance (gs), and intercellular CO2 concentration (Ci) were measured with 4 fully expanded leaves (second from the top) from each pot. Measurements were made with a portable Li-6400/xt gas-exchange system (Li-6400/xt, LICOR, Inc, Lincoln, NB) at 500 µmol s−1 flow rate (leaf temperature of 20±0.4°C, 60±5% relative humidity) under a controlled light intensity of 600 µmol m−2 s−1.
To determine leaf photochemical efficiency (maximum quantum efficiency of PSII), the sections of intact leaves were darkened for 30 min with leaf clips. The ratio of variable to maximum fluorescence of chlorophyll (Fv/Fm) was measured with Handy Plant Efficiency Analyser (PAM-2500, Hansatech Instruments Limited, Norfolk, UK) according to Gutiérrez et al. [38].
Soluble sugars in roots, stems and leaves of perennial ryegrass were extracted and assayed according to Morvan-Bertrand et al. [39]. Dry ground tissues (100 mg) were extracted in 2 ml of 92% ethanol for 10 min under intensive oscillation at 25°C. The sample was centrifuged at 20820 g for 10 min and the residue was re-extracted a further two times with 2 ml of 92% ethanol. The three supernatants were pooled and evaporated to dryness under vacuum. The ethanol and aqueous extracts were dissolved in 0.3 ml water and filtered through a 0.45-µm nylon membrane before analysis by HPLC. The soluble sugars in aliquots of carbohydrate extracts were determined using a Waters HPLC system consisting of a model 717 autosampler, model 515 pump, and Water 2410 refractive index detector (Waters Corp., MA, USA). The separation was completed on a crest amino column (4.6×250 mm, 5 µm, Boston Analytics, Inc. USA). The mobile phase consisted of acetonitrile/water (50/50, v/v) with isocratical elution at a flow rate of 1.0 ml min−1. The temperature of column oven was set at 40°C.
Analysis of Gene Expression
Total RNA was extracted from the leaf tissues using Trizol reagent according to the manufacturer’s instructions. In order to remove the genomic DNA contamination, RNA samples were treated with RNase-free DNaseI. The concentration and quality of RNA preparations were determined by measuring the absorbance at 260 nm and 280 nm in a spectrophotometry (UV-2600, UNICO Instruments Co., Ltd., Shanghai, China) and checked by running a gel electrophoresis in 1.5% agarose gels with 1 µl RNA ( = 0.5 µg µl−1).
Reverse transcription of the purified RNA was performed at 42°C for 60 min in 20 µl reaction mixture including 2 µg RNA, 1 µl oligo (dT)18 primer, 5×reaction buffer, 1 µmol dNTPs, 20 units of RNase inhibitor and 200 units of M-MuLV Reverse Transcriptase, using the first strand cDNA synthesis kit (Fermentas, Canada). The first cDNA template was diluted 6-fold and kept at −20°C for RT-PCR amplification analysis. Primer sequences used to amplify the genes of interest are listed in Table 1. YT521-B gene was used as the reference gene [82]. The PCR reactions were performed in a Biometra Uno II thermal cycler consisting of an initial denaturing step at 95°C for 3 min, followed by 45 cycles of amplifications as follows: 10 s at 94°C, 20 s annealing for different primer at 55–58°C, and 20 s at 72°C, with a final elongation of 5 min at 72°C. Amplified products were visualized by 1.6% (w/v) agarose gel and stained in ethidium bromide (0.5 µg/ml) after running at 100 V for 40 min in 1×TE buffer (10 mM Tris, 1 mM EDTA). The digital images of the gels were visualized and photographed by the Gel Doc XR system (Bio-rad, USA).
Table 1. Primer sequences for RT-PCR amplification analysis in perennial ryegrass.
| Gene | Primers Sequences(5′–3′) | Tm (°C) | Reference | |
| SPS | F | GGCACGAGGCTCTCTGTG | 55 | Liu et al., 2008 |
| R | CCGACTCCATGAACGATG | |||
| SS | F | CCGTTCATTCTGTTTTTACTAC | 55 | Liu et al., 2008 |
| R | CAGGAATGGTGGTCAGGAAC | |||
| SI | F | CCTATTTTACCAGTACAATCCC | 58 | Liu et al., 2008 |
| R | CCAACCAAG CAAAATCCTC | |||
| 6-SFT | F | GACCGCCTGGTACGACGAGT | 58 | Wei and Chatterton, 2001 |
| R | TCCATGCTCGCCTTCAACAC | |||
| YT521-B | F | TGT AGC TTG ATC GCA TAC CC | 55 | Lee et al., 2010 |
| R | ACT CCC TGG TAG CCA CCT T | |||
Statistical Analysis
The data were subjected to two-way analysis of variance. Mean (±SE) separations of results for each sample and plot were performed with least significant difference (LSD) test at 5% probability level using the SAS statistical software package (SAS 9.0 for windows, SAS Institute Inc., Cary, NC). All results within the experiment were expressed as mean of four replicates.
Results
Growth Rate and Transpiration
Salt stress reduced turf quality and RGR in two perennial ryegrass accessions (Fig. 1), with a larger extent in salt-sensitive ‘PI 538976’ than salt-tolerant ‘Overdrive’. Turf quality was better in ‘Overdrive’ than ‘PI 538976’ subjected to 200 mM and 400 mM NaCl (Fig. 1A). The RGR was 73.8% and 95.4% lower in ‘PI 538976’ and 49.2% and 92.7% in ‘Overdrive’ subjected to 200 mM and 400 mM NaCl, respectively, when compared to the control (Fig. 1B). Salt stress resulted in a lower level of NRT regardless of NaCl level in two perennial ryegrass accessions during whole experimental period (Fig. 2). The salinity stress (200 mM NaCl) caused a greater reduction in NRT in ‘PI538976’ relative to ‘Overdrive’. The salinity stress (200 mM NaCl) reduced NRT by 79.3% in ‘PI 538976’ and 68.6% in ‘Overdrive’ when compared to control as measured at 2 d after treatment (DAT) (Fig. 2A, B).
Figure 1. Effects of salt stress on turf quality (A) and relative growth rate (B) in ‘PI 538976’ and ‘Overdrive’.
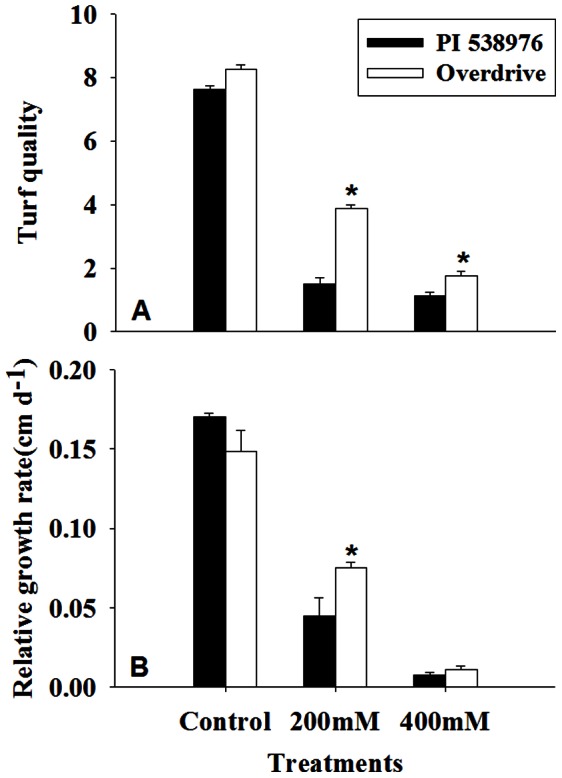
Vertical bars represent means ± standard errors (n = 4) based on least significant difference (LSD) test (P ≤ 0.05). Asterisk symbols indicate significant differences between ‘PI 538976’ and ‘Overdrive’ (P ≤ 0.05).
Figure 2. Normalized relative transpiration (NRT) of two perennial ryegrass accessions ‘PI 538976’ (A) and ‘Overdrive’ (B) in response to different levels of NaCl stress.
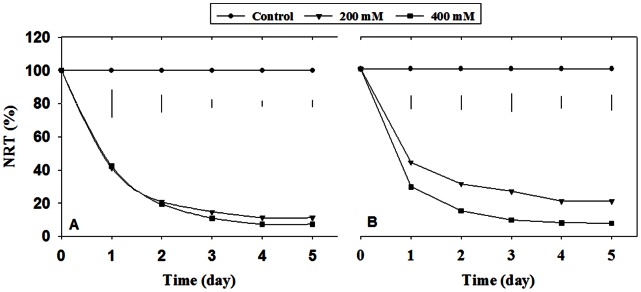
Vertical bars on the top of each figure were least significant difference (LSD) test (P ≤ 0.05).
Leaf Photosynthetic Traits
Salinity stress reduced CO2 assimilation (Pn), stomatal conductance (gs), and intercellular CO2 concentration (Ci) for both perennial ryegrass accessions (Fig. 3). Pn was decreased by 71.7% and 78.5% for ‘PI 538976’ subjected to 200 mM and 400 mM NaCl, respectively, when compared to the control at 5 DAT. The NaCl at 200 mM and 400 mM reduced photosynthetic rate by 48.3% and 75.3%, respectively, in ‘Overdrive’ when compared to the control (Fig. 3A). The NaCl at 200 mM and 400 mM reduced leaf gs by 11.1% and 14.8%, respectively, relative to the control for ‘PI 538976’ at 5 DAT. In ‘Overdrive’, the salinity stress at 200 mM and 400 mM NaCl reduced leaf gs by 25.7% and 9.8%, respectively, relative to the control at 5 DAT (Fig. 3B). Leaf Ci was the lowest for ‘PI 538976’ treated with 200 mM NaCl, but increased by 70.2% for this accession treated with 400 mM NaCl at 5 DAT. ‘PI 538976’ had a higher level of gs and Ci than ‘Overdrive’ when subjected to 400 mM NaCl at 5 DAT (Fig. 3D). The untreated plants maintained above a 0.75 level of leaf Fv/Fm during whole experimental period for both perennial ryegrass accessions. The Fv/Fm declined in both accessions as NaCl concentration increased. When exposed to 400 mM NaCl, ‘Overdrive’ had a greater Fv/Fm level than ‘PI 538976’ at the end of the experiment (Fig. 3C).
Figure 3. Effects of salt stress on CO2 assimilation (Pn), stomatal conductance (gs), internal CO2 concentration (Ci) and photochemical efficiency (Fv/Fm) in two perennial ryegrass accessions ‘PI 538976’ and ‘Overdrive’.

Vertical bars represent means ± standard errors (n = 4) based on least significant difference (LSD) test (P ≤ 0.05). Asterisk symbols indicate significant differences between ‘PI 538976’ and ‘Overdrive’ (P ≤ 0.05).
Soluble Sugar
Fructose (Fru) content was greater in root, stem and leaf of NaCl treated ‘PI 538976’, when compared to the control (Fig. 4a, b, c). Salinity stress led to an increase in stem and leaf Fru in ‘Overdrive’, but had no effects on root Fru. The unstressed roots and leaves of ‘Overdrive’ had a higher level of Fru than those of ‘PI 538976’ (Fig. 4a, c). However, there were no differences in Fru content in roots for both accessions under salinity stress (Fig. 4c). Leaf Fru content was higher in ‘Overdrive’ relative to ‘PI 538976’ (Fig. 4a). ‘PI 538976’ had a greater Fru content than ‘Overdrive’ under non-stressed and salt-stressed conditions in stems (Fig. 4b).
Figure 4. Effects of salt stress on the contents of fructose (Fru), glucose (Glu), sucrose (Suc), total soluble sugar (Glu+Fru+Suc) in leaves, stems and roots of two perennial ryegrass accessions (‘PI 538976’, black bar; ‘Overdrive’, white bar).

Vertical bars represent means ± standard errors (n = 4) based on least significant difference (LSD) test (P ≤ 0.05). Asterisk symbols indicate significant differences between ‘PI 538976’ and ‘Overdrive’ (P ≤ 0.05).
Salt stress significantly promoted glucose (Glu) accumulation in roots, stems and leaves of both grass accessions (Fig. 4d, e, f). ‘PI 538976’ was superior to ‘Overdrive’ in accumulating Glu in roots and leaves under non-salinity or salinity conditions (Fig. 4d, f). There was no difference in stems Glu content between ‘PI 538976’ and ‘Overdrive’ subjected to salinity during whole experimental period (Fig. 4e). Glu content was too low to be detected for roots and stems of non-stressed ‘PI 538976’ and for roots of non-stressed ‘Overdrive’.
The root sucrose (Suc) was not detected for ‘PI 538976’ regardless of salinity treatments. ‘Overdrive’ had greater stem and root Suc content than ‘PI538976’ when exposed to NaCl stress (Fig. 4 h, i). Leaf Suc content was greater in 200 mM NaCl regime versus other two treatments for both ‘PI 538976’and ‘Overdrive’. There was no difference in stem Suc contents of ‘PI 538976’ among three salinity treatments (Fig. 4 h). ‘Overdrive’ had a lower stem Suc content at 400 mM NaCl regime, when compared to the control (Fig. 4 h). ‘Overdrive’ had higher stem and root Suc content than ‘PI 538976’ regardless of NaCl treatments (Fig. 4 h, i). The two accessions had a similar level of leaf Suc in all salinity regimes.
Salinity stress increased soluble sugar (Glu+Fru+Suc) content in all tissues of both grass accessions (Fig. 4j, k, m). Under non salinity conditions, ‘PI 538976’ produced less soluble sugar in roots and stems than ‘Overdrive’. Under salinity stress (400 mM NaCl) conditions, ‘PI538976’ accumulated more soluble sugar in root and stem tissues than ‘Overdrive’ (Fig. 4k, m). ‘PI 538976’ accumulated more soluble sugar in leaves than ‘Overdrive’ under non-salinity or salinity conditions.
Relationships among Photosynthetic Traits and Soluble Sugar Content
For ‘PI 538976’, Glu and GFS content in leaves, stems and roots negatively and significantly correlated with Pn under salt stress (P<0.01) and the same relationships in leaves and roots for ‘Overdrive’ (Table 2). Glu and GFS content in roots negatively correlated with all photosynthetic traits [Pn (P<0.05), gs (P<0.01), Ci (P<0.05), Fv/Fm (P<0.05) ] in both grass accessions under salt stress. Fru content in leaves and stems of both grass accessions negatively correlated with Pn (P<0.01) and gs (P<0.01), except for Pn (P = −0.45) in ‘Overdrive’. In ‘PI 538976’ roots, Fru content was observed to negatively and significantly correlate with gs (P<0.05) and Ci (P<0.05). Suc content in ‘Overdrive’ roots negatively correlated with all photosynthetic traits [Pn (P<0.05), gs (P<0.05), Ci (P<0.05), Fv/Fm (P<0.01) ]. Suc content in ‘Overdrive’ stems was observed to positively and significantly correlate with Pn (P<0.01), gs (P<0.05) and Fv/Fm (P<0.01). As a sink, Suc content in leaves had no significantly effects on all photosynthetic traits in both grass accessions.
Table 2. Correlations among photosynthesis traits, Fru, Glu, Suc and Glu+Fru+Suc (GFS) content in leaves, stems and roots of perennial ryegrass under salt stress.
| Trait | Species | Leaves | Stems | Roots | |||||||||
| Fru | Glu | Suc | GFS | Fru | Glu | Suc | GFS | Fru | Glu | Suc | GFS | ||
| CO2 assimilation (Pn) | PI 538976 | −0.94** | −0.83** | −0.53 | −0.83** | −0.80** | −0.79** | 0.47 | −0.85** | −0.55 | −0.79** | ND | −0.78** |
| Overdrive | −0.45 | −0.73** | −0.38 | −0.79** | −0.84** | −0.38 | 0.69** | −0.24 | 0.30 | −0.77** | −0.58* | −0.63* | |
| Stomatal conductance (gs) | PI 538976 | −0.98** | −0.95** | −0.44 | −0.93** | −0.77** | −0.79** | 0.39 | −0.86** | −0.67* | −0.92** | ND | −0.91** |
| Overdrive | −0.55* | −0.85** | −0.37 | −0.89** | −0.83** | −0.57* | 0.65* | −0.39 | 0.27 | −0.89** | −0.62* | −0.72** | |
| Internal CO2 concentration (Ci) | PI 538976 | −0.39 | −0.55 | −0.10 | −0.51 | 0.00 | −0.13 | −0.13 | −0.11 | −0.65* | −0.57* | ND | −0.58* |
| Overdrive | −0.16 | −0.70** | 0.09 | −0.58* | −0.47 | −0.33 | 0.50 | −0.17 | −0.22 | −0.78** | −0.54* | −0.76** | |
| Photochemical efficiency (Fv/Fm) | PI 538976 | −0.48 | −0.19 | 0.36 | −0.14 | −0.83** | −0.47 | 0.52 | −0.64* | −0.46 | −0.60* | ND | −0.59* |
| Overdrive | −0.46 | −0.77** | −0.12 | −0.75** | −0.59* | −0.31 | 0.79** | −0.07 | 0.14 | −0.85** | −0.76** | −0.82** | |
and * indicate P ≤ 0.01 and 0.05, respectively.
Effects of Soluble Sugar Flux on Growth Traits and Salt Tolerance
GFS content in leaves negatively and significantly correlated with RGR in ‘Overdrive’ (P<0.01) and ‘PI 538976’ (P<0.05) under salt stress and the same relationship was observed in stems (P<0.01) and roots (P<0.05) for ‘PI 538976’ (Fig. 5a, c). GFS content in leaves, stems and roots of both grass accessions negatively and significantly correlated with turf quality, except for ‘Overdrive’ stems (Fig. 5e, g). As a soluble sugar flux index, carbohydrate allocation in stems positively and significantly correlated with RGR in both grass accessions (r2 = 0.88, P<0.01 for ‘Overdrive’; r2 = 0.78, P<0.05 for ‘PI 538976’) (Fig. 5b, d). For ‘Overdrive’, carbohydrate allocation negatively and significantly correlated with RGR (r2 = 0.83, P<0.01) in leaves (Fig. 5b). However, a positive and significant relationship between carbohydrate allocation and RGR was observed in ‘PI 538976’ leaves (r2 = 0.71, P<0.05) (Fig. 5d). Carbohydrate allocation positively correlated with turf quality in stems of both grass accessions (r2 = 0.82, P<0.01 for ‘Overdrive’; r2 = 0.86, P<0.01 for ‘PI 538976’) and negatively correlated with turf quality in ‘PI 538976’ roots (r2 = 0.96, P<0.01) (Fig. 5f, h). For ‘Overdrive’, carbohydrate allocation negatively and significantly correlated with turf quality (r2 = 0.88, P<0.01) in leaves (Fig. 5f). However, a positive correlation between carbohydrate allocation and turf quality was observed in ‘PI 538976’ leaves (r2 = 0.62, P>0.05) (Fig. 5 h).
Figure 5. Correlations of GFS, carbohydrate allocation, RGR and turf quality in leaves, stems and roots of two perennial ryegrass accessions ‘PI 538976’ and ‘Overdrive’ in response to salt stress.

Carbohydrate allocation was on behalf of the rate of GFS content in one tissue to total GFS content in plant.
Gene Expression to NaCl in Roots, Stems and Leaves
The expression of SPS in stems was lower for both accessions subjected to salinity. Both grass accessions exhibited a slight up-regulated expression of SPS in roots in response to salinity stress (Fig. 6). SPS expression was the highest for 200 mM NaCl-treated ‘PI 538976’ leaves (Fig. 6A). There was no difference in SPS expression between the control and salinity regimes for ‘Overdrive’ leaves (Fig. 6B). The highest root SS gene expression was found in ‘PI 538976’ treated with 200 mM NaCl. No difference SS expression was observed between the control and salinity regimes in all ‘Overdrive’ tissues. Stems and roots exhibited higher levels of SS transcripts relative to leaves in the ‘Overdrive’ at the same salinity level. In contrast, leaves exhibited higher level of SS expression relative to stems and roots in ‘PI 538976’. Higher levels of transcripts of SPS and SS gene in stem and root tissues were observed in ‘Overdrive’ relative to ‘PI 538976’ at the same salinity treatment. There was no difference in SI expression in ‘Overdrive’ leaves among all salinity treatments. Salt stress, however, inhibited SI expressions in ‘PI 538976’ leaves. SI expression was down-regulated in stems and up-regulated in ‘PI 538976’ roots subjected to 200 mM NaCl. ‘Overdrive’ exhibited an up-regulated SI expression in the 200 mM NaCl stressed roots. When subjected to the same level of salinity, SI expression of both grass accessions was the greatest for leaves, followed by stems and roots. The ‘Overdrive’ maintained a higher level of SI expression for all plant tissues compared with ‘PI 538976’ at the same level of salinity.
Figure 6. RT-PCR analyses of sucrose phosphate synthase (SPS), sucrose synthase (SS), cell wall sucrose invertase (SI), and sucrose: fructan 6-fructosyltransferase (6-SFT) genes in the leaves, stems and roots of ‘PI 538976’ (A) and ‘Overdrive’ (B) grown under normal (0 mM NaCl) or salt stress condition (treated with 200 or 400 mM NaCl for 5 days).
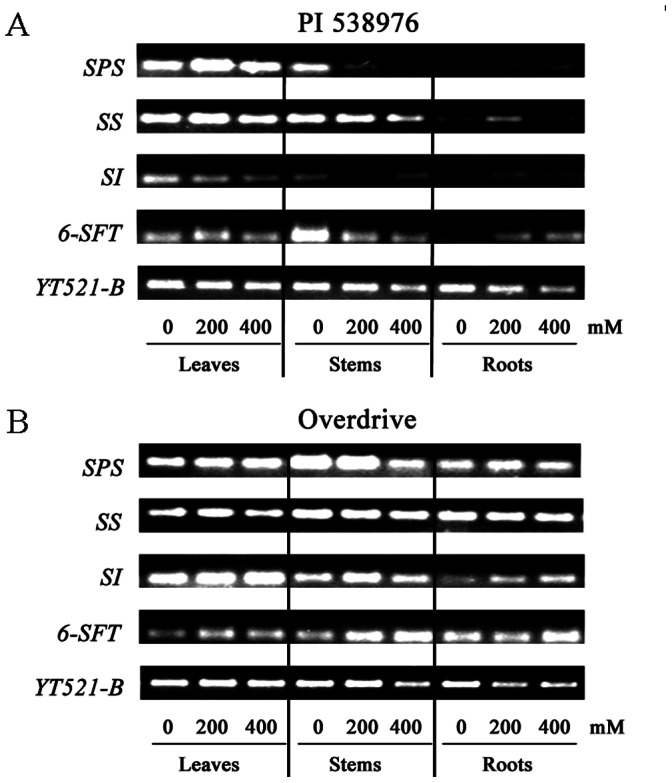
YT521-B gene was used as the reference gene for cDNA normalization.
The expression of 6-SFT was inhibited in the stems and induced in roots of ‘PI 538976’ when subjected to salinity stress. The expression of 6-SFT in leaf tissue was up-regulated in ‘PI 538976’ when subjected to 200 mM NaCl. No significant difference was observed in leaf 6-SFT between both grass accessions at the same level of salinity. Salt stress induced slightly expression of 6-SFT in leaves and stems of ‘Overdrive’. A higher level of root 6-SFT expression was observed in ‘Overdrive’ relative to ‘PI 538976’ at the same level of salinity. ‘Overdrive’ had a lower level of stem 6-SFT expression in the control and a higher level of 6-SFT expression under the salinity regimes than ‘PI 538976’.
Discussion
The present study indicated that salt stress caused toxicity to perennial ryegrass. In response to salt stress, RGR decreased significantly for two perennial ryegrass accessions. The lower relative shoot growth rate of salinity-stressed plants was consistent with the previous results in mangrove (Rhizophora mangle) [40], [41], maize (Zea mays) [7], [42]. The decreased growth rate of salinity-stressed shoots may be resulted from decrease in division and expansion of plant cell [43]–[45] and higher apoplastic level of ions in the cell or inside-negative electrochemical gradient [46], [47]. The unbalance of photosynthesis and respiration also contributed to the decrease in growth rate [48], [49]. No significant difference in RGR were found between ‘PI 538976’ and ‘Overdrive’ in control regimes. However, salt tolerant ‘Overdrive’ exhibited descent RGR at less extent and a little greater growth rate than salt sensitive ‘PI 538976’. The results of this study along with previous studies suggested that reduction in growth rate may be related with the sensitivity to salinity in different plants [40], [50].
Normalized relative transpiration has been considered as an indicator of toxicity effects in the salinity stressed plants [34], [51], [52]. Salinity reduced NRT of the two accessions regardless of salinity regimes. Similar results have been obtained from citrus (Citrus reticulata Banco) [53], [54], rice [55], willow (Salix spp.) [51]. The reduction in transpiration may be contributed by injuries or decreases of hydraulic conductance in roots [56], the decrease of water potential (ψ 1) and stomatal closure in leaves [54]. The present study indicated that a greater reduction in NRT was observed at 2 DAT in salt-sensitive ‘PI 538976’ relative to ‘Overdrive’ subjected to 200 mM NaCl. Furthermore, ‘Overdrive’ maintained better turf quality than ‘PI 538976’ at 200 mM NaCl. This suggests that salt sensitive accession may reduce NRT at greater extent than salt tolerant accession in response to salinity stress.
Previous investigations demonstrated that salt stress resulted in an inhibition to PSII activity [10], [57]–[59]. However, Morales et al. [60] have reported that salinity did not affect PSII of most barley leaves. Our results showed that Fv/Fm decreased significantly for the two accessions at 400 mM NaCl treatment relative to the control. NaCl at 200 mM had no effects on the Fv/Fm of salt-sensitive ‘PI 538976’. ‘Overdrive’ had a higher Fv/Fm than ‘PI 538976’, when exposed to 400 mM NaCl. These results indicated that only severe salinity stress caused reduction in Fv/Fm and ‘PI 538976’ was more sensitive to severe salinity stress than in ‘Overdrive’. This suggests that severe salinity may directly damage PSII rather than changes electron transport activity [61]–[63].
The present study indicated that moderate salinity (200 mM NaCl) resulted in dramatic decline in net Pn, Ci, gs and NRT for both accessions. The results suggested that the earlier photoinhibition of perennial ryegrass may be mainly caused by the diffusion limitations through the stomata and the mesophyll. This is in agreement with the results obtained in bean [8], bean and cotton [5] and cotton [6], and olive trees (Olea europaea L.) [64]. Pn remained unchanged for ‘Overdrive’ as NaCl concentration increased from 200 mM to 400 mM. For ‘PI 538976’, increase in Ci and low levels of Pn, gs and NRT of suggested that the lower Pn may be mainly resulted from non-stomatal limitation for the salt sensitive plants. Non-stomatal limitation has been considered as the major cause for the alterations of photosynthetic metabolism at high salinity levels.
Soluble sugar (i.e. sucrose, glucose and fructose) is the major existence form of products of photosynthesis in C3 grasses, in which the sugar is translocated from source tissue to the sink tissues such as roots and stems [18], [65], [66]. The results of this study indicated that, plant sink tissues (i.e. roots, stems and leaves) accumulated more soluble sugars (Fig. 4) despite decreased Pn (Fig. 3). Salt-sensitive accession accumulated greater amount of soluble sugars in the sink tissues than salt-tolerant accession in response to salt stress. These results suggested that soluble sugar play a critical role in regulating the CO2 assimilation for plant adaptation to salt stress [43], [67]. This inference was also supported by the results that leaf soluble sugar content in both grass accessions was generally negatively correlated with Fv/Fm, Ci and gs (Table 2). Soluble sugar in the major sink tissue (roots, stems) of both grass accessions was generally negatively correlated with CO2 assimilation rate. This supported the hypothesis that feedback repression from source–sink regulation by carbohydrate may fine tune the rate of CO2 assimilation [26], [67], [68]. Furthermore, GFS content in all tissues (leaves, stems and roots) of both grass accessions negatively and significantly correlated with turf quality, except for ‘Overdrive’ stems (Fig. 5e, g). GFS content in leaves negatively and significantly correlated with RGR in ‘Overdrive’ (P<0.01) and ‘PI 538976’ (P<0.05) under salt stress and their relationship was observed for stems (P<0.01) and roots (P<0.05) in ‘PI 538976’ (Fig. 5a, c). These indicated that soluble sugar excessively accumulated in source–sink tissues partially inhibited the plant growth. In addition, in leaves, carbohydrate allocation negatively and significantly correlated with RGR (r2 = 0.83, P<0.01) and turf quality (r2 = 0.88, P<0.01) in salt-tolerant ‘Overdrive’, however, the opposite trend for salt-sensitive ‘PI 538976’ (r2 = 0.71, P<0.05 for RGR; r2 = 0.62, P>0.05 for turf quality). These indicated that plant salt tolerance may be changed with the transformation of soluble sugar flux in different sink tissues (leaf, stem and root).
Sucrose is the major form of carbohydrates for translocation [69]. Previous studies indicated that excess accumulation of sucrose can feed forward to activate signal transduction pathways in sink processes and feed back to down-regulated photosynthesis [70]–[73]. If the decline in photosynthesis was induced by the feedback regulation due to excess accumulated sucrose, it could be hypothesized that excess sucrose accumulated in sink tissue when the photosynthesis declined. Salinity did not affect leaf Suc content for both accessions subjected to 400 mM NaCl in spite of decrease in Pn. Root Suc content was detected in ‘Overdrive’ as NaCl concentration increased. In ‘PI 538976’ root, Suc content showed large negative correlations with photosynthetic traits (P<0.05 for Pn, gs, Ci; P<0.01 for Fv/Fm; Table 2). This suggests that the effects of Suc negative feedback regulation in signal transduction pathways induced by salt stress in root cell.
Hexoses (i.e. Fru and Glu) are important signal molecules in source–sink regulation, which can modulate gene expression encoding photosynthetic proteins [71], [73], [74]. Our results showed that salt stress significantly promoted Glu accumulation in roots, stems and leaves of both grass accessions. However, salt-sensitive ‘PI 538976’ accumulated higher Glu content in salinity-stressed roots and leaves than ‘Overdrive’. Fru also accumulated in stems and leaves of both accessions under salt stress. As accumulation of hexoses in sink tissues increased, the leaf photosynthetic rate decreased. This is in agreement with the result with citrus leaves in response to boron stress [75]. Furtherly, Glu content in roots negatively correlated with all photosynthetic traits [Pn (P<0.05), gs (P<0.01), Ci (P<0.05), Fv/Fm (P<0.05) ] in both grass accessions under salt stress. And Fru content in leaves and stems of both grass accessions negatively correlated with Pn (P<0.01) and gs (P<0.01), except for Pn (P = −0.45) in ‘Overdrive’. These results indicate that a negative feedback repression of photosynthesis may take place through accumulation of hexoses in the sink tissues under salinity conditions in perennial ryegrass.
In plant cells, the mutual transformation among sucrose, glucose and fructose proceed according to the readily reversible reaction: sucrose ↔ glucose+fructose, [76]. The regulation of the metabolism reaction might be attributed to up and down expression of the candidate gene [29]. The expression of SPS and SS was decreased with the increasing salinity concentration in ‘PI 538976’ stems, while SPS expression was also lower in ‘Overdrive’ stems. The SI expression was induced by salt stress (200 mM NaCl) in ‘Overdrive’ stems. If expression of both SPS and SS, which encoding enzymes for biosynthesis of Suc, was down-regulated and further the expression of SI encoding enzymes to converted Suc was inducted in salinity-stressed stems, it can be hypothesized that stems Suc content decreased in the same salinity-stressed tissues. The results of this study indicated that stem Suc content decreased and both Fru and Glu content increased in both grass accessions. This suggests that gene regulation may have effects at transcription level or soluble sugars feeding may effectively induce or repress gene expression in stems of perennial ryegrass [77], [78].
In the roots of both grass accessions, the increased SI expression was not concomitant with a similar decrease in expression of both SPS and SS gene. In salt sensitive ‘PI 538976’ roots, there was a dramatic increase of SPS and SI gene expression with the increase of NaCl concentration and SS gene was significantly induced at 200 mM NaCl. Similarly, SI and SPS gene expression in root tissue increased in ‘Overdrive’ exposed to 200 mM NaCl. We further found that salinity-stressed roots of ‘Overdrive’ had more Suc and Glu. This suggests the induction of all SPS, SS and SI genes may play a key role in maintaining the balance of Suc metabolism in systemic acquired resistance in response to salt stress [27], [79].
The reaction (sucrose→ fructan+ glucose) is catalyzed by sucrose: fructan 6-fructosyltransferase in cool-season grasses cells [78], [80]. Our results indicated that stem Suc content decreased, but Glu content increased in NaCl treated ‘Overdrive’. Here we also found that salt stress induced slightly the expression of 6-SFT in all plant tissues of tolerant ‘Overdrive’. In salinity-stressed roots of sensitive ‘PI 538976’, both 6-SFT expression and Glu content increased. These results indicated that 6-SFT may play an important role in converting sucrose into fructan and glucose [81]. The levels of SPS, SS, SI, 6-SFT expression in all tissues were higher in salt-tolerant ‘Overdrive’ than that in salt-sensitive ‘PI 538976’. This suggests that tolerance to salt stress was at least in part associated with up-regulated expression of carbohydrate metabolism gene.
Conclusions
In conclusion, an accumulation of free hexoses in roots, stems and leaves can repress photosynthesis in salinity-stress perennial ryegrass. There is evidence here that high carbohydrate allocation in stems and low carbohydrate allocation in leaves may play a key role in improving salt tolerance of perennial ryegrass. The grass tolerance to salt stress was in part associated with up-regulated expression of carbohydrate metabolism gene (SPS, SS, SI, 6-SFT). Soluble sugars accumulation effectively induced or repressed SPS, SS, SI gene expression in stems of perennial ryegrass. The present work also showed that maintenance of higher CO2 assimilation capacity (higher Pn, Fv/Fm and lower gs, Ci at 400 mM NaCl) under salt stress in salt-tolerant relative to salt-sensitive perennial ryegrass accessions attributed to higher RGR, NRT, turf quality, expression of soluble sugars metabolism gene (SPS, SS, SI, 6-SFT) and lower levels of accumulation in soluble sugars in sink tissues. The carbohydrate allocation and source–sink regulation induced by sugars can help us better understand salt stress tolerance and breeding salt-tolerant grasses.
Acknowledgments
We thank Yanhong Lou at Wuhan Botanical Garden, Chinese Academy of Science and Jianming Sun at the Shanghai Jiao Tong University.
Funding Statement
This research was financially supported by National Natural Science Foundation of China (Grant: 31071822/C150302) and Innovative Program of The Chinese Academy of Sciences (Project #: KSCX2-YW-N-068). The funders had no role in study design, data collection and analysis, decision to publish, or preparation of the manuscript.
References
- 1. Shabala S, Cuin TA (2007) Potassium transport and plant salt tolerance. Physiol Plant 133: 651–669. [DOI] [PubMed] [Google Scholar]
- 2. Zhu JK (2001) Plant salt tolerance. Trends Plant Sci 6: 66–71. [DOI] [PubMed] [Google Scholar]
- 3. Munns R (2005) Genes and salt tolerance: bringing them together. New Phytol 167: 645–663. [DOI] [PubMed] [Google Scholar]
- 4.Rhoades J, Loveday J (1990) Salinity in irrigated agriculture. In American Society of Civil Engineers, Irrigation of Agricultural Crops (Monograph 30) (eds Steward BA, Nielsen DR), 1089–1142, American Society of Agronomists.
- 5. Brugnoli E, Lauteri M (1991) Effects of salinity on stomatal conductance, photosynthetic capacity, and carbon isotope discrimination of salt-tolerant (Gossypium hirsutum L.) and salt-sensitive (Phaseolus vulgaris L.) C3 non-halophytes. Plant Physiol 95: 628–635. [DOI] [PMC free article] [PubMed] [Google Scholar]
- 6. Meloni DA, Oliva MA, Martinez CA, Cambraia J (2003) Photosynthesis and activity of superoxide dismutase, peroxidase and glutathione reductase in cotton under salt stress. Environ Exp Bot 49: 69–76. [Google Scholar]
- 7. Bernstein N, Shoresh M, Xu Y, Huang B (2010) Involvement of the plant antioxidative response in the differential growth sensitivity to salinity of leaves vs roots during cell development. Free Radical Bio Med 49: 1161–1171. [DOI] [PubMed] [Google Scholar]
- 8. Seemann JR, Critchley C (1985) Effects of salt stress on the growth, ion content, stomatal behaviour and photosynthetic capacity of a salt-sensitive species, Phaseolus vulgaris L. Planta. 164: 151–162. [DOI] [PubMed] [Google Scholar]
- 9. Bethke PC, Drew MC (1992) Stomatal and nonstomatal components to inhibition of photosynthesis in leaves of capsicum annuum during progressive exposure to NaCl salinity. Plant Physiol 99: 219–226. [DOI] [PMC free article] [PubMed] [Google Scholar]
- 10. Everard JD, Gucci R, Kann SC, Flore JA, Loescher WH (1994) Gas exchange and carbon partitioning in the leaves of celery (Apium graveolens L.) at various levels of root zone salinity. Plant Physiol 106: 281–292. [DOI] [PMC free article] [PubMed] [Google Scholar]
- 11. Delfine S, Alvino A, Villani MC, Loreto F (1999) Restrictions to carbon dioxide conductance and photosynthesis in spinach leaves recovering from salt stress. Plant Physiol 119: 1101–1106. [DOI] [PMC free article] [PubMed] [Google Scholar]
- 12. Dionisio-Sese M, Tobita S (2000) Effects of salinity on sodium content and photosynthetic responses of rice seedlings differing in salt tolerance. J Plant Physiol 157: 54–58. [Google Scholar]
- 13. Seckin B, Turkan I, Sekmen AH, Ozfidan C (2010) The role of antioxidant defense systems at differential salt tolerance of Hordeum marinum Huds. (Sea barleygrass) and Hordeum vulgare L. (cultivated barley). Environm Exp Bot 69: 76–85. [Google Scholar]
- 14. Sade N, Gebretsadik M, Seligmann R, Schwartz A, Wallach R, et al. (2010) The Role of Tobacco Aquaporin1 in Improving Water Use Efficiency, Hydraulic Conductivity, and Yield Production Under Salt Stress. Plant Physiol 152: 245–254. [DOI] [PMC free article] [PubMed] [Google Scholar]
- 15. Seemann JR, Sharkey TD (1986) Salinity and nitrogen effects on photosynthesis, ribulose-1, 5-bisphosphate carboxylase and metabolite pool sizes in Phaseolus vulgaris L. Plant Physiol. 82: 555–560. [DOI] [PMC free article] [PubMed] [Google Scholar]
- 16. Baker NR (1991) A possible role for photosystem II in environmental perturbations of photosynthesis. Physiol Plant 81: 563–570. [Google Scholar]
- 17. Havaux M (1992) Stress tolerance of photosystem II in vivo: antagonistic effects of water, heat, and photoinhibition stresses. Plant Physiol 100: 424–432. [DOI] [PMC free article] [PubMed] [Google Scholar]
- 18. Moing A, Carbonne F, Rashad MH, Gaudill JP (1992) Carbon fluxes in mature peach leaves. Plant Physiol 100: 1878–1884. [DOI] [PMC free article] [PubMed] [Google Scholar]
- 19. Fu J, Huang B, Fry J (2010) Osmotic potential, sucrose level, and activity of sucrose metabolic enzymes in tall fescue in response to deficit irrigation. J Amer Soc Hort Sci 135: 506–510. [Google Scholar]
- 20. Jang JC, Leon P, Zhou L, Sheen J (1997) Hexokinase as a sugar sensor in higher plants. Plant Cell 9: 5–19. [DOI] [PMC free article] [PubMed] [Google Scholar]
- 21. Koch K (2004) Sucrose metabolism: regulatory mechanisms and pivotal roles in sugar sensing and plant development. Curr Opin Plant Biol 7: 235–246. [DOI] [PubMed] [Google Scholar]
- 22. Koch KE, Nolte KD, Duke ER, McCarty DR, Avigne WT (1992) Sugar levels modulate differential expression of maize sucrose synthase genes. Plant Cell 4: 59–69. [DOI] [PMC free article] [PubMed] [Google Scholar]
- 23. Bläsing OE, Gibon Y, Günther M, Höhne M, Morcuende R, et al. (2005) Sugars and circadian regulation make major contributions to the global regulation of diurnal gene expression in Arabidopsis . Plant Cell 17: 3257–3281. [DOI] [PMC free article] [PubMed] [Google Scholar]
- 24. Rolland F, Baena-Gonzalez E, Sheen J (2006) Sugar sensing and signaling in plants: conserved and novel mechanisms. Annu Rev Plant Biol 57: 675–709. [DOI] [PubMed] [Google Scholar]
- 25. Prado FE, Boero C, Gallardo M, Gonzalez JA (2000) Effect of NaCl on germination, growth, and soluble sugar content in Chenopodium quinoa Willd. seeds. Bot Bull Acad Sinica 41: 27–34. [Google Scholar]
- 26. Thomas R (1999) Source-sink regulation by sugar and stress. Curr Opin Plant Biol 2: 198–206. [DOI] [PubMed] [Google Scholar]
- 27. Smeekens S (2000) Sugar-induced signal transduction in plants. Annu Rev Plant Biol 51: 49–81. [DOI] [PubMed] [Google Scholar]
- 28. Liu H, Wang Q, Yu M, Zhang Y, Wu Y, et al. (2008) Transgenic salt-tolerant sugar beet (Beta vulgaris L.) constitutively expressing an Arabidopsis thaliana vacuolar Na+/H+ antiporter gene, AtNHX3, accumulates more soluble sugar but less salt in storage roots. Plant Cell Environ 31: 1325–1334. [DOI] [PubMed] [Google Scholar]
- 29. Amiard V, Morvan-Bertrand A, Billard JP, Huault C, Keller F, et al. (2003) Fructans, but not the sucrosy-galactosides, raffinose and loliose, are affected by drought stress in perennial ryegrass. Plant Physiol 132: 2218–2229. [DOI] [PMC free article] [PubMed] [Google Scholar]
- 30. Xiong Y, Fei S, Arora R, Brummer E, Barker R, et al. (2007) Identification of quantitative trait loci controlling winter hardiness in an annual perennial ryegrass interspecific hybrid population. Mol Breeding 19: 125–136. [Google Scholar]
- 31. Marcar N (1987) Salt tolerance in the genus Lolium (ryegrass) during germination and growth. Aust J Agric Res 38: 297–307. [Google Scholar]
- 32. Nizam I (2011) Effects of salinity stress on water uptake, germination and early seedling growth of perennial ryegrass. Afr J Biotechnol 10: 10418–10424. [Google Scholar]
- 33. Wu W, Zheng Y, Chen L, Wei Y, Yang R, et al. (2005) Evaluation of genetic relationships in the genus Thunb. in China based on RAPD and ISSR markers. Biochem Syst Ecol 33: 1141–1157. [Google Scholar]
- 34. Hu T, Li H, Zhang X, Luo H, Fu J (2011) Toxic effect of NaCl on ion metabolism, antioxidative enzymes and gene expression of perennial ryegrass. Ecotox Environ Safe 74: 2050–2056. [DOI] [PubMed] [Google Scholar]
- 35.Hoagland DR, Arnon DI (1950) The water-culture method for growing plants without soil. Circular. Circular. Calif Agric Exp Circ 247.
- 36.Turgeon A (2002) Turfgrass Management 8th end, Prentice Hall, Englewood Cliffs, NJ.
- 37.Larcher W (2003) Physiological Plant Ecology, 4th edn. Springer, Berlin.
- 38. Gutiérrez D, Gutiérrez E, Pérez P, Morcuende R, Verdejo AL, et al. (2009) Acclimation to future atmospheric CO2 levels increases photochemical efficiency and mitigates photochemistry inhibition by warm temperatures in wheat under field chambers. Physiol Plant 137: 86–100. [DOI] [PubMed] [Google Scholar]
- 39. Morvan-Bertrand A, Boucaud J, Le Saos J, Prudhomme MP (2001) Roles of the fructans from leaf sheaths and from the elongating leaf bases in the regrowth following defoliation of Lolium perenne L. Planta. 213: 109–120. [DOI] [PubMed] [Google Scholar]
- 40. Ball M (1988) Salinity Tolerance in the mangroves aegiceras corniculatum and Avicennia marina. I. Water use in relation to growth, carbon partitioning, and salt balance. Funct Plant Biol 15: 447–464. [Google Scholar]
- 41. Takemura T, Hanagata N, Sugihara K, Baba S, Karube I, et al. (2000) Physiological and biochemical responses to salt stress in the mangrove, Bruguiera gymnorrhiza. Aquat Bot 68: 15–28. [Google Scholar]
- 42. Neves-Piestun BG, Bernstein N (2001) Salinity-induced inhibition of leaf elongation in maize is not mediated by changes in cell wall acidification capacity. Plant Physiol 125: 1419–1428. [DOI] [PMC free article] [PubMed] [Google Scholar]
- 43. Chaves MM, Flexas J, Pinheiro C (2009) Photosynthesis under drought and salt stress: regulation mechanisms from whole plant to cell. Ann Bot 103: 551–560. [DOI] [PMC free article] [PubMed] [Google Scholar]
- 44. Green PB (1968) Growth physics in Nitella: a method for continuous in vivo analysis of extensibility based on a micro-manometer technique for turgor pressure. Plant Physiol 43: 1169–1184. [DOI] [PMC free article] [PubMed] [Google Scholar]
- 45. Munns R, Termaat A (1986) Whole-plant responses to salinity. Funct Plant Biol 13: 143–160. [Google Scholar]
- 46. Hasegawa PM, Bressan RA, Zhu JK, Bohnert HJ (2000) Plant cellular and molecular responses to high salinity. Annu Rev Plant Biol 51: 463–499. [DOI] [PubMed] [Google Scholar]
- 47. Niu X, Bressan RA, Hasegawa PM, Pardo JM (1995) Ion homeostasis in NaCl stress environments. Plant Physiol 109: 735–742. [DOI] [PMC free article] [PubMed] [Google Scholar]
- 48. Burchett M, Clarke C, Field C, Pulkownik A (1989) Growth and respiration in two mangrove species at a range of salinities. Plant Physiol 75: 299–303. [Google Scholar]
- 49. Ye Y, Tam NFY, Lu CY, Wong YS (2005) Effects of salinity on germination, seedling growth and physiology of three salt-secreting mangrove species. Aquati Bot 83: 193–205. [Google Scholar]
- 50. Debez A, Ben Hamed K, Grignon C, Abdelly C (2004) Salinity effects on germination, growth, and seed production of the halophyte Cakile maritima. Plant Soil 262: 179–189. [Google Scholar]
- 51. Trapp S, Ciucani G, Sismilich M (2004) Toxicity of tributyltin to willow trees. Environ Sci Pollut R 11: 327–330. [DOI] [PubMed] [Google Scholar]
- 52. Yu XZ, Gu JD, Li L (2008) Assimilation and physiological effects of ferrocyanide on weeping willows. Ecotox Environ Safe 71: 609–615. [DOI] [PubMed] [Google Scholar]
- 53. Moya JL, Gómez-Cadenas A, Primo-Millo E, Talon M (2003) Chloride absorption in salt-sensitive Carrizo citrange and salt-tolerant Cleopatra mandarin citrus rootstocks is linked to water use. J Exp Bot 54: 825–833. [DOI] [PubMed] [Google Scholar]
- 54. Storey R (1995) Salt tolerance, ion relations and the effect of root medium on the response of citrus to salinity. Funct Plant Biol 22: 101–114. [Google Scholar]
- 55. Lutts S, Kinet J, Bouharmont J (1996) Effects of salt stress on growth, mineral nutrition and proline accumulation in relation to osmotic adjustment in rice (Oryza sativa L.) cultivars differing in salinity resistance. Plant Growth Regul 19: 207–218. [Google Scholar]
- 56. Else MA, Davies WJ, Malone M, Jackson MB (1995) A negative hydraulic message from oxygen-deficient roots of tomato plants? (Influence of soil flooding on leaf water potential, leaf expansion, and synchrony between stomatal conductance and root hydraulic conductivity. Plant Physiol 109: 1017–1024. [DOI] [PMC free article] [PubMed] [Google Scholar]
- 57. Allakhverdiev SI, Murata N (2008) Salt stress inhibits photosystems II and I in cyanobacteria. Photosynth Res 98: 529–539. [DOI] [PubMed] [Google Scholar]
- 58. Smillie RM, Nott R (1982) Salt tolerance in crop plants monitored by chlorophyll fluorescence in Vivo. Plant Physiol 70: 1049–1054. [DOI] [PMC free article] [PubMed] [Google Scholar]
- 59. Zhang T, Gong H, Wen X, Lu C (2010) Salt stress induces a decrease in excitation energy transfer from phycobilisomes to photosystem II but an increase to photosystem I in the cyanobacterium Spirulina platensis. J Plant Physiol 167: 951–958. [DOI] [PubMed] [Google Scholar]
- 60. Morales F, Abadía A, Gómez-Aparisi J, Abadía J (1992) Effects of combined NaCl and CaCl2 salinity on photosynthetic parameters of barley grown in nutrient solution. Physiol Plant 86: 419–426. [Google Scholar]
- 61. Lu C, Vonshak A (1999) Characterization of PSII photochemistry in salt-adapted cells of cyanobacterium Spirulina platensis. New Phytol 141: 231–239. [DOI] [PubMed] [Google Scholar]
- 62. Parida A, Das A, Mittra B (2003) Effects of NaCl stress on the structure, pigment complex composition, and photosynthetic activity of mangrove Bruguiera parviflora chloroplasts. Photosynthetica 41: 191–200. [Google Scholar]
- 63. Sudhir P, Pogoryelov D, Kovacs L, Garab G, Murthy SDS (2005) The effects of salt stress on photosynthetic electron transport and thylakoid membrane proteins in the cyanobacterium Spirulina platensis. J Biochem Mol Biol 38: 481–485. [DOI] [PubMed] [Google Scholar]
- 64. Flexas J, Diaz-Espejo A, GalmÉS J, Kaldenhoff R, Medrano H, et al. (2007) Rapid variations of mesophyll conductance in response to changes in CO2 concentration around leaves. Plant Cell Environ 30: 1284–1298. [DOI] [PubMed] [Google Scholar]
- 65. de Maria Felix J, Papini-Terzi F, Rocha F, Vêncio R, Vicentini R, et al. (2009) Expression profile of signal transduction components in a sugarcane population segregating for sugar content. Tropical. Plant Biol 2: 98–109. [Google Scholar]
- 66. Pollock C, Farrar J, Tomos D, Gallagher J, Lu C, et al. (2003) Balancing supply and demand: the spatial regulation of carbon metabolism in grass and cereal leaves. J Exp Bot 54: 489–494. [DOI] [PubMed] [Google Scholar]
- 67. Goldschmidt EE, Huber SC (1992) Regulation of photosynthesis by end-product accumulation in leaves of plants storing starch, sucrose, and hexose sugars. Plant Physiol 99: 1443–1448. [DOI] [PMC free article] [PubMed] [Google Scholar]
- 68. Munns R, Tester M (2008) Mechanisms of salinity tolerance. Annu Rev Plant Biol 59: 651–681. [DOI] [PubMed] [Google Scholar]
- 69. Farrar J, Pollock C, Gallagher J (2000) Sucrose and the integration of metabolism in vascular plants. Plant Sci 154: 1–11. [DOI] [PubMed] [Google Scholar]
- 70. Griffin KL, Seemann JR (1996) Plants, CO2 and photosynthesis in the 21st century. Chem Biol 3: 245–254. [DOI] [PubMed] [Google Scholar]
- 71. Smeekens S, Rook F (1997) Sugar sensing and sugar-mediated signal transduction in plants. Plant Physiol 115: 7–13. [DOI] [PMC free article] [PubMed] [Google Scholar]
- 72. Macías-Rodríguez L, Quero E, López MG (2002) Carbohydrate Differences in Strawberry Crowns and Fruit (Fragaria×ananassa) during plant development. J Agr Food Chem 50: 3317–3321. [DOI] [PubMed] [Google Scholar]
- 73. Savitch L, Leonardos E, Krol M, Jansson S, Grodzinski B, et al. (2002) Two different strategies for light utilization in photosynthesis in relation to growth and cold acclimation. Plant Cell Environ 25: 761–771. [Google Scholar]
- 74. Pego JV, Kortstee AJ, Huijser C, Smeekens SCM (2000) Photosynthesis, sugars and the regulation of gene expression. J Exp Bot 51: 407–416. [DOI] [PubMed] [Google Scholar]
- 75. Han S, Tang N, Jiang HX, Yang LT, Li Y, et al. (2009) CO2 assimilation, photosystem II photochemistry, carbohydrate metabolism and antioxidant system of citrus leaves in response to boron stress. Plant Sci 176: 143–153. [Google Scholar]
- 76. Foyer C, Furbank R, Harbinson J, Horton P (1990) The mechanisms contributing to photosynthetic control of electron transport by carbon assimilation in leaves. Photosynth Res 25: 83–100. [DOI] [PubMed] [Google Scholar]
- 77. Ho SL, Chao YC, Tong WF, Yu SM (2001) Sugar coordinately and differentially regulates growth- and stress-related gene expression via a complex signal transduction network and multiple control mechanisms. Plant Physiol 125: 877–890. [DOI] [PMC free article] [PubMed] [Google Scholar]
- 78. Wei JZ, Chatterton NJ (2001) Fructan biosynthesis and fructosyltransferase evolution: Expression of the 6-SFT (sucrose : fructan 6-fructosyltransferase) gene in crested wheatgrass (Agropyron cristatum). J Plant Physiol 158: 1203–1213. [Google Scholar]
- 79.Ramon M, Rolland F, Sheen J (2008) Sugar sensing and signaling. In The Arabidopsis Book. Rockville: American Society of Plant Biologists. [DOI] [PMC free article] [PubMed]
- 80. Duchateau N, Bortlik K, Simmen U, Wiemken A, Bancal P (1995) Sucrose: fructan 6-fructosyltransferase, a key enzyme for diverting carbon from sucrose to fructan in barley leaves. Plant Physiol 107: 1249–1255. [DOI] [PMC free article] [PubMed] [Google Scholar]
- 81. Sprenger N, Bortlik K, Brandt A, Boller T, Wiemken A (1995) Purification, cloning, and functional expression of sucrose: fructan 6-fructosyltransferase, a key enzyme of fructan synthesis in barley. PNAS 92: 11652–11656. [DOI] [PMC free article] [PubMed] [Google Scholar]
- 82. Lee JM, Roche JR, Donaghy DJ, Thrush A, Sathish P (2010) Validation of reference genes for quantitative RT-PCR studies of gene expression in perennial ryegrass (Lolium perenne L.). BMC Mol Biol 11: 8–22. [DOI] [PMC free article] [PubMed] [Google Scholar]