

Abstract
After cortical injury resulting from stroke, some recovery can occur and may involve spared areas of the cerebral cortex reorganizing to assume functions previously controlled by the damaged cortical areas. No studies have specifically assessed gene expression changes in remote neurons with axonal processes that terminate in the infarcted tissue, i.e., the subset of neurons most likely to be involved in regenerative processes. By physiologically identifying the primary motor area controlling forelimb function in adult rats (caudal forelimb area = CFA), and injecting a retrograde tract-tracer, we labeled neurons within the non-primary motor cortex (rostral forelimb area = RFA) that project to CFA. Then, 7 days after a CFA infarct (n = 6), we used laser capture microdissection techniques to harvest labeled neurons in RFA. Healthy, uninjured rats served as controls (n = 6). Biological interactions and functions of gene profiling were investigated by Affymetrix Microarray, and Ingenuity Pathway Analysis. A total of 143 up- and 128 down-regulated genes showed significant changes (fold change ≥1.3 and p <0.05). The canonical pathway, “Axonal Guidance Signaling,” was overrepresented (p value = 0.002). Significantly overrepresented functions included: branching of neurites, organization of cytoskeleton, dendritic growth and branching, organization of cytoplasm, guidance of neurites, development of cellular protrusions, density of dendritic spines, and shape change (p = 0.000151–0.0487). As previous studies have shown that spared motor areas are important in recovery following injury to the primary motor area, the results suggest that these gene expression changes in remote, interconnected neurons may underlie reorganization and recovery mechanisms.
Keywords: Stroke, Ischemic infarct, Motor cortex, Plasticity, Gene expression
Introduction
Stroke affects 795,000 individuals in the US, and over 15 million individuals worldwide each year, making stroke one of the major causes of adult disability [1, 2]. Some recovery can occur and may be related to plasticity in spared areas of the brain, presumably to assume functions that were previously controlled by the destroyed areas, a process known as vicariation. Evidence for functional plasticity in spared cortical areas has been found in peri-infarct cortex in both sensory and motor cortex in humans [3], monkeys [4, 5], and rodents [6, 7]. It is widely recognized that plasticity in spared brain areas is correlated with behavioral improvement after cortical infarct, but the underlying mechanisms are still unclear [8].
Gene expression changes have been reported in tissue homogenate and sprouting neurons within the peri-infarct region [9, 10]. A cortical infarct induces sequential waves of growth-inhibitory and growth-promoting genes associated with neuron-, glia- and extracellular matrix-associated molecules over a period lasting at least a month [6]. This pattern involves decreases in some inhibitory molecules, and increases in growth-associated genes suggested to support the anatomical reorganization [11]. Thus, peri-infarct tissue is likely to be a locus for regenerative processes, and it is now clear that neurophysiological reorganization in peri-infarct cortex is directly related to behavioral recovery [12].
While most studies of gene expression changes after ischemic injury have focused on the peri-infarct cortex, it is now known that neurophysiological and neuroanatomical plasticity occurs in many regions of the cortex that are spared by the ischemic injury, but remote from it. In particular, intact cortical areas that are functionally related to the area of injury, and anatomically connected to it via axonal connections, are altered. For example, after motor cortex injury in the rat, the motor cortex in the spared hemisphere undergoes a time-dependent process of dendritic arborization and synaptogenesis [13]. Gene expression studies in the contralateral (intact) hemisphere have been limited to a single study of tissue homogenates and neurons connected to spinal cord (not the cortical lesion) [14, 15]. These studies demonstrated molecular changes that were suggested to be supportive of anatomical reorganization.
It has also been suggested that functionally related areas that are spared by the ischemic injury within the injured hemisphere and that have anatomical connections with the injury zone also undergo neurophysiological and anatomical plasticity. For example, after injury to motor cortex, premotor cortex, although remote from the direct damage of the ischemic infarct and penumbra, can also undergo neuroanatomical and neurophysiological plasticity. In human stroke survivors, finger movements of the impaired limb are associated with increased blood flow in premotor areas [16]. Further, after an infarct in primary motor cortex in non-human primates, the ventral premotor cortex (PMv), an area whose principal output target is the primary motor cortex, undergoes neurophysiological reorganization that is correlated with behavioral recovery [5]. The PMv also undergoes neuroanatomical reorganization, sending new axonal terminations into the parietal cortex [17]. In addition, neurons in PMv undergo molecular changes as demonstrated by immunohistochemical studies [18, 19]. In both mice and rats, anatomical reorganization in spared areas distant from the lesion has been well documented [10, 15]. There is indirect evidence that functional recovery may be mediated by plasticity in spared areas, since treatments that increase sprouting improve behavioral outcomes [15, 20].
Though functionally related and neuroanatomically interconnected areas likely play a role in recovery of function, little is known about the concomitant molecular program that occurs in spared, remote, neuronal populations that may trigger and orchestrate axonal sprouting and neurophysiological reorganization. The present study is unique in that it selectively identifies and characterizes the gene expression changes in neurons that send axonal connections to a focal infarct core in a remote area of cortex. We have developed a model of ischemic injury in rats that specifically targets the primary motor cortex, sparing the premotor cortex that normally has reciprocal connections with primary motor cortex [21]. In rodents, the homolog of the primate primary motor cortex is the caudal forelimb area (CFA), while the premotor equivalent is the rostral forelimb area (RFA). RFA is important for recovery, as secondary lesions to the RFA after CFA lesions reinstate behavioral deficits after recovery [22].
The goals of the present study were accomplished by physiologically identifying the forelimb representation in the CFA of adult rats, then labeling neuronal somata projecting to the CFA by injection of a retrograde tracer, next creating an ischemic lesion in the CFA, then finally, harvesting labeled neurons within the RFA 7 days after the infarct using laser capture microdissection. The 7-day post-infarct time point represents the onset of an “initiation phase”, in which growth-promoting molecules are thought to be initially increased [9]. Gene expression patterns were then determined using Affymetrix Microarray analysis. Ingenuity Pathway Analysis software was used to further understand the biological significance. The resulting expression changes are consistent with the hypothesis that neurons in the RFA undergo neuroanatomical reorganization by involvement of specific genes associated with axonal growth, and guidance. These data help to elucidate the genetic response to infarct in interconnected neurons, and may eventually provide potential targets for regenerative therapy.
Materials and methods
Subjects
Long-Evans hooded rats (n = 14; 270–470 g; 3–6 months of age; Harlan, Indianapolis, IN) were singly housed in a temperature-controlled room on a 12 h:12 h light:dark cycle, with ad libitum access to food and water. Animal use was approved by the Institutional Animal Care and Use Committee of the University of Kansas Medical Center. Animals were randomly assigned to lesion (n = 7) and control (n = 7) groups.
Surgical procedure I: neurophysiological identification of CFA and retrograde tracer injection
Surgical preparation
After sedation with isoflurane, each rat was anesthetized with ketamine (100–80 mg/kg IP) and xylazine (30 mg/kg IM). The rat was placed in a stereotaxic frame, a local anesthetic (Bupivacaine, 2.5 mg) was applied to the scalp, the scalp was incised and reflected, muscles attached to the temporal ridge and occipital ridge were released, the dura overlying the cisterna magna incised to relieve cerebrospinal fluid pressure, and a craniotomy performed using a hand drill with a burr bit from +5 to −4 mm relative to bregma and from 1-mm lateral of the sagittal suture to the temporal ridge. Anesthesia was maintained with supplemental doses of ketamine (20 mg/kg IM), as needed, and temperature held constant with a homeothermic blanket system at physiological normal. Core temperature was monitored with a rectal probe. The dura was reflected and warm, sterile silicone oil was applied to the craniotomy to aid in visualization and to prevent desiccation of the cortex.
Neurophysiological mapping procedure
The CFA was identified in each animal by intracortical microstimulation (ICMS) mapping techniques as described in previous publications [23]. A magnified digital image of the cortical surface vasculature was obtained and a grid pattern (250 μm) overlaid with image processing software (Canvas, Deneba Software, Miami, FL). The microelectrode, a tapered and beveled glass micropipette (20 μm outside diameter at the tip) filled with concentrated NaCl solution (3.5 M), was advanced perpendicular to the cortical surface (1,725 μm subpial depth) with the aid of a hydraulic microdrive (650 Micropositioner, David Kopf Instruments, Tujunga, CA) at sites corresponding to every other grid intersection (500 μm resolution), or when necessary, every grid intersection (250 μm resolution), to accurately delineate the CFA/RFA boarder. The stimulus consisted of a 40-ms duration train of 13 monophasic cathodal pulses (200 μs duration) at 350 Hz delivered one per second from an electrically isolated, charge-balanced, constant-current stimulation circuit (BSI-2, Bak Electronics Inc, Mount Airy, MD). The current was increased from 0 to 80μA until a movement was just visible from at least 50 % of the train bursts, then movement type and minimum current required to evoke the movement were recorded. The site was recorded as “nonresponsive” if no movement was elicited before reaching the maximum current level (80 μA). The 500-μm resolution grid used in these experiments was adequate to delineate the borders of the CFA for defining the location for the tracer injection and the extent of the intended lesion (see “Surgical procedure II: cortical infarct”).
Retrograde tracer injection
After delineating the CFA borders, the rostral half of CFA was injected with a retrograde neuronal tracer, cholera toxin beta subunit conjugated to AlexaFluor 647 (CTB-647, 5 μg/μL in 0.9 % sterile saline, C34778, Invitrogen, Grand Island, NY). CTB647 leaves a residual blue mark on the cortical surface that is identifiable upon reopening. Preliminary experiments determined that the synaptic terminal field from RFA was most dense in this subregion (unpublished observations and see [21]). The tracer was delivered by pressure injection from a tapered glass micropipette (70 μm outside diameter) secured with wax to a 1-μL Hamilton syringe (80100, Hamilton Company, Reno, NV). The syringe plunger was actuated by a microinjector (Micro4, World Precision Instruments, Sarasota, FL) clamped to a hydraulic microdrive on a stereotaxic arm. Each animal received injections at two sites 1 mm apart within the CFA. At each site, 75 nL (5 nL/s) of tracer was injected at each of two depths (1,500 and 1,250 μm below the pial surface), for a total of 150 nL at each site.
Surgical closing and recovery
Following the procedures described above, the craniotomy was rinsed with sterile physiological saline. A silicone sheet was placed over the craniotomy followed by gel-foam and dental acrylic to form a protective cap. The scalp was sutured, followed by Bupivacaine (2.5 mg, topical), and Vetropolylycine gel (topical antibiotic). Animals were monitored until alert and active, and then returned to their home cage.
Surgical procedure II: cortical infarct
Animals in the lesion group underwent a second surgical procedure 14 days after Surgical Procedure I (ICMS and tracer injection). The 14-day interval allowed sufficient time for the tracer to be retrogradely transported to the parent somata in RFA, where it remains for later identification. Animals in the control group did not undergo a second procedure. General surgical procedures discussed above were followed, except that the cortex was re-exposed by removing the protective cap from the first procedure without the need for further craniotomy. After re-exposing the cortex, a tapered glass micropipette (160 μm outside diameter) was secured with wax to a 2-μL Hamilton syringe filled with the vasoconstrictor, endothelin-1 (ET-1, 0.33 mg/mL 0.9 % sterile saline, H-6995, Bachem Americas, Inc, Torrance, CA), and attached to a microinjector clamped to a microdrive on a stereotaxic arm. The residual blue mark of the tracer injections (visible on the cortex) and blood vessel patterns photographed from Procedure I were used to guide injection placement. The majority of the CFA representation was targeted for ischemic injury. The size of the CFA determined the number of ET-1 injection sites (2–5). The micropipette tip was lowered to 1,500 μm below the pial surface, perpendicular to the cortex. At each injection site, ET-1 was delivered at 5 nL/s in three 110 nL boluses with a 1-min delay between boluses, and a 5-min delay before tip extraction. During the injections and delay times, the craniotomy was flushed constantly with sterile saline to prevent non-specific spread of ET-1. At the conclusion of the ET-1 injections, rats underwent the Surgical closing and recovery procedure described above.
Tissue harvest and laser capture microdissection (LCM)
Seven days after Surgical Procedure II (or an equivalent time period in control rats), rats were anesthetized with isoflurane and ketamine (45 mg IP), then decapitated by guillotine in accordance with American Veterinary Medicine Association Guidelines on Euthanasia. The brain was extracted and flash frozen for 30 s in heptane (on dry ice for 5 min) and stored in a −80 °C freezer until sectioning. After a 30-min equilibration time, brains were sectioned in the coronal plane on a cryostat at 14 μm. Sections were cut rostral to caudal beginning at the rostral pole until the tracer injection cores in the CFA were contacted. At 7 days post-lesion the CTB647 injection cores were still visible to the unaided eye within the translucent lesion of lesion animals, or opaque tissue of the control animals. Then, after a series of seven sections were cut, four sections were thaw mounted to charged slides and three sections discarded. Four sections per slide proved to be the optimal number of sections for LCM collection (Arcturus Veritas, Applied Biosystems, Carlsbad, CA). In lesion animals, in order to obtain an accurate measure of the lesion volume, two serial sections were taken at 504-μm intervals (every 36 sections) throughout the extent of the lesion. Slides were returned to dry ice within 20 s of thaw mounting to preserve Ribonucleic acid (RNA) integrity, and stored in a −80 °C freezer until the LCM procedure.
Given the time-dependent nature of RNA degradation, only one slide at a time was processed for LCM. Each slide at the level of the RFA was removed from dry ice and dehydrated by an increasing alcohol gradient and xylenes for clearing. The procedure was slightly modified from protocols available from Arcturus (Applied Biosystems). Briefly, each slide was exposed to 75 % ethanol (30 s), water (30 s), 75 % ethanol (30 s), 95 % ethanol (30 s), 100 % ethanol (2 × 2 min), and xylene (5 min). The slide was placed in the LCM along with Macro collection caps (Arcturus, Applied Biosystems). Sections were viewed under fluorescent illumination to identify retrogradely labeled somata at the level of the RFA [21, 23]. After test firing, the infrared laser settings were adjusted to produce a collection spot of 32 μm in diameter. Standard laser settings were used, but power varied from 35 to 90 mW, as needed, to produce a collection spot of 30 μm. Within 2 h of dehydration, 100–500 cells were collected per cap to prevent overloading. The cap was inserted into a micro-centrifuge tube and exposed to PicoPure RNA extraction buffer (30 min at 42 °C, Arcturus, Applied Biosystems). This process was repeated with as many slides as was necessary until 28 ng of purified RNA (~1,900 cells) was collected from each animal. Extracted RNA was stored at −80 °C until RNA isolation.
RNA sample preparation and Affymetrix Microarray procedures
A PicoPure (Arcturus, Applied Biosystems) on-column RNA isolation kit was used per manufacturer’s instructions, along with the DNase I (Qiagen, Valencia, CA) treatment to eliminate DNA contamination, and RNA quality was assessed by Agilent 2100 Bioanalyzer with a RNA 6000 Pico LabChip kit (Agilent Technologies, Santa Clara, CA). Only samples with RNA Integrity Numbers (RINs) of 7 or above were considered of acceptable quality for microarray assay. RIN is calculated with a proprietary algorithm (www.chem.agilent.com), which takes into account the entire electrophoretic trace of the Pico LabChip. Total RNA (~28 ng, 1,500 cells) from each animal was amplified twice according to Affymetrix Small Sample Labeling protocol: reverse transcription with Superscript II (SuperScript Choice System, Invitrogen), in vitro transcription (IVT) with MEGAscript T7 kit (Ambion, Invitrogen) including T7(dT)24 primer (5′-GGCCAGT GAATTGTAATACGACTCACTATAGGGAGGCGGTT TTTTTTTTTTTTTTTTTTTTTT-3′) for 1st and random primers for 2nd round IVT, cDNA cleanup through ethanol precipitation, cRNA cleanup with Qiagen RNeasy columns, and GeneChip Expression 3′-Amplification IVT Labeling kit (Affymetrix, Santa Clara, CA) for the last round of IVT and biotin labeling. Biotinylated-cRNA was fragmented (buffer: 200 mM Tris–Acetate, pH 8.1, 500 mM potassium acetate, 150 mM magnesium acetate), and average fragment length was assessed by RNA 6000 Nano LabChip kit (Agilent). Affymetrix GeneChip Rat Genome 230 2.0 Arrays (Affymetrix Cat. No.: 900506) were hybridized, washed and stained using GeneChip Fluidics Station 450 (Affymetrix) under the Standard Array Format. The automated scanning process (Affymetrix GeneChip Scanner 3000 7G with autoloader) completed one scan for each array using standard settings for pixel value (3 μm), and wavelength (570 nm). Absolute and comparison analysis was performed with the target signal scaled to 500 with a normalization factor of 1 (no normalization).
Microarray data and gene pathway analysis
Probe intensities from microarrays were background corrected, quantile normalized and summarized using Robust Multi-array Averaging (RMA, Partek Genomic Suite 6.4, Partek Incorporated, St Louis, MO) [24]. The resulting log (base2) transformed intensity values were used for quality control and further analysis. Probe-level fold changes were obtained by taking the exponentiation of the linear contrast between the least square means of the 7-day control and 7-day lesion samples. The significance of these fold changes was calculated using a two-way mixed model ANOVA. Apart from the treatment effect; the day each array was hybridized was included as a random effect in the ANOVA model.
Interaction networks, functions, and canonical pathways were developed using Ingenuity Pathway Analysis (IPA, version 7.6, Ingenuity Systems, Redwood City, CA), an online software that uses a curated database of genes, proteins, chemicals, drugs, and molecular relationships to build biological models. The significance of the interaction networks, functions, and canonical pathways were determined by the right-tailed Fisher’s Exact test which measures the significance of the number of genes common to both the input gene set and the particular network, function, or canonical pathway. The significance p values of networks were adjusted for multiple hypotheses testing using the Benjamani-Hochberg correction procedure.
Lesion volume estimation
At 504-μm intervals during “Tissue Harvest,” described above, two coronal sections (14 μm) were thaw mounted to charged slides for lesion volume estimation (see “Tissue harvest and laser capture microdissection”). The following procedure occurred on slides with a hydrophobic barrier created by PAP pen (SuperHT, Research Products International Corp., Mount Prospect, IL). After washing in tris-buffered saline (TBS), sections were incubated overnight at 4 °C, and slowly agitated in 0.05 M TBS containing 5 % Donor Goat Serum (Equitech-Bio, Inc, Kerrville, TX), 0.4 % Triton X-100, and 1:1,000 dilution of biotinylated mouse monoclonal anti-Neuronal Nuclei (NeuN) antibody (MAB377B, Chemicon, Temecula, CA). Sections were rinsed in 0.05 M TBS, incubated for 3 h at room temperature in Avidin–Biotin Complex solution (ABC, PK-6100, Vector Laboratories, Burlingame, CA), rinsed in 0.05 M TBS, and incubated in Vector SG Substrate Solution (SK-4700, Vector Laboratories) until visually acceptable background was evident (2–7 min). Sections were rinsed in 0.05 M TBS, then dried, dehydrated, and coverslipped with DPX mounting medium (Sigma-Aldrich, St Louis, MO). An Axioplan 2 microscope (Zeiss, Thornwood, NY) was used with Stereo Investigator software (Microbrightfield, Williston, VT) and Cavalieri probe to estimate the lesion size in four animals’ cortical areas (dorsal to the corpus callosum on coronal sections) containing presumed neurons (NeuN-positive cells) were selected as normal tissue, while cortical areas containing light or no NeuN staining were selected as infarcted tissue. Although the lesion was complete at 7 days post-infarct, the cortical tissue was not cavitated, allowing for the lesion to be traced and calculated directly. Every 36th section (504 μm apart) was analyzed and only sections with a visible lesion were included in the probe. Lesion area from each section was multiplied by section thickness and distance between sections to calculate the lesion volume. Mean and standard error of the mean for lesion volume were calculated for four animals (SPSS, IBM, Armonk, NY).
Results
Description of lesion
Based on ICMS results (Fig. 1c), the CFA was found in a location similar to that of previous reports [21]. The lesion was similar in size compared with previous results using identical Endothelin-1 infarct procedures [25]. The ET-1 injections resulted in a continuous area of neuronal death, as judged by NeuN staining, and extended through all six cortical layers throughout the CFA. There was no evidence of damage to the corpus callosum or underlying subcortical structures. As expected, no cavitation was observed at this 7-day post-lesion time point, so lesion volume was calculated directly by measuring the area of the lesion on coronal sections at 500-μm intervals and multiplying by the section thickness and section interval (Cavalieri Probe, Microbrightfield). The lesion volume was 12 mm3 ± 1.7 mm3 (mean ± SEM; n = 4 brains available for lesion volume estimation). Fourteen animals received surgical procedures. Of these, one control animal was found to have cortical damage and one lesion animal was found to have subcortical damage, and were excluded from the study.
Fig. 1.
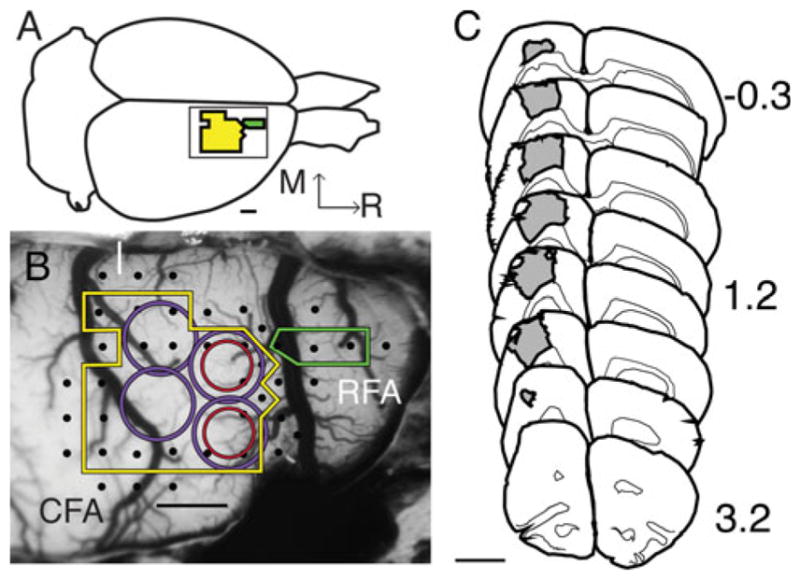
Physiological identification of cortical areas and lesion volume. a Illustration of the rat brain labeled with CFA (yellow) and RFA (green). Inset shows same area as b. Bar is 1 mm. b Photomicrograph of exposed rat cortex taken through surgical microscope optics (×18 magnification) and overlaid with a 250 × 250 μm grid (grid is removed for clarity) in image processing software (Canvas; ACDSee, Victoria, British Columbia, Canada). The ICMS electrode was inserted at grid intersections, stimulation elicited movements (black dots) of the forelimb, and non-forelimb defined the borders of CFA (yellow line) and caudal portion of RFA (green line), and allow for accurate placement of CTB647 (red circle). Blood vessel patterns, ICMS data recorded on the surgical photograph and visible blue of dye core guided placement of ET-1 injection (purple circle) 2 weeks after ICMS/tracer procedure, completely overlapping the CTB647 injection. Medial (M) and rostral (R) directions are the same in a, b. Bar is 1 mm. c Coronal section tracing series (drawn at ×5 magnification) of lesion size and location (gray). Lesion volume per ET-1 injection (12 ± 1.7 mm3 SEM) was determined using Stereoinvestigator (Microbrightfield) on coronal sections labeled with biotinylated NeuN immunohistochemistry, numbers represent section distance from Bregma (Paxinos and Watson [78]). Bar is 3 mm
Neuronal harvesting
In vivo labeling of neurons with CTB647 allowed for identification of neuronal somata that terminated in the infarcted area, as described in “Materials and methods”. Approximately 1,900 somata per animal were targeted for collection during the LCM procedure (Fig. 2a–d)
Fig. 2.
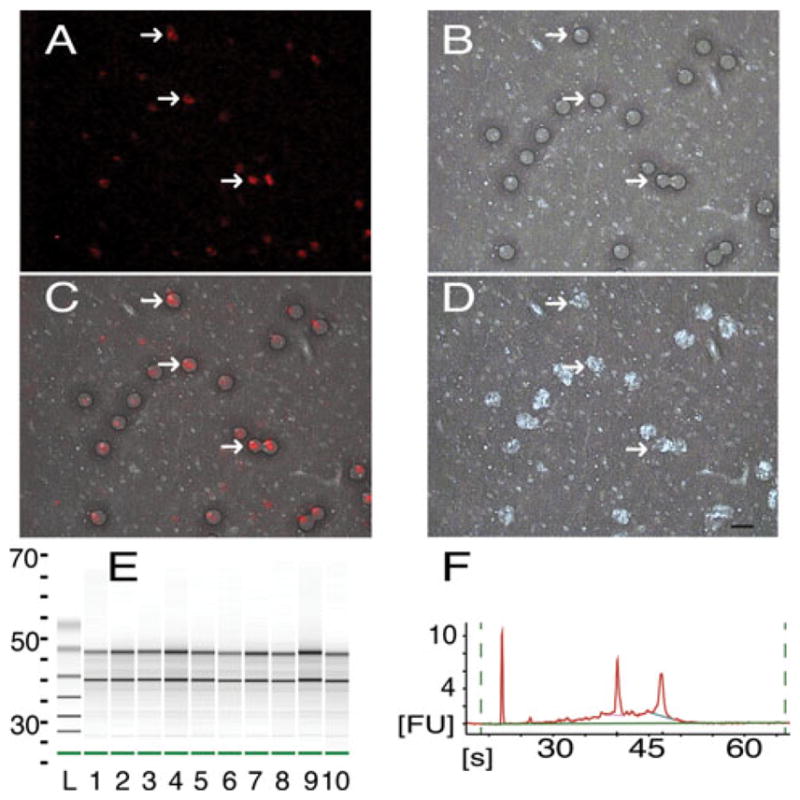
LCM collection and RNA quality verification. a Cortical neurons (red), retrogradely labeled in vivo with CTB647 during the 1st procedure, viewed through the LCM optics at ×40 magnification (same for a–d). White arrows point to the same neurons in a–d. b Brightfield illumination of the same section as a after laser fire showing wetted spots (dark circles) of photoreactive polymer. c Overlap of a and b showing accuracy of wetted spot placement over labeled neurons. d Same section as a after removal of collection cap showing removal of selected tissue (holes appear white). 1,900 neurons were collected from 14-μm thick sections at the level of the RFA. Frames a and c were adjusted for contrast and brightness for easier viewing. Bar is 20 μm (same for a–d). e Electropherogram in gel format of isolated RNA of five samples run in duplicate (lanes 1–5, 6–10) plotted versus run time (s, seconds), standard ladder (L) is included. f Electropherogram of lane 2 from e in native format, run time (s) is plotted versus fluorescence units (FU). Well-defined bands of 18S and 28S rRNA (e black lines, f sharp peaks) are present in high quality samples
RNA quality analysis
After RNA extraction and isolation from each section, purity was assayed with RNA 6000 Nano LabChip kit, and only samples with RINs of 7 or above were used for further analysis (Fig. 2e, f). The entire electropherogram was taken into account in the proprietary RIN calculation (Agilent), although with high quality samples, the characteristic sharp bands of 18 and 28S can be seen (Fig. 2e, f).
RNA from neurons collected from a single animal was run on its own microarray (n = 12). After background correction, quantile normalization and summarization with RMA analysis (Partek Genomic Suite 6.4), log (base2) expression values were compared between microarrays to assess quality [24]. It is generally assumed that expression changes between groups are a small percentage of those assayed, and most gene expression remains the same. The quality control assessment showed gene expression similarity between chips: the frequency histogram shows overlap, and log probe cell intensity and log expression signal graphs show similarity of mean and quartile signal characteristics of control (red) and lesion (blue) microarrays. The Pearson’s correlation showed a correlation of>0.883 for all arrays (Fig. 3) after MAS5 analysis (Partek).
Fig. 3.
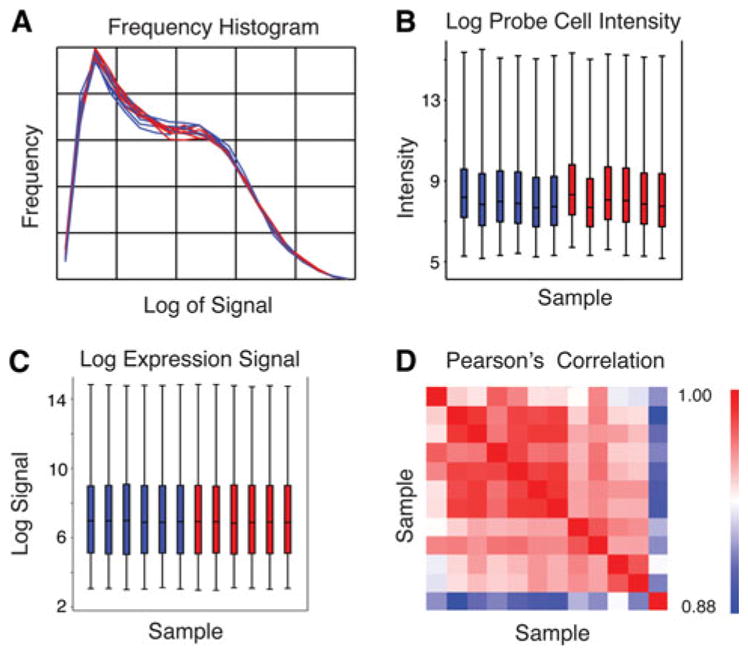
Quality control assessment of microarrays. a Frequency histogram of signal following RMA analysis, plotted as frequency of signal versus log of the signal for all lesion (blue) and control (red) arrays. b Box-and-whisker plots showing the log of probe cell intensity, and c the log of the expression signal for each of the arrays (Sample 1–12) following RMA analysis plotted as sample number versus log of the probe cell intensity or log of the expression signal, respectively. Lesion (blue) and control (red) plots are divided into 100, 75, 50, and 0th percentile (same for b and c). d Pearson’s correlation for signal after MAS5 analysis is greater than 0.883 for all arrays, plotted as Samples 1–12 versus Sample 1–12 (red boxes in diagonal line are identity). The indicator to the right displays higher (red) to lower (blue) correlation
Differential gene expression at 7 days post-infarct compared with controls was determined by mixed model ANOVA after RMA analysis. A total of 237 genes were significantly up-regulated and 357 genes were significantly down-regulated (p <0.05). Of the 271 genes whose expression changed ≥1.3-fold (p <0.05), 143 were up-regulated and 128 were down-regulated. These genes included ion channels (Clic3, Glrb), receptors (Trem2, Oprk1), enzymes (Gpam, Neu2), and transcription regulators (Creg1, Pou3f1) (Tables 1, 2).
Table 1.
List of upregulated genes 7 days post-infarct
| Symbol | Entrez gene name | Fold change | p Value | Location | Type |
|---|---|---|---|---|---|
| Rgs5 | Regulator of G-protein signaling 5 | 3.45 | 0.0117 | Plasma membrane | Other |
| Fbln2 | Fibulin 2 | 2.26 | 0.0176 | Extracellular space | Other |
| Aqp4 | Aquaporin 4 | 2.15 | 0.0116 | Plasma membrane | Transporter |
| NnaT | Neuronatin | 2.15 | 0.0153 | Plasma membrane | Transporter |
| Dennd4c | DENN/MADD domain containing 4C | 2.08 | 0.0004 | Unknown | Other |
| Omd | Osteomodulin | 2.02 | 0.0213 | Extracellular space | Other |
| Tubb2c | Tubulin, beta 2C | 2.00 | 0.0243 | Cytoplasm | Other |
| Creg1 | Cellular repressor of E1A-stimulated genes 1 | 1.97 | 0.0169 | Nucleus | Transcription regulator |
| Clic2 | Chloride intracellular channel 2 | 1.91 | 0.0021 | Unknown | Ion channel |
| Cd44 | CD44 molecule (Indian blood group) | 1.89 | 0.0445 | Plasma Membrane | Other |
| Timp3 | TIMP metallopeptidase inhibitor 3 | 1.87 | 0.0429 | Extracellular Space | Other |
| Gng11 | Guanine nucleotide binding protein (G protein), gamma 11 | 1.81 | 0.0486 | Plasma membrane | Enzyme |
| Flnc | Filamin C, gamma | 1.79 | 0.0433 | Cytoplasm | Other |
| Hist2h4 (includes others) | Histone cluster 2, H4 | 1.78 | 0.0455 | Nucleus | Other |
| Huwe1 | Hypothetical protein LOC501546 | 1.77 | 0.0316 | Nucleus | Enzyme |
| Klhl5 | Kelch-like 5 (Drosophila) | 1.75 | 0.0056 | Unknown | Other |
| Nars2 | asparaginyl-tRNA synthetase 2, mitochondrial (putative) | 1.74 | 0.0258 | Cytoplasm | Enzyme |
| Pabpc4 | Poly(A) binding protein, cytoplasmic 4 (inducible form) | 1.72 | 0.0070 | Cytoplasm | Other |
| Klhdc3 | Kelch domain containing 3 | 1.71 | 0.0047 | Cytoplasm | Other |
| Mpp6 | Membrane protein, palmitoylated 6 (MAGUK p55 subfamily member 6) | 1.69 | 0.0303 | Plasma membrane | Kinase |
| Clic3 | Chloride intracellular channel 3 | 1.66 | 0.0170 | Nucleus | Ion channel |
| Plin2 | Perilipin 2 | 1.64 | 0.0272 | Plasma membrane | Other |
| Plod2 | Procollagen-lysine, 2-oxoglutarate 5-dioxygenase 2 | 1.63 | 0.0240 | Cytoplasm | Enzyme |
| Sox4 | SRY (sex determining region Y)-box 4 | 1.62 | 0.0164 | Nucleus | Transcription regulator |
| Cotl1 | Coactosin-like 1 (Dictyostelium) | 1.62 | 0.0341 | Cytoplasm | Other |
| Pdlim4 | PDZ and LIM domain 4 | 1.58 | 0.0226 | Cytoplasm | Other |
| Asf1b | ASF1 anti-silencing function 1 homolog B (S. cerevisiae) | 1.58 | 0.0172 | Nucleus | Other |
| Prpf4b | PRP4 pre-mRNA processing factor 4 homolog B (yeast) | 1.58 | 0.0408 | Nucleus | Kinase |
| Trem2 | Triggering receptor expressed on myeloid cells 2 | 1.57 | 0.0474 | Plasma membrane | Transmembrane receptor |
| Ahi1 | Abelson helper integration site 1 | 1.56 | 0.0092 | Cytoplasm | Other |
| Map3k1 | Mitogen-activated protein kinase kinase kinase 1 | 1.55 | 0.0397 | Cytoplasm | Kinase |
| Elmo2 | Engulfment and cell motility 2 | 1.55 | 0.0058 | Cytoplasm | Other |
| Gpam | Glycerol-3-phosphate acyltransferase, mitochondrial | 1.55 | 0.0065 | Cytoplasm | Enzyme |
| Cyp26b1 | Cytochrome P450, family 26, subfamily B, polypeptide 1 | 1.54 | 0.0126 | Cytoplasm | Enzyme |
| Ldb3 | LIM domain binding 3 | 1.54 | 0.0307 | Cytoplasm | Transporter |
| Pnisr | PNN-interacting serine/arginine-rich protein | 1.54 | 0.0233 | Nucleus | Other |
| Sema4b | Sema domain, immunoglobulin domain (Ig), transmembrane domain (TM) and short cytoplasmic domain (semaphorin) 4B | 1.54 | 0.0143 | Plasma Membrane | Other |
| Chrdl1 | Chordin-like 1 | 1.53 | 0.0048 | Extracellular Space | Other |
| Specc1l | Sperm antigen with calponin homology and coiled-coil domains 1-like | 1.53 | 0.0038 | Unknown | Other |
| Tinagl1 | Tubulointerstitial nephritis antigen-like 1 | 1.53 | 0.0486 | Extracellular Space | Transporter |
| Smchd1 | Structural maintenance of chromosomes flexible hinge domain containing 1 | 1.53 | 0.0458 | Nucleus | Other |
Table 2.
List of down-regulated genes 7 days post-infarct
| Symbol | Entrez gene name | Fold change | p Value | Location | Type |
|---|---|---|---|---|---|
| Clca1 | Chloride channel accessory 1 | −2.69 | 0.0044 | Plasma membrane | Ion channel |
| Ermn | Ermin, ERM-like protein | −2.40 | 0.0132 | Extracellular space | Other |
| Mobp | Myelin-associated oligodendrocyte basic protein | −1.98 | 0.0054 | Cytoplasm | Other |
| Lypd6b | LY6/PLAUR domain containing 6B | −1.76 | 0.0291 | Unknown | Other |
| Oprk1 | Opioid receptor, kappa 1 | −1.76 | 0.0214 | Plasma membrane | G-protein coupled receptor |
| Scn4b | Sodium channel, voltage-gated, type IV, beta | −1.72 | 0.0233 | Plasma membrane | Ion channel |
| Mycbp2 | MYC binding protein 2 | −1.64 | 0.0375 | Nucleus | Enzyme |
| Glrb | Glycine receptor, beta | −1.64 | 0.0426 | Plasma membrane | Ion channel |
| Neu2 | Sialidase 2 (cytosolic sialidase) | −1.60 | 0.0192 | Cytoplasm | Enzyme |
| Fdft1 | Farnesyl-diphosphate farnesyltransferase 1 | −1.58 | 0.0348 | Cytoplasm | Enzyme |
| Rpusd2 | RNA pseudouridylate synthase domain containing 2 | −1.56 | 0.0266 | Unknown | Enzyme |
| Gypc | Glycophorin C (Gerbich blood group) | −1.55 | 0.0342 | Plasma membrane | Other |
| Etv1 | Ets variant 1 | −1.55 | 0.0045 | Nucleus | Transcription regulator |
| Pou3f1 | POU class 3 homeobox 1 | −1.55 | 0.0057 | Nucleus | Transcription regulator |
| Xkr4 | XK, Kell blood group complex subunit-related family, member 4 | −1.54 | 0.0163 | Unknown | Other |
| Hrasls | HRAS-like suppressor | −1.53 | 0.0152 | Cytoplasm | Other |
| Chodl | Chondrolectin | −1.51 | 0.0298 | Plasma membrane | Other |
| Bbs5 | Bardet-Biedl syndrome 5 | −1.51 | 0.0452 | Cytoplasm | Other |
| Pcdhb6 | Protocadherin beta 6 | −1.51 | 0.0055 | Plasma membrane | Other |
| Trim54 | Tripartite motif containing 54 | −1.50 | 0.0172 | Cytoplasm | Other |
| Skp2 | S-phase kinase-associated protein 2 (p45) | −1.50 | 0.0038 | Nucleus | Other |
| Kcns3 | Potassium voltage-gated channel, delayed-rectifier, subfamily S, member 3 | −1.49 | 0.0156 | Plasma membrane | Ion channel |
| Cadps2 | Ca2+-dependent secretion activator 2 | −1.48 | 0.0475 | Plasma membrane | Other |
| Slc5a7 | Solute carrier family 5 (choline transporter), member 7 | −1.48 | 0.0170 | Plasma membrane | Transporter |
| Plxdc1 | Plexin domain containing 1 | −1.48 | 0.0032 | Plasma membrane | Other |
| Grem1 | Gremlin 1 | −1.48 | 0.0134 | Extracellular space | Other |
| Lemd3 | LEM domain containing 3 | −1.47 | 0.0397 | Nucleus | Other |
| Nefm | Neurofilament, medium polypeptide | −1.47 | 0.0238 | Cytoplasm | Other |
| Stard4 | StAR-related lipid transfer (START) domain containing 4 | −1.46 | 0.0070 | Cytoplasm | Transporter |
| Kcns1 | Potassium voltage-gated channel, delayed-rectifier, subfamily S, member 1 | −1.46 | 0.0296 | Plasma membrane | Ion channel |
| Znf385b | Zinc finger protein 385B | −1.46 | 0.0283 | Nucleus | Other |
| Nxph1 | Neurexophilin 1 | −1.46 | 0.0095 | Extracellular space | Other |
| 40794 | Septin 8 | −1.45 | 0.0088 | Extracellular space | Other |
| Ttc39a | Tetratricopeptide repeat domain 39A | −1.45 | 0.0080 | Unknown | Other |
| Sstr2 | Somatostatin receptor 2 | −1.45 | 0.0293 | Plasma membrane | G-protein coupled receptor |
| Znf654 | Zinc finger protein 654 | −1.44 | 0.0354 | Unknown | Other |
| Spock3 | Sparc/osteonectin, cwcv and kazal-like domains proteoglycan (testican) 3 | −1.44 | 0.0064 | Extracellular Space | Other |
| C3orf67 | Chromosome 3 open reading frame 67 | −1.44 | 0.0238 | Unknown | Other |
| Nefl | Neurofilament, light polypeptide | −1.44 | 0.0269 | Cytoplasm | Other |
| B3galt5 | UDP-Gal:betaGlcNAc beta 1,3-galactosyltransferase, polypeptide 5 | −1.43 | 0.0453 | Cytoplasm | Enzyme |
| Pdyn | Prodynorphin | −1.43 | 0.0399 | Extracellular space | Transporter |
| Nefh | Neurofilament, heavy polypeptide | −1.43 | 0.0375 | Cytoplasm | Other |
| Dcun1d1 | DCN1, defective in cullin neddylation 1, domain containing 1 (S. cerevisiae) | −1.43 | 0.0279 | Unknown | Other |
| Khdrbs2 | KH domain containing, RNA binding, signal transduction associated 2 | −1.43 | 0.0188 | Nucleus | Other |
Canonical pathways analysis
Gene products of significantly differentially expressed genes (p <0.05, ≥1.3-fold change) were fit to known “canonical” pathways developed with a curated gene database (IPA analysis software). Significance of overrepresentation was determined by right-tailed Fisher’s Exact test. The canonical pathway, “Axonal Guidance Signaling,” was differentially regulated (−log(p value) = 2.68). The pathway involved 14 significantly regulated genes from the current data set. The differentially regulated genes were: Actr2, Pxn, Bmp4, Rras, Wnt9a, Rock2, Ntng1, Pak1, Tubb2c, Gng11, Ntrk2, Ppp3r1, Sema4b, and Bmp1 (Table 3).
Table 3.
List of regulated genes involved in the Axonal Guidance Signaling pathway
| Symbol | Entrez gene name | Fold change | p Value | Location | Type |
|---|---|---|---|---|---|
| Actr2 | ARP2 actin-related protein 2 homolog (yeast) | 1.40 | 0.0499 | Plasma membrane | Other |
| Bmp1 | Bone morphogenetic protein 1 | 1.46 | 0.0196 | Extracellular space | Peptidase |
| Bmp4 | Bone morphogenetic protein 4 | 1.51 | 0.0303 | Extracellular space | Growth factor |
| Gng11 | Guanine nucleotide binding protein (G protein), gamma 11 | 1.81 | 0.0486 | Plasma membrane | Enzyme |
| Ntng1 | Netrin G1 | −1.41 | 0.0047 | Extracellular space | Other |
| Ntrk2 | Neurotrophic tyrosine kinase, receptor, type 2 | 1.35 | 0.0468 | Plasma membrane | Kinase |
| Pak1 | p21 protein (Cdc42/Rac)-activated kinase 1 | −1.38 | 0.0269 | Cytoplasm | Kinase |
| Ppp3r1 | Protein phosphatase 3, regulatory subunit B, alpha | −1.32 | 0.0367 | Cytoplasm | Phosphatase |
| Pxn | Paxillin | 1.36 | 0.0394 | Cytoplasm | Other |
| Rock2 | Rho-associated, coiled-coil containing protein kinase 2 | 1.33 | 0.0347 | Cytoplasm | Kinase |
| Rras | Related RAS viral (r-ras) oncogene homolog | 1.41 | 0.0310 | Cytoplasm | Enzyme |
| Sema4b | Sema domain, immunoglobulin domain (Ig), transmembrane domain (TM) and short cytoplasmic domain (semaphorin) 4B | 1.54 | 0.0143 | Plasma membrane | Other |
| Tubb2c | Tubulin, beta 2C | 2.00 | 0.0243 | Cytoplasm | Other |
| Wnt9a | Wingless-type MMTV integration site family, member 9A | −1.32 | 0.0051 | Extracellular space | Other |
Gene function analysis
Genes with significant differential regulation (p <0.05, ≥1.3-fold change) were also significantly overrepresented in several biological processes, determined with the right-tailed Fisher’s exact test with a Benjamini-Hochberg correction (IPA analysis software). Although some genes were included in multiple categories, 220 unique genes were fit to overrepresented functional categories, which were reduced to 186 after the Benjamini-Hochberg correction. “Neurological Disease,” “Cell-to-cell Signaling and Interaction,” and “Nervous System Development and Function” were among the top categories dysregulated (Fig. 4). Within the categories, the functions “Branching of Neurites”, “Organization of Cytoskeleton”, “Dendritic Growth and Branching”, “Organization of Cytoplasm”, “Guidance of Neurites”, “Development of Cellular Protrusions”, “Density of Dendritic Spines”, and “Shape Change” (p = 0.000151–0.0487) involved 50 genes. The functions, “Development of Nervous Tissue”, “Neurogenesis”, “Development of Neurons”, and “Organization of Nervous Tissue” (p = 0.0322–0.0495), involved 30 genes. There were 13 genes involved in the function, “Synaptic Transmission” (p = 0.0229). The function of “Synaptic Transmission” (p = 0.0229) included: ApoE, Cd24, Chrm3, Gabrd, Glrb, Kcnd2, Nlgn2, Npy5r, Oprk1, Pcdhb6, Rasd2, Slc1a3, and Slc5a7. Interestingly, the function, “Rheumatic Disease” was overrepresented with 50 differentially expressed genes (p = 0.0113), and included the up-regulated genes, Rgs5, Tubb2c, Timp3, Klhl5, Ahi1, Bmp4, Tcf12, and Hla-Dqa1, and the down-regulated genes Lypd6b, Oprk1, Scn4b, Mycbp2, Kcns3, and Znf385b.
Fig. 4.

Canonical pathways and function categories involving significantly regulated genes from interconnected neurons 7 days post-infarct. a Significantly regulated genes (p <0.05 and above ≥1.3-fold change) were analyzed for interaction of their gene products and fit to canonical pathways developed with a curated gene database using Fisher’s Exact test (IPA software) to determine the probability of the same result when choosing genes at random. The length for each canonical pathway or function (blue box) is the negative log of the p value, and is significant if it extends to the right of the orange threshold line (−log(p ≤ 0.05)). Fisher’s Exact test accounts for the number of uploaded genes, genes in the reference set, genes in the pathway and uploaded genes in the pathway. “Axonal Guidance Singnaling”, has a −log(p) = 2.86. b Significantly regulated genes (p <0.05 and above ≥1.3-fold change) were analyzed for overrepresented biological functions involving their gene products in accordance with a curated gene database using Fisher’s Exact test (IPA software) to determine the probability of the function being overrepresented when choosing genes at random. Box length and threshold line are the same as in a
Gene–gene interactions network analysis
Genes up- or down-regulated ≥1.3× and p <0.05 were further analyzed for gene product interactions. The most dysregulated genes were used as “seed” molecules and other molecules with known interactions were added to form networks of interaction, in accordance with a curated gene database (IPA). Significance was determined with right-tailed Fisher’s Exact test, and adjusted with Bonferonni correction to determine the probability that the same network would be developed, if choosing genes at random. Significant networks involved 260 differentially expressed genes. The top three interaction networks (Fig. 5) were significant from p = 2.5 × 10−37–2.5 × 10⁻²², and involved 124 differentially expressed genes.
Fig. 5.

Interaction networks of significantly regulated genes from interconnected neurons 7 days post-infarct. a–c Significantly regulated genes (p <0.05 and above ≥1.3-fold change) were analyzed for interactions of their gene products using Fisher’s Exact test (IPA software) to determine the probability of the same interaction network occurring after choosing genes at random, interactions significant at p <0.05. d, e Show the reanalysis to detect interactions between genes in the “Axonal Guidance Signaling” pathway, which have ≥1.5-fold change and p value <0.05. a–e Upregulated (red) and down-regulated (green) genes interact directly (solid line) or indirectly (dotted line). Genes (p <0.05) not meeting the fold change cutoff (gray), and genes not present in the uploaded gene set (white) were only included in the interaction networks, if the gene was required as a necessary intermediary between two significant genes
Differentially regulated molecules appearing as nodes in the first six networks (Fig. 5) were: FBLN2 2.26, TIMP3 1.874, AQP4 2.146, RGS5 3.446, FLNC 1.793, OMD 2.021, TUBB2C 1.996, CD44 1.894, CREG11 1.966, GNG11 1.813, NNAT 2.145, ERMIN-2.398, and OPRK1-1.760 (symbol and fold change, respectively).
Those genes in the “Axonal Guidance Signaling” pathway with ≥1.5-fold changes and p value <0.05 were further analyzed for interactions. IPA software identified several potential interactions using the significant genes involved in the pathway and genes from its curated knowledge base. Network 4 (Fig. 5) shows GNG11 interacting with BMP4 through RGS19 and TUBB2C through NOTCH1. TUBB2C can also interact with GNG11 through TUBA1A, and BMP4 through MYD88, SMURF1, and BMP receptors 1A or1B. SEMA4B can interact with TBB2C through DLG4 and SYT1, and BMP4 through DLG4 and EZH2.
Discussion
The injured brain is no longer seen as an uninjured brain with a missing puzzle piece [8]. An ischemic infarct instigates an array of molecular, physiologic, and anatomical changes in spared areas of the adult CNS [10, 17, 18]. Surviving areas play a role in recovery from CNS damage, but little has been done to understand the mechanisms underlying neural plasticity at the level of gene expression. While hypoxia in the ischemic territory and surrounding penumbra undoubtedly results in gene-associated changes in a host of cell types, including neurons, glia, astrocytes and endothelial cells, the signaling pathways may be very different in remote tissue that is far removed from the hypoxic zone. Neuronal somata located in remote areas, in particular, may be triggered to initiate growth processes, since many of them send axonal arbors into the ischemic territories, where they normally form synaptic connections. This study was designed to isolate such remote neurons that have known terminations in an ischemic territory, and determine their differential gene expression changes.
The results demonstrated that 143 genes were up-regulated and 128 genes were down-regulated at 7 days post-infarct. IPA analysis revealed potential biological interactions of gene products from significant genes and found several canonical pathways that were overrepresented in the dataset, “Axonal Guidance Signaling” was the most overrepresented. IPA also identified the over-represented functions of “Branching of Neurites”, “Organization of Cytoskeleton”, “Dendritic Growth and Branching”, “Organization of Cytoplasm”, “Guidance of Neurites”, “Development of Cellular Protrusions”, “Density of Dendritic Spines”, and “Shape Change,” which involved 50 genes. Putative networks of interaction were also developed with IPA involving highly dysregulated genes as nodes. Those genes in the “Axonal Guidance Signaling” pathway with ≥1.5-fold change and p value <0.05 were included in a second analysis and fit to their own interaction networks. These analyses add to the known functions of the current study’s significant genes, showing possible biological relevance. Taken together, these data add credence to the idea that neurons in remote areas that are anatomically connected to an ischemic territory may initiate growth and guidance signaling pathways, presumably in an attempt to reorganize. This process appears to be in place at 7 days after infarct.
Relevance of the current model
Our lesion model is the first to study gene expression in a neuronal population located in an anatomically identified premotor area after a primary motor cortex injury. After Neafsey and Sievert identified the RFA as a non-primary motor area, Rouiller further defined its general pattern of connectivity and its relationship to the primary motor, subcortical and sensory areas [21, 26]. The rodent RFA is a premotor area, as classically defined, since it contains a forelimb representation distinct from the primary motor cortex (CFA), its principal target of efferent fibers in the cortex is to the primary motor cortex, and it contains neurons that project directly to the spinal cord via the corticospinal tract. Both CFA and RFA are involved in function of the forelimb in intact animals, and both can be identified in vivo by the presence of movements evoked by ICMS at low current levels.
The RFA is important to behavioral recovery when CFA is injured. After a lesion to CFA and subsequent functional recovery over a period of 5 weeks, a secondary lesion in RFA leads to reinstatement of the deficits, even though a lesion to RFA in otherwise normal rats does not induce significant impairments [22]. In different rat models of cortical infarct, increased recovery of function has been correlated with treatments that increase anatomical sprouting [15, 20]. Also, after a primary motor cortex lesion in non-human primates, the ventral premotor area (PMv), which shares structural and functional similarities to RFA, undergoes physiological reorganization that is proportional to the size of the lesion [5]. In addition, neurons in PMv undergo axonal reorganization that results in trajectory alteration and formation of synaptic contacts in completely new territories in the parietal lobe [17].
The current study adds to earlier findings by identifying a specific neuronal population that is connected to an infarcted area. LCM was used to provide a more specific picture of the gene expression changes in identified neurons from this area after ischemia compared to neurons from non-infarcted animals. While LCM is not completely selective, and closely apposed cell fragments and neuropil are also collected, the collected RNA is concentrated with neuronal signal. This is the first model to selectively acquire neurons interconnected to an area that is destined for infarction. Though Li et al. [10] used LCM and double retrograde labeling to selectively acquire sprouting neurons in peri-infarct cortex, the study was focused on a specific population of neurons that sprouted after the infarct, rather than a more remote population of neurons that were connected to the infarct core prior to injury, as in the present study. It is possible that the harvested neurons in the Li et al. study displayed somewhat different expression patterns since they were likely within a hypoxic territory. By identifying the areas targeted for infarct physiologically with ICMS, retrogradely labeling the RFA neurons, and employing LCM at the level of the RFA, we have produced a more specific picture of gene expression changes in RFA neurons after CFA ischemic infarct.
Relevance of gene expression changes after brain injury
Although initially thought to be a recapitulation of developmental gene expression, the brain’s response to injury, such as occurs in stroke, is now seen in a broader context, including regulation of a similar set of genes to those involved in development, as well as genes specific to neuronal response to injury [27]. Studies in peri-infarct cortex show up- and down-regulation of both developmentally and non-developmentally associated genes that are both neuronal and non-neuronal in origin [9]. Extensions of this work found gene expression differences specifically in sprouting neurons that were not strictly developmental in nature. Notably, these studies revealed changes in the expression of some novel genes not known to be associated with axonal sprouting after ischemic infarct [10].
Likewise, the present study, which examined specific neuronal populations well outside of the peri-infarct, and presumably hypoxic, territory, found up- and down-regulation of both developmentally and non-developmentally associated genes. While gene expression changes were characterized at a single time point after infarct (7 days), it important to note that there is a complex temporal profile of gene regulation over time [9]. Seven days was chosen in this study because it represents the beginning of an initiation phase of growth promotion. However, future studies will be important to address other time points to establish a more complete temporal profile of neuron-specific gene expression during trigger, initiation, maintenance, and termination phases.
The importance of understanding the temporal profile of gene expression changes after brain injury is related to the potential for identifying specific targets for therapeutic development. It may be possible to induce adaptive changes in neuronal connections by triggering one or more of the identified pathways at specific time points after injury. Likewise, in the future, it will be critical to understand how various rehabilitative therapies affect both growth-promoting and growth-inhibiting molecules. Such neuron-specific gene expression studies may be used for the development of surrogate markers of recovery.
Genes regulated in current study
The genes most differentially regulated in the current study can be grouped into several categories, based on their presumed function, including nervous system development, neuroprotection, apoptosis, axonal growth and guidance, and several genes that have not been associated with ischemia previously. There were also genes with expression profiles that were counterintuitive to expectations.
Development
Regulation of developmentally associated genes after focal cortical infarct is consistent with the findings of other studies involving neuronal gene expression in vivo. Northern blot analysis of E13 and newborn mice showed increased expression of fibulin 2 (Fbln2, +2.26-fold change in the current study) in certain ganglia and embryonic spinal cord, suggesting a role in motor neuron development [28]. Tripartite motif containing 54 (Trim54, −1.503-fold change in the current experiment) an E3 ubiquitin ligase is not significantly expressed before birth, and knockdown perturbs tubulin dynamics and disrupts ordered Z and M bands in cardiac development [29]. Chondrolectin (Chodl, −1.533-fold change in the current experiment) a type I transmembrane protein is important in development, proliferation, and differentiation of a myoblastic cell line and maturation of T-cells in mice [30–32]. Chodl was also localized to cholinergic, fast motor neurons in spinal cord with in situ hybridization and in the brain of adult mice with Southern blot [31, 33]. Cellular repressor of E1A-stimulated genes 1 (Creg1, +1.96-fold change in the current study), a secreted glycoprotein, is suggested to have a role in development of the mouse brain, due to its differential gene expression and protein concentration pattern [34]. CREG1 enhances differentiation, reduces proliferation, and its RNA is present in adult mouse brain [35]. Other genes, discussed in different categories below, are also involved in neuronal development. Nnat is an imprinted gene important in hindbrain development [36], Oprk1 is involved in EGF-stimulated spinal cord development [37], Mycbp2 is involved in retinocollicular targeting [38], while thyroid hormone partially regulates brain development through Cd44 [39]. Finally, Sema4b is important for the developing cerebellum [40], and Bmp1 [41] and Bmp4 [42] are involved in dorsal/ventral patterning of the embryo. These genes are differentially expressed during neuronal development, and are differentially expressed in the same direction after CNS injury in adult rat, which is consistent with a return to a previous developmental state.
Carmichael et al. [9] found that although developmentally related genes in peri-infarct tissue were differentially expressed after cortical infarct, the expression pattern included genes not reported with development and the authors suggested that regeneration displays a unique pattern of expression. Likewise, the current study found genes not typically associated with development, but involved in regeneration. For example, Tubb2c increases neurite sprouting [43, 44], while Gng11 regulates senescence [45]. Scn4b up-regulation increases neuroblastoma cell neurite extension and dendritic spine density in hippocampal primary neuron cultures [46], while Dennd4c is a guanine exchange factor [47]. The differential regulation of genes in the current study associated with neuronal development as well as unique regenerative genes may suggest axonal regeneration is taking place in RFA neurons.
Neuroprotection
Regulation of a gene thought to be involved in neuroprotection was also found. Knockdown of sodium channel, voltage-gated, type IV, beta (Scn4b, −1.72-fold change in the current study) has been shown to decrease the resurgent firing in cultured cerebellar granule neurons [48]. Preventing resurgent firing may provide protection from excitotoxic injury in neurons reciprocally connected to an area undergoing anoxic depolarizations, as in our model, and thus, its down-regulation in the current model may be neuroprotective. Its role in development has yet to be investigated [49].
Apoptosis
Apoptosis-related gene expression changes also were detected in the current study. In a model of middle cerebral artery (MCA) occlusion, intracortical ET-1 injection near the MCA leads to hypoperfusion of the cortex for 16–22 h [50]. After 2 h of transient or permanent MCA occlusion, cell death in the penumbra and ischemic core was the same for 2 h of transient or permanent MCA occlusion [51]. Although the time course of apoptosis and necrosis is unknown in our model, the potentially long lasting effects of ET-1 make more probable the comparison between our model and other focal lesions. Neuronal apoptosis and necrosis during a ligation model of focal ischemic cortical infarct peak at 1 day post-infarct, and are minimal by 5 days post-infarct, as shown by caspase 3 activation, and 8-Hydroxy-2-deoxy guanosine (8-OH-dG) and TUNEL staining [52], which is consistent with the observation that 24 h after ischemia ~80 % of neurons in the ischemic core in focal ischemia have apoptosed [53]. In the current study, the RFA is outside the lesion core and the penumbra, and therefore outside of the area of known apoptosis. Further, neuronal harvesting was conducted 7 days after the infarct, at a time when further cell death was minimal anywhere in the cortex. Therefore, neurons undergoing apoptosis would have already done so, and not been collected in the LCM process. In addition to the previously stated role for CREG1, CREG1 upregulation inhibits apoptosis of cultured vascular smooth muscle cells, and is inversely correlated with caspace-3 activation [54]. Apoptotic and anti-apoptotic related gene changes in the current study were relatively few, but those present may be enough to instigate apoptosis in surviving cortical neurons. The presence of both apoptotic and anti-apoptotic related genes may indicate different populations of interconnected neurons undergoing stages of apoptosis, versus neuroprotection, or still within the decision process of whether to enter apoptosis or not.
Axonal growth and guidance
Several genes were related to sprouting or axonal growth, but not included in the canonical IPA pathway of “Axonal Guidance Signaling”. Decrease of MYC binding protein 2 (MycBp2, −1.69-fold change in the current study) was shown to increase axonal regeneration in adult C. elegans after axotomy [55]. CD44 molecule (Indian blood group) (Cd44, +1.894-fold change in the current study) a cell-adhesion molecule involved in extracellular matrix changes can influence cell growth, survival and differentiation [56]. CD44 acts as a repulsive signal for retinal ganglionic cell axons entering the embryonic diencephalon that will become the optic chiasm and decreased neurite length of retinal neuron explants in vitro [57]. Its increase in the current experiment may play a role in decreasing axon length.
Novel significant genes: not previously reported with stroke
Genes not previously reported in ischemia, were also differentially expressed in the present study. While the novelty of these findings may be related to the specific time point chosen for analysis in this study, it may also reflect specific roles of interconnected neurons after injury. DENN/MADD domain containing 4C (Dennd4c, +2.081 in the current study) is a guanine nucleotide exchange factor for RAB10. Activation of RAB10 by DENND4C leads to increased trafficking of glucose transporter, GLUT4 to the cell membrane in adipocyte cultures, and increase of glucose influx [47]. In situ hybridization has shown that Glut4 mRNA is localized to neurons within the rat motor cortex [58].
Genes with presumably paradoxical expression
There were several genes that did not fit with expected expression patterns. It has been shown that 3 h of Artemin treatment on adult rat DRG neurons increases total neurite length and branching and synaptic vesicle clustering, and decreases neuronatin [59]. The increase in Neuronatin in the current study (Nnat, +2.145-fold change) would seem to hinder neurite extension, and is contrary to expectations. Down-regulation of opioid receptor, kappa 1 in the current study (Oprk1, −1.76-fold change) also is paradoxical, in that agonism during ischemia has been shown to be neuroprotective [60] and knockdown or inhibition leads to less EGF-stimulated growth in cultured neurons [37]. A decrease in opioid receptor would seemingly increase neuronal death and decrease sprouting. It is possible this could be indicative of a balance between maintaining enough activity to induce and guide sprouting, and decreasing activity, so as not to induce excitotoxicity. GABA disinhibition and NMDA receptor increase is noted in areas interconnected to an infarct [61]. Growth associated protein of 43 kDa (Gap43) was not found to be differentially regulated in this experiment, even though it is found at this time point in neuronal sprouting studies in similar distances from the cortex, and is seen as a paradigmatic growth cone marker [9, 62]. This suggests that some or all of the collected neurons are not sprouting, or that they do sprout but do not employ Gap43 up-regulation. However, interconnected neurons could instead be serving as a kind of relay station, signaling and instigating reorganization in nearby neurons, instead of the interconnected neurons themselves sprouting. As size and type of lesion is also important during reorganization, this lesion may not be of a sufficient size or type to instigate sprouting [63, 64].
Biological context revealed by IPA
In the current study, IPA software was used to give broader biological implications beyond what would be concluded by the identification of single genes significantly regulated. Gene product functions, pathways, and interactions are based on the Ingenuity Knowledge Base, a curated database of literature findings. IPA is well accepted by the scientific community and a PubMed search reveals 473 articles involving the software, as well as 13 reviews, since the year 2005.
Select functions found to be overrepresented were “Branching of Neurites”, “Organization of Cytoskeleton”, “Dendritic Growth and Branching”, “Organization of Cytoplasm”, “Guidance of Neurites”, “Development of Cellular Protrusions”, “Density of Dendritic Spines”, and “Shape Change,” which involved 50 genes. These functions involve morphological changes, and are consistent with collected neuron reorganization.
IPA identified significant genes (≥1.3-fold change and p <0.05) that were overrepresented in several canonical pathways: “Axonal Guidance Signaling”, “Actin-based Motility by Rho”, and “Actin Cytoskeleton Signaling” pathways. IPA also identified the functional categories of cytoplasmic restructuring, and cytoskeletal reorganization. Genes changed within these pathways and functional categories are consistent with other studies of reorganization. These genetic changes show that 7 days after CFA infarct, RFA neurons activate gene expression conducive to sprouting and reorganization. This suggests axonal sprouting is part of the response to ischemic infarct in axons connected to an infarct.
Those genes in the “Axonal Guidance Signaling” pathway of ≥1.5-fold changed and p value <0.05 are further discussed below. They were also reanalyzed to determine interactions beyond the canonical pathway. Interactions were found that are different than those in the canonical pathway, and these interactions may be important in this model.
Relevance for the most regulated genes of the “Axonal Guidance Signaling” pathway
Sema4B
Semaphorins were originally characterized as negative guidance cues of axonal growth cones, are both soluble and membrane bound ligands, and can act as receptors themselves. They have both long and short range effects on cellular morphology of various cell types [65]. As such, Semaphorins are repulsive signaling proteins involved in axonal guidance and dendritic structure. Semaphorin 4b (Sema4b, +1.54-fold change in the current study), primarily localized to Bergman glia and astrocytes in post-natal mice, may be important in granule cell migration and proper formation of the cerebellum [40]. By knocking down Sema4b and staining for synapsin 1 and PSD-95 in in vitro cultures of E18 hippocampal neurons, Paradis et al. [66] found Sema4b was necessary for gluatamatergic synapse formation. RNA in situ hybridization experiments detected Sema4B in neurons (with low level signal in chondrocytes) from E14–E19 Sprague–Dawley rats, absent in adults and increased in olfactory epithelium neurons 2 weeks after olfactory bulbectomy. The authors suggested Sema4b’s presence in the adult bulbectomy model instigated a growth pause in regenerating axons, because the axons lacked the target of the bulb [67].
Tubb2c
Microtubules are cytoskeletal proteins involved in diverse processes from signaling to mitosis, and are formed from heterodimers of alpha and beta-tubulin. Beta-tubulin 2c (Tubb2c, +2.00-fold change in the current study), one of several isoforms identified, is ubiquitous in human tissues [68]. Lewis et al. [43] showed neurite outgrowth from neurons whose cell bodies reside in the inner nuclear layer after retinal detachment in adult cats. The inner nuclear layer was later shown to have an increase in TUBB2C protein 7 days after retinal detachment in rabbits [44]. TUBB2C increases in the same layer and time frame after detachment, which points to its possible role in sprouting.
Bmp1
Bone morphogenetic protein 1 (Bmp1, +1.46-fold change in the current study) is the prototype of a highly conserved family of metalloproteinase involved in dorso-ventral patterning in the vertebrate embryo by BMP2 and 4 activation [41]. Originally thought to activate the other BMP’s with which it co-purified, it was later found to have procollagen C-proteinase activity. Its role in development may come from formation of extracellular matrix and activity of growth factors [69]. Also, mRNA of the Aplysia homolog to Bmp1 (Aplysia tolloid/BMP-1-like protein, apTBL-1) was increased after long-term training in Aplysia and was suggested to play a role in synaptic plasticity between sensory and motor neurons [70].
Bmp4
Bone morphogenetic protein 4 (Bmp4, +1.51-fold change in the current study) is part of the transforming growth factor beta (TGF-b) superfamily localized to the extracellular space. BMP2 and BMP4-7 are involved in dorsal patterning in the embryo, while sonic hedgehog (SHH) is responsible for the ventral. Intracisternal injection of BMP7, which activates similar receptors as BMP4 [42], increased behavioral recovery in rats after MCAO, without decreasing the lesion size [71], and it was suggested that the behavioral improvements were related to the BMP7s known instigation of dendrite growth and development [72]. BMP4 is also present during neural tube closing and is suggested to have autocrine or paracrine activity during development [42]. Adeno-associated virus encoding Bmp4 intrathecally injected into the dorsal root ganglia, increased the ability of severed axons to regenerate after spinal cord injury (complete dorsal column transection) in adult mice. There was increased regeneration, even if AAV-Bmp4 was injected 15 min after transection [73].
Gng11
Guanine nucleotide binding protein (G protein) gamma 11 (Gng11, +1.81-fold change in the current study) a membrane bound G-protein subunit that can translocate to the Golgi apparatus and alter its structure, which may have a role in increasing cell senescence. This translocation is hindered by shRNA [74]. Gng11 down-regulation by antisense cDNA increased longevity of human fibroblasts and oxidative stress induced its transcription. Over expression leads to activation of ERK1/2 but not RAS [45]. GNG11 was not found in normal retina or brain tissue [75]. The gamma11 subunit has differential A1 adenosine receptor, M1 muscarinic receptor and phospholipase C-beta activation depending on beta subunit parings [76]. Gamma11 was not found in rat brain by immunoblot but expression was abundant in blood cells and may explain its presence at 7 days [77].
Summary
In summary, stroke induces a unique set of gene expression patterns in spared interconnected corticocortical neurons 7 days after ischemic infarct. The gene expression patterns display up- and down-regulation associated with nervous system development, apoptosis, and axonal growth. Several have not been reported previously in ischemia models. Canonical pathways and interaction networks developed with IPA suggest gene product interactions. Though RFA neurons display some aspects of reorganization, they may serve to instigate other cortical neurons to reorganize, or simply survive. Future experiments will be necessary to further investigate the purpose of this unique genetic program.
Acknowledgments
We would like to thank S. Thomas Carmichael for his consultation and Diane Durham and Doug Wright and their lab members for advice and equipment usage. We would also like to thank Don Warn, Yafen Niu, Clark Bloomer, Stan Svojanovsky and Sumedha Gunewardena. This work was supported by NIH grant R37 NS030853, NICHD HD02528, and the Landon Center on Aging. The Microarray Facility is supported by the Kansas University-School of Medicine, KUMC Biotechnology Support Facility, the Smith Intellectual and Developmental Disabilities Research Center (HD02528), and the Kansas IDeA Network of Biomedical Research Excellence (RR016475).
Abbreviations
- CFA
Caudal forelimb area
- RFA
Rostral forelimb area
- PMv
Ventral premotor area
- S1
Primary sensory area
- M1
Primary motor area
- ICMS
Intracortical microstimulation
- CTB647
Cholera toxin beta subunit conjugated to AlexaFluor 647
- LCM
Laser capture microdissection
- IPA
Ingenuity pathway analysis
- IM
Intermuscular
- IP
Interperitoneal
- IVT
In vitro transcription
- RIN
RNA integrity number
- RMA
Robust multi-array averaging
- NeuN
Neuronal nuclei antigen
- RNA
Ribonucleic acid
Contributor Information
Edward T. R. Urban, III, Department of Molecular & Integrative Physiology, Kansas University Medical Center, 3901 Rainbow Boulevard, Mail Stop 3043, Kansas City, KS 66160, USA. Landon Center on Aging, Kansas University Medical Center, 3901 Rainbow Boulevard, Mail Stop 1005, Kansas City, KS 66160, USA.
Scott D. Bury, Landon Center on Aging, Kansas University Medical Center, 3901 Rainbow Boulevard, Mail Stop 1005, Kansas City, KS 66160, USA
H. Scott Barbay, Landon Center on Aging, Kansas University Medical Center, 3901 Rainbow Boulevard, Mail Stop 1005, Kansas City, KS 66160, USA.
David J. Guggenmos, Department of Molecular & Integrative Physiology, Kansas University Medical Center, 3901 Rainbow Boulevard, Mail Stop 3043, Kansas City, KS 66160, USA. Landon Center on Aging, Kansas University Medical Center, 3901 Rainbow Boulevard, Mail Stop 1005, Kansas City, KS 66160, USA
Yafeng Dong, Department of Obstetrics and Gynecology, Kansas University Medical Center, 3901 Rainbow Boulevard, Mail Stop 2028, Kansas City, KS 66160, USA.
Randolph J. Nudo, Email: rnudo@kumc.edu, Department of Molecular & Integrative Physiology, Kansas University Medical Center, 3901 Rainbow Boulevard, Mail Stop 3043, Kansas City, KS 66160, USA. Landon Center on Aging, Kansas University Medical Center, 3901 Rainbow Boulevard, Mail Stop 1005, Kansas City, KS 66160, USA. Intellectual & Developmental Disabilities Research Center, Kansas University Medical Center, 3901 Rainbow Boulevard, Mail Stop 3051, Kansas City, KS 66160, USA
References
- 1.Roger VL, Go AS, Lloyd-Jones DM, Adams RJ, Berry JD, Brown TM, Carnethon MR, Dai S, de Simone G, Ford ES, Fox CS, Fullerton HJ, Gillespie C, Greenlund KJ, Hailpern SM, Heit JA, Ho PM, Howard VJ, Kissela BM, Kittner SJ, Lackland DT, Lichtman JH, Lisabeth LD, Makuc DM, Marcus GM, Marelli A, Matchar DB, McDermott MM, Meigs JB, Moy CS, Mozaffarian D, Mussolino ME, Nichol G, Paynter NP, Rosamond WD, Sorlie PD, Stafford RS, Turan TN, Turner MB, Wong ND, Wylie-Rosett J. Heart disease and stroke statistics–2011 update: a report from the American Heart Association. Circulation. 2011;123:e18–e209. doi: 10.1161/CIR.0b013e3182009701. [DOI] [PMC free article] [PubMed] [Google Scholar]
- 2.MMWR . Prevalence of disabilities and associated health conditions among adults—United States, 1999. MMWR Morb Mortal Wkly Rep. 2001;50:120–125. [PubMed] [Google Scholar]
- 3.Cramer SC, Nelles G, Benson RR, Kaplan JD, Parker RA, Kwong KK, Kennedy DN, Finklestein SP, Rosen BR. A functional MRI study of subjects recovered from hemiparetic stroke. Stroke. 1997;28:2518–2527. doi: 10.1161/01.str.28.12.2518. [DOI] [PubMed] [Google Scholar]
- 4.Nudo RJ, Milliken GW. Reorganization of movement representations in primary motor cortex following focal ischemic infarcts in adult squirrel monkeys. J Neurophysiol. 1996;75:2144–2149. doi: 10.1152/jn.1996.75.5.2144. [DOI] [PubMed] [Google Scholar]
- 5.Frost SB, Barbay S, Friel KM, Plautz EJ, Nudo RJ. Reorganization of remote cortical regions after ischemic brain injury: a potential substrate for stroke recovery. J Neurophysiol. 2003;89:3205–3214. doi: 10.1152/jn.01143.2002. [DOI] [PubMed] [Google Scholar]
- 6.Carmichael ST, Wei L, Rovainen CM, Woolsey TA. New patterns of intracortical projections after focal cortical stroke. Neurobiol Dis. 2001;8:910–922. doi: 10.1006/nbdi.2001.0425. [DOI] [PubMed] [Google Scholar]
- 7.Jablonka JA, Burnat K, Witte OW, Kossut M. Remapping of the somatosensory cortex after a photothrombotic stroke: dynamics of the compensatory reorganization. Neuroscience. 2010;165:90–100. doi: 10.1016/j.neuroscience.2009.09.074. [DOI] [PubMed] [Google Scholar]
- 8.Nudo RJ. Mechanisms for recovery of motor function following cortical damage. Curr Opin Neurobiol. 2006;16:638–644. doi: 10.1016/j.conb.2006.10.004. [DOI] [PubMed] [Google Scholar]
- 9.Carmichael ST, Archibeque I, Luke L, Nolan T, Momiy J, Li S. Growth-associated gene expression after stroke: evidence for a growth-promoting region in peri-infarct cortex. Exp Neurol. 2005;193:291–311. doi: 10.1016/j.expneurol.2005.01.004. [DOI] [PubMed] [Google Scholar]
- 10.Li S, Overman JJ, Katsman D, Kozlov SV, Donnelly CJ, Twiss JL, Giger RJ, Coppola G, Geschwind DH, Carmichael ST. An age-related sprouting transcriptome provides molecular control of axonal sprouting after stroke. Nat Neurosci. 2010;13:1496–1504. doi: 10.1038/nn.2674. [DOI] [PMC free article] [PubMed] [Google Scholar]
- 11.Carmichael ST. Cellular and molecular mechanisms of neural repair after stroke: making waves. Ann Neurol. 2006;59:735–742. doi: 10.1002/ana.20845. [DOI] [PubMed] [Google Scholar]
- 12.Nudo RJ, Wise BM, SiFuentes F, Milliken GW. Neural substrates for the effects of rehabilitative training on motor recovery after ischemic infarct. Science. 1996;272:1791–1794. doi: 10.1126/science.272.5269.1791. [DOI] [PubMed] [Google Scholar]
- 13.Jones TA, Schallert T. Use-dependent growth of pyramidal neurons after neocortical damage. J Neurosci. 1994;14:2140–2152. doi: 10.1523/JNEUROSCI.14-04-02140.1994. [DOI] [PMC free article] [PubMed] [Google Scholar]
- 14.Keyvani K, Witte OW, Paulus W. Gene expression profiling in perilesional and contralateral areas after ischemia in rat brain. J Cereb Blood Flow Metab. 2002;22:153–160. doi: 10.1097/00004647-200202000-00003. [DOI] [PubMed] [Google Scholar]
- 15.Zai L, Ferrari C, Subbaiah S, Havton LA, Coppola G, Strittmatter S, Irwin N, Geschwind D, Benowitz LI. Inosine alters gene expression and axonal projections in neurons contralateral to a cortical infarct and improves skilled use of the impaired limb. J Neurosci. 2009;29:8187–8197. doi: 10.1523/JNEUROSCI.0414-09.2009. [DOI] [PMC free article] [PubMed] [Google Scholar]
- 16.Chollet F, DiPiero V, Wise RJ, Brooks DJ, Dolan RJ, Frackowiak RS. The functional anatomy of motor recovery after stroke in humans: a study with positron emission tomography. Ann Neurol. 1991;29:63–71. doi: 10.1002/ana.410290112. [DOI] [PubMed] [Google Scholar]
- 17.Dancause N, Barbay S, Frost SB, Plautz EJ, Chen D, Zoubina EV, Stowe AM, Nudo RJ. Extensive cortical rewiring after brain injury. J Neurosci. 2005;25:10167–10179. doi: 10.1523/JNEUROSCI.3256-05.2005. [DOI] [PMC free article] [PubMed] [Google Scholar]
- 18.Stowe AM, Plautz EJ, Nguyen P, Frost SB, Eisner-Janowicz I, Barbay S, Dancause N, Sensarma A, Taylor MD, Zoubina EV, Nudo RJ. Neuronal HIF-1 alpha protein and VEGFR-2 immunoreactivity in functionally related motor areas following a focal M1 infarct. J Cereb Blood Flow Metab. 2008;28:612–620. doi: 10.1038/sj.jcbfm.9600560. [DOI] [PMC free article] [PubMed] [Google Scholar]
- 19.Stowe AM, Plautz EJ, Eisner-Janowicz I, Frost SB, Barbay S, Zoubina EV, Dancause N, Taylor MD, Nudo RJ. VEGF protein associates to neurons in remote regions following cortical infarct. J Cereb Blood Flow Metab. 2007;27:76–85. doi: 10.1038/sj.jcbfm.9600320. [DOI] [PMC free article] [PubMed] [Google Scholar]
- 20.Liu Z, Li Y, Zhang ZG, Cui X, Cui Y, Lu M, Savant-Bhonsale S, Chopp M. Bone marrow stromal cells enhance inter- and intracortical axonal connections after ischemic stroke in adult rats. J Cereb Blood Flow Metab. 2010;30:1288–1295. doi: 10.1038/jcbfm.2010.8. [DOI] [PMC free article] [PubMed] [Google Scholar]
- 21.Rouiller EM, Moret V, Liang F. Comparison of the connectional properties of the two forelimb areas of the rat sensorimotor cortex: support for the presence of a premotor or supplementary motor cortical area. Somatosens Mot Res. 1993;10:269–289. doi: 10.3109/08990229309028837. [DOI] [PubMed] [Google Scholar]
- 22.Conner JM, Chiba AA, Tuszynski MH. The basal forebrain cholinergic system is essential for cortical plasticity and functional recovery following brain injury. Neuron. 2005;46:173–179. doi: 10.1016/j.neuron.2005.03.003. [DOI] [PubMed] [Google Scholar]
- 23.Nishibe M, Barbay S, Guggenmos D, Nudo RJ. Reorganization of motor cortex after controlled cortical impact in rats and implications for functional recovery. J Neurotrauma. 2010;27: 2221–2232. doi: 10.1089/neu.2010.1456. [DOI] [PMC free article] [PubMed] [Google Scholar]
- 24.Irizarry RA, Hobbs B, Collin F, Beazer-Barclay YD, Antonellis KJ, Scherf U, Speed TP. Exploration, normalization, and summaries of high density oligonucleotide array probe level data. Biostatistics. 2003;4:249–264. doi: 10.1093/biostatistics/4.2.249. [DOI] [PubMed] [Google Scholar]
- 25.Fang PC, Barbay S, Plautz EJ, Hoover E, Strittmatter SM, Nudo RJ. Combination of NEP 1–40 treatment and motor training enhances behavioral recovery after a focal cortical infarct in rats. Stroke. 2010;41:544–549. doi: 10.1161/STROKEAHA.109.572073. [DOI] [PMC free article] [PubMed] [Google Scholar]
- 26.Neafsey EJ, Sievert C. A second forelimb motor area exists in rat frontal cortex. Brain Res. 1982;232:151–156. doi: 10.1016/0006-8993(82)90617-5. [DOI] [PubMed] [Google Scholar]
- 27.Benowitz LI, Carmichael ST. Promoting axonal rewiring to improve outcome after stroke. Neurobiol Dis. 2010;37:259–266. doi: 10.1016/j.nbd.2009.11.009. [DOI] [PMC free article] [PubMed] [Google Scholar]
- 28.Zhang HY, Timpl R, Sasaki T, Chu ML, Ekblom P. Fibulin-1 and fibulin-2 expression during organogenesis in the developing mouse embryo. Dev Dyn. 1996;205:348–364. doi: 10.1002/(SICI)1097-0177(199603)205:3<348:AID-AJA13>3.0.CO;2-0. [DOI] [PubMed] [Google Scholar]
- 29.Perera S, Holt MR, Mankoo BS, Gautel M. Developmental regulation of MURF ubiquitin ligases and autophagy proteins nbr1, p62/SQSTM1 and LC3 during cardiac myofibril assembly and turnover. Dev Biol. 2011;351:46–61. doi: 10.1016/j.ydbio.2010.12.024. [DOI] [PMC free article] [PubMed] [Google Scholar]
- 30.Claessens A, Weyn C, Merregaert J. The cytoplasmic domain of chondrolectin interacts with the beta-subunit of Rab geranylgeranyl transferase. Cell Mol Biol Lett. 2008;13:250–259. doi: 10.2478/s11658-007-0052-8. [DOI] [PMC free article] [PubMed] [Google Scholar]
- 31.Weng L, Van Bockstaele DR, Wauters J, Van Marck E, Plum J, Berneman ZN, Merregaert J. A novel alternative spliced chondrolectin isoform lacking the transmembrane domain is expressed during T cell maturation. J Biol Chem. 2003;278:19164–19170. doi: 10.1074/jbc.M300653200. [DOI] [PubMed] [Google Scholar]
- 32.Weng L, Hubner R, Claessens A, Smits P, Wauters J, Tylzanowski P, Van Marck E, Merregaert J. Isolation and characterization of chondrolectin (Chodl), a novel C-type lectin predominantly expressed in muscle cells. Gene. 2003;308:21–29. doi: 10.1016/s0378-1119(03)00425-6. [DOI] [PubMed] [Google Scholar]
- 33.Enjin A, Rabe N, Nakanishi ST, Vallstedt A, Gezelius H, Memic F, Lind M, Hjalt T, Tourtellotte WG, Bruder C, Eichele G, Whelan PJ, Kullander K. Identification of novel spinal cholinergic genetic subtypes disclose Chodl and Pitx2 as markers for fast motor neurons and partition cells. J Comp Neurol. 2010;518: 2284–2304. doi: 10.1002/cne.22332. [DOI] [PubMed] [Google Scholar]
- 34.Yang G, Han Y, Tian X, Tao J, Sun M, Kang J, Yan C. Pattern of expression of the CREG gene and CREG protein in the mouse embryo. Mol Biol Rep. 2011;38:2133–2140. doi: 10.1007/s11033-010-0340-7. [DOI] [PubMed] [Google Scholar]
- 35.Veal E, Groisman R, Eisenstein M, Gill G. The secreted glycoprotein CREG enhances differentiation of NTERA-2 human embryonal carcinoma cells. Oncogene. 2000;19:2120–2128. doi: 10.1038/sj.onc.1203529. [DOI] [PubMed] [Google Scholar]
- 36.Sowpati DT, Thiagarajan D, Sharma S, Sultana H, John R, Surani A, Mishra RK, Khosla S. An intronic DNA sequence within the mouse Neuronatin gene exhibits biochemical characteristics of an ICR and acts as a transcriptional activator in Drosophila. Mech Dev. 2008;125:963–973. doi: 10.1016/j.mod.2008.08.002. [DOI] [PubMed] [Google Scholar]
- 37.Tsai NP, Tsui YC, Pintar JE, Loh HH, Wei LN. Kappa opioid receptor contributes to EGF-stimulated neurite extension in development. Proc Natl Acad Sci USA. 2010;107:3216–3221. doi: 10.1073/pnas.0912367107. [DOI] [PMC free article] [PubMed] [Google Scholar]
- 38.Vo BQ, Bloom AJ, Culican SM. Phr1 is required for proper retinocollicular targeting of nasal-dorsal retinal ganglion cells. Vis Neurosci. 2011;28:175–181. doi: 10.1017/S0952523810000386. [DOI] [PubMed] [Google Scholar]
- 39.Dong H, Yauk CL, Rowan-Carroll A, You SH, Zoeller RT, Lambert I, Wade MG. Identification of thyroid hormone receptor binding sites and target genes using ChIP-on-chip in developing mouse cerebellum. PLoS ONE. 2009;4:e4610. doi: 10.1371/journal.pone.0004610. [DOI] [PMC free article] [PubMed] [Google Scholar]
- 40.Maier V, Jolicoeur C, Rayburn H, Takegahara N, Kumanogoh A, Kikutani H, Tessier-Lavigne M, Wurst W, Friedel RH. Semaphorin 4C and 4G are ligands of Plexin-B2 required in cerebellar development. Mol Cell Neurosci. 2011;46:419–431. doi: 10.1016/j.mcn.2010.11.005. [DOI] [PMC free article] [PubMed] [Google Scholar]
- 41.Ge G, Greenspan DS. Developmental roles of the BMP1/TLD metalloproteinases. Birth Defects Res C Embryo Today. 2006;78:47–68. doi: 10.1002/bdrc.20060. [DOI] [PubMed] [Google Scholar]
- 42.Mehler MF, Mabie PC, Zhang D, Kessler JA. Bone morphogenetic proteins in the nervous system. Trends Neurosci. 1997;20:309–317. doi: 10.1016/s0166-2236(96)01046-6. [DOI] [PubMed] [Google Scholar]
- 43.Lewis GP, Linberg KA, Fisher SK. Neurite outgrowth from bipolar and horizontal cells after experimental retinal detachment. Invest Ophthalmol Vis Sci. 1998;39:424–434. [PubMed] [Google Scholar]
- 44.Mandal N, Lewis GP, Fisher SK, Heegaard S, Prause JU, la Cour M, Vorum H, Honore B. Protein changes in the retina following experimental retinal detachment in rabbits. Mol Vis. 2011;17:2634–2648. [PMC free article] [PubMed] [Google Scholar]
- 45.Hossain MN, Sakemura R, Fujii M, Ayusawa D. G-protein gamma subunit GNG11 strongly regulates cellular senescence. Biochem Biophys Res Commun. 2006;351:645–650. doi: 10.1016/j.bbrc.2006.10.112. [DOI] [PubMed] [Google Scholar]
- 46.Oyama F, Miyazaki H, Sakamoto N, Becquet C, Machida Y, Kaneko K, Uchikawa C, Suzuki T, Kurosawa M, Ikeda T, Tamaoka A, Sakurai T, Nukina N. Sodium channel beta4 subunit: down-regulation and possible involvement in neuritic degeneration in Huntington’s disease transgenic mice. J Neurochem. 2006;98:518–529. doi: 10.1111/j.1471-4159.2006.03893.x. [DOI] [PubMed] [Google Scholar]
- 47.Sano H, Peck GR, Kettenbach AN, Gerber SA, Lienhard GE. Insulin-stimulated GLUT4 protein translocation in adipocytes requires the Rab10 guanine nucleotide exchange factor Dennd4C. J Biol Chem. 2011;286:16541–16545. doi: 10.1074/jbc.C111.228908. [DOI] [PMC free article] [PubMed] [Google Scholar]
- 48.Bant JS, Raman IM. Control of transient, resurgent, and persistent current by open-channel block by Na channel beta4 in cultured cerebellar granule neurons. Proc Natl Acad Sci USA. 2010;107:12357–12362. doi: 10.1073/pnas.1005633107. [DOI] [PMC free article] [PubMed] [Google Scholar]
- 49.Brackenbury WJ, Isom LL. Na Channel beta Subunits: overachievers of the Ion Channel Family. Front Pharmacol. 2011;2:53. doi: 10.3389/fphar.2011.00053. [DOI] [PMC free article] [PubMed] [Google Scholar]
- 50.Biernaskie J, Corbett D, Peeling J, Wells J, Lei H. A serial MR study of cerebral blood flow changes and lesion development following endothelin-1-induced ischemia in rats. Magn Reson Med. 2001;46:827–830. doi: 10.1002/mrm.1263. [DOI] [PubMed] [Google Scholar]
- 51.Zhang RL, Chopp M, Chen H, Garcia JH. Temporal profile of ischemic tissue damage, neutrophil response, and vascular plugging following permanent and transient (2H) middle cerebral artery occlusion in the rat. J Neurol Sci. 1994;125:3–10. doi: 10.1016/0022-510x(94)90234-8. [DOI] [PubMed] [Google Scholar]
- 52.Katsman D, Zheng J, Spinelli K, Carmichael ST. Tissue microenvironments within functional cortical subdivisions adjacent to focal stroke. J Cereb Blood Flow Metab. 2003;23:997–1009. doi: 10.1097/01.WCB.0000084252.20114.BE. [DOI] [PubMed] [Google Scholar]
- 53.Lipton P. Ischemic cell death in brain neurons. Physiol Rev. 1999;79:1373–1430. doi: 10.1152/physrev.1999.79.4.1431. [DOI] [PubMed] [Google Scholar]
- 54.Han Y, Wu G, Deng J, Tao J, Guo L, Tian X, Kang J, Zhang X, Yan C. Cellular repressor of E1A-stimulated genes inhibits human vascular smooth muscle cell apoptosis via blocking P38/JNK MAP kinase activation. J Mol Cell Cardiol. 2010;48:1225–1235. doi: 10.1016/j.yjmcc.2009.12.018. [DOI] [PubMed] [Google Scholar]
- 55.Nix P, Hisamoto N, Matsumoto K, Bastiani M. Axon regeneration requires coordinate activation of p38 and JNK MAPK pathways. Proc Natl Acad Sci USA. 2011;108:10738–10743. doi: 10.1073/pnas.1104830108. [DOI] [PMC free article] [PubMed] [Google Scholar]
- 56.Ponta H, Sherman L, Herrlich PA. CD44: from adhesion molecules to signalling regulators. Nat Rev Mol Cell Biol. 2003;4: 33–45. doi: 10.1038/nrm1004. [DOI] [PubMed] [Google Scholar]
- 57.Sretavan DW, Feng L, Pure E, Reichardt LF. Embryonic neurons of the developing optic chiasm express L1 and CD44, cell surface molecules with opposing effects on retinal axon growth. Neuron. 1994;12:957–975. doi: 10.1016/0896-6273(94)90307-7. doi:0896-6273(94)90307-7. [DOI] [PMC free article] [PubMed] [Google Scholar]
- 58.El Messari S, Ait-Ikhlef A, Ambroise DH, Penicaud L, Arluison M. Expression of insulin-responsive glucose transporter GLUT4 mRNA in the rat brain and spinal cord: an in situ hybridization study. J Chem Neuroanat. 2002;24:225–242. doi: 10.1016/s0891-0618(02)00058-3. S0891061802000583. [DOI] [PubMed] [Google Scholar]
- 59.Park S, Hong YW. Transcriptional regulation of artemin is related to neurite outgrowth and actin polymerization in mature DRG neurons. Neurosci Lett. 2006;404:61–66. doi: 10.1016/j.neulet.2006.05.041. [DOI] [PubMed] [Google Scholar]
- 60.Zhang Z, Chen TY, Kirsch JR, Toung TJ, Traystman RJ, Koehler RC, Hurn PD, Bhardwaj A. Kappa-opioid receptor selectivity for ischemic neuroprotection with BRL 52537 in rats. Anesth Analg. 2003;97:1776–1783. doi: 10.1213/01.ANE.0000087800.56290.2E. [DOI] [PubMed] [Google Scholar]
- 61.Chen R, Cohen LG, Hallett M. Nervous system reorganization following injury. Neuroscience. 2002;111:761–773. doi: 10.1016/s0306-4522(02)00025-8. [DOI] [PubMed] [Google Scholar]
- 62.Stroemer RP, Kent TA, Hulsebosch CE. Acute increase in expression of growth associated protein GAP-43 following cortical ischemia in rat. Neurosci Lett. 1993;162:51–54. doi: 10.1016/0304-3940(93)90557-2. [DOI] [PubMed] [Google Scholar]
- 63.Carmichael ST, Chesselet MF. Synchronous neuronal activity is a signal for axonal sprouting after cortical lesions in the adult. J Neurosci. 2002;22:6062–6070. doi: 10.1523/JNEUROSCI.22-14-06062.2002. [DOI] [PMC free article] [PubMed] [Google Scholar]
- 64.Dancause N, Barbay S, Frost SB, Zoubina EV, Plautz EJ, Mahnken JD, Nudo RJ. Effects of small ischemic lesions in the primary motor cortex on neurophysiological organization in ventral premotor cortex. J Neurophysiol. 2006;96:3506–3511. doi: 10.1152/jn.00792.2006. [DOI] [PubMed] [Google Scholar]
- 65.Tran TS, Kolodkin AL, Bharadwaj R. Semaphorin regulation of cellular morphology. Annu Rev Cell Dev Biol. 2007;23:263–292. doi: 10.1146/annurev.cellbio.22.010605.093554. [DOI] [PubMed] [Google Scholar]
- 66.Paradis S, Harrar DB, Lin Y, Koon AC, Hauser JL, Griffith EC, Zhu L, Brass LF, Chen C, Greenberg ME. An RNAi-based approach identifies molecules required for glutamatergic and GABAergic synapse development. Neuron. 2007;53:217–232. doi: 10.1016/j.neuron.2006.12.012. [DOI] [PMC free article] [PubMed] [Google Scholar]
- 67.Williams-Hogarth LC, Puche AC, Torrey C, Cai X, Song I, Kolodkin AL, Shipley MT, Ronnett GV. Expression of semaphorins in developing and regenerating olfactory epithelium. J Comp Neurol. 2000;423:565–578. doi: 10.1002/1096-9861(20000807)423:4<565:AID-CNE3>3.0.CO;2-F. [DOI] [PubMed] [Google Scholar]
- 68.Leandro-Garcia LJ, Leskela S, Landa I, Montero-Conde C, Lopez-Jimenez E, Leton R, Cascon A, Robledo M, Rodriguez-Antona C. Tumoral and tissue-specific expression of the major human beta-tubulin isotypes. Cytoskeleton (Hoboken) 2010;67:214–223. doi: 10.1002/cm.20436. [DOI] [PubMed] [Google Scholar]
- 69.Hopkins DR, Keles S, Greenspan DS. The bone morphogenetic protein 1/Tolloid-like metalloproteinases. Matrix Biol. 2007;26:508–523. doi: 10.1016/j.matbio.2007.05.004. [DOI] [PMC free article] [PubMed] [Google Scholar]
- 70.Liu QR, Hattar S, Endo S, MacPhee K, Zhang H, Cleary LJ, Byrne JH, Eskin A. A developmental gene (Tolloid/BMP-1) is regulated in Aplysia neurons by treatments that induce long-term sensitization. J Neurosci. 1997;17:755–764. doi: 10.1523/JNEUROSCI.17-02-00755.1997. [DOI] [PMC free article] [PubMed] [Google Scholar]
- 71.Kawamata T, Ren J, Chan TC, Charette M, Finklestein SP. Intracisternal osteogenic protein-1 enhances functional recovery following focal stroke. NeuroReport. 1998;9:1441–1445. doi: 10.1097/00001756-199805110-00035. [DOI] [PubMed] [Google Scholar]
- 72.Withers GS, Higgins D, Charette M, Banker G. Bone morphogenetic protein-7 enhances dendritic growth and receptivity to innervation in cultured hippocampal neurons. Eur J Neurosci. 2000;12:106–116. doi: 10.1046/j.1460-9568.2000.00889.x. ejn889. [DOI] [PubMed] [Google Scholar]
- 73.Parikh P, Hao Y, Hosseinkhani M, Patil SB, Huntley GW, Tessier-Lavigne M, Zou H. Regeneration of axons in injured spinal cord by activation of bone morphogenetic protein/Smad1 signaling pathway in adult neurons. Proc Natl Acad Sci USA. 2011;108:E99–E107. doi: 10.1073/pnas.1100426108. [DOI] [PMC free article] [PubMed] [Google Scholar]
- 74.Cho JH, Saini DK, Karunarathne WK, Kalyanaraman V, Gautam N. Alteration of Golgi structure in senescent cells and its regulation by a G protein gamma subunit. Cell Signal. 2011;23: 785–793. doi: 10.1016/j.cellsig.2011.01.001. [DOI] [PMC free article] [PubMed] [Google Scholar]
- 75.Balcueva EA, Wang Q, Hughes H, Kunsch C, Yu Z, Robishaw JD. Human G protein gamma(11) and gamma(14) subtypes define a new functional subclass. Exp Cell Res. 2000;257:310–319. doi: 10.1006/excr.2000.4893. [DOI] [PubMed] [Google Scholar]
- 76.McIntire WE, MacCleery G, Murphree LJ, Kerchner KR, Linden J, Garrison JC. Influence of differential stability of G protein betagamma dimers containing the gamma11 subunit on functional activity at the M1 muscarinic receptor, A1 adenosine receptor, and phospholipase C-beta. Biochemistry. 2006;45:11616–11631. doi: 10.1021/bi0604882. [DOI] [PubMed] [Google Scholar]
- 77.Morishita R, Ueda H, Kato K, Asano T. Identification of two forms of the gamma subunit of G protein, gamma10 and gamma11, in bovine lung and their tissue distribution in the rat. FEBS Lett. 1998;428:85–88. doi: 10.1016/s0014-5793(98)00498-0. S0014-5793(98)00498-0. [DOI] [PubMed] [Google Scholar]
- 78.Paxinos G, Watson C. The Rat Brain in Stereotaxic Coordinates. Academic Press Inc; San Diego, CA: 1986. [Google Scholar]