

Abstract
While Helicobacter pylori infects over 50% of the world's population, the mechanisms involved in the development of gastric disease are not fully understood. Bacterial, host, and environmental factors play a role in disease outcome. To investigate the role of bacterial factors in H. pylori pathogenesis, global gene expression of six H. pylori isolates was analyzed during coculture with gastric epithelial cells. Clustering analysis of six Colombian clinical isolates from a region with low gastric cancer risk and a region with high gastric cancer risk segregated strains based on their phylogeographic origin. One hundred forty-six genes had increased expression in European strains, while 350 genes had increased expression in African strains. Differential expression was observed in genes associated with motility, pathogenicity, and other adaptations to the host environment. European strains had greater expression of the virulence factors cagA, vacA, and babB and were associated with increased gastric histologic lesions in patients. In AGS cells, European strains promoted significantly higher interleukin-8 (IL-8) expression than did African strains. African strains significantly induced apoptosis, whereas only one European strain significantly induced apoptosis. Our data suggest that gene expression profiles of clinical isolates can discriminate strains by phylogeographic origin and that these profiles are associated with changes in expression of the proinflammatory and protumorigenic cytokine IL-8 and levels of apoptosis in host epithelial cells. These findings support the hypothesis that bacterial factors determined by the phylogeographic origin of H. pylori strains may promote increased gastric disease.
INTRODUCTION
Helicobacter pylori infects over 50% of the world's population and has been associated with the development of gastritis, ulcers, and gastric cancer (1). In spite of its high prevalence, chronic H. pylori infection leads to clinical symptoms in approximately 20% of infected individuals, with only 1 to 2% developing gastric adenocarcinoma. The mechanisms evoked in H. pylori pathogenesis remain incompletely characterized but suggest that host, environmental, and bacterial factors determine the outcome of H. pylori infection.
Among the bacterial factors associated with H. pylori-associated disease, genes utilized for motility/chemotaxis(2–4), acid acclimation(5–6), adherence to the mucosa (7), and damaging host epithelial cells(8–9) are necessary for H. pylori colonization of the gastric mucosa and have been associated with increased risk of clinically relevant gastric disease (1). The absence of these virulence factors results in reduced pathogenicity or inability of H. pylori to colonize (2–4, 6–7). The best-known virulence factor in H. pylori is the cytotoxin-associated gene A (CagA) (10–11). CagA is translocated into the host cells via a type IV secretion system (T4SS), whereby it becomes phosphorylated by tyrosine kinases. CagA modulates eukaryotic signaling networks, leading to hyperproliferation, inflammation, apoptosis, and cancer (12–14). However, current determination of the potential virulence of H. pylori strains is performed by PCR genotyping of virulence factors such as cagA, vacA, and babA (1, 9, 15) and does not account for bacterial gene expression levels, which may affect the pathological outcome in the host (16). Previous microarray studies, both in vitro and in vivo, have focused on the effects of the environment or the host on strains of H. pylori and their isogenic mutants (17–23). The current study is the first to compare expression profiles of multiple clinical isolates of H. pylori interacting with host cells.
Variation between H. pylori strains may partly account for differences in gastric cancer incidence rates in different locations worldwide. In Colombia, there is a greater than 90% prevalence of H. pylori infection, but geographically distinct areas differ greatly in gastric cancer incidence (24–25). Colombian populations in the high Andes have a higher incidence of gastric cancer associated with H. pylori, while coastal populations have a reduced incidence of gastric cancer (25). Multilocus sequence typing (MLST) analysis of Colombian H. pylori strains from these regions have revealed an association between strains from high-risk areas and ancestral European strains of H. pylori, while strains from low-risk regions are mostly associated phylogenetically with African strains (26). However, the mechanisms by which these genetic changes mediate greater virulence have not been characterized.
In the present study, six clinical isolates from regions with low and high incidence of gastric cancer were analyzed using an H. pylori microarray to determine differences in expression associated with increased gastric cancer risk. Comparison of the H. pylori strains based on phylogeographic origin identified 496 genes that were differentially expressed between European and African strains. While all strains in the study are cagA+ and vacA s1m1, there is an upregulation of key virulence factors (cagA and vacA) in European strains. Expression differences were also observed in genes associated with bacterial survival within the host, such as acid acclimation, detoxification, and motility genes. Analysis of interleukin-8 (IL-8) expression and apoptosis in gastric epithelial cells cocultured with the isolates demonstrated that European strains increase host IL-8 expression while reducing induction of apoptosis. These findings support histopathologic data describing more-severe gastric lesions in patients infected with European strains than in patients infected with African strains. These data suggest that differential expression of bacterial factors greatly affect host-pathogen interactions and may play an important role in carcinogenesis.
MATERIALS AND METHODS
Bacteria and cells.
Helicobacter pylori isolates PZ5004, PZ5024, PZ5026, PZ5056, PZ5080, and PZ5086 were cultured on blood agar (tryptic soy agar [TSA] with sheep blood; Remel, Lenexa, KS) or brucella broth with 5% fetal bovine serum under microaerobic conditions (10% H2, 10% CO2, 80% N2). Bacteria for microarray and motility experiments were collected after 18 h of growth in liquid culture. Growth curve experiments demonstrated that all six strains were in log phase and active at this time point (see Fig. S1 in the supplemental material). These cagA+ vacA s1m1 strains were isolated from Colombian patients (ages ranging from 47 to 55) from low- and high-risk regions and have been characterized previously by MLST and for the presence of virulence factors (26, 27). Human gastric cancer (AGS) cells (CRL-1739; ATCC, Manassas, VA) were grown in phenol red-free Dulbecco's modified Eagle medium (DMEM) and Ham's F12-K with 10% fetal bovine serum. Confluent AGS cells were infected at a multiplicity of infection (MOI) of 100 and incubated at 5% CO2 for the predetermined time.
Microarray design.
Seven annotated H. pylori genomes (26695 [NC_000915], J99 [NC_000921], HPAG1 [NC_008086 and NC_008087], B38 [NC_012973], P12 [NC_011498 and NC_011499], G27 [NC_011333 and NC_011334], and Shi470 [NC_010698]) were utilized to design probes using the Agilent eArray software (Agilent Technologies, Santa Clara, CA). Individual 60-bp oligonucleotide probes were designed for each gene within a genome. Additionally, 60-mer oligonucleotide probes were designed based on previously published sequences of H. pylori probes used by the Pathogen Functional Genomics Resource Center (pfgrc.jcvi.org). The accuracy of the probes was checked by using BLAST (28) prior to printing by Agilent. A total of 10,844 unique H. pylori genes, as defined by their Entrez IDs, were targeted. Multiple probes per Entrez ID were designed for genes in strains 26695 and J99 for a total of 14,987 probes per array. The ability of the microarray to detect enriched prokaryotic RNA was then tested. Total RNAs from AGS cells as well as from AGS cells infected with H. pylori strains ATCC 43504 or SS1 were processed using a Microbenrich kit (Applied Biosystems, Foster City, CA), which excluded eukaryotic mRNA and rRNA. RNA samples with and without prokaryotic RNA enrichment were then hybridized to the custom H. pylori microarrays (see Fig. S2 in the supplemental material). Minimal hybridization occurred from the eukaryotic samples, while hybridization was observed with H. pylori samples regardless of enrichment (see Fig. S2).
Generating microarray data.
Bacterial RNA for analysis was collected from three biological replicates per clinical isolate for a total of 18 samples. Following coculture of H. pylori and AGS cells for 1 h, RNAProtect Bacteria (Qiagen, Germantown, MD) was added to the culture media at a 2:1 ratio to prevent RNA degradation. AGS cells were scraped and allowed to incubate prior to collection by centrifugation at 5,000 × g for 10 min (Sorvall RC5b plus). RNA was extracted following the RNeasy Mini Kit with RNase-free DNase treatment (Qiagen). Total prokaryotic and eukaryotic RNA was further processed using the Microbenrich kit, which excluded eukaryotic mRNA and rRNA. The quality of the RNA was determined with the Agilent 2100 Bioanalyzer using an RNA 6000 Nano total RNA kit (Agilent Technologies) before and after the Microbenrich step to determine the removal of eukaryotic RNA. Total RNA was hybridized to the custom Agilent 8x15K H. pylori Microarrays following the “One-Color Microarray-Based Gene expression Analysis, Low Input Quick Amp Labeling” protocol. Briefly, the method utilizes a T7 RNA polymerase that amplifies RNA to cRNA while incorporating cyanine 3-labeled CTP. Cy-3 incorporation and cRNA levels were measured with a NanoDrop ND-1000 UV-Vis Spectrophotometer (NanoDrop Technologies, Inc., Wilmington, DE). Arrays were scanned using an Agilent Microarray Scanner, and data were extracted using Feature Extraction 9.1.
Processing of raw microarray data.
Processing of the raw gene expression data was performed using the limma library in R (29). Microarray data were first corrected for background and then normalized by quantile using the NormalizeBetweenArrays function (30). Data were log2 transformed.
Unsupervised clustering analysis was performed on the complete 14,987-probe data set using the R package pvclust (31).
Genomic sequencing and selection of reduced probe set for expression analysis.
The six isolates were grown on blood agar plates for 3 days, and the bacteria were resuspended in 200 μl of phosphate-buffered saline (PBS). DNA was extracted using a Roche High Pure PCR template preparation kit, followed by RNase treatment (RiboShredder RNase Blend [Epicentre]) and cleanup with the High Pure PCR template preparation kit. Samples were submitted to the BioMicro Center at MIT for next-generation sequencing using an Illumina MiSeq system. Briefly, samples were sonicated using Covaris S220 (Covaris Inc., Woburn, MA). Illumina libraries were constructed using the SPRI-TE robot (Beckman Coulter Inc., Danvers, MA) according to the manufacturer's protocol. Samples were size selected for a 200- to 400-bp range using a BluePippin (Sage Science, Beverly, MA). Samples were quantified and pooled using the LC480 (Roche) and loaded on the Illumina MiSeq for sequencing. The 150-bp paired-end sequencing results generated by MiSeq from the six samples were aligned to the seven H. pylori reference genomes from which the gene expression probe sequences were derived using Bowtie2.0.6 (32). The aligned data were then used to perform variant calling using SAMtools mpileup (33). mpileup files were processed and filtered to generate high-quality variants (depth, >10; quality, >10; and homozygous for variant). The microarray probe sequences were then aligned to the reference genome from which they were designed using BLASTN (34). To determine the number of variants in each clinical isolate compared to the microarray probes, the high-quality variants that mapped to the probe regions were aggregated. Gene expression probes were selected if they had 0 or 1 variant compared within the 60-nucleotide probe sequence across the six samples. This probe set was further reduced by collapsing multiple expression values from probes with identical sequences to a single averaged expression value.
Analysis of H. pylori mRNA expression.
Significance analysis was performed using significance analysis of microarrays (SAM) (35) with the set of probes with 0 to 1 mismatch per probe across all six samples, and the groups were determined by the clustering analysis in a two-class unpaired analysis. SAM was implemented for stringent gene selection criteria using a d value, the test statistic used by SAM, of 1.32, which gave a false-discovery rate (FDR) of 0.433% or 0.43 false positives for every 100 genes called. This FDR rate and a 1.5-fold change were used as cutoffs to generate the list of differentially expressed genes comparing the H. pylori strains. Differentially expressed genes that were assayed by multiple probes were reported as a single gene using the probe with the lowest q value. Fifteen genes were reported as upregulated in both groups by different probes and were removed from the analysis. Sets of differentially expressed genes were further classified using data from the COG classification of H. pylori (36), the eggNOG database (37), and previous publications (17, 23).
IL-8 expression.
Human gastric cancer (AGS) cells were seeded at 1 × 10⁶/well in 6-well plates. Cells were cocultured with clinical strains for 6 h. Total RNA was isolated using TRIzol reagent, and 2 μg of RNA from each sample was reverse transcribed as described previously (38). For IL-8 PCR, the primers used were as follows: sense, (5′-TAGCAAAATTGAGGCCAAGG-3′), and antisense, (5′-AAACCAAGGCACAGTGGAAC-3′). Real-time PCR was performed using SYBR green. One PCR cycle consisted of the following: 94°C for 1 min, 62°C for 1.5 min, and 72°C for 1.8 min. Relative expression of IL-8 was determined using β-actin as the internal control as described previously (38).
Assessment of apoptosis.
Apoptosis was assayed using an annexin V-fluorescein isothiocyanate apoptosis detection kit (Oncogene Research Products, San Diego, CA) according to the manufacturer's instructions and as described previously (39). Cells (2.5 × 10⁶) were stained and acquired by flow cytometry using a Becton, Dickinson LSR II, and apoptosis was analyzed on the acquired cells with FlowJo software, as described previously (39).
Motility analysis.
Liquid cultures of the 6 Colombian isolates were resuspended in pH 7.0 brucella broth. Motility was monitored by live phase-contrast microscopy, and 300 frames were imaged with a Qimaging Qiclick video camera and Image-Pro Plus software. The resulting images were analyzed for bacterial movement using NIH ImageJ and the Difference Tracker plugin (40). Track data for each particle were further processed using Excel to compute mean speed and displacement. Bacteria had to be followed for at least eight consecutive frames to be considered in the analysis, and at least 300 tracks were analyzed per strain.
Microarray data accession numbers.
Raw and normalized data are available at the National Center for Biotechnology Information Gene Expression Omnibus (www.ncbi.nlm.nih.gov/geo/), series record GSE41497.
RESULTS
Clustering analysis classifies H. pylori strains by phylogeographic origin and not geography.
To explore the utility of gene expression profiling in classifying H. pylori strains, three H. pylori strains from a Colombian region with high gastric cancer incidence (PZ5056, PZ5080, and PZ5086) and three strains from a Colombian region with low gastric cancer incidence (PZ5004, PZ5024, and PZ5026) were analyzed after infecting AGS cells for 1 h. Three separate infections were performed for each isolate (n = 3 for each strain). Unsupervised clustering of the entire microarray data set for the 18 arrays correctly clustered the three replicate infections for each strain, demonstrating the reproducibility of the coculture system and subsequent processing of RNA (Fig. 1). The six strains were then grouped into two main clusters with two low-risk strains (PZ5004 and PZ5024) clustering together, while the remaining strains (three high-risk strains as well as one low-risk strain [PZ5026]) clustered together (Fig. 1). The second cluster was further subdivided into two clusters, with two closely related high-risk strains (PZ5080 and PZ5086) in one group and a low-risk strain (PZ5026) and a high-risk strain (PZ5056) in the other. These clusters had scores of >99 in pvclust, implying strong support in the data set. It has been previously reported that PZ5026 and the three high-risk strains in the study have ancestral European origins, while PZ5004 and PZ5024 are of African origin (26). Therefore, unsupervised analysis of transcriptomes showed that there are distinct gene expression patterns associated with the phylogeographic origin of H. pylori strains.
Fig 1.
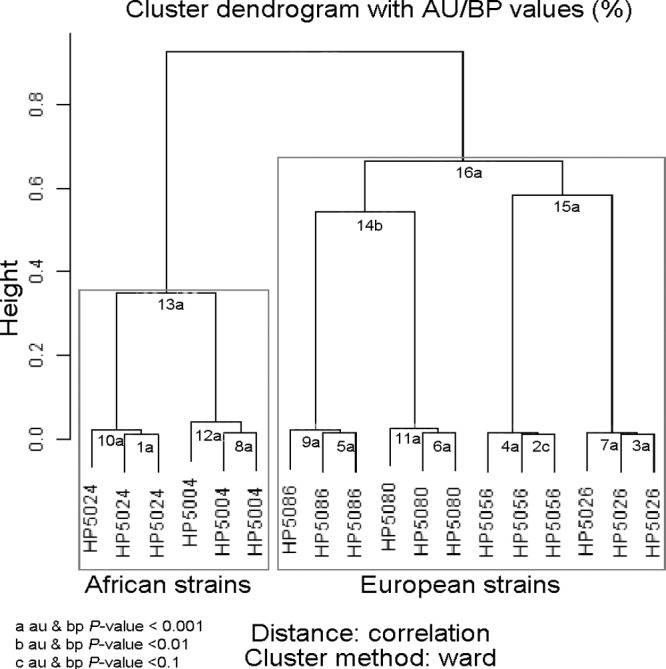
Clustering analysis of 6 Colombian isolates. Microarray data from three strains from a low gastric cancer risk area (PZ5004, PZ5024, and PZ5026) and three strains from a high gastric cancer risk area (PZ5056, PZ5080, and PZ5086) were assessed in triplicate. The dendrogram's edges are represented by numbers, and letters denote the P values for the edge (au/bp). Approximately unbiased P value (au) is based on multiscale bootstrap resampling, and bootstrap probability P value (bp) is based on normal bootstrap sampling. a, au & bp P value, <0.001; b, au & bp P value, <0.01; c, au & bp P value, <0.1.
Analysis of gene expression profiles for significance.
As hierarchical clustering demonstrated that strain origin was a key factor in gene expression, differences in expression between strains of African origin (n = 2) and strains of European origin (n = 4) were evaluated. Due to considerable variation in gene sequence and gene content between H. pylori strains, we first set out to quantify the similarity between the reference strains used to design the microarray and the strains being profiled. Following next-generation sequencing of all six strains, we performed variant calling to compare the genomic sequence of the Colombian isolates to the probes designed from seven reference H. pylori genomes. A total of 4,126 unique probes were selected for gene expression analysis based on the established criteria of having 0 to 1 mismatch over the probe region across all six strains (see Table S1 in the supplemental material). These 4,126 unique probes measured expression of genes present in all strains using probes with >98.3% identity. Using SAM to identify genes with a 1.5-fold change cutoff at a 0.43% false-discovery rate, European strains had increased expression of 146 genes and decreased expression of 350 genes compared to their African counterparts. The complete list of differentially expressed genes is provided in Table S2 in the supplemental material. Of the 146 genes with increased expression in strains of European origin, 89 were genes of known function and the remaining 57 had unknown function. Of the 350 genes with decreased expression in the European strains, 163 had known function and 187 were of unknown function. Genes with known function are summarized in Fig. 2. Analysis of the differentially expressed genes revealed distinct patterns of host adaptation between the European and African strains. We observed differences in genes ascribed for virulence, motility, and adapting to the host environment.
Fig 2.

Functional analysis of genes with increased expression by strain origin: 89 of 146 genes with increased expression in European strains (gray) and 163 of 350 genes with increased expression in African strains (black) had assigned functions.
Virulence genes.
Genes associated with virulence, adhesion, and transformation were analyzed to determine differences that might affect pathogenesis. European strains had significantly higher expression of babB, vacA, and cagA than did African strains, given a false-discovery rate of 0.43%. In addition, European strains also increased expression of two other components of the Cag-type IV secretion system (Cag-T4SS), cag4 and a regulator of VirB11 (HP1451) (41–42), and a natural transformation gene, comH (43). In contrast, African strains increased expression of the genes of other known virulence factors (tumor necrosis factor [TNF-α]-inducing protein [tipα], neutrophil activating protein[(napA], and a VacA-like protein). African strains also had increased expression of Cag-T4SS components (cagQ, cagX, tnpB, comB2, comB8-2, virB2-2, virB7-2, virB9, virB9-2, and virB10-1).
Motility.
Ten genes involved in motility and chemotaxis were differentially expressed between the two groups (Tables 1 and 2). European strains had increased expression of the flagellar hook (flgD), as well as the filament cap (fliD) and a gene encoding a methyl-accepting protein associated with chemotaxis (tlpC). African strains had increased expression of substructural subunits of the flagellum (flaA), a component of the type III secretion system (fliH), and genes that aid in flagellar export/secretion (fliS, flhB, and flhB2). African strains also had increased transcription of tlpB, another chemotaxis-associated gene. The luxS gene, which helps regulate motility in H. pylori, was also differentially expressed in African strains(44–46).
Table 1.
Select genes with increased expression in European strainsa
| Entrez ID | Gene name | Fold change in gene expression (Eur/Afr) | COG FC | COG ID | COG description | Ontology |
|---|---|---|---|---|---|---|
| 8208115 | Aldo-keto reductase (HELPY_1166) | 455.23 | C | COG0667 | Predicted oxidoreductases | Acid acclimation |
| 7009865 | ansB | 2.11 | EJ | COG0252 | l-asparaginase | Energy metabolism |
| 889799 | babB | 4.09 | N | COG5651 | PPE-repeat proteins | Cell envelope |
| 900205 | cag4 | 181.39 | Cellular processes | |||
| 889201 | cagA | 648.00 | S | proNOG56164 | Cellular processes | |
| 6964369 | comH | 2.16 | S | proNOG39791 | Cellular processes | |
| 900277 | dsbC | 2.29 | O | COG2143 | Thioredoxin-related protein | Cellular processes |
| 6963751 | flgD | 2.38 | N | COG1843 | Flagellar hook capping protein | Motility/chemotaxis |
| 7009897 | fliD | 2.11 | N | COG1345 | Flagellar capping protein | Motility/chemotaxis |
| 7010018 | mviN | 2.20 | R | COG0728 | Putative virulence factor | |
| 899547 | pqqE | 1.95 | R | COG0612 | Predicted Zn-dependent peptidases | Translation |
| 7010060 | recR | 2.09 | L | COG0353 | Recombinational DNA repair protein (RecF pathway) | DNA metabolism |
| 6296551 | ruvC | 2.85 | L | COG0817 | Holliday junction resolvasome, endonuclease subunit | DNA metabolism |
| 890393 | tlpC | 2.28 | NT | COG0840 | Methyl-accepting chemotaxis protein | Motility/chemotaxis |
| 890075 | vacA | 5.37 | N | COG5651 | PPE-repeat proteins | Cellular processes |
| 899842 | VirB11-interacting protein (HP1451) | 4.88 | R | COG1847 | Predicted RNA-binding protein | Cellular processes |
| 6297539 | VirB11-like protein (HPSH_04300) | 2.06 | NU | COG0630 | T4SS pathway, VirB11 components | Cellular processes |
As calculated by SAM software. COG, cluster of orthologous groups; Eur/Afr, European/African; FC, functional categories, as described previously (36); T4SS, type IV secretion system.
Table 2.
Select genes with increased expression in African strainsa
| Gene ID | Gene name | Fold change (Eur/Afr) | COG FC | COG ID | COG descriptor | Ontology |
|---|---|---|---|---|---|---|
| 7010039 | ackA | 0.362 | C | COG0282 | Acetate kinase | Energy metabolism |
| 7010646 | addB | 0.333 | R | COG0457 | FOG: TPR repeat | DNA metabolism |
| 8208413 | amiF | 0.437 | R | COG0388 | Predicted amidohydrolase | Acid acclimation |
| 900043 | cagQ | 0.089 | Cellular processes | |||
| 889138 | cagX | 0.075 | U | COG3504 | T4SS, VirB9 comp. | Cellular processes |
| 889393 | Chlorohydrolase (jhp0252) | 0.636 | FR | COG0402 | Cytosine deaminase & metal-dependent hydrolases | Cellular processes |
| 899094 | comB2 | 0.376 | U | COG3504 | T4SS, VirB9 comp. | Cellular processes |
| 889572 | comB8-2 | 0.119 | U | COG3736 | T4SS, VirB8 comp. | Cellular processes |
| 889872 | comL | 0.237 | R | COG4105 | DNA uptake lipoprotein | Cellular processes |
| 899977 | flaA | 0.634 | N | COG1344 | Flagellin and hook-associated proteins | Cell envelope |
| 890192 | flhB | 0.085 | NU | COG1377 | Flagellar biosynthesis pathway FlhB | Motility/chemotaxis |
| 889278 | flhB2 | 0.149 | S | COG2257 | Homolog of cytoplasmic domain of flagellar protein FlhB | Motility/chemotaxis |
| 4099357 | fliH | 0.097 | NU | COG1317 | Flagellar biosynthesis/T3SS protein | Cell envelope |
| 899333 | fliS | 0.161 | NUO | COG1516 | Flagellin-specific chaperone FliS | Cell envelope |
| 889257 | frdA | 0.127 | C | COG1053 | Succinate dehydrogenase/fumarate reductase, flavoprotein subunit | Energy metabolism |
| 899445 | frpB | 0.393 | P | COG1629 | Outer membrane receptor proteins, mostly Fe transport | Transport |
| 890331 | frxA | 0.053 | C | COG0778 | Nitroreductase | Energy metabolism |
| 7009855 | homA | 0.224 | NOG127861 | |||
| 899404 | katA | 0.364 | P | COG0753 | Catalase | Cellular processes |
| 889399 | luxS | 0.536 | T | COG1854 | Involved in autoinducer AI2 synthesis | Hypothetical |
| 4098910 | napA | 0.523 | P | COG0783 | DNA-binding ferritin-like protein/oxidation damage protectant | Transport |
| 4097953 | recO | 0.521 | S | NOG12171 | Recombination protein RecO | DNA metabolism |
| 7010016 | ruvA | 0.576 | L | COG0632 | Holliday junction resolvasome, DNA-binding subunit | DNA metabolism |
| 6963912 | sodB | 0.644 | P | COG0605 | Superoxide dismutase | Cellular processes |
| 4099196 | tlpB | 0.398 | NT | COG0840 | Methyl-accepting chemotaxis protein | Motility/chemotaxis |
| 898902 | tnpB | 0.01 | L | COG0675 | Transposase and inactivated derivatives | Cellular processes |
| 889164 | tipα | 0.043 | NOG135792 | |||
| 7010440 | ureG | 0.629 | OK | COG0378 | Ni2+-binding GTPase involved in urease and hydrogenase | Acid acclimation |
| 899290 | VacA-like protein (HP0610) | 0.396 | N | COG5651 | PPE-repeat proteins | Cell envelope |
| 889564 | virB10-1 | 0.474 | U | COG2948 | T4SS pathway-VirB10 comp. | Cellular processes |
| 7011076 | virB2-2 | 0.185 | Cellular processes | |||
| 7011080 | virB7-2 | 0.666 | Cellular processes | |||
| 889322 | virB9 | 0.234 | U | COG3504 | T4SS pathway, VirB9 comp. | Cellular processes |
| 7011082 | virB9-2 | 0.312 | U | COG3504 | T4SS pathway, VirB9 comp. | Cellular processes |
As calculated by SAM software. COG, cluster of orthologous groups; Eur/Afr, European/African; FC, functional categories, as described previously (36); T4SS, type IV secretion system.
Host-pathogen interactions.
European and African strains also expressed different genes that might aid in adapting to the host environment. In the stomach, host-derived stresses could include changes in pH, exposure to reactive oxygen and nitrogen species (RONS), and DNA damage. In our coculture system, acid acclimation genes for formamidase (amiF) and a urease accessory protein (ureG) had increased expression in African strains, while asparaginase (ansB) had higher expression in European strains. African strains also had higher expression of lepA, a gene that encodes GTP-binding membrane protein, and atpF, the FoF1-type ATP synthase gene; while European strains had higher expression of the aldo-keto reductase (HELPY_1166) gene. While not canonical acid acclimation genes, these three genes have been reported to be required for H. pylori growth under acidic conditions (47). European strains expressed DNA repair proteins (recR and ruvC) at a higher level, while African strains increased expression of genes that would protect against RONS, such as those encoding flavodoxin (fldA), superoxide dismutase (sodB), and catalase (katA), and that would mediate DNA repair (recO and ruvA). African strains also expressed more fumarate reductase (frdA), which has been previously identified as necessary for colonization in vivo (48).
Lack of correlation between bacterial movement and strain origin.
To determine whether differences in strain origin and expression of motility genes would result in a phenotypic change in H. pylori motility, we conducted videomicroscopy of H. pylori motility when the strains were exposed to pH 7.0 brucella broth. Analysis of the six strains showed that all six strains were motile. Average speed and displacement were calculated for each strain and were found to be independent of strain origin (Table 3).
Table 3.
Analysis of H. pylori motilitya
| H. pylori strain | Mean speed (μm/s) ± SD | Mean displacement (μm) ± SD |
|---|---|---|
| PZ5004 | 29.3 ± 17.1 | 23.5 ± 21.2 |
| PZ5024 | 11.8 ± 6.2 | 7.6 ± 9.4 |
| PZ5026 | 11.7 ± 6.2 | 5.3 ± 5.7 |
| PZ5056 | 20.9 ± 7.9 | 10.4 ± 8.1 |
| PZ5080 | 11.6 ± 6.2 | 5.2 ± 6.4 |
| PZ5086 | 9.6 ± 5.2 | 4.1 ± 5.7 |
H. pylori strains grown in liquid culture were resuspended in pH 7.0 brucella broth and imaged. Bacterial movement was analyzed using particle tracking software in ImageJ. A minimum of 300 tracks were analyzed for each strain, with each track defined as one bacterium tracked in at least 8 consecutive frames.
Correlation of cagA in coculture with histopathological findings.
Due to the association of CagA with gastric carcinoma, cagA expression levels in the coculture system were compared to previously published data on the histologic lesions in the patients from which the clinical isolates were derived(26–27). Higher levels of cagA mRNA in the coculture system were observed in strains isolated from patients with increased histopathological scores (Table 4 and Fig. 3), and the correlation for these data sets is 0.83 (Spearman), indicating a strong positive relationship.
Table 4.
cagA expression in coculture and patient data
| Strain ID | cagA expression in coculture systema | Region risk levelb | MLST typec | Histopathology score of original patientd |
|---|---|---|---|---|
| PZ5004 | 5.88 ± 1.07 | Low | hpAfrica | 2.33 |
| PZ5024 | 5.12 ± 0.18 | Low | hpAfrica | 2 |
| PZ5026 | 14.69 ± 0.24 | Low | hpEurope | 5.25 |
| PZ5056 | 15.07 ± 0.13 | High | hpEurope | 4.5 |
| PZ5080 | 13.81 ± 0.17 | High | hpEurope | 3.5 |
| PZ5086 | 15.78 ± 0.28 | High | hpEurope | 4.6 |
cagA expression was analyzed by microarray using the probe designed against cagA for H. pylori J99 (889201). For each strain, the cagA signal was calculated for three independent biological samples, and the average and SD of the normalized and logged values are presented. The Spearman correlation is 0.83, indicating a positive relationship between cagA expression and the histopathological score.
H. pylori strains were isolated from regions of Colombia with either high or low risk for the development of gastric cancer.
MLST analysis (26) was previously used to characterize the ancestral origin of the H. pylori strains.
Fig 3.

Histopathology in patients from which PZ5004 (A, B) (nonatrophic gastritis), PZ5056 (C, D) (intestinal metaplasia), and PZ5086 (E, F) (intestinal metaplasia) were isolated. PZ5004 shows diffuse mononuclear leukocytic infiltration throughout and well-preserved glands (arrow). PZ5056 and PZ5086 both show irregular Goblet cells (arrow). Images are at magnifications of ×100 (left) and ×200 (right). Images courtesy of Maria Blanca Piazuelo.
IL-8 expression.
Due to increased expression of the virulence factor cagA in the European strains, IL-8 expression was assessed in gastric epithelial cells following infection with five of the six strains used in the microarray experiment. As shown in Fig. 4A, IL-8 mRNA levels were significantly higher in the two European strains tested from the high-risk region, with increases of (20.1 ± 5.8)-fold and (18.5 ± 7.0)-fold for PZ5056 and PZ5086, respectively (P < 0.001 for each versus control). In addition, the low-risk strain of European origin, PZ5026, also induced a significant increase in IL-8 levels of (9.9 ± 2.7)-fold versus control (P < 0.01). In contrast, the low-risk African strains, PZ5004 and PZ5024, failed to induce a significant increase in IL-8 mRNA expression (Fig. 4A). Additionally, the two high-risk European strains each induced a significant increase in IL-8 levels compared to both of the low-risk African strains (P < 0.001 for each), and the low-risk European strain also induced a significant increase compared to the low-risk African strains (P < 0.05 for each; Fig. 4A).
Fig 4.

Levels of IL-8 mRNA expression (A) and apoptosis (B) in AGS cells stimulated with H. pylori clinical isolates. Cells were cocultured with H. pylori strains at a multiplicity of infection of 200 for 6 h (A) and for 24 h (B). *, P < 0.05; **, P < 0.01; ***, P < 0.001 versus unstimulated control cells; §, P < 0.05; §§§, P < 0.001 compared to both low-risk African strains (PZ5004 and PZ5024); #, P < 0.05 versus African strain PZ5004.
Apoptosis.
Because alterations in apoptosis have been linked to gastric cancer risk (49), the ability of five of these clinical isolates to induce apoptosis in gastric epithelial cells was also assessed. As shown in Fig. 4B, the low-risk African strains PZ5004 and PZ5024 both induced a significant increase in apoptosis, from 3.3% ± 0.7% in the uninfected control cells to 22.8% ± 4.8% and 17.8% ± 1.2%, respectively (P < 0.01 versus control for each). In contrast, the two high-risk European strains, PZ5056 and PZ8086, caused only a modest increase in apoptosis that was not significant, and they both exhibited less induction of apoptosis than did the low-risk African strains. The low-risk European strain showed an intermediate phenotype in this assay, as there was a significant increase in apoptosis to 13.0% ± 4.3% (P < 0.05 versus control).
DISCUSSION
Helicobacter pylori has infected human hosts for many millennia (50). Due to the plasticity of its genome and its capacity to acquire genes from bacterial donors in the environment, H. pylori has developed an extensive array of defense mechanisms and virulence factors that permit its survival in the harsh gastric environment (8, 51). However, environmental pressures, such as diet or coinfection with parasites, may have driven H. pylori strains on divergent evolutionary paths regarding virulence. Less virulent or less interactive strains might colonize with populations distributed toward the lumen and elicit mild immune responses with commensurate development of mild gastritis, while more virulent or more interactive strains may colonize closer to the epithelium and increase the impact on host tissues and gastric cancer risk (22, 52). In this study, unsupervised clustering of gene expression data demonstrated that gene expression signatures could effectively distinguish the more virulent strains of European origin and the less virulent strains of African origin. This classification corroborates previous MLST data, which classified the 2 low-risk strains (PZ5004 and PZ5024) as having African origins, while the remaining strains, including PZ5026 (a strain isolated from an individual at a low-risk locale), had European origins (26). Gene expression analysis of H. pylori isolates in this study provided a useful tool to classify the pathogenicity of H. pylori strains.
While genotyping for vacA s1m1 and cagA+ status is useful to assess the risk of developing duodenal ulcers or gastric cancer (1), the role of ancestral origin on the modulation of these virulence factors has not been studied extensively. All strains used in this study were cagA+ and vacA s1m1 but exhibited significant expression differences in virulence factors. European strains had increased expression of cagA, vacA, babB, and cag4 compared to African strains. babB encodes an adhesin that mediates site-specific colonization and increases gastric pathology (53). cag4 is thought to encode a lytic transglycosylase, homologous to VirB1, which may degrade the bacterial wall to allow the Cag-T4SS to form (54). CagA requires direct contact to the epithelium to mediate structural changes (15). Increased cagA and babB expression may reflect closer contact between European strains and the epithelium. Interestingly, two well-characterized virulence genes showing increased expression in African strains (tipα and napA) both encode secreted factors (55–56), which may suggest colonization further away from the epithelium. Further studies will be necessary to elucidate the dynamics of attachment to host cells between different Colombian strains of H. pylori.
Gene expression changes in other bacterial functions necessary for colonization (acid acclimation, response to RONS, motility, and DNA repair) were observed. To evaluate the significance of expression changes in motility and chemotaxis genes, we evaluated H. pylori motility in pH 7 culture media. While all six clinical isolates were motile, analysis of H. pylori mean speed and displacement showed no correlation between swimming behavior and strain origin. Further studies measuring the differences between African and European strains upon attachment to epithelial cells, acid exposure, or RONS exposure are required to determine which of these phenotypes are linked to phylogeographic origin. We hypothesize that the phenotypes associated with strain origin are not necessary for successful infection by H. pylori. While cagA and vacA are strongly linked to strain origin (57), they are not necessary for infection or survival (1). Motility is an indispensable function for H. pylori infection (4), so natural selection may limit the range of motility phenotypes that result from evolutionary or environmental pressures.
The CXC chemokine family, which includes IL-8 and CXCL1, consists of proinflammatory cytokines that are released in response to H. pylori infection. These cytokines recruit neutrophils and macrophages to sites of inflammation, but prolonged exposure to these cytokines has been linked clinically to increased gastric cancer risk (58–63). H. pylori infection has been associated with increased IL-8 expression and decreased p27 levels (64). Both reduced p27 levels and increased IL-8 levels have been shown to mediate decreased apoptosis (65–68). When exposed to more-virulent European strains expressing higher levels of cagA, gastric epithelial cells increased IL-8 expression, which promotes the activation and infiltration of inflammatory cells and the reduction of apoptosis. This combination may make European strains especially harmful, as it actively promotes the formation of a tumor microenvironment and allows the accumulation of host DNA damage by avoiding programmed cell death.
In conclusion, gene expression analysis of the six H. pylori isolates provided a view of how African and European strains use divergent yet successful virulence strategies to persistently infect their hosts (summarized in Table 5). Our results demonstrate that expression differences in H. pylori strains of African and European origins can be associated with phenotypic changes associated with gastric pathogenesis. These transcriptional changes may reflect differences in niches within the mucosa of more or less virulent H. pylori strains (8, 52). Furthermore, the more robust inflammatory response to European strains, coupled with a decrease in apoptosis, as well as increased expression of cagA, vacA, and babB, may provide mechanistic insights into the increase in DNA damage, the more-severe histopathologic gastric lesions in humans, and the overall increased gastric cancer risk in subjects infected with European strains compared to subjects infected with African strains (26). A better understanding of how host-pathogen interactions vary between different H. pylori strains and how these changes modulate gastric disease severity will improve our ability to manage chronic inflammatory conditions.
Table 5.
Summary of key differences between African and European H. pylori strains
| Characteristic | African origin | European origin |
|---|---|---|
| cagA and vacA expression | Low | High |
| Motility (speed and displacement) | No correlation | No correlation |
| Expression of IL-8 by AGS cells | Low | High |
| Induction of apoptosis in AGS cells | High | Low |
| Histopathology | Low | High |
Supplementary Material
ACKNOWLEDGMENTS
We thank Maria Blanca Piazuelo for providing histopathology images from patients from which H. pylori strains were isolated.
This work was supported by National Institutes of Health grants P01CA028842 (J.G.F., K.T.W., and P.C.), P01CA026731 (J.G.F.), P30ES002109 (J.G.F.), R01DK053620 (K.T.W.), P01CA116087 (K.T.W.), UL1RR024975 (Vanderbilt CTSA, Pilot Project to K.T.W.), the Flow Cytometry Core of the Vanderbilt University Digestive Disease Research Center grant (P30DK058404), and a Merit Review Grant from the Office of Medical Research, Department of Veterans Affairs (K.T.W.).
Footnotes
Published ahead of print 29 April 2013
Supplemental material for this article may be found at http://dx.doi.org/10.1128/IAI.01182-12.
REFERENCES
- 1. Kusters JG, van Vliet AH, Kuipers EJ. 2006. Pathogenesis of Helicobacter pylori infection. Clin. Microbiol. Rev. 19:449–490 [DOI] [PMC free article] [PubMed] [Google Scholar]
- 2. Williams SM, Chen YT, Andermann TM, Carter JE, McGee DJ, Ottemann KM. 2007. Helicobacter pylori chemotaxis modulates inflammation and bacterium-gastric epithelium interactions in infected mice. Infect. Immun. 75:3747–3757 [DOI] [PMC free article] [PubMed] [Google Scholar]
- 3. Croxen MA, Sisson G, Melano R, Hoffman PS. 2006. The Helicobacter pylori chemotaxis receptor TlpB (HP0103) is required for pH taxis and for colonization of the gastric mucosa. J. Bacteriol. 188:2656–2665 [DOI] [PMC free article] [PubMed] [Google Scholar]
- 4. Ottemann KM, Lowenthal AC. 2002. Helicobacter pylori uses motility for initial colonization and to attain robust infection. Infect. Immun. 70:1984–1990 [DOI] [PMC free article] [PubMed] [Google Scholar]
- 5. Bauerfeind P, Garner R, Dunn BE, Mobley HL. 1997. Synthesis and activity of Helicobacter pylori urease and catalase at low pH. Gut 40:25–30 [DOI] [PMC free article] [PubMed] [Google Scholar]
- 6. Wen Y, Feng J, Scott DR, Marcus EA, Sachs G. 2007. The HP0165-HP0166 two-component system (ArsRS) regulates acid-induced expression of HP1186 alpha-carbonic anhydrase in Helicobacter pylori by activating the pH-dependent promoter. J. Bacteriol. 189:2426–2434 [DOI] [PMC free article] [PubMed] [Google Scholar]
- 7. Gerhard M, Lehn N, Neumayer N, Boren T, Rad R, Schepp W, Miehlke S, Classen M, Prinz C. 1999. Clinical relevance of the Helicobacter pylori gene for blood-group antigen-binding adhesin. Proc. Natl. Acad. Sci. U. S. A. 96:12778–12783 [DOI] [PMC free article] [PubMed] [Google Scholar]
- 8. Tan S, Tompkins LS, Amieva MR. 2009. Helicobacter pylori usurps cell polarity to turn the cell surface into a replicative niche. PLoS Pathog. 5:e1000407. 10.1371/journal.ppat.1000407 [DOI] [PMC free article] [PubMed] [Google Scholar]
- 9. Gonzalez CA, Figueiredo C, Lic CB, Ferreira RM, Pardo ML, Ruiz Liso JM, Alonso P, Sala N, Capella G, Sanz-Anquela JM. 2011. Helicobacter pylori cagA and vacA genotypes as predictors of progression of gastric preneoplastic lesions: a long-term follow-up in a high-risk area in Spain. Am. J. Gastroenterol. 106:867–874 [DOI] [PubMed] [Google Scholar]
- 10. Leunk RD, Johnson PT, David BC, Kraft WG, Morgan DR. 1988. Cytotoxic activity in broth-culture filtrates of Campylobacter pylori. J. Med. Microbiol. 26:93–99 [DOI] [PubMed] [Google Scholar]
- 11. Covacci A, Censini S, Bugnoli M, Petracca R, Burroni D, Macchia G, Massone A, Papini E, Xiang Z, Figura N, Rappuoli R. 1993. Molecular characterization of the 128-kDa immunodominant antigen of Helicobacter pylori associated with cytotoxicity and duodenal ulcer. Proc. Natl. Acad. Sci. U. S. A. 90:5791–5795 [DOI] [PMC free article] [PubMed] [Google Scholar]
- 12. Hatakeyama M. 2008. SagA of CagA in Helicobacter pylori pathogenesis. Curr. Opin. Microbiol. 11:30–37 [DOI] [PubMed] [Google Scholar]
- 13. Yamaoka Y, Kudo T, Lu H, Casola A, Brasier AR, Graham DY. 2004. Role of interferon-stimulated responsive element-like element in interleukin-8 promoter in Helicobacter pylori infection. Gastroenterology 126:1030–1043 [DOI] [PubMed] [Google Scholar]
- 14. Tabassam FH, Graham DY, Yamaoka Y. 2009. Helicobacter pylori activate epidermal growth factor receptor- and phosphatidylinositol 3-OH kinase-dependent Akt and glycogen synthase kinase 3beta phosphorylation. Cell. Microbiol. 11:70–82 [DOI] [PMC free article] [PubMed] [Google Scholar]
- 15. Hatakeyama M. 2006. Helicobacter pylori CagA—a bacterial intruder conspiring gastric carcinogenesis. Int. J. Cancer 119:1217–1223 [DOI] [PubMed] [Google Scholar]
- 16. Crabtree JE, Ferrero RL, Kusters JG. 2002. The mouse colonizing Helicobacter pylori strain SS1 may lack a functional cag pathogenicity island. Helicobacter 7:139–140, author reply 140–141 [DOI] [PubMed] [Google Scholar]
- 17. Merrell DS, Goodrich ML, Otto G, Tompkins LS, Falkow S. 2003. pH-regulated gene expression of the gastric pathogen Helicobacter pylori. Infect. Immun. 71:3529–3539 [DOI] [PMC free article] [PubMed] [Google Scholar]
- 18. Merrell DS, Thompson LJ, Kim CC, Mitchell H, Tompkins LS, Lee A, Falkow S. 2003. Growth phase-dependent response of Helicobacter pylori to iron starvation. Infect. Immun. 71:6510–6525 [DOI] [PMC free article] [PubMed] [Google Scholar]
- 19. Thompson LJ, Merrell DS, Neilan BA, Mitchell H, Lee A, Falkow S. 2003. Gene expression profiling of Helicobacter pylori reveals a growth-phase-dependent switch in virulence gene expression. Infect. Immun. 71:2643–2655 [DOI] [PMC free article] [PubMed] [Google Scholar]
- 20. Scott DR, Marcus EA, Wen Y, Oh J, Sachs G. 2007. Gene expression in vivo shows that Helicobacter pylori colonizes an acidic niche on the gastric surface. Proc. Natl. Acad. Sci. U. S. A. 104:7235–7240 [DOI] [PMC free article] [PubMed] [Google Scholar]
- 21. Gancz H, Censini S, Merrell DS. 2006. Iron and pH homeostasis intersect at the level of Fur regulation in the gastric pathogen Helicobacter pylori. Infect. Immun. 74:602–614 [DOI] [PMC free article] [PubMed] [Google Scholar]
- 22. Guillemin K, Salama NR, Tompkins LS, Falkow S. 2002. Cag pathogenicity island-specific responses of gastric epithelial cells to Helicobacter pylori infection. Proc. Natl. Acad. Sci. U. S. A. 99:15136–15141 [DOI] [PMC free article] [PubMed] [Google Scholar]
- 23. Kim N, Marcus EA, Wen Y, Weeks DL, Scott DR, Jung HC, Song IS, Sachs G. 2004. Genes of Helicobacter pylori regulated by attachment to AGS cells. Infect. Immun. 72:2358–2368 [DOI] [PMC free article] [PubMed] [Google Scholar]
- 24. Bravo LE, van Doom LJ, Realpe JL, Correa P. 2002. Virulence-associated genotypes of Helicobacter pylori: do they explain the African enigma? Am. J. Gastroenterol. 97:2839–2842 [DOI] [PubMed] [Google Scholar]
- 25. Whary MT, Sundina N, Bravo LE, Correa P, Quinones F, Caro F, Fox JG. 2005. Intestinal helminthiasis in Colombian children promotes a Th2 response to Helicobacter pylori: possible implications for gastric carcinogenesis. Cancer Epidemiol. Biomarkers Prev. 14:1464–1469 [DOI] [PubMed] [Google Scholar]
- 26. de Sablet T, Piazuelo MB, Shaffer CL, Schneider BG, Asim M, Chaturvedi R, Bravo LE, Sicinschi LA, Delgado AG, Mera RM, Israel DA, Romero-Gallo J, Peek RM, Jr, Cover TL, Correa P, Wilson KT. 2011. Phylogeographic origin of Helicobacter pylori is a determinant of gastric cancer risk. Gut 60:1189–1195 [DOI] [PMC free article] [PubMed] [Google Scholar]
- 27. Loh JT, Shaffer CL, Piazuelo MB, Bravo LE, McClain MS, Correa P, Cover TL. 2011. Analysis of cagA in Helicobacter pylori strains from Colombian populations with contrasting gastric cancer risk reveals a biomarker for disease severity. Cancer Epidemiol. Biomarkers Prev. 20:2237–2249 [DOI] [PMC free article] [PubMed] [Google Scholar]
- 28. Altschul SF, Madden TL, Schaffer AA, Zhang J, Zhang Z, Miller W, Lipman DJ. 1997. Gapped BLAST and PSI-BLAST: a new generation of protein database search programs. Nucleic Acids Res. 25:3389–3402 [DOI] [PMC free article] [PubMed] [Google Scholar]
- 29. Smyth GK. 2004. Linear models and empirical Bayes methods for assessing differential expression in microarray experiments. Stat Appl. Genet. Mol. Biol. 3:Article 3 [DOI] [PubMed] [Google Scholar]
- 30. R Development Core Team 2008. R: a language and environment for statistical computing. R Foundation for Statistical Computing, Vienna, Austria [Google Scholar]
- 31. Suzuki R, Shimodaira H. 2006. Pvclust: an R package for assessing the uncertainty in hierarchical clustering. Bioinformatics 22:1540–1542 [DOI] [PubMed] [Google Scholar]
- 32. Langmead B, Salzberg SL. 2012. Fast gapped-read alignment with Bowtie 2. Nat. Methods 9:357–359 [DOI] [PMC free article] [PubMed] [Google Scholar]
- 33. Li H, Handsaker B, Wysoker A, Fennell T, Ruan J, Homer N, Marth G, Abecasis G, Durbin R. 2009. The sequence alignment/map format and SAMtools. Bioinformatics 25:2078–2079 [DOI] [PMC free article] [PubMed] [Google Scholar]
- 34. Altschul SF, Gish W, Miller W, Myers EW, Lipman DJ. 1990. Basic local alignment search tool. J. Mol. Biol. 215:403–410 [DOI] [PubMed] [Google Scholar]
- 35. Tusher VG, Tibshirani R, Chu G. 2001. Significance analysis of microarrays applied to the ionizing radiation response. Proc. Natl. Acad. Sci. U. S. A. 98:5116–5121 [DOI] [PMC free article] [PubMed] [Google Scholar]
- 36. Tatusov RL, Fedorova ND, Jackson JD, Jacobs AR, Kiryutin B, Koonin EV, Krylov DM, Mazumder R, Mekhedov SL, Nikolskaya AN, Rao BS, Smirnov S, Sverdlov AV, Vasudevan S, Wolf YI, Yin JJ, Natale DA. 2003. The COG database: an updated version includes eukaryotes. BMC Bioinformatics 4:41. 10.1186/1471-2105-4-41 [DOI] [PMC free article] [PubMed] [Google Scholar]
- 37. Powell S, Szklarczyk D, Trachana K, Roth A, Kuhn M, Muller J, Arnold R, Rattei T, Letunic I, Doerks T, Jensen LJ, von Mering C, Bork P. 2012. eggNOG v3.0: orthologous groups covering 1133 organisms at 41 different taxonomic ranges. Nucleic Acids Res. 40:D284–D289 [DOI] [PMC free article] [PubMed] [Google Scholar]
- 38. Chaturvedi R, Asim M, Hoge S, Lewis ND, Singh K, Barry DP, de Sablet T, Piazuelo MB, Sarvaria AR, Cheng Y, Closs EI, Casero RA, Jr, Gobert AP, Wilson KT. 2010. Polyamines impair immunity to Helicobacter pylori by inhibiting l-arginine uptake required for nitric oxide production. Gastroenterology 139:1686–1698 [DOI] [PMC free article] [PubMed] [Google Scholar]
- 39. Chaturvedi R, Asim M, Romero-Gallo J, Barry DP, Hoge S, de Sablet T, Delgado AG, Wroblewski LE, Piazuelo MB, Yan F, Israel DA, Casero RA, Jr, Correa P, Gobert AP, Polk DB, Peek RM, Jr, Wilson KT. 2011. Spermine oxidase mediates the gastric cancer risk associated with Helicobacter pylori CagA. Gastroenterology 141:1696–1708 [DOI] [PMC free article] [PubMed] [Google Scholar]
- 40. Andrews S, Gilley J, Coleman MP. 2010. Difference Tracker: ImageJ plugins for fully automated analysis of multiple axonal transport parameters. J. Neurosci. Methods 193:281–287 [DOI] [PubMed] [Google Scholar]
- 41. Hare S, Fischer W, Williams R, Terradot L, Bayliss R, Haas R, Waksman G. 2007. Identification, structure and mode of action of a new regulator of the Helicobacter pylori HP0525 ATPase. EMBO J. 26:4926–4934 [DOI] [PMC free article] [PubMed] [Google Scholar]
- 42. Terradot L, Waksman G. 2011. Architecture of the Helicobacter pylori Cag-type IV secretion system. FEBS J. 278:1213–1222 [DOI] [PubMed] [Google Scholar]
- 43. Smeets LC, Bijlsma JJE, Boomkens SY, Vandenbroucke-Grauls CMJE, Kusters JG. 2000. comH, a novel gene essential for natural transformation of Helicobacter pylori. J. Bacteriol. 182:3948–3954 [DOI] [PMC free article] [PubMed] [Google Scholar]
- 44. Rader BA, Campagna SR, Semmelhack MF, Bassler BL, Guillemin K. 2007. The quorum-sensing molecule autoinducer 2 regulates motility and flagellar morphogenesis in Helicobacter pylori. J. Bacteriol. 189:6109–6117 [DOI] [PMC free article] [PubMed] [Google Scholar]
- 45. Osaki T, Hanawa T, Manzoku T, Fukuda M, Kawakami H, Suzuki H, Yamaguchi H, Yan X, Taguchi H, Kurata S, Kamiya S. 2006. Mutation of luxS affects motility and infectivity of Helicobacter pylori in gastric mucosa of a Mongolian gerbil model. J. Med. Microbiol. 55:1477–1485 [DOI] [PubMed] [Google Scholar]
- 46. Shen F, Hobley L, Doherty N, Loh JT, Cover TL, Sockett RE, Hardie KR, Atherton JC. 2010. In Helicobacter pylori auto-inducer-2, but not LuxS/MccAB catalysed reverse transsulphuration, regulates motility through modulation of flagellar gene transcription. BMC Microbiol. 10:210. 10.1186/1471-2180-10-210 [DOI] [PMC free article] [PubMed] [Google Scholar]
- 47. Bijlsma JJE, Lie Ling A-M, Nootenboom IC, Vandenbroucke-Grauls CMJE, Kusters JG. 2000. Identification of loci essential for the growth of Helicobacter pylori under acidic conditions. J. Infect. Dis. 182:1566–1569 [DOI] [PubMed] [Google Scholar]
- 48. Ge Z, Feng Y, Dangler CA, Xu S, Taylor NS, Fox JG. 2000. Fumarate reductase is essential for Helicobacter pylori colonization of the mouse stomach. Microb. Pathog. 29:279–287 [DOI] [PubMed] [Google Scholar]
- 49. Galysh R, Powell SM. 2009. Cancer genetics of human gastric adenocarcinoma, p 251–283 In Wang TC, Fox JG, Giraud AS. (ed), The biology of gastric cancers. Springer, New York, New York, USA [Google Scholar]
- 50. Linz B, Balloux F, Moodley Y, Manica A, Liu H, Roumagnac P, Falush D, Stamer C, Prugnolle F, van der Merwe SW, Yamaoka Y, Graham DY, Perez-Trallero E, Wadstrom T, Suerbaum S, Achtman M. 2007. An African origin for the intimate association between humans and Helicobacter pylori. Nature 445:915–918 [DOI] [PMC free article] [PubMed] [Google Scholar]
- 51. Ahmed N, Tenguria S, Nandanwar N. 2009. Helicobacter pylori—a seasoned pathogen by any other name. Gut Pathog. 1:24. 10.1186/1757-4749-1-24 [DOI] [PMC free article] [PubMed] [Google Scholar]
- 52. Blaser MJ. 1998. Science, medicine, and the future: Helicobacter pylori and gastric diseases. Br. Med. J. 316:1507. [DOI] [PMC free article] [PubMed] [Google Scholar]
- 53. Matteo MJ, Armitano RI, Romeo M, Wonaga A, Olmos M, Catalano M. 2011. Helicobacter pylori bab genes during chronic colonization. Int. J. Mol. Epidemiol. Genet. 2:286–291 [PMC free article] [PubMed] [Google Scholar]
- 54. Zhong Q, Shao S, Mu R, Wang H, Huang S, Han J, Huang H, Tian S. 2011. Characterization of peptidoglycan hydrolase in Cag pathogenicity island of Helicobacter pylori. Mol. Biol. Rep. 38:503–509 [DOI] [PubMed] [Google Scholar]
- 55. Suganuma M, Kuzuhara T, Yamaguchi K, Fujiki H. 2006. Carcinogenic role of tumor necrosis factor-alpha inducing protein of Helicobacter pylori in human stomach. J. Biochem. Mol. Biol. 39:1. [DOI] [PubMed] [Google Scholar]
- 56. Evans D, Evans DG, Takemura T, Nakano H, Lampert HC, Graham DY, Granger DN, Kvietys PR. 1995. Characterization of a Helicobacter pylori neutrophil-activating protein. Infect. Immun. 63:2213–2220 [DOI] [PMC free article] [PubMed] [Google Scholar]
- 57. Duncan SS, Valk PL, McClain MS, Shaffer CL, Metcalf JA, Bordenstein SR, Cover TL. 2013. Comparative genomic analysis of East Asian and non-Asian Helicobacter pylori strains identifies rapidly evolving genes. PLoS One 8:e55120. 10.1371/journal.pone.0055120 [DOI] [PMC free article] [PubMed] [Google Scholar]
- 58. Sheh A, Ge Z, Parry NM, Muthupalani S, Rager JE, Raczynski AR, Mobley MW, McCabe AF, Fry RC, Wang TC, Fox JG. 2011. 17beta-estradiol and tamoxifen prevent gastric cancer by modulating leukocyte recruitment and oncogenic pathways in Helicobacter pylori-infected INS-GAS male mice. Cancer Prev. Res. (Phila.) 4:1426–1435 [DOI] [PMC free article] [PubMed] [Google Scholar]
- 59. Okumura T, Ericksen RE, Takaishi S, Wang SS, Dubeykovskiy Z, Shibata W, Betz KS, Muthupalani S, Rogers AB, Fox JG, Rustgi AK, Wang TC. 2010. K-ras mutation targeted to gastric tissue progenitor cells results in chronic inflammation, an altered microenvironment, and progression to intraepithelial neoplasia. Cancer Res. 70:8435–8445 [DOI] [PMC free article] [PubMed] [Google Scholar]
- 60. Vandercappellen J, Van Damme J, Struyf S. 2008. The role of CXC chemokines and their receptors in cancer. Cancer Lett. 267:226–244 [DOI] [PubMed] [Google Scholar]
- 61. Jung JJ, Noh S, Jeung HC, Jung M, Kim TS, Noh SH, Roh JK, Chung HC, Rha SY. 2010. Chemokine growth-regulated oncogene 1 as a putative biomarker for gastric cancer progression. Cancer Sci. 101:2200–2206 [DOI] [PMC free article] [PubMed] [Google Scholar]
- 62. Junnila S, Kokkola A, Mizuguchi T, Hirata K, Karjalainen-Lindsberg ML, Puolakkainen P, Monni O. 2010. Gene expression analysis identifies over-expression of CXCL1, SPARC, SPP1, and SULF1 in gastric cancer. Genes Chromosomes Cancer 49:28–39 [DOI] [PubMed] [Google Scholar]
- 63. Taguchi A, Ohmiya N, Shirai K, Mabuchi N, Itoh A, Hirooka Y, Niwa Y, Goto H. 2005. Interleukin-8 promoter polymorphism increases the risk of atrophic gastritis and gastric cancer in Japan. Cancer Epidemiol. Biomarkers Prev. 14:2487–2493 [DOI] [PubMed] [Google Scholar]
- 64. Kim SS, Meitner P, Konkin TA, Cho YS, Resnick MB, Moss SF. 2006. Altered expression of Skp2, c-Myc and p27 proteins but not mRNA after H. pylori eradication in chronic gastritis. Mod. Pathol. 19:49–58 [DOI] [PubMed] [Google Scholar]
- 65. Shirin H, Sordillo EM, Kolevska TK, Hibshoosh H, Kawabata Y, Oh SH, Kuebler JF, Delohery T, Weghorst CM, Weinstein IB, Moss SF. 2000. Chronic Helicobacter pylori infection induces an apoptosis-resistant phenotype associated with decreased expression of p27(kip1). Infect. Immun. 68:5321–5328 [DOI] [PMC free article] [PubMed] [Google Scholar]
- 66. Kuzushita N, Rogers AB, Monti NA, Whary MT, Park MJ, Aswad BI, Shirin H, Koff A, Eguchi H, Moss SF. 2005. p27kip1 deficiency confers susceptibility to gastric carcinogenesis in Helicobacter pylori-infected mice. Gastroenterology 129:1544–1556 [DOI] [PubMed] [Google Scholar]
- 67. Abdollahi T, Robertson NM, Abdollahi A, Litwack G. 2003. Identification of interleukin 8 as an inhibitor of tumor necrosis factor-related apoptosis-inducing ligand-induced apoptosis in the ovarian carcinoma cell line OVCAR3. Cancer Res. 63:4521–4526 [PubMed] [Google Scholar]
- 68. Wilson C, Wilson T, Johnston PG, Longley DB, Waugh DJ. 2008. Interleukin-8 signaling attenuates TRAIL- and chemotherapy-induced apoptosis through transcriptional regulation of c-FLIP in prostate cancer cells. Mol. Cancer Ther. 7:2649–2661 [DOI] [PubMed] [Google Scholar]
Associated Data
This section collects any data citations, data availability statements, or supplementary materials included in this article.