Abstract
Assessing genome-wide statistical significance is an important issue in genetic studies. We describe a new resampling approach for determining the appropriate thresholds for statistical significance. Our simulation results demonstrate that the proposed approach accurately controls the genome-wide type I error rate even under the large p small n situations.
Keywords: experimental cross, genome-wide statistical significance, quantitative trait loci (QTL) mapping, resampling method
QUANTITATIVE trait loci (QTL) mapping plays an important role in understanding the genetic variations in experimental crosses. A critical issue concerns assessing the genome-wide significance (GWS), since statistical tests are performed at many putative loci. Analytic methods to determine GWS have been investigated by several authors including Lander and Kruglyak (1995) and Zou et al. (2004) and these involve specific assumptions on the experimental design and genetic map density. Churchill and Doerge (1994) proposed a permutation test to address these issues. However, their method is computationally intensive due to repeated analyses of the permuted data sets, and its validity relies on the assumption of complete exchangeability under the null hypothesis, which can frequently be violated (see, for instance, Manichaikul et al. 2007).
To overcome the limitations of the permutation methods, Zou et al. (2004) proposed a resampling procedure requiring one analysis of the data set only, thereby reducing the computational complexity. In this note, we propose a further modification of the resampling approach of Zou et al. (2004) to improve the power of the tests while retaining the same computational complexity.
We begin by considering n independent subjects from an experimental cross and statistical testing at p putative loci. Let βj be a vector of the genetic effects at the jth location and H0: β1 = … = βp = 0 denote the null hypothesis of no genetic effects at all loci. It is well known that given a statistical model, the likelihood-ratio test for testing the hypothesis H0j: βj = 0 can be approximated by the score statistic
where , , and Uij is the efficient score from the ith subject, defined to be the projection of the score function for βj on the orthocomplement space of the score functions for nuisance parameters (Bickel et al. 1993, p. 30). The test statistic for testing H0 is max1≤j≤p Wj, whose null distribution can be approximated by the resampling algorithm of Zou et al. (2004) given below. Theoretical justification for this approximation can be provided along the line of Kuelbs and Vidyashankar (2010). The resampling algorithm for determining the threshold at GWS level α (Zou et al. 2004) follows:
| k = 0 |
| repeat |
| k ← k + 1 |
| untilk ≥ B |
| Calculate the 100(1 − α)th percentile of {W⋆(1), …, W⋆(B)} |
We modify the above algorithm by generating ; i.e., Gi(k)’s are i.i.d. from the Rademacher distribution, since the error in approximating the distribution of the score statistic is of the order n−3/2 when using Rademacher weights (RW) while it is 3n−3/2 for N(0, 1) weights. This distribution is commonly used in the multiplier bootstrap literature (Praestgaard 1990), econometrics, and learning theory (Bartlett and Mendelson 2003; Koltchinskii and Panchenko 2000) and measures how well correlated the most-correlated hypothesis is to a random labeling of the efficient scores.
We conducted simulation studies to study the effect of using RW with sample of sizes 50 and 100 and genetic maps of 1, 10, and 20 chromosomes. Each chromosome has a length of 100 cM and 100 equally spaced markers. We use the function sim.cross in R/qtl (Broman et al. 2003) to generate the genotype data. Under H0, we generate the quantitative traits from N(0, 1) while under H1, we generate from N(μ, 1), μ ∈ [0.2, 1.0], representing an additive effect at 35 cM on chromosome one.
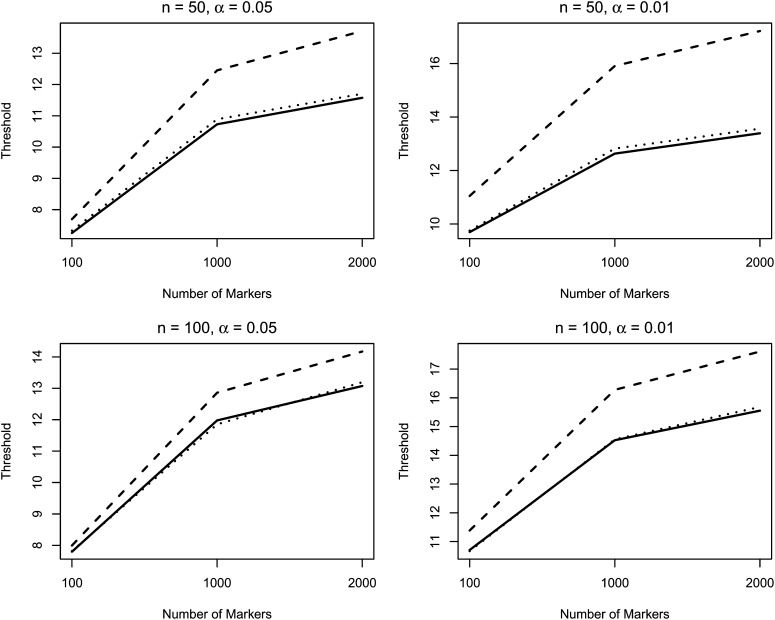
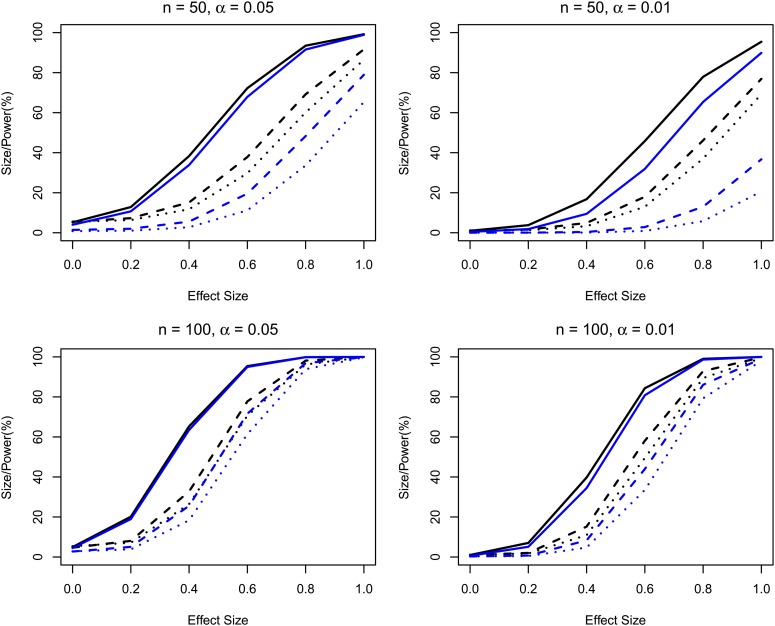
Figure 1 presents the thresholds for the single-marker analysis at the GWS level of 0.05 and 0.01 and compares them to both the empirical thresholds and that of Zou et al. (2004) based on 10,000 replicates and B = 10, 000 in the algorithm. When n = p, the thresholds based on both methods match the empirical thresholds, under both H0 and H1 (data not presented under H1). When n is small and <p, the thresholds using RW still match the empirical thresholds, whereas the thresholds from Zou et al. (2004) are overestimated. The standard errors of the thresholds were also calculated using the function quantileSE in the R package broman (detailed results are presented in supporting information, File S1). Figure 2 presents the sizes and powers of the two resampling approaches. The proposed approach has type I error rates close to the nominal level under all situations and is substantially more powerful than Zou et al. (2004) under the large p small n scenarios.
Figure 1.
Thresholds at the targeted GWS levels of α. The solid, dashed, and dotted curves correspond to the average thresholds based on the proposed method and the method of Zou et al. (2004) from 10,000 simulated data sets and the empirical thresholds based on 10,000 simulated data sets under the null hypothesis, respectively.
Figure 2.
Sizes/powers(%) at nominal GWS level of α. The black and blue curves correspond to sizes/powers from the proposed method and the method of Zou et al. (2004), respectively. The solid, dashed, and dotted curves correspond to the sizes/powers under the scenarios when p = 100, 1000, and 2000, respectively.
In summary, we proposed a new resampling approach for assessing GWS in QTL mapping. This new approach retains all the attractive features of the resampling approach of Zou et al. (2004) and outperforms it under the large p small n situation. Additional simulation studies with n = 500 and P = 2000 showed that the two methods yielded similar results (detailed results are presented in File S1).
Supplementary Material
Acknowledgments
The authors thank the editor and a referee for helpful comments. The first author was supported in part by National Science Foudnation (NSF) DMS-1107108 and National Institutes of Health CA150698. The second author was supported by NSF DMS-1107108.
Footnotes
Communicating editor: F. Zou
Literature Cited
- Bartlett P. L., Mendelson S., 2003. Rademacher and Gaussian complexities: risk bounds and structural results. J. Mach. Learn. Res. 3: 463–482 [Google Scholar]
- Bickel P. J., Klaassen C. A. J., Ritov Y., Wellner J. A., 1993. Efficient and Adaptive Estimation for Semiparametric Models. Johns Hopkins University Press, Baltimore [Google Scholar]
- Broman K. W., Wu H., Sen S., Churchill G. A., 2003. R/qtl: QTL mapping in experimental crosses. Bioinformatics 19: 889–890 [DOI] [PubMed] [Google Scholar]
- Churchill G. A., Doerge R. W. D., 1994. Empirical threshold values for quantitative trait mapping. Genetics 138: 963–971 [DOI] [PMC free article] [PubMed] [Google Scholar]
- Koltchinskii, V., and D. Panchenko, 2000 Rademacher processes and bounding the risk of function learning. Progr. Probab. 47: 443–458.
- Kuelbs J., Vidyashankar A. N., 2010. Asymptotic inference for high-dimensional data. Ann. Stat. 38: 836–869 [Google Scholar]
- Lander E., Kruglyak L., 1995. Genetic dissection of complex traits: guidelines for interpreting and reporting linkage results. Nat. Genet. 11: 241–247 [DOI] [PubMed] [Google Scholar]
- Manichaikul A., Palmer A. A., Sen S., Broman K. W., 2007. Significance thresholds for quantitative trait locus mapping under selective genotyping. Genetics 177: 1963–1966 [DOI] [PMC free article] [PubMed] [Google Scholar]
- Praestgaard J., 1990. Bootstrap with general weights and multiplier central limit theorems. Technical Report 195, Department of Statistics, University of Washington [Google Scholar]
- Zou F., Fine J., Hu J., Lin D. Y., 2004. An efficient resampling method for assessing genome-wide statistical significance in mapping quantitative trait loci. Genetics 168: 2307–2316 [DOI] [PMC free article] [PubMed] [Google Scholar]
Associated Data
This section collects any data citations, data availability statements, or supplementary materials included in this article.


