

Electron tomography and 3D modeling identifies augmin-dependent connections between the wall of one microtubule and the minus end of a neighboring one in the spindle.
Abstract
The formation of a functional spindle requires microtubule (MT) nucleation from within the spindle, which depends on augmin. How augmin contributes to MT formation and organization is not known because augmin-dependent MTs have never been specifically visualized. In this paper, we identify augmin-dependent MTs and their connections to other MTs by electron tomography and 3D modeling. In metaphase spindles of human cells, the minus ends of MTs were located both around the centriole and in the body of the spindle. When augmin was knocked down, the latter population of MTs was significantly reduced. In control cells, we identified connections between the wall of one MT and the minus end of a neighboring MT. Interestingly, the connected MTs were nearly parallel, unlike other examples of end–wall connections between cytoskeletal polymers. Our observations support the concept of augmin-dependent MT nucleation at the walls of existing spindle MTs. Furthermore, they suggest a mechanism for maintaining polarized MT organization, even when noncentrosomal MT initiation is widespread.
Introduction
Chromosome segregation and cell division rely on the spindle, a microtubule (MT)-based bipolar structure. The centrosome has long been considered the dominant site of MT nucleation in the spindle of animal somatic cells; it works by concentrating the γ-tubulin ring complex (γ-TuRC), which is a potent nucleator of MTs. Recent studies have, however, revealed two noncentrosomal, γ-TuRC–dependent mechanisms in mitotic cells. The first is a chromosome-dependent pathway that involves the Ran GTPase and the chromosome passenger complex; these regulate multiple spindle-assembly factors, including MT stabilizers and destabilizers (Walczak and Heald, 2008; Meunier and Vernos, 2012). The second mechanism is less well understood: it relies on the eight-subunit augmin complex to increase the number of spindle MTs, apparently by binding to preexisting MTs and recruiting γ-TuRC (Goshima et al., 2008; Goshima and Kimura, 2010; Meunier and Vernos, 2012). This type of nucleation has been postulated to be analogous to MT-dependent MT nucleation as observed in the cytoplasm of fission yeast and plant cells (Janson et al., 2005; Murata et al., 2005). However, it has not yet been determined how augmin and γ-TuRC generate MTs or how these MTs are organized within the spindle. Visualizing such phenomena is difficult because spindles in higher eukaryotes are crowded with MTs, so currently available light microscopy cannot identify individual MTs and localize their ends within the spindle.
Electron tomography is a powerful technique to trace MTs and locate their ends in a highly organized structure like the spindle. It can also give information about the morphology of each MT end, which in some cases allows a strong inference about MT polarity. This technique has been used for spindles of yeast and Caenorhabditis elegans. However, distributed minus ends were rarely observed, and there was little evidence that intraspindle nucleation takes place in these spindles (O’Toole et al., 1999, 2003). This is consistent with the fact that genes homologous to augmin are not present in the genomes of these species; these spindles appear to generate MTs predominantly from their spindle pole bodies or centrosomes. On the other hand, previous transmission electron microscopic analyses, using either serial thin sections of spindles in PtK1 cells (Mastronarde et al., 1993) or light microscopic visualization of spindles in Haemanthus katherinae (blood lily) cells (Bajer and Molè-Bajer, 1986), suggested that putative MT minus ends are localized in the body of the spindle. Neither study could, however, determine MT end structure or investigate the connection of an end to neighboring MTs.
This study was designed to identify augmin-dependent MTs and reveal their organization. We have used electron tomography to characterize the spindles of human U2OS cells in metaphase in the presence or absence of augmin. Our study has identified the distribution, structure, and connections of MT minus ends within the spindle of human somatic cells.
Results and discussion
Identification of augmin-dependent MTs in the body of the spindle
Control cells were taken from culture and rapidly frozen in preparation for freeze-substitution fixation (Fig. S1, A and B). To generate cells depleted of the augmin complex, an augmin subunit (Aug6/hDgt6) was knocked down by RNAi. We confirmed that these cells showed the typical augmin phenotype, in which γ-tubulin intensity is diminished in the body of the bipolar spindle but not at the centrosome (Fig. S1 D; Goshima et al., 2008; Uehara et al., 2009). Such augmin-depleted cells were then prepared for electron tomography just like controls. After electron tomography, we manually detected and traced all the MTs in tomograms of two to four semithick serial sections. The location of each MT end that lay within the reconstructed volume was recorded, along with the positions of the centrioles and the outlines of the chromosomes. We then analyzed these 3D models and projected them onto planes for convenient visualization (Fig. 1, A–D; see also Fig. S2 A and Tables S1 and S2 for information on other cells, which display characteristics similar to those in Fig. 1, A–D). In augmin knockdown cells, MTs were sparse in the body of the spindle (48% of the MT density found in control cells; n = 3 and 4 in control and augmin RNAi cells, respectively; P < 0.05, t test; Tables 1, S1, and S2; see Materials and methods for the MT density measurement methodology), which is consistent with the data obtained in HeLa cells by immunofluorescence microscopy (∼50–60%; Goshima et al., 2008; Uehara et al., 2009).
Figure 1.

MT organization and end distribution in the mitotic spindle of human U2OS cells. (A–D) Partial reconstructions of metaphase spindles in control and augmin RNAi cells. MTs are colored green. Chromosome-facing ends (all open) and pole-facing closed and open ends are marked with white, magenta, and yellow spheres, respectively. Surfaces of chromosomes are outlined in blue. The centriole pair and associated MTs are in gray. In three out of four augmin knockdown cells, abnormal centriolar MTs were observed (Fig. S2, D and E). The connection sites between mother and daughter MTs are red in D. Bar, 1 µm. (E) Distribution of putative minus ends near or away from the centriole. Combined data from three control or four augmin knockdown cells are displayed. Data on each cell are presented in Tables S1 and S2.
Table 1.
Quantitative information of the analyzed cells
| Parameters | Control (four cells) | Augmin RNAi (four cells) |
| Number of MTs (/10 µm3) | 549 | 448 |
| Number of intraspindle MTs (/µm2)b | 68a | 32 |
| Number of closed ends (/10 µm3) | 142 | 138 |
| Number of pole-facing open ends (/10 µm3) (flared, blunt) | 66 (55, 11) | 76 (64, 12) |
| Number of ends near the centriole (/10 µm3) (closed, pole-facing open)c | 186a (135, 51) | 203 (135, 68) |
| Number of ends away from the centriole (/10 µm3) (closed, pole-facing open)d | 43a (23, 20) | 10 (2, 8) |
| Number of chromosome-facing open ends (/10 µm3) (flared, blunt) | 83 (81, 2) | 58 (52, 6) |
| Percentage of end-links (per total closed ends) (rod shaped, direct) | 8.8 (4.6, 4.2) | 1.1 (0.6, 0.5) |
| Number of end-links in total volume (rod shaped, direct) | 71 in 57 µm3 (37, 34) | 11 in 71 µm3 (6, 5) |
| Number of end-links/10 µm3 (rod shaped, direct) | 12 (6, 6) | 1.5 (0.8, 0.7) |
| Number of end-links/1-mm MT (rod shaped, direct) | 27 (14, 13) | 4.2 (2.3, 1.9) |
| Percentage of end-links near the centriole (/closed ends) (rod shaped, direct)c | 6.6a (3.1, 3.5) | ND |
| Percentage of end-links away from the centriole (/closed ends) (rod shaped, direct)d | 16.4a (10, 6.4) | ND |
| Length of rod-shaped end-link (nm, ±SD) | 29 ± 14 | ND |
| Angle α (°, ±SD); rod shaped | 14 ± 40 | ND |
| Angle α (°, ±SD); direct | 61 ± 47 | ND |
| Angle β (°, ±SD); rod shaped | 64 ± 17 | ND |
| Angle γ (°, ±SD); rod shaped | 131 ± 36 | ND |
Based on three cells for which the centriole center was detected in the tomographic volumes.
Numbers of MTs that pass through the plane 2.5 µm apart from the centriole center.
<1.5 µm from the centriole center.
≥1.5 µm from the centriole center.
Intraspindle distribution of closed MT ends depends on augmin
The structures of MT ends were classified into three groups, consistent with similar studies using other cell types; closed ends, which had a cone-shaped cap, blunt open ends, and flared open ends (Fig. S1 E; O’Toole et al., 1999, 2003). Based upon their structure and distribution, closed ends are likely minus ends capped by the γ-TuRC (Byers et al., 1978; Moritz et al., 2000; O’Toole et al., 2012). Considering the importance of centrosomes in MT nucleation, we reasoned that the majority of open ends facing away from the centrosome would be plus ends, regardless of their distance from the pole. In contrast, those open ends that faced the pole are probably a mixture of plus and minus ends. These results indicate that minus ends are distributed throughout the spindle of control cells (Figs. 1 C and S2 A).
Comparisons between cells with or without augmin revealed no noticeable differences in the character of MT end structures (Fig. S1 E). The total numbers of pole-facing ends (putative minus ends) per volume were also similar between control and RNAi-treated cells (Tables 1, S1, and S2). Interestingly, the number of MT ends in the body of the spindle decreased in the augmin knockdown cells, caused largely by the dramatic reduction in the number of closed ends (Figs. 1, C and E; and S2, A and B). In control cells, 23 closed ends per 10-µm3 volume were found in the body of the spindle (≥1.5 µm from the centriole center in each volume), whereas only two were identified in an equal volume after augmin RNAi (Figs. 1 E and S2 B and Table 1). On the other hand, closed MT ends were found at similar frequency in the centriole-proximal region in control and the augmin-deficient cells (Figs. 1 E and S2 B). These results indicate that the normal mitotic spindle contains augmin-dependent MTs that are not connected to or concentrated near the centrosome.
Chromosome-proximal MT nucleation is rare or nonexistent in metaphase
Almost all the closed ends (i.e., putative minus ends capped by γ-TuRC) face toward the nearby spindle pole. This was true in either control or augmin knockdown cells (only 1 out of 1,788 closed ends faced in the opposite direction). If γ-TuRC–dependent MT nucleation occurred spontaneously within the spindle volume, as was seen during prometaphase in acentrosomal systems, one might expect those MTs to be oriented at random (Mahoney et al., 2006; Schuh and Ellenberg, 2007; Courtois et al., 2012), i.e., closed ends should face the chromosomes as frequently as the poles. The organized orientations we have seen suggest that spontaneous cytoplasmic MT nucleation is rare in metaphase spindles of U2OS cells.
In mitotic and meiotic cells, the chromosomes have been identified as sites of MT initiation, raising the possibility that at least some of the MTs we have seen grew from sites at or near the chromosomes (Heald et al., 1996; Mahoney et al., 2006). However, only a few short MTs were detected near the chromosome in both control and augmin knockdown cells; the majority of the chromosome-proximal MTs extended from the middle or polar region of the spindle (Fig. S2 C). Although we cannot exclude the possibility that MTs shorter than our detection limit were present near the chromosomes (we could not distinguish MTs shorter than 30 nm from other intracellular materials), the more realistic possibility is that metaphase human cells do not frequently nucleate MTs from these sites. We did, however, detect several short MTs around the centrioles, consistent with the notion that centrosomes continue to nucleate MTs throughout metaphase (Fig. S2 C). These data support the hypothesis that augmin is responsible for most, if not all, of the noncentrosomal MT initiation in human metaphase spindles.
Centriole abnormality after augmin RNAi
A part of the centriole was reconstructed in most of the tomographic volumes (seven out of eight cells). We found three abnormalities in the centriole-associated and centriole-proximal MTs after augmin knockdown: (1) Overly long centriolar MTs extended from the distal centriole end in two cells (cell #3 and #4; Figs. 1, A–D, gray; and S2 D, white). (2) There were MTs within the lumen of two centrioles (one and six MTs in cells #1 and #4, respectively; Fig. S2 D, red). (3) Two or three centrosomal MTs that were not in centrioles appeared to share a wall; cross sectioned tomographic slices showed images that resembled the doublet or triplet MTs found in cilia or centrioles (65, 34, and 7 sets of MTs in cells #1, #3, and #4, respectively; Fig. S2, D [green] and E).
Although these unexpected observations might suggest additional functions for augmin in centriole formation, the phenotype can be also explained by indirect effects of augmin knockdown, namely the reduction of nucleation events in the body of the spindle. Without augmin, more γ-tubulin and tubulin dimers are probably available for other MT nucleation sites, such as centrioles or centrosomes. Consequently, those regions may be hyperactivated in MT nucleation and elongation. Previous studies using Drosophila melanogaster cells and C. elegans embryos showed that the depletion of γ-tubulin causes abnormal elongation of the distal ends of centriolar MTs (Raynaud-Messina et al., 2004; O’Toole et al., 2012), consistent with the idea that more free tubulins are available for those MTs. However, the other two phenotypes detected after augmin RNAi were not reported for the γ-tubulin knockdowns, suggesting that γ-tubulin–dependent nucleation is associated more specifically with those phenotypes.
Augmin-dependent connections between MT ends and adjacent MT walls
The published model for augmin- and MT-dependent generation of MTs predicts that augmin links a γ-TuRC–capped MT end to a neighboring MT wall (Goshima et al., 2008; Uehara et al., 2009). If this were the case, one should find connections between the closed ends and the adjacent MTs in the control cells but not in augmin knockdown cells. We carefully studied the closed MT ends of control and augmin-depleted cells and searched for possible connections to neighboring MTs (1,788 ends were analyzed; see Materials and methods for analysis methodology). We occasionally found a connection between the daughter MT closed end and the lattice of an adjacent mother MT; importantly, these structures were rarely detected after augmin knockdown (P < 0.0001, t test; Figs. 2 and 3 A and Videos 1, 2, and 3). In control cells, 8.8% of the closed MT ends were connected to the wall of a nearby MT (Figs. 1 D and S2 A). This corresponds to 71 connections in a volume of 57 µm3, 12 connections per 10 µm3, or 27 connections per 1 mm of MT length (2,648-µm MTs were examined; Tables 1 and S1). In augmin knockdown cells, on the other hand, only 1.1% of the closed ends were similarly connected (Figs. 1 D and S2 A), which corresponds to 11 connections in a volume of 71 µm3, 1.5 connections per 10 µm3, or 4.2 connections per 1-mm MTs (2,649-µm MTs were examined; Tables 1 and S2). In control cells, these end-links were more frequently seen in the body of the spindle than in the centriole-proximal region (the end-links were detected in 16.4% of the closed ends in this region; Fig. 3 B and Table 1).
Figure 2.

Ultrastructure of the augmin-dependent end-links that connect two adjacent MTs. Two types of connection between an MT closed (minus) end and the lattice of an adjacent MT. (A) Selected tomographic slices (1.4 nm/slice; three out of seven serial slices) of two end-lattice connections, at which rod-shaped end-links were detected (arrows). Note that the links are most clearly visible in the fourth plane, which includes the daughter MT end. Manual tracings of the mother MT wall (green; a part of the wall lying in this slice was marked) and the capped daughter MT ends (magenta) are displayed on the right. See Videos 1, 2, and 3 for more serially sliced or rotated images. (B) Two examples of the direct end-link. See Fig. S3 for more images. Bars, 30 nm.
Figure 3.

Quantitative description of the end-links. (A) Comparison of the probability of end-link appearance between control and augmin RNAi–treated cells in the centriole-proximal area or the body of the spindle. Combined data from three control or four augmin knockdown cells are displayed. Data on each cell are presented in Tables S1 and S2. (B) Frequency of the end-link appearance on the closed ends near or away from the centriole. End-links were observed more frequently in the body of the spindle than around the centrioles. Combined data from three control cells are displayed in this graph. Data on each cell are presented in Table S1. (C) Length distributions of the rod-shaped end-links. (D–G) Angles between mother and daughter MTs (α; E), a rod-shaped end-link and a mother MT (β; F), and a rod-shaped end-link and a daughter MT (γ; G). Mother and daughter MTs were predominantly at small angles (E). The data presented in C and E–G are derived from tomographic volumes of four control cells. The sample numbers for analysis are presented for each cell in Tables 1 and S1.
These end-links were classified into two groups. In control cells, 4.6% of the closed MT ends were connected to the wall of a nearby MT by a characteristic rod (Tables 1 and S1). These connections were straight and were 29 ± 14 nm long (mean ± SD; Figs. 2 A and 3 C and Video 1). We call these augmin-dependent structures “rod-shaped end-links.” At a frequency similar to the rod-shaped end-links, we also found direct end-links between a closed end and the lattice of a mother MT; no clear structures could be detected at these connection sites (4.2% of the closed MT ends in control cells; Figs. 2 B and S3 and Tables 1 and S1).
Both kinetochore-associated MTs and other spindle MTs can be linked to closed MT ends, suggesting that any MTs can serve as the mother MT (Fig. 4 A). Given the longer lifetime of kinetochore MTs (kMTs; Salmon et al., 1984) and enrichment of augmin on them (Goshima et al., 2008; Zhu et al., 2008), it is possible that the kMT serves as the primary platform for augmin-dependent nucleation. However, many MTs in our reconstructions were positioned so we could not see both their ends; thus, the classification of most of the mother MTs in our study was uncertain.
Figure 4.
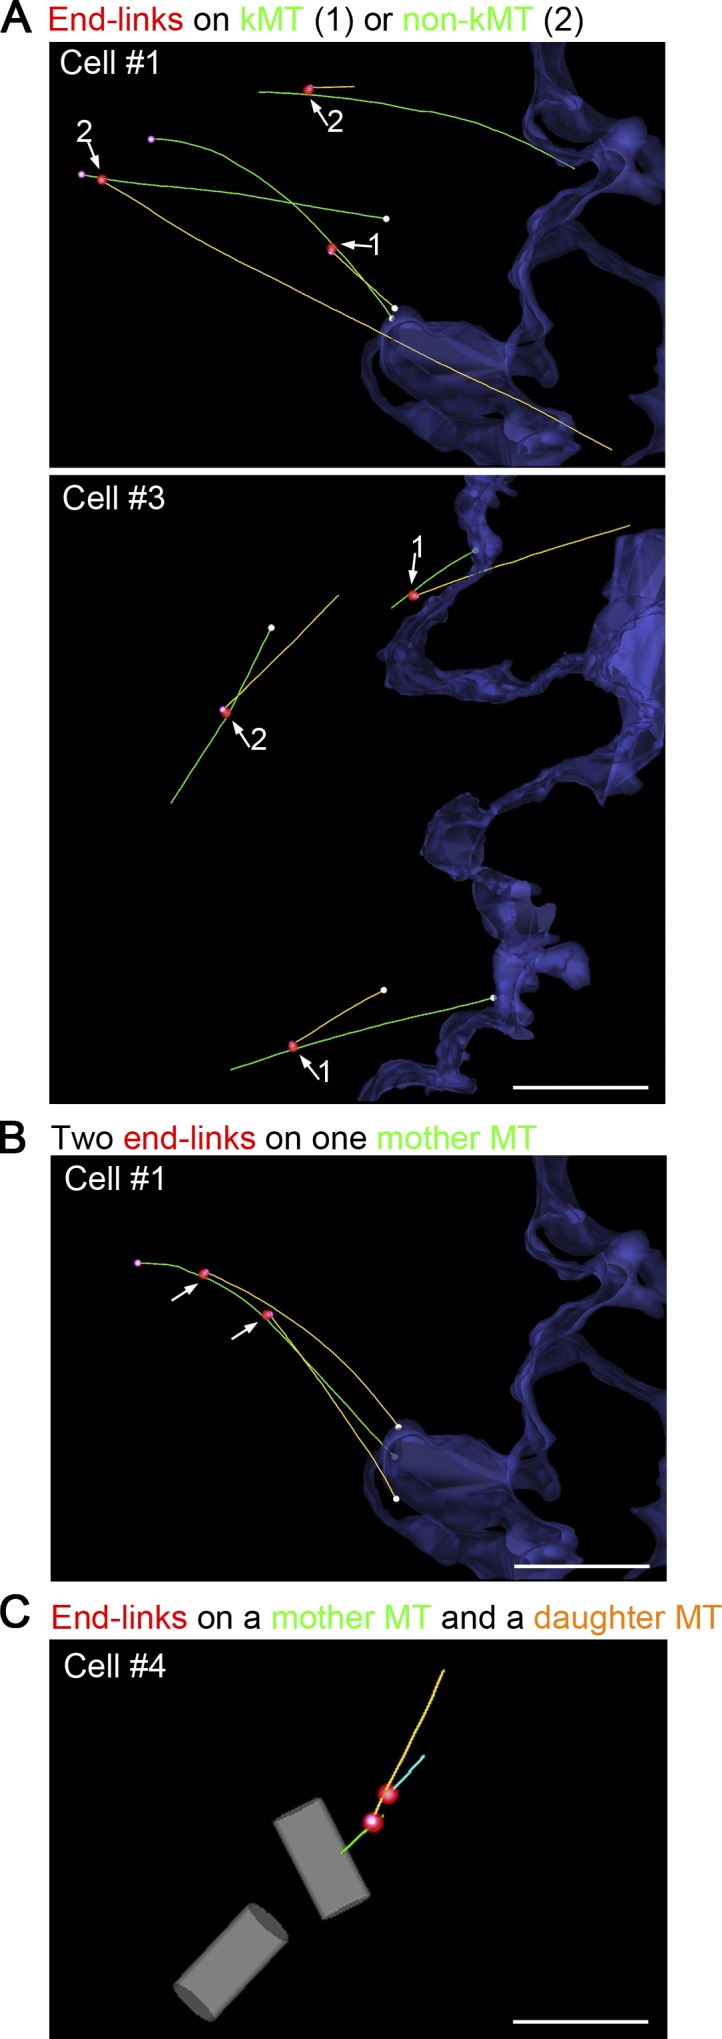
MT branching from the kMTs and non-kMTs. (A–C) Models showing examples of the “branching” sites on mother MTs. Mother, daughter, and granddaughter MTs are colored green, orange, and aqua, respectively. Closed ends, chromosome-facing open ends, and the sites of end-links are shown with magenta, white, and red spheres, respectively. The surface of the chromosomes is outlined in blue. The centriole pair is colored gray. Note that both kMTs and non-kMTs served as mother MTs (A), and in one case, a mother MT was connected by the end-links to two daughter MTs (B), and a daughter MT was further end-linked to a granddaughter MT (C). Arrows indicate the branching sites. Bars: (A and B) 1 µm; (C) 0.5 µm.
We encountered only one case in which a mother MT was connected by end-links to more than one daughter MT or in which a daughter MT was further end-linked to a granddaughter MT (Fig. 4, B and C). We interpret this observation to suggest that end-links are not very stable; they usually dissociate before a subsequent MT initiation can occur. This is in contrast to Arp2/3-dependent dendritic nucleation of actin filaments (Mullins et al., 1998). Probably, daughter MTs become detached from the mother MT and constitute the end-link–free MTs that were more frequently detected in the body of control spindles than in augmin-depleted ones (Figs. 1 and S2, A and B).
How are MTs nucleated with help of augmin and γ-TuRC, and what do the end-links represent? A plausible hypothesis is that augmin and γ-TuRC cooperate to nucleate MTs from existing MTs and that the end-link represents the connection between the wall of a preexisting MT and a γ-TuRC that can initiate a new MT. An alternative hypothesis is that the augmin complex is free in solution, binds to a γ-TuRC, and initiates an MT, which then binds to the wall of neighboring MT. Our fixed-cell analyses cannot distinguish these possibilities. However, even in the latter scenario, the mother–daughter connection would be established shortly after new MT emergence in solution because we rarely detected free, disoriented MTs inside the spindle. The 29-nm rod-shaped structure seen in control cells might correspond to the augmin complex itself. However, because augmin-dependent MT generation requires additional factors, the structures might also be an ensemble of these factors (Hutchins et al., 2010; Johmura et al., 2011; Tsai et al., 2011; Petry et al., 2013). The molecular basis of the direct end-link is also uncertain; it is possible, for example, that this end-link involves distinct but undetectable MT cross-linkers that replace the rod-shaped end-link after certain periods of time.
Nearly parallel connection of two adjacent MTs
It is noteworthy that the augmin-dependent connections, in particular the rod-shaped end-link, were predominantly found between mother and daughter MTs that made small angles with one another (<30°; Fig. 3, D–G). In the case of rod-shaped end-links, >80% of the daughter MTs diverged from their mother MTs by <20°. This organization is different from what has been observed during cytoplasmic MT-dependent MT nucleation in plants (∼40°; Murata et al., 2005), fission yeast cytoplasm (∼180°; Janson et al., 2005), and in the Arp2/3-dependent dendritic nucleation of actin filaments (∼70°; Mullins et al., 1998). Interestingly, however, small-angled (<30°), branching MT nucleation was recently reconstituted using Xenopus laevis egg extracts, and the reaction was dependent on augmin and the MT stabilizer TPX2 (Petry et al., 2013). Our result suggests that a similar type of nucleation takes place within the spindle and that end-linked MTs are given an orientation similar to that of the existing spindle MTs. We therefore propose that augmin not only plays a critical role in efficiently augmenting spindle MT numbers (Goshima et al., 2008; Uehara et al., 2009; Wainman et al., 2009; Petry et al., 2011), but it also constitutes an efficient means to organize the polar orientation of the newly initiated spindle MTs. This contrasts with centrosome- or chromosome-nucleated MTs that extend in various directions (Karsenti and Vernos, 2001; Scholey et al., 2003). Generation of randomly directed MTs at the initial phase of prometaphase would be suitable for capturing scattered chromosomes and building a bipolar spindle framework (Kirschner and Mitchison, 1986). However, once bipolarity is established, nearly parallel MT nucleation would function more efficiently in structure maintenance and/or kMT bundle formation.
This proposal is consistent with the fact that the augmin-dependent machinery is also used at late stages of mitosis, when central spindle MTs are assembled in animals and phragmoplasts in plants (Uehara and Goshima, 2010; Hotta et al., 2012; Nakaoka et al., 2012). Again, polarized MT arrays should be rapidly formed upon anaphase entry for successful cell division. This augmin-dependent MT nucleation system might also be used in other systems that require polarized MT arrays, such as epithelial cells or neurons.
Materials and methods
Immunofluorescence microscopy
Immunofluorescence microscopy was performed as previously described (Goshima et al., 2008; Uehara et al., 2009; Uehara and Goshima, 2010). In brief, cells were fixed with 6% paraformaldehyde and then stained with anti–α-tubulin antibody (YOL; EMD Millipore) and anti–γ-tubulin antibody (GTU-88; Sigma-Aldrich). For imaging, a microscope (TE2000; Nikon) equipped with a 100×, 1.40 NA Plan Apochromatic oil immersion objective lens (Nikon) and a charge-coupled device camera (MicroMAX; Roper Scientific) was used. Image acquisition was controlled using the µManager software.
Cell preparation for electron microscopy
A sapphire disc on which a finder-grid pattern was evaporated with carbon was used as a substratum during cell culture to help identify the upper side of the disc and record locations of mitotic U2OS cells (the cell line was provided by M. Nakanishi, Nagoya City University, Mizuho-ku, Nagoya, Japan). The sapphire disc was coated with 20 µl of 0.25-mg/ml Con A. Con A did not affect cell growth and helped to keep the cells attached to the substratum during the freeze-substitution process. Untreated control cells were prepared either by culturing asynchronously growing cells on the carbon/Con A–coated sapphire discs for 1–2 d or by mounting cells collected from a mitotic shake off 2 h before high-pressure freezing (HPF). Aug6 (hDgt6) RNAi was performed using the RNAiMAX reagent (Invitrogen) and the siRNA of Aug6 (5′-CAGUUAAGCAGGUACGAAATT-3′) as previously described (Uehara et al., 2009; Uehara and Goshima, 2010). 2 d after siRNA transfection, cells were subcultured on the sapphire glass for additional 1 d. Untreated or Aug6 RNAi–treated cells were incubated with 10 µM MG132 (proteasome inhibitor) for 2 h before HPF to accumulate metaphase cells with aligned chromosomes.
HPF and freeze substitution
We followed the previously described method with some modifications (Sawaguchi et al., 2008). A specially designed specimen carrier helped us to get well-preserved mitotic cell more effectively and inexpensively. Cells cultured on a sapphire disc were assembled with aluminum rings, aluminum discs, and single-slot copper grids in a 1-mm-deep sample holder (Fig. S1 A). These samples were cryoimmobilized with a high-pressure freezer (HPM 010; BAL-TEC). Specimens were then freeze substituted in anhydrous acetone containing 0.5% glutaraldehyde and 0.1% tannic acid for 2 d followed by further substitution with 1% OsO4 and 0.1% uranyl acetate (UA) for 1 d as previously described (Morphew and McIntosh, 2003). Some samples were fixed by freeze substitution in anhydrous acetone containing 1% OsO4 and 0.1% UA for 1.5 d (O’Toole et al., 2003). The infiltrated cells on the sapphire discs were embedded in Araldite–Epon (Electron Microscopy Sciences) and polymerized at 60°C for 2 d. Serial semithick sections (200–300 nm) were cut using a microtome (Ultracut; Leica) and collected onto Formvar-coated copper slot grids. Sections were poststained with 2% UA in 70% methanol and 0.4% lead citrate. Cells were imaged with an electron microscope (H-7600; Hitachi High-Tech Fielding Corporation) operating at 100 kV, and regions of interest for electron tomography were determined (4 µm × 6 µm; Fig. S1 B).
Electron tomography
Dual-axis electron tomography was performed (O’Toole et al., 2003; McIntosh et al., 2008). In brief, 15-nm colloidal gold particles (BBInternational) were attached to each surface of the sections as fiducial markers for the subsequent image alignment. These samples were imaged as tilt series with a transmission electron microscope (Tecnai F30; FEI) operated at 300 kV. The SerialEM program (Mastronarde, 2005) was used to acquire 2 × 3 or 3 × 3 montage images automatically every 1° over ±60 or 70°, using a charge-coupled device camera (2K × 2K; Gatan) at a pixel size of 1 or 1.2 nm. Tomograms from two to four serial sections were calculated using the IMOD software package and joined to produce the final volume (4–6 µm × 4–7 µm × 0.5–0.7 µm; Kremer et al., 1996; Mastronarde, 1997). This volume approximately corresponds to a 1/3 long × 1/2 wide × 1/13 thick metaphase spindle in the U2OS cell line (Fig. S1 C). We recorded four spindles each in control or Aug6 RNAi–treated cells.
Analyses of the tomographic data
Tomograms were displayed and analyzed with the 3DMOD program included in the IMOD software package (Kremer et al., 1996). The centrioles, MTs, the pole-facing and the chromosome-facing end of each MT, the end-links, and the chromosomes were modeled, and then, the substructures were meshed using the IMODMESH program to display in 3D. The outer plates of the kinetochores were also modeled to identify kMTs. The projections of the 3D models were displayed and rotated to study the 3D geometry of the spindle. The IMOD-DIST program was used for measuring the distance between a mother centriole center and the MT ends. In case the mother centriole was not included in the tomographic volume, the center of the existing centriole was used as the reference point.
To search for any structures between the closed ends and the MTs located nearby, we carefully observed the tomogram with modeled objects as follows: First, an MT with a closed end was centrally located in the slicer window of the 3DMOD program and was vertically aligned along its axis by changing the tilt of x and z axes. Then, the closed end was tilted by changing the angle of the y axis to search for other MTs located near the end. If such an MT was found, the MT lattice and the closed end were simultaneously visualized in the same plane, and we investigated whether any structures were present between them. When an electron-dense rod was observed, it was modeled as the rod-shaped end-link structure. When an MT was directly associated with the closed end, we categorized this configuration as “direct” connection. We applied this procedure five times to every closed MT end in control and augmin knockdown cells (n = 811 and n = 977, respectively). The tomographic slices were displayed after the median filter in the IMOD software package was applied.
For the MT density measurement, the 3D models of partial reconstructions were rotated and resampled using the RESAMPLEMOD program to observe cross sectioned contours of spindle MTs. Then, the MT number and the area they occupied were measured in planes perpendicular to the spindle axes and roughly 2.5 µm away from the center of the centriole. For measurement of the angle between connected mother and daughter MTs, tomographic slices were rotated so as to arrange the pole-facing side of the mother MT and the closed end of the daughter MT in a manner schematically described in Fig. 3 D. When mother and daughter MTs were parallel, the angle α was measured as 0°. Angles β or γ were independently measured for the inner angles between the end-link and mother or daughter MTs, respectively (Fig. 3 D).
Online supplemental material
Fig. S1 shows the method of sample preparation for electron tomography and the visualized MT end structures. Fig. S2 shows MT organization in the metaphase spindle and at the centriole. Fig. S3 shows the examples of direct end-links. Video 1 shows rod-shaped end-links found in control cells. Video 2 shows end-link-free closed ends in control cells. Video 3 shows end-link–free closed ends in augmin knockdown cells. Tables S1 and S2 show the analysis summary of control and augmin knockdown cells, respectively. Online supplemental material is available at http://www.jcb.org/cgi/content/full/jcb.201304031/DC1. Additional data are available in the JCB DataViewer at http://dx.doi.org/10.1083/jcb.201304031.dv.
Supplementary Material
Acknowledgments
We are grateful to Drs. Saburo Nagata and Noriko Nagata for the use of their equipment, Dr. Mamiko Sato and the Network for Collaborative Use of Microscopy (CUMNET) for HPF, Dr. Andreas Hoenger and The Boulder Laboratory for 3-D Electron Microscopy of Cells for electron tomography, Dr. Makoto Nakanishi for the cell line, and Dr. Ryota Uehara for valuable discussions.
This work was supported by the Next Generation grant (Japan Society for the Promotion of Science), Human Frontier Science Program, James A. and Faith Miller Memorial Fund (to G. Goshima), the Hori Sciences and Arts Foundation, the Sasakawa Scientific Research Grant, the Kazato Research foundation (to T. Kamasaki), and the National Institutes of Health (8P41GM103431-42 to A. Hoenger). T. Kamasaki was a recipient of the Japan Society for the Promotion of Science postdoctoral fellowship.
Footnotes
Abbreviations used in this paper:
- γ-TuRC
- γ-tubulin ring complex
- HPF
- high-pressure freezing
- kMT
- kinetochore MT
- MT
- microtubule
- UA
- uranyl acetate
References
- Bajer A.S., Molè-Bajer J. 1986. Reorganization of microtubules in endosperm cells and cell fragments of the higher plant Haemanthus in vivo. J. Cell Biol. 102:263–281 10.1083/jcb.102.1.263 [DOI] [PMC free article] [PubMed] [Google Scholar]
- Byers B., Shriver K., Goetsch L. 1978. The role of spindle pole bodies and modified microtubule ends in the initiation of microtubule assembly in Saccharomyces cerevisiae. J. Cell Sci. 30:331–352 [DOI] [PubMed] [Google Scholar]
- Courtois A., Schuh M., Ellenberg J., Hiiragi T. 2012. The transition from meiotic to mitotic spindle assembly is gradual during early mammalian development. J. Cell Biol. 198:357–370 10.1083/jcb.201202135 [DOI] [PMC free article] [PubMed] [Google Scholar]
- Goshima G., Kimura A. 2010. New look inside the spindle: microtubule-dependent microtubule generation within the spindle. Curr. Opin. Cell Biol. 22:44–49 10.1016/j.ceb.2009.11.012 [DOI] [PubMed] [Google Scholar]
- Goshima G., Mayer M., Zhang N., Stuurman N., Vale R.D. 2008. Augmin: a protein complex required for centrosome-independent microtubule generation within the spindle. J. Cell Biol. 181:421–429 10.1083/jcb.200711053 [DOI] [PMC free article] [PubMed] [Google Scholar]
- Heald R., Tournebize R., Blank T., Sandaltzopoulos R., Becker P., Hyman A., Karsenti E. 1996. Self-organization of microtubules into bipolar spindles around artificial chromosomes in Xenopus egg extracts. Nature. 382:420–425 10.1038/382420a0 [DOI] [PubMed] [Google Scholar]
- Hotta T., Kong Z., Ho C.M., Zeng C.J., Horio T., Fong S., Vuong T., Lee Y.R., Liu B. 2012. Characterization of the Arabidopsis augmin complex uncovers its critical function in the assembly of the acentrosomal spindle and phragmoplast microtubule arrays. Plant Cell. 24:1494–1509 10.1105/tpc.112.096610 [DOI] [PMC free article] [PubMed] [Google Scholar]
- Hutchins J.R., Toyoda Y., Hegemann B., Poser I., Hériché J.K., Sykora M.M., Augsburg M., Hudecz O., Buschhorn B.A., Bulkescher J., et al. 2010. Systematic analysis of human protein complexes identifies chromosome segregation proteins. Science. 328:593–599 10.1126/science.1181348 [DOI] [PMC free article] [PubMed] [Google Scholar]
- Janson M.E., Setty T.G., Paoletti A., Tran P.T. 2005. Efficient formation of bipolar microtubule bundles requires microtubule-bound γ-tubulin complexes. J. Cell Biol. 169:297–308 10.1083/jcb.200410119 [DOI] [PMC free article] [PubMed] [Google Scholar]
- Johmura Y., Soung N.K., Park J.E., Yu L.R., Zhou M., Bang J.K., Kim B.Y., Veenstra T.D., Erikson R.L., Lee K.S. 2011. Regulation of microtubule-based microtubule nucleation by mammalian polo-like kinase 1. Proc. Natl. Acad. Sci. USA. 108:11446–11451 10.1073/pnas.1106223108 [DOI] [PMC free article] [PubMed] [Google Scholar]
- Karsenti E., Vernos I. 2001. The mitotic spindle: a self-made machine. Science. 294:543–547 10.1126/science.1063488 [DOI] [PubMed] [Google Scholar]
- Kirschner M., Mitchison T. 1986. Beyond self-assembly: from microtubules to morphogenesis. Cell. 45:329–342 10.1016/0092-8674(86)90318-1 [DOI] [PubMed] [Google Scholar]
- Kremer J.R., Mastronarde D.N., McIntosh J.R. 1996. Computer visualization of three-dimensional image data using IMOD. J. Struct. Biol. 116:71–76 10.1006/jsbi.1996.0013 [DOI] [PubMed] [Google Scholar]
- Mahoney N.M., Goshima G., Douglass A.D., Vale R.D. 2006. Making microtubules and mitotic spindles in cells without functional centrosomes. Curr. Biol. 16:564–569 10.1016/j.cub.2006.01.053 [DOI] [PubMed] [Google Scholar]
- Mastronarde D.N. 1997. Dual-axis tomography: an approach with alignment methods that preserve resolution. J. Struct. Biol. 120:343–352 10.1006/jsbi.1997.3919 [DOI] [PubMed] [Google Scholar]
- Mastronarde D.N. 2005. Automated electron microscope tomography using robust prediction of specimen movements. J. Struct. Biol. 152:36–51 10.1016/j.jsb.2005.07.007 [DOI] [PubMed] [Google Scholar]
- Mastronarde D.N., McDonald K.L., Ding R., McIntosh J.R. 1993. Interpolar spindle microtubules in PTK cells. J. Cell Biol. 123:1475–1489 10.1083/jcb.123.6.1475 [DOI] [PMC free article] [PubMed] [Google Scholar]
- McIntosh J.R., Grishchuk E.L., Morphew M.K., Efremov A.K., Zhudenkov K., Volkov V.A., Cheeseman I.M., Desai A., Mastronarde D.N., Ataullakhanov F.I. 2008. Fibrils connect microtubule tips with kinetochores: a mechanism to couple tubulin dynamics to chromosome motion. Cell. 135:322–333 10.1016/j.cell.2008.08.038 [DOI] [PMC free article] [PubMed] [Google Scholar]
- Meunier S., Vernos I. 2012. Microtubule assembly during mitosis - from distinct origins to distinct functions? J. Cell Sci. 125:2805–2814 10.1242/jcs.092429 [DOI] [PubMed] [Google Scholar]
- Moritz M., Braunfeld M.B., Guénebaut V., Heuser J., Agard D.A. 2000. Structure of the gamma-tubulin ring complex: a template for microtubule nucleation. Nat. Cell Biol. 2:365–370 10.1038/35014058 [DOI] [PubMed] [Google Scholar]
- Morphew M.K., McIntosh J.R. 2003. The use of filter membranes for high-pressure freezing of cell monolayers. J. Microsc. 212:21–25 10.1046/j.1365-2818.2003.01231.x [DOI] [PubMed] [Google Scholar]
- Mullins R.D., Heuser J.A., Pollard T.D. 1998. The interaction of Arp2/3 complex with actin: nucleation, high affinity pointed end capping, and formation of branching networks of filaments. Proc. Natl. Acad. Sci. USA. 95:6181–6186 10.1073/pnas.95.11.6181 [DOI] [PMC free article] [PubMed] [Google Scholar]
- Murata T., Sonobe S., Baskin T.I., Hyodo S., Hasezawa S., Nagata T., Horio T., Hasebe M. 2005. Microtubule-dependent microtubule nucleation based on recruitment of gamma-tubulin in higher plants. Nat. Cell Biol. 7:961–968 10.1038/ncb1306 [DOI] [PubMed] [Google Scholar]
- Nakaoka Y., Miki T., Fujioka R., Uehara R., Tomioka A., Obuse C., Kubo M., Hiwatashi Y., Goshima G. 2012. An inducible RNA interference system in Physcomitrella patens reveals a dominant role of augmin in phragmoplast microtubule generation. Plant Cell. 24:1478–1493 10.1105/tpc.112.098509 [DOI] [PMC free article] [PubMed] [Google Scholar]
- O’Toole E.T., Winey M., McIntosh J.R. 1999. High-voltage electron tomography of spindle pole bodies and early mitotic spindles in the yeast Saccharomyces cerevisiae. Mol. Biol. Cell. 10:2017–2031 [DOI] [PMC free article] [PubMed] [Google Scholar]
- O’Toole E.T., McDonald K.L., Mäntler J., McIntosh J.R., Hyman A.A., Müller-Reichert T. 2003. Morphologically distinct microtubule ends in the mitotic centrosome of Caenorhabditis elegans. J. Cell Biol. 163:451–456 10.1083/jcb.200304035 [DOI] [PMC free article] [PubMed] [Google Scholar]
- O’Toole E., Greenan G., Lange K.I., Srayko M., Müller-Reichert T. 2012. The role of γ-tubulin in centrosomal microtubule organization. PLoS ONE. 7:e29795 10.1371/journal.pone.0029795 [DOI] [PMC free article] [PubMed] [Google Scholar]
- Petry S., Pugieux C., Nédélec F.J., Vale R.D. 2011. Augmin promotes meiotic spindle formation and bipolarity in Xenopus egg extracts. Proc. Natl. Acad. Sci. USA. 108:14473–14478 10.1073/pnas.1110412108 [DOI] [PMC free article] [PubMed] [Google Scholar]
- Petry S., Groen A.C., Ishihara K., Mitchison T.J., Vale R.D. 2013. Branching microtubule nucleation in Xenopus egg extracts mediated by augmin and TPX2. Cell. 152:768–777 10.1016/j.cell.2012.12.044 [DOI] [PMC free article] [PubMed] [Google Scholar]
- Raynaud-Messina B., Mazzolini L., Moisand A., Cirinesi A.M., Wright M. 2004. Elongation of centriolar microtubule triplets contributes to the formation of the mitotic spindle in gamma-tubulin-depleted cells. J. Cell Sci. 117:5497–5507 10.1242/jcs.01401 [DOI] [PubMed] [Google Scholar]
- Salmon E.D., McKeel M., Hays T. 1984. Rapid rate of tubulin dissociation from microtubules in the mitotic spindle in vivo measured by blocking polymerization with colchicine. J. Cell Biol. 99:1066–1075 10.1083/jcb.99.3.1066 [DOI] [PMC free article] [PubMed] [Google Scholar]
- Sawaguchi A., Aoyama F., Ide S., Goto Y., Suganuma T. 2008. A new device for high-pressure freezing of cultured cell monolayer using 10-microm-thin stainless discs as both culture plate and specimen carrier. J. Electron Microsc. (Tokyo). 57:203–206 10.1093/jmicro/dfn020 [DOI] [PubMed] [Google Scholar]
- Scholey J.M., Brust-Mascher I., Mogilner A. 2003. Cell division. Nature. 422:746–752 10.1038/nature01599 [DOI] [PubMed] [Google Scholar]
- Schuh M., Ellenberg J. 2007. Self-organization of MTOCs replaces centrosome function during acentrosomal spindle assembly in live mouse oocytes. Cell. 130:484–498 10.1016/j.cell.2007.06.025 [DOI] [PubMed] [Google Scholar]
- Tsai C.Y., Ngo B., Tapadia A., Hsu P.H., Wu G., Lee W.H. 2011. Aurora-A phosphorylates Augmin complex component Hice1 protein at an N-terminal serine/threonine cluster to modulate its microtubule binding activity during spindle assembly. J. Biol. Chem. 286:30097–30106 10.1074/jbc.M111.266767 [DOI] [PMC free article] [PubMed] [Google Scholar]
- Uehara R., Goshima G. 2010. Functional central spindle assembly requires de novo microtubule generation in the interchromosomal region during anaphase. J. Cell Biol. 191:259–267 10.1083/jcb.201004150 [DOI] [PMC free article] [PubMed] [Google Scholar]
- Uehara R., Nozawa R.S., Tomioka A., Petry S., Vale R.D., Obuse C., Goshima G. 2009. The augmin complex plays a critical role in spindle microtubule generation for mitotic progression and cytokinesis in human cells. Proc. Natl. Acad. Sci. USA. 106:6998–7003 10.1073/pnas.0901587106 [DOI] [PMC free article] [PubMed] [Google Scholar]
- Wainman A., Buster D.W., Duncan T., Metz J., Ma A., Sharp D., Wakefield J.G. 2009. A new Augmin subunit, Msd1, demonstrates the importance of mitotic spindle-templated microtubule nucleation in the absence of functioning centrosomes. Genes Dev. 23:1876–1881 10.1101/gad.532209 [DOI] [PMC free article] [PubMed] [Google Scholar]
- Walczak C.E., Heald R. 2008. Mechanisms of mitotic spindle assembly and function. Int. Rev. Cytol. 265:111–158 10.1016/S0074-7696(07)65003-7 [DOI] [PubMed] [Google Scholar]
- Zhu H., Coppinger J.A., Jang C.Y., Yates J.R., III, Fang G. 2008. FAM29A promotes microtubule amplification via recruitment of the NEDD1–γ-tubulin complex to the mitotic spindle. J. Cell Biol. 183:835–848 10.1083/jcb.200807046 [DOI] [PMC free article] [PubMed] [Google Scholar]
Associated Data
This section collects any data citations, data availability statements, or supplementary materials included in this article.