

Abstract
In the current work, we report on simulations of double-stranded DNA (dsDNA) ejection from bacteriophage φ29 into a bacterial cell. The ejection was studied with a coarse-grained model, in which viral dsDNA was represented by beads on a torsionless string. The bacteriophage’s capsid and the bacterial cell were defined by sets of spherical constraints. To account for the effects of the viscous medium inside the bacterial cell, the simulations were carried out using a Langevin Dynamics protocol. Our simplest simulations (involving constant viscosity and no external biasing forces) produced results compatible with the push-pull model of DNA ejection, with an ejection rate significantly higher in the first part of ejection than in the latter parts. Additionally, we performed more complicated simulations, in which we included additional factors such as external forces, osmotic pressure, condensing agents, and ejection-dependent viscosity. The effects of these factors (independently and in combination) on the thermodynamics and kinetics of DNA ejection were studied. We found that, in general, the dependency of ejection forces and ejection rates on the amount of DNA ejected becomes more complex if the ejection is modeled with a broader, more realistic set of parameters and influences (such as variation in the solvent’s viscosity and the application of an external force). However, certain combinations of factors and numerical parameters led to the opposition of some ejection-driving and ejection-inhibiting influences, ultimately causing an apparent simplification of the ejection profiles.
Introduction
A bacteriophage is a type of virus which infects bacteria. As is the case with all viruses, the bacteriophage contains a genome made of nucleic acid but does not possess the necessary reproductive machinery to make copies of itself; as part of its reproductive cycle, a bacteriophage must infect a bacterium and hijack its new host’s replication abilities [1]. The genome of most bacteriophages comprises a double-stranded DNA molecule (dsDNA), which is tightly packed inside a protein shell (the capsid) through the packaging portal. This protein portal is extended during the final stages of phage assembly and serves as a channel through which the virus ejects its genome into its host cell [2]. This cylindrical channel (and its associated membrane-binding and -puncturing structures) is called the phage connector. The genomes of different bacteriophages vary in size between 10 and 200 kilobasepairs and are tightly packed inside the capsid, occupying 30–55% of the total capsid volume [3, 4]. The packaging is not spontaneous, and must be aided by ATP-driven molecular motors [5].
The packaging of the DNA genome inside the bacteriophage is an important stage in the bacteriophage’s lifecycle. This process has been intensively studied experimentally (through single-molecule pulling experiments using optical tweezers) [6–8], theoretically (with continuum approximations) [9–11], and computationally (by means of different flavors of molecular modeling techniques) [12–20]. All these techniques demonstrate that high forces (up to 100 pN) are required to pack the genome inside the capsid [7, 11, 21]. These forces increase steeply with the packaging of the last ~30% of the genome. Three major factors responsible for the high magnitude of these forces are the repulsive DNA-DNA interactions, the unfavorable bending of DNA inside the capsid, and the entropic penalty associated with confinement of DNA inside a closed space [12, 20, 22].
The experiments conducted by Rau and Pasegian revealed that interactions between closely-packed DNA molecules have a complex nature; the net forces between segments of the DNA molecule depend on the interplay between the unfavorable electrostatic DNA-DNA interactions (the enthalpic component) and the favorable release of water molecules from DNA hydration layers to the bulk upon confinement (the entropic component) [23, 24]. In sodium and/or magnesium buffers, the unfavorable enthalpic interactions are greater than the corresponding entropic term, and the net interactions are therefore repulsive [23]. The presence of tri- and polyvalent cations lowers the magnitude of the enthalpic term and causes DNA-DNA interactions to become attractive, in turn causing DNA-DNA condensation [24, 25].
Ejection of DNA from the bacteriophage to the cell is another stage in the bacteriophage’s life cycle. In contrast to DNA packaging, the ejection is a spontaneous process, driven by the free energy of DNA stored inside the capsid [9, 26, 27]. This free energy can be represented as the sum of a bending energy term, an entropic term, and a term associated with DNA-DNA interactions mediated by water molecules [28–30]. The resulting effect is the exertion of outward pressure against the walls of the capsid.
Prior to ejection, the DNA stored in the capsid is in equilibrium with the solvent; the high hydrostatic pressure inside the capsid is balanced by the low osmotic pressure outside of the capsid, and the outward pressure of the DNA is counterbalanced by tension stress in the capsid shell. When DNA ejection is initiated by the phage binding to a bacterial cell (which results in the portal opening), the pressure of the DNA on the capsid walls is no longer balanced, and the DNA molecule squeezes its way out of the capsid due to the free energy difference caused by the pressure gradient. As a small portion of the DNA leaves the capsid, the hydrostatic and the osmotic pressures become unbalanced, and some water molecules from the outer region enter the capsid. Since the diffusion coefficient of water molecules across the capsid shell is much higher than that of DNA exiting the capsid, water molecules redistribute themselves between the inner and outer regions of the capsid much faster than the DNA ejects. Therefore, at any point of the ejection trajectory, the solvent molecules are in a quasi-equilibrium state with respect to the unequilibrated DNA. Thus, according to this most straightforward model of DNA ejection, the DNA simply flows down its free energy gradient upon the opening of the phage portal.
Because of its extreme simplicity, this osmotic-pressure-driven model of ejection has several deficiencies. Firstly, it does not explain how the second portion of the genome gets ejected into the cell as the osmotic force (i.e., the force corresponding to the osmotic pressure difference) sharply drops to nearly zero upon the ejection of the first half of the genome [8, 31], and therefore, the osmotic pressure difference is no longer a major factor that drives the ejection. Secondly, this mechanism implies that the ejection rates should be proportional to the difference between the osmotic pressures inside the bacteriophage and the cell and that, therefore, the ejection rate should decrease as more DNA leaves the capsid. [28] Using a theoretical continuum approach, Kindt et al. [9] suggested that the ejection of the complete genome in vivo would not be fully spontaneous and, therefore, would be incomplete or require some active assistance. Based on the available experimental and theoretical data, the so-called “push-pull” mechanism for DNA ejection was proposed. According to the push-pull mechanism, the first part of the ejection is driven by the osmotic pressure difference between the bacteriophage and the cell, and the second half is assisted by some additional force acting on the ejected DNA (e.g., pulling by the auxiliary proteins, condensing agents) [32].
In vitro ejection from bacteriophages T5 and Lambda can be complete and spontaneous, and these viruses have been used as model phages in a number of in vitro studies. In vitro experiments, in which the ejection fraction of bacteriophage T5 genome was monitored in real time using fluorescently labeled DNA stretched by water flow, revealed stepwise DNA ejection profiles [33]. Even more complicated ejection rate profiles were observed in the ejection studies of bacteriophage Lambda (using a similar flow-cell technique) by the Phillips group; the ejection rates increased at the beginning of the ejection trajectory and slowed down toward the end [34].
Contrary to the in vitro studies, experimentally measured in vivo DNA ejection rates for bacteriophage T5 were found to be independent of the fraction of DNA ejected [28], while the push-pull mechanism predicts an ejection rate dependent on the fraction of DNA ejected. It was also experimentally demonstrated that DNA ejection from some bacteriophages (e.g. φ29) in vivo is partially assisted by auxiliary proteins synthesized during the initial stages of ejection [32]. Temperature-dependent in vivo ejection studies of bacteriophages T7 and SP82 revealed that the entropy is not a driving force for the DNA ejection [35, 36]. It has been pointed out that ejection in vivo and in vitro may occur through different mechanisms [28].
Recently, Panja and Molineux proposed another theory, which attempts to bridge the discrepancies between the available experimental data and physical models [37]. According to this theory, the osmotic pressure difference between the extracellular and cellular media drives water through the semipermeable viral capsid and down the phage connector into the cell, flushing the DNA along with it.
Due to the complexity and size of viruses, the main stages of their life cycles (capsid assembly, genome packaging, and ejection) cannot be modeled at the all-atom level of detail. Over past two decades, a large number of coarse-grained models of DNA have been proposed at a variety of resolutions. Some of the more complex, finer-grained models account for the helical nature of the dsDNA using mean field approximations (see refs. [38, 39] for a review). These complex models may also be capable of capturing a phenomenon of electrostatic friction upon sliding highly crowded double helical DNA molecules along each other. [40, 41] Unfortunately, their high accuracy and ability to treat systems containing high concentrations of cationic species [38, 39] come at the cost of too much computational expense to be employed for large macromolecular systems.
Thus, for practical purposes, coarser-grained models that represent DNA as a cylindrically symmetrical string of beads are often used. Some of these models oversimplify the behavior of DNA by only accounting for the elastic behavior of DNA and ignoring its electric charge [15, 17, 42, 43]. Other models explicitly account for the presence of cationic species in the system [44] and are capable of describing DNA condensation.
Finally, there is a group of models that describe DNA as charged beads on a string while also treating the long range DNA-DNA interactions by a mean field approach and implicitly accounting for salinity of the system. [12, 18, 45] Despite some oversimplifications, this last group of models looks the most attractive for simulations of the large viral and bacteriophage systems. It has been shown to provide quantitatively satisfactory results for the thermodynamic parameters of packing DNA inside bacteriophages. [12, 13]
DNA ejection has been simulated in previous studies [15, 43, 46]; however, the literature contains many fewer examples of ejection simulations than of packaging simulations. Particularly, Marenduzzo and co-workers [47] simulated the ejection of the half-P4 genome and showed that the ejection rate has some dependence on the concentration of knots which form in the middle of the ejection trajectory.
In this study, we investigate the thermodynamics and kinetics of DNA ejection. Initially, we discuss a simple “free” model of ejection of viral DNA from bacteriophage φ29 into a spherical bacterial cell [19]. Further, we introduce additional factors (such as different pulling forces, osmotic pressure, condensing agents, and variable viscosity), which are treated at the phenomenological level within the framework of our proposed ejection model. We discuss the effects of these factors on the thermodynamics and kinetics of the ejection, and compare our results with experimental observations.
METHODS
Two simulation packages were used extensively during this study: YUP [48] (running jobs serially) and LAMMPS [49] (running jobs in parallel). For simple ejection simulations (no applied force, no variation in viscosity), we found the results of these two implementations to be nearly identical (Fig. 1S). For more complex systems, we exploited the advantages of each simulation package; LAMMPS has very flexible viscosity protocols, for example, while YUP allows multiple simultaneous electrostatic potentials.
System Setup
The full ejection model includes DNA, the capsid, the connector channel, and a bacterial cell [45]. DNA was represented with the “beads on a string” coarse-grained model built into the YUP package [48], in which each bead corresponds to six base pairs. Thus, we represented the 19.7 kbp φ29 genome with 3212 beads. For simplicity, the φ29 capsid was modeled by a sphere with a radius of 225 Å [19]. The protein channel connecting the capsid and the bacterial cell is constructed as a hollow cylinder made of soft spheres with an inner diameter of 35 Å and a total length of 250 Å, with a 50 Å portion penetrating inside the capsid to mimic to the protein core used in the packaging simulations. The bacterial cell is modeled as a semiharmonic sphere with a radius of 1 μm. (Fig. 2S).
The geometry of the variable-viscosity LAMMPS simulations was also typical of the φ29 phage, but was slightly different from the YUP model; a spherical capsid of radius 238 Å was connected to a bacterial cell approximated by 2-micron-radius spherical cell with a 200 Å-long cylindrical tube (We point out that the main reason for such approximation was to separate inter- and extracellular regions). The DNA chain (modeled with the same parameters as the YUP chain) was confined to the capsid-tube-cell region with a semiharmonic constraining potential. In order to eliminate the biasing effects of irreversible ejection into the cell, each bead in the DNA chain was allowed to eject into a buffer zone in which the cell restraints were not enforced between the phage connector and the cell. A spherical boundary representing a bacterical cell was applied by checking which beads had penetrated 30 Å into the cell region every 10,000 steps and affixing a permanent semiharmonic boundary restraint to them.
Force Field
The force field terms can be partitioned into three groups: terms that describe the DNA molecule, terms that describe interactions between the DNA molecule and the other parts of the system, and terms that describe additional external forces.
The first group includes the harmonic stretching and bending terms (responsible for the elastic properties of DNA) and the DNA-DNA interaction terms (modeled as a sum of a DNA-DNA volume exclusion term and a DNA-DNA electrostatic term). The elastic parameters of DNA and all soft-sphere constants are those reported by Locker and Harvey [42]. Specifically, the numerical values of the constants are kb=3.5 kcal/(mol·A2), b0=19.9 Å, kθ=22.4 kcal/(mol·rad2), θ0=19.9 rad. The DNA-DNA volume exclusion term was modeled by a harmonic potential between the DNA soft spheres with kDNA-DNA=3.5 kcal/(mol·A2), d0,DNA-DNA=25.0 Å. A cutoff distance of 50 Å was used for calculating the volume exclusion terms.
Long-range DNA-DNA interactions, which are responsible for the high forces required to pack DNA inside the capsid and also play an important role in driving ejection, were considered in two regimes. The first regime is repulsive and observed in sodium/magnesium buffers. For the repulsive regime, the functional form of the DNA-DNA interactions was empirically derived from the experimental data of Rau and Parsegian and modeled as a function of DNA interaxial distance, r, by a modified Debye-Hückel function [13]:
| (1) |
where Lb = 7.135 Å is the Bjerrum length and 0.59 is the conversion factor to kcal/mol. The numerical parameters for the effective charge (qeff = −12.6 e per pseudoatom), the effective screening constant (κeff = 0.31 Å−1), and DNA radius (a = 12.5 Å) were obtained from the osmotic pressure data of Rau and Parsegian as previously described [13] and correspond to a buffer containing 10 mM MgCl2, 100 mM NaCl, and 10 mM TrisCl.
The interaction between DNA strands in the attractive regime, observed in the presence of polycations which induce DNA condensation [50], is described by the following empirical relationship:
| (2) |
with A1 =11 cal/(mol·bp), A2=12 cal/(mol·bp), b1=30.5 Å, b2=37.5 Å, c1= 2.6 Å, and c2=6.3 Å [51, 52]. The parameters have been derived to match the data for the attractive interactions in the presence of cobalt haxamine occurring in the range ~25–34 Å (with a minimum of ~120 cal/(mol·bp) at ~27.7 Å, as estimated by Tzlil et al. [10]) and the repulsive interactions in the range 35–50 Å as experimentally observed by the osmotic pressure data obtained in the presence of polycations by Rau and Parsegian. [24]
The interaction of the DNA with the capsid and bacterium restraints was modeled by using a semiharmonic potential with the following parameters kDNA-Capsid=8.8 kcal/(mol·A2), d0,DNA-Capsid=237.5 Å; kDNA-Bacteria=8.8 kcal/(mol·A2), d0,DNA-Bacteria=10012.5 Å. The connector between the capsid and the bacterium within the YUP package was modeled using close-packed soft spheres with a radius of 8 Å. The interactions between the DNA beads and the connector’s pseudoatoms were modeled by the harmonic function with kDNA-Connector=8.8 kcal/(mol A2), d0,DNA-Connector=20.5 Å. The parameters for the LAMMPS model were only slightly different, with kDNA-Capsid= kDNA-Bacteria = kDNA-Connector =12.0 kcal/(mol A2). Also, the phage connector was modeled as a continuous cylindrical region with radial semi-harmonic restraints imposed on the DNA chain.
External Force Protocols
External biasing forces [53] (ranging between 2–128 pN) were applied to the DNA chain using one of three methods. First, the “ejected” method (resembling perhaps the flow of solvent past the phage portal [33, 34] in line with the phage tube) divides the total force by the number of pseudoatoms in the DNA chain and applies this fractional force permanently to each pseudoatom as it is ejected. In keeping with experimental convention, we express the external forces we apply to the DNA chain in terms of the equivalent pressure over the phage portal. Since the force of 1 atm of pressure applied over the cross-sectional area of a 17.5 Å-radius phage connector is 0.975 pN, we treat atm and pN interchangeably. Second, the “last atom” method (resembling the manipulation of one end of the DNA by optical tweezers) applies the entire force permanently to the first pseudoatom ejected from the phage. Finally, the “tube” method (intended to model forces acting locally within the phage tube, such as hydrodynamic flushing [37]) applies the total constant external force to a single pseudoatom in the center of the phage tube. When this pseudoatom moves past the center of the tube, the external force is removed from that pseudoatom and applied to the next one in the chain.
The “tube” force protocol deserves special mention, as it is phenomenologically similar to the force of intracapsid pressure acting on the DNA in the phage connector. During DNA ejection in vivo, there exists a gradient of osmotic pressure between the confined DNA within the viral capsid and the “free” DNA inside the bacterium. Likewise, osmolyte concentration within the bacterial cytoplasm creates an opposite but lesser osmotic gradient across the phage connector. By reversing the sign of the “tube”-applied force, we were able to approximate the effects of (constant) osmotic pressure acting against the ejecting DNA.
Langevin Dynamics
The viscosity of the medium inside the bacterial cell and/or the bacteriophage affects the thermodynamics [54] and kinetics of ejection [34], so we carried out ejection simulations using the Langevin Dynamics (LD) protocol. Langevin Dynamics is an implicit solvation method which simulates the effect of water on a particle by periodically subjecting that particle to a random collision force and a deterministic drag force. The frequency of the application of this force, the magnitude of this force, and the Stokes drag coefficient in Langevin Dynamics are all determined by a single parameter, the collision frequency (γ) Specifically, the force on each particle in the Langevin system is
| (3) |
where m is the mass of the particle, r⃑ is the collective coordinates of the particle, U(r) is the conservative interparticle potential, r⃑(t) is a function generating a vector of random orientation with random length between 0 and 1, kB is Boltzmann’s constant, T is the temperature, and dt is the timestep of the simulation.
The temperature of the sytem over the course of simulations was maintained at 298 K using Langevin thermostat, and the simulation time step was 0.5 ps. The frequency of applied stochastic forces (the collision frequency) varied over the range 0.001–0.02 ps−1 [55]. Different viscosity regimes were studied to probe how the viscosity of the medium affects ejection kinetics; we accomplished this by changing γ inside the capsid (γin), inside the cell (γout), or both between different runs.
Viscosity Functionals
In order to explore the effects of variable viscosity on our ejection profiles [56], we implemented two different viscosity functionals which describe the viscosity inside the capsid as a function of the proportion of ejected DNA. The two viscosity functionals explored in this paper are termed “semilogarithmic” and “radical”; in both, the viscosity is a monotonic function of packing fraction. The radical functional was derived on the supposition that the viscosity of the water depends exponentially on the average distance between DNA surfaces in the packed capsid, which itself goes as (1 − fejec)−0.5 as a function of the ejected fraction, fejec, as shown in the supplemental materials. Thus, our radical functional is defined as
| (4) |
where γin is the Langevin collision frequency inside the viral capsid, γout = γlow is the Langevin collision frequency in the cell medium, dDNA,0 is the center-center distance (28 Å) of DNA in a fully-packed capsid, and dDNA (22 Å) is twice the radius of our DNA chain. The factor −0.15 was chosen empirically such that γin was within a factor of 2 of γhigh when ejection began. γhigh and γlow were varied for each run.
The semilogarithmic functional,
| (5) |
was conceived simply as an alternative choice for a sublinear functional. The behavior of both functions is shown in Fig. 3S (supplemental material).
Force Measurements
To determine the packaging forces, conformations obtained at intervals of ten percent along the packing trajectories were taken as starting points for a series of new MD runs. Each of these runs was equilibrated for an additional 20 ns at 300 K before running the force measurement. The packed DNA has an excess of free energy and tries to escape the capsid; this causes the springs connecting the DNA tail beads and the stud atoms to be stretched from their equilibrium positions. To collect statistically uncorrelated data, the restraining force was measured at 500 ps intervals along different MD trajectories for a total of 1000 independent data points.
DNA Stretching by External Forces
To determine the force required to keep DNA straight (i.e., to keep end-to-end distance at least 90% of the contour length), we performed a series of simulations. One end of a DNA chain containing 3218 beads (19.7 kbp) was fixed in place, and the other beads (initially laid out in a straight line with no stretch) were subjected to an external force varying between 0 pN and 128 pN, then simulated at 298 K with Langevin Dynamics and a viscosity of 2×10⁻³. The net force was divided equally and permanently among the beads, such that it would mimic the effect of the drag force of water flowing along the length of the chain. We monitored and reported the ratio of the end-to-end distance to the contour length of the DNA chain as a function of time (Fig 4S).
Results
To set the baseline reference for our study, we performed a set of simple ejections with repulsive DNA-DNA interactions using the same constant viscosity inside and outside the capsid and applying no external forces. To test the effect of viscosity on the thermodynamics and kinetics of the ejection, we used two values of γ: low (10−3 ps−1) and high (2 × 10⁻² ps−1) [55]. At both values of γ, the ejection was completed in tens of simulated microseconds; as expected, the ejection at a low value of γ was faster (~8 μs) than at a high value (~38 μs). These times are much smaller than the ejection times observed in in vitro and in vivo experiments, which are on the order of seconds or minutes. Snapshots from the ejection trajectory at low viscosity are shown in Fig. 1; DNA shoots out into the cell region and forms an isometric random blob. The complete ejection trajectories are available at http://rumour.biology.gatech.edu/Publications/showcase.html, and the amount of DNA ejected as a function of time is depicted in Fig. 2a.
Figure 1.
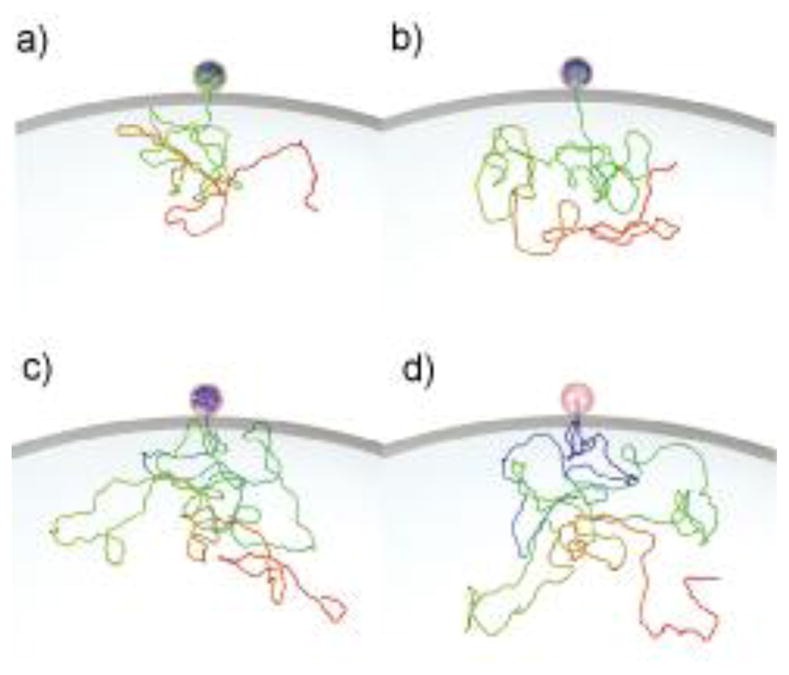
Snapshots from a Langevin Dynamics trajectory (γ=10−3) for a viral DNA ejecting from bacteriophage φ29 (modeled as a sphere) into a bacterial cell: a) 25% of genome ejected; b) 50% of genome ejected; c) 75% of genome ejected; d) 100% of genome ejected.
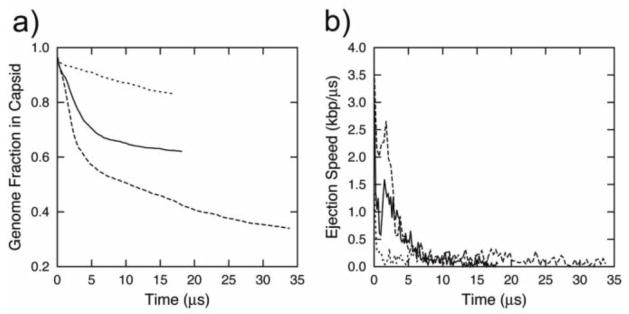
Figure 2.

Ejection data for a viral DNA released from bacteriophage φ29: a) Fraction of DNA inside the capsid as a function of time (γ = 10−3 ps−1 solid line, γ =2×10⁻² ps−1 dashed line); b) Ejection rate as function of time (γ = 10−3 ps−1 solid line, γ =2×10⁻² ps−1 dashed line); c) Force acting on the beads inside the connector as function of the DNA fraction inside the capsid during packaging (filled circles) and ejection (open circles); d) Force acting on the beads inside the connector as function of the DNA fraction inside the capsid during ejection with γ=10−3 ps−1 (open circles) and 2×10⁻² ps−1 (filled circles).
As shown in Fig. 2b, the ejection rates rapidly slow down upon the ejection of the first half of the genome and stay nearly constant throughout the ejection of the second half of the genome. This is consistent with a simple model of ejection (described in the introduction) initially driven by the osmotic pressure difference inside and outside the capsid. However, we also observe some increase in the ejection rate at the last ~10% of ejection. We will provide an explanation for this phenomenon in the next section.
The forces exerted on the beads inside the connector are probed in Fig. 2c. This figure demonstrates that the forces during ejection at low viscosity closely correspond to the forces previously obtained from packaging simulations [13]. The forces sharply drop from ~60 pN to ~0 pN (~60 atm to ~0 atm) upon the ejection of the first half of the genome and remain small until the ejection ends. Some difference between packaging and ejection is observed when most of the DNA is outside the capsid; in the case of ejection, we observe a small growth in the magnitude of the force that pulls outward on the DNA. This difference is explained by the differing construction of the two systems; the ejecting system always contains the complete genome, while the DNA in the packaging system was created bead-by-bead inside the capsid as the simulation progressed. A small pulling force acting on a partially confined polymer has been predicted, simulated, and estimated from experimental data in a study by Prinsen et al. [57] Thus, the packaging system totally neglects all effects caused by DNA outside the capsid. Fig. 2d compares the outward force on the DNA bead inside the phage connector during ejection at low viscosity and at high viscosity. These forces are comparable over most of the trajectory. However, the increase in force observed for the high-viscosity case is not as pronounced as for the case of low viscosity.
The Nature of the Additional Pulling Force
In order to investigate the origin of the small force seen at the end of the ejection trajectories, we performed a set of independent simulations on a system containing DNA molecules of different lengths (from 5 kbp to 35 kbp) attached to the interior wall of a cell membrane (Fig. 3a). As the length of the DNA increases, the force exerted on the anchor point located at the cell wall grows to ~3 pN (Fig. 3b). In a study by Prinsen et al., the predicted force was estimated to be a few tenths of a piconewton. [57] This force has an entropic origin; it is due to the constraint imposed on one end of the DNA molecule. A similar entropic force has been observed in previous ejection simulations36 and experimentally for a polymer system confined inside a cylindrical tube with an applied oscillatory force. In that experiment [58], this entropic force resulted in the ejection of the polymer from the confined space.
Figure 3.
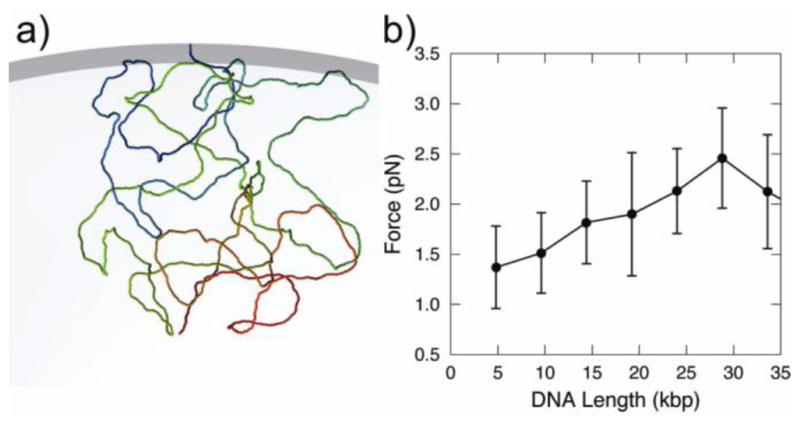
a) Snapshot of a DNA conformation (20 kbp) attached to the inner wall of the bacterial cell; b) Force acting on the DNA beads attached to the inner wall of the bacterial cell inside as function of the DNA length (kbp).
This force was much less pronounced in a high-viscosity medium than in a low-viscosity medium. We attribute this to the fact that, at high viscosities, the motion of the DNA chain is overdamped. A highly viscous medium will preferentially extinguish higher-frequency vibrational modes in the DNA chain’s motion, while also suppressing the entire spectrum of vibration. A DNA chain in a low-viscosity medium therefore possesses a greater number of vibrational modes occupied by a greater amount of vibrational energy, and is less entropically restricted than the high-viscosity chain. Nevertheless, both chains possess a nonzero amount of vibrational motion, and this explains the acceleration of ejection observed near the end of the ejection trajectory.
Ejection Assisted by External Pulling Forces
A number of different in vivo and in vitro experiments revealed the presence of additional forces assisting DNA ejection from bacteriophage. For example, it is known that the ejection of the second half of the genome of bacteriophage φ29 is assisted by some auxiliary proteins [32].
In experiments performed in vitro using the flow cell method [33, 34], the kinetics of ejection was quantified by measuring the length of ejected DNA stretched by a constant flow of water. In order to estimate the magnitude of this flow-induced stretching force, we performed a series of simulations on extended DNA under an external force applied to every DNA bead. Our simulations reveal that, in order to keep the DNA end-to-end distance at least 90% of DNA contour length, a net force of >4 pN has to be applied along the length of the chain (Fig. 4S).
One can also accelerate ejection by pulling on one end of the DNA molecule with an optical tweezer. Additionally, a theory suggesting that DNA ejection is facilitated by water flow through the bacteriophage connector has been asserted by Panja and Molineaux [37]. Thus, we suspect that external forces might play a role in the ejection process.
Within our ejection framework, we incorporated three different methods of treating those forces at the phenomenological level. As discussed in the methods, the “last atom” method simulates the force applied by an optical tweezer pulling on one end of the DNA molecule, the “tube” method simulates a proposed force of water flushing through the bacteriophage connector [37], and the “ejected” method simulates the force of constant external water flow.
We performed two series of ejection simulations at low constant viscosity with an external force of 4 pN and 16 pN applied to the DNA by the three different mechanisms described above. These ejection fractions vs. time dependencies are shown in Fig. 4a and 4c; the corresponding ejection rate profiles are depicted in Fig. 4b and 4d respectively. Comparisons between the free ejection profile (Fig. 2a) and both the “last atom” and “ejected” methods show only a slight acceleration of ejection upon the application of both a 4 pN and 16 pN force (this acceleration was somewhat greater for the “ejected” method).
Figure 4.

Ejection data for a viral DNA released from bacteriophage φ29 at constant viscosity (γ=10−3 ps−1 under applied forces; a) Fraction of DNA inside the capsid under an applied pulling force of 4 atm as a function of time; b) Ejection rate of DNA under an applied pulling force of 4 atm as function of time); c) Fraction of DNA inside the capsid under an applied pulling force of 16 atm as a function of time; d) Ejection rate of DNA under an applied pulling force of 16 atm as function of time. The dashed lines represent a case where the force was applied to one pseudoatom inside the connector; the solid lines depict the protocol where the full magnitude of force was applied to the first ejected pseudo-atom; and the dotted lines correspond to the force equally distributed over all ejected pseudo-atoms.
A significant effect of the pulling force on the ejection time was observed for the “tube” method; the ejection time was reduced by a factor of 2 for the 4 pN case and by more than a factor of 4 for the 16 pN case. Despite these differences, we did not observe a significant qualitative change in the ejection rate profiles. During the initial stages of ejection, the rates sharply decreased; during the latter half of ejection, the ejection rate remained near-constant with some acceleration toward the end. (This acceleration was much greater for the “tube” case). Therefore, the presence of external forces alone does not explain the discrepancies between the simple push-pull mechanism and the available experimental data on DNA ejection in vivo and in vitro.
The Effect of Osmotic Pressure
It is known that when DNA enters the cell, it is subjected to the effect of the cell’s osmotic pressure (which has been suggested to be between 2 atm–4 atm, although the exact value of this pressure is still a subject of debate) [28]. Within the framework of our model, the effect of osmotic pressure was simply taken into account by applying an inward restraining force using the “tube” protocol. By performing a series of simulations with varying “osmotic forces” from 1 pN–64 pN, we found that small values of osmotic force (~1 pN–4 pN) result in a slowdown of ejection (from 8 μs to 10 μs or 25 μs) but nevertheless do not prevent the DNA from totally ejecting (results are not shown). The osmotic forces ranging from 8 pN to 64 pN stall the entry of DNA into the cell at different fractions of genome ejected (Fig. 5a) [54]. The ejection rates of these restrained systems follow the previously-described pattern of the first half of ejection (Fig. 5b).
Figure 5.
Ejection data for a viral DNA released from bacteriophage φ29 at constant viscosity (γ=10−3 ps−1 and different magnitudes of the restrained force applied on a one pseudo-atom inside the connector). a) Fraction of DNA inside the capsid as a function of time; b) Ejection rate of DNA as function of time. Dashed lines represent the restraining force of 8 atm, solid lines correspond to the force of 16 atm, and the dotted lines depict the force of 32 atm.
Ejection Assisted by DNA Condensation
The ionic composition of the extracellular medium (which is expected to be in equilibrium with the ionic composition inside the bacteriophage, since its walls are permeable to these ionic species) is different from that inside the cell. The cytoplasm contains some concentration of polycations, which are known to induce DNA condensation. However, this concentration is not sufficient to condense DNA inside the cell by polycations alone [59]. In addition to polycations, the cell also contains positively-charged proteins like HU or IFT bind to DNA and induce it to bend sharply [52]. These proteins do not themselves cause the DNA to condense, but they promote it in the presence of polycations. It has been shown in vivo that while polycations are not strictly required for the infection of bacterial cells [60], their presence would nevertheless facilitate DNA ejection.
To model DNA condensation inside the cell phenomenologically, we designed a system in which the DNA was subjected dynamically to different DNA-DNA interaction potentials as each pseudoatom passed from the capsid region to the cell region; the interactions between DNA strands inside the capsids were treated according to Eqn. 1, and those for DNA ejected in the cell were described by Eqn. 2. Fig. 6 contains snapshots from such trajectories. By running several such trajectories, we observed that the DNA would condense into a rodlike particle or a toroidal structure. Sometimes, transitions between rodlike and torioidal structures were seen within a single ejection trajectory (similar to what is shown in Fig. 6). A similar condensation of DNA molecules into toroidal particles was experimentally observed during in vitro ejection [59, 61] and the effect of the condensing agents (as well as the effects of HU proteins) on the ejection were studied by Alex Evilevitch and his research group [59, 62, 63].
Figure 6.

Snapshots from a Langevin dynamics trajectory (γ=10−3) for a viral DNA ejecting from bacteriophage φ29 (modeled as a sphere) into a bacterial cell in a mixed regime (with the repulsive potential between DNA strands inside the capsid, and the attractive potential between DNA strands inside the bacterial cell). a) 25% of genome ejected; b) 50% of genome ejected; c) 75% of genome ejected; d) 100% of genome ejected.
Visual analysis of the trajectory represented in Fig. 6 revealed that, at the initial stages, the ejection of DNA from the capsid and its condensation inside the cell occurred as two independent processes without apparent interaction between the condensed structure and the DNA exiting the phage portal. At the later stages of ejection, the condensed part would pull on the DNA at the portal, creating an instantaneous force and promoting ejection from the bacteriophage. This additional force may also be important for DNA ejection into cells containing high concentrations of polycations.
Ejection with Variable Viscosity
It has been observed experimentally and computationally that the viscosity of water near the surfaces is higher than that in bulk [56]. As the ejection of viral DNA progresses, the distance between adjacent “loops” of the DNA molecule inside the capsid increases from ~27 Å to ~100 Å. Therefore, it is expected that the local viscosity of solvent inside the bacteriophage may vary by several orders of magnitude upon DNA ejection. To test this hypothesis, we performed a number of simulation runs with variable viscosity within the framework of the Langevinn dynamics. The values of gamma were varied according to Eqns. 4 and 5. Our first demonstration of a significant qualitative change in the ejection profile is shown in Fig. 7a and 7b. When we vary the Langevin gamma within the capsid as a function of the proportion of the genome ejected according to Eqns. 4 or 5 (while applying no external forces), we find that the first stage of ejection proceeds with constant velocity, followed by the usual accelerating second-stage ejection driven by entropic forces. As shown in Fig. 7b, this trajectory is characterized by a near-constant ejection velocity in the first half and an acceleration in the second half.
Figure 7.

Ejection data for viral DNA released from bacteriophage φ29 demonstrating the qualitative effects of variable viscosity inside the capsid. a) Fraction of DNA inside the capsid as a function of time, with variable viscosity inside the capsid (γmax=10−1 ps−1 and γmin=10−4 ps−1, with no applied pulling force; dotted and solid lines represent semilogarithmic and radical dependencies of the viscosity inside the capsid on the DNA fraction ejected, respectively.); b) Ejection rates corresponding to the trajectories described in panel a; c) fraction of DNA inside the capsid as a function of time with the viscosity inside the capsid varying according to the semilogarithmic law (γmax=10−2 ps−1 and γmin=10−4 ps−1), with a pulling force of 4 atm; d) Ejection rates corresponding to the trajectories described in panel c. e) Fraction of DNA inside the capsid as a function of time with the viscosity variable inside the capside according to the semilogarithmic law (γmax=10−3 ps−1 and γmin=10−4 ps−1) and with a pulling force of 16 atm; f) ejection rates corresponding to the trajectories described in panel e) In panels c–f, the dashed lines represent the case where the force was applied to one pseudoatom inside the connector (“tube” style); the solid lines depict the protocol where the full magnitude of force was applied to the first ejected pseudo-atom (“last atom” style); and the dotted lines correspond to the force equally distributed over all ejected pseudo-atoms (“ejected” style).
When we apply external pulling forces between 4 atm and 16 atm to the ejecting DNA, we find our results to be in agreement with our earlier suggestion that the changing of constants in our simulated systems serves only to rescale the trajectories without affecting their qualitative profiles. Likewise, when we apply a “tube”-style force to the variable-viscosity system (effectively, a constant outward force applied to the DNA in the phage connector), we observe faster ejection with nevertheless the same qualitative velocity profile as the undriven variable-viscosity system. (Compare the dashed lines in Fig. 7c–f with Fig. 7a and 7b). However, when we apply a force which effectively varies with ejection (either explicitly in the “ejected” style (Fig. 7b–f, solid lines), or implicitly in the “last atom” style (Fig. 7b–f, dotted lines) where the coupling between the last atom and the currently ejecting atom decreases as the chain length between them increases), we observe a constant ejection rate along the entire ejection trajectory. Thus, varying the capsid viscosity changes the relationship between the ejection rate and the amount of DNA inside the capsid. When a variable viscosity is added inside the capsid, the rate of the first stage of ejection is no longer proportional to the pressure gradient. While the first stage of ejection is still driven by the pressure gradient between the capsid and the cell, the kinetics are not as simple as they were in the constant-viscosity case. Similar ejection rate dependence was observed in the flow cell experiments by Grayson et al. [34]: the rates were growing at the begging of the trajectories regardless the anticipated decrease in the osmotic pressure force, reaching a maximum, and decreasing at the second half of the ejection trajectory. Such experimental behavior is consistent with our simulations shown in Fig. 7d for the “ejected” style, and therefore, lends a support to the proposed ejection model with variable viscosity.
Discussion
The thermodynamics and kinetics of the ejection process (as well as the detailed mechanisms of the genome delivery to the bacterial cells) are still not very well understood. While many experimental studies on the genome ejection have been conducted in vitro, many data obtained in these studies are not in agreement with the ejection data found for in vivo systems. Specifically, in vivo kinetic studies on the ejection of genome from bacteriophage T7 into E. coli revealed that this ejection is up to 1000 times slower than that of bacteriophage Lambda in vitro [28, 64]. Such difference in ejection rates is primarily due to the osmotic pressure in the cytoplasm (the osmotic pressure in the cytoplasm is estimated to be 4–20 pN, and therefore, the difference in the osmotic pressure which governs the ejection of DNA is higher for ejection into water or buffer than for ejection into cytoplasm) and high concentration of other macromolecules in the bacterial cell (the crowding effect) [28]. Further, the observed in vivo ejection rates did not significantly change over the course of ejection, apparently contradicting the proposed pressure-driven mechanism of ejection, according to which the ejection rate should decrease with the pressure gradient across the phage tube (and therefore with DNA ejection) [37].
In our in silico models, the solvent is treated implicitly, and the ejection times obtained from the simulations are several orders of magnitude smaller than those observed experimentally. Additionally, within the framework of our current coarse-grained model, some internal properties of the systems such as viscosity, osmotic pressure, and pulling forces can only be treated at the phenomenological level. More rigorous treatment of the systems would require the explicit presence of solvent, ionic species, crowding agents, and protein molecules. This would increase the size of the system by several orders of magnitude and would also lead to the increase in the ejection time from microseconds to seconds or minutes. These factors make the prospect of all-atom DNA ejection simulations infeasible for the near future.
Nevertheless, even the phenomenological treatment of some physical properties of the bacteriophage-DNA-cell system allowed us to estimate (at least qualitatively) the effect of these properties on the thermodynamics and kinetics of the ejection process. Simulations of DNA release from bacteriophage using the simplest model (constant viscosity inside and outside the viral capsid, and no external forces) confirm the well-known observation that the ejection occurs in two stages; the first stage corresponds to a thermodynamically controlled ejection with a rate proportional to the difference in the DNA free energy between the packed and ejected states, and the second stage (in which the difference in free energy is small) is characterized by diffusion-driven ejection (which takes much longer). The transition between the two stages is characterized by the thermodynamic ejection force going to zero.
Further, we exploited an advantage of the computational methodology and isolated the effect of each physical factor or numerical parameter to study it separately from the others. We incorporated the ability to phenomenologically model ejection under different external forces corresponding to different experimental situations. Similar simulations were performed to explore the effects of osmotic pressure and variable viscosity on the ejection profile.
Thus, we can learn which factors have the strongest effect on the ejection parameters. Such abstraction of factors is not always possible in experimental studies. For example, the addition of the molecular crowding agent polyethylene glycol (PEG) [65] not only excludes DNA from part of the solvent’s available volume, but also changes the osmotic pressure and the viscosity of the solvent medium.
Such isolation of factors has helped us to reveal that under some conditions, two different factors may have compensatory effects. We demonstrated that the well-accepted assumption that the rate of DNA ejection should be directly proportional to the pressure difference does not always hold. Under certain conditions, variations in the viscosity inside the capsid result in constant ejection rates or in complex ejection-dependent ejection rates which cannot be derived from a simple relationship between the rate and the pressure gradient.
The simulations performed with our current model led us to interesting conclusions about the effects of different factors on the thermodynamics and kinetics of the ejection, and led to some non-obvious conclusions about the nature of the ejection mechanism. We expect that further development of simulation techniques will lead to a new class of finer-grained models, which would account for solvent effects in a more explicit fashion and thereby provide a more physical (rather than phenomenological) description of the factors that affect the ejection. Future simulations performed with models in which our current viscosity variation and force protocols are replaced with a more rigorous treatment of solvent effects are expected to yield a quantitative description of the role of the solvent in DNA ejection.
Conclusions
Previous ejection simulations, though valuable as starting points, treated DNA as an elastic uncharged semi-flexible polymer [15, 43, 46]. Our simulations built upon previous simulations by incorporating more parameters and interactions, notably variable viscosity and electrostatics. In this way, we have produced ejection simulations with the broadest, most realistic set of parameters and influences to date, and have recovered some experimental results not present in earlier simulations.
Our simulations showed that there is no simple relationship between the complexity and number of factors influencing ejection and the complexity of the ejection profile. Generally, additional factors tended to complicate the ejection profile, but the reverse was also sometimes true. In particular, the addition of a complicated variable viscosity and pulling force tended to decouple the ejection rate from the ejected fraction, leading to an overall simpler ejection profile with a near-constant ejection rate similar to that found by Ali et al. [15, 43]. For simulators, this means that additional forces or influences can sometimes simplify matters by opposing influences already present in the system; for experimentalists, this means that relatively simple experimental results may have exceedingly complicated underlying causes.
We have explored the effects of different factors on the thermodynamics and the kinetics of DNA ejection and tested them over a wide range of parameter values; this opens up a large parameter space for future simulations. The challenge for these future simulations will be to determine which of these features (or which as-yet-undiscovered ones) correspond most closely and most usefully with the actual physics of in vivo ejection.
Supplementary Material
Acknowledgments
The research is supported by National Institutes of Health Grant R01 GM70875.
References
- 1.Black LW. Annu Rev Microbiol. 1989;43:267. doi: 10.1146/annurev.mi.43.100189.001411. [DOI] [PubMed] [Google Scholar]
- 2.Gelbart WM, Knobler CM. Science. 2009;323:1682. doi: 10.1126/science.1170645. [DOI] [PubMed] [Google Scholar]
- 3.Ackermann H-W, DuBow MS. Viruses of prokaryotes. CRC Press; Boca Raton, Fla: 1987. [Google Scholar]
- 4.Granoff A, Webster RG. Academic Press, San Diego, Ca. 1999. [Google Scholar]
- 5.Bustamante C, Keller D, Oster G. Acc Chem Res. 2001;34:412. doi: 10.1021/ar0001719. [DOI] [PubMed] [Google Scholar]
- 6.Fuller DN, Rickgauer JP, Jardine PJ, Grimes S, Anderson DL, Smith DE. Proc Natl Acad Sci U S A. 2007;104:11245. doi: 10.1073/pnas.0701323104. [DOI] [PMC free article] [PubMed] [Google Scholar]
- 7.Rickgauer JP, Fuller DN, Grimes S, Jardine PJ, Anderson DL, Smith DE. Biophys J. 2008;94:159. doi: 10.1529/biophysj.107.104612. [DOI] [PMC free article] [PubMed] [Google Scholar]
- 8.Smith DE, Tans SJ, Smith SB, Grimes S, Anderson DL, Bustamante C. Nature. 2001;413:748. doi: 10.1038/35099581. [DOI] [PubMed] [Google Scholar]
- 9.Kindt JT, Tzlil S, Ben-Shaul A, Gelbart WM. Proc Natl Acad Sci U S A. 2001;98:13671. doi: 10.1073/pnas.241486298. [DOI] [PMC free article] [PubMed] [Google Scholar]
- 10.Tzlil S, Kindt JT, Gelbart WM, Ben-Shaul A. Biophys J. 2003;84:1616. doi: 10.1016/S0006-3495(03)74971-6. [DOI] [PMC free article] [PubMed] [Google Scholar]
- 11.Purohit PK, Inamdar MM, Grayson PD, Squires TM, Kondev J, Phillips R. Biophys J. 2005;88:851. doi: 10.1529/biophysj.104.047134. [DOI] [PMC free article] [PubMed] [Google Scholar]
- 12.Harvey SC, Petrov AS, Devkota B, Boz MB. Phys Chem Chem Phys. 2009;11:10553. doi: 10.1039/b912884k. [DOI] [PubMed] [Google Scholar]
- 13.Petrov AS, Harvey SC. Structure. 2007;15:21. doi: 10.1016/j.str.2006.11.013. [DOI] [PubMed] [Google Scholar]
- 14.Ali I, Marenduzzo D, Yeomans JM. J Chem Phys. 2004;121:8635. doi: 10.1063/1.1798052. [DOI] [PubMed] [Google Scholar]
- 15.Ali I, Marenduzzo D, Yeomans JM. Phys Rev Letts. 2006;96:208102. doi: 10.1103/PhysRevLett.96.208102. [DOI] [PubMed] [Google Scholar]
- 16.Marenduzzo D. Computational and Mathematical Methods in Medicine. 2008;9:317. doi: 10.1155/2014/836280. [DOI] [PMC free article] [PubMed] [Google Scholar]
- 17.Forrey C, Muthukumar M. Biophys J. 2006;91:25. doi: 10.1529/biophysj.105.073429. [DOI] [PMC free article] [PubMed] [Google Scholar]
- 18.Spakowitz AJ, Wang ZG. Biophys J. 2005;88:3912. doi: 10.1529/biophysj.104.052738. [DOI] [PMC free article] [PubMed] [Google Scholar]
- 19.Locker CR, Fuller SD, Harvey SC. Biophys J. 2007;93:2861. doi: 10.1529/biophysj.106.094771. [DOI] [PMC free article] [PubMed] [Google Scholar]
- 20.Petrov AS, Harvey SC. Biophys J. 2008;95:497. doi: 10.1529/biophysj.108.131797. [DOI] [PMC free article] [PubMed] [Google Scholar]
- 21.Petrov AS, Lim-Hing K, Harvey SC. Structure. 2007;15:807. doi: 10.1016/j.str.2007.05.005. [DOI] [PubMed] [Google Scholar]
- 22.Marenduzzo D, Micheletti C, Orlandini E. Journal of Physics-Condensed Matter. 2010;22:283102. doi: 10.1088/0953-8984/22/28/283102. [DOI] [PubMed] [Google Scholar]
- 23.Rau DC, Lee B, Parsegian VA. Proc Natl Acad Sci USA. 1984;81:2621. doi: 10.1073/pnas.81.9.2621. [DOI] [PMC free article] [PubMed] [Google Scholar]
- 24.Rau DC, Parsegian VA. Biophys J. 1992;61:246. doi: 10.1016/S0006-3495(92)81831-3. [DOI] [PMC free article] [PubMed] [Google Scholar]
- 25.Rau DC, Parsegian VA. Biophys J. 1985;47:A68. [Google Scholar]
- 26.Leikin S, Rau DC, Parsegian VA. Physical Review A. 1991;44:5272. doi: 10.1103/physreva.44.5272. [DOI] [PubMed] [Google Scholar]
- 27.Jeembaeva M, Jonsson B, Castelnovo M, Evilevitch A. J Mol Biol. 2010;395:1079. doi: 10.1016/j.jmb.2009.11.069. [DOI] [PubMed] [Google Scholar]
- 28.Grayson P, Molineux IJ. Curr Opin Microbiol. 2007;10:401. doi: 10.1016/j.mib.2007.04.004. [DOI] [PMC free article] [PubMed] [Google Scholar]
- 29.Jeembaeva M, Castelnovo M, Larsson F, Evilevitch A. J Mol Biol. 2008;381:310. doi: 10.1016/j.jmb.2008.05.081. [DOI] [PubMed] [Google Scholar]
- 30.Grayson P, Evilevitch A, Nelson-James K, Inamdar M, Purohit P, Phillips R, Gelbart W, Knobler C. Biophys J. 2004;86:594a. [Google Scholar]
- 31.Castelnovo M, Evilevitch A. European Physical Journal E. 2007;24:9. doi: 10.1140/epje/i2007-10205-5. [DOI] [PubMed] [Google Scholar]
- 32.Gonzalez-Huici V, Salas M, Hermoso JM. Mol Microbiol. 2004;52:529. doi: 10.1111/j.1365-2958.2004.03993.x. [DOI] [PubMed] [Google Scholar]
- 33.Mangenot S, Hochrein M, Radler J, Letellier L. Curr Biol. 2005;15:430. doi: 10.1016/j.cub.2004.12.080. [DOI] [PubMed] [Google Scholar]
- 34.Grayson P, Han L, Winther T, Phillips R. Proc Natl Acad Sci U S A. 2007;104:14652. doi: 10.1073/pnas.0703274104. [DOI] [PMC free article] [PubMed] [Google Scholar]
- 35.Kemp P, Gupta M, Molineux IJ. Mol Microbiol. 2004;53:1251. doi: 10.1111/j.1365-2958.2004.04204.x. [DOI] [PubMed] [Google Scholar]
- 36.McAllister WT. J Virol. 1970;5:194. doi: 10.1128/jvi.5.2.194-198.1970. [DOI] [PMC free article] [PubMed] [Google Scholar]
- 37.Panja D, Molineux IJ. Physical Biology. 2010;7:045006. doi: 10.1088/1478-3975/7/4/045006. [DOI] [PubMed] [Google Scholar]
- 38.Kornyshev AA, Lee DJ, Leikin S, Wynveen A. Reviews of Modern Physics. 2007;79:943. [Google Scholar]
- 39.Cherstvy AG. Physical Chemistry Chemical Physics. 2011;13:9942. doi: 10.1039/c0cp02796k. [DOI] [PubMed] [Google Scholar]
- 40.Kornyshev AA, Wynveena A. Proc Natl Acad Sci U S A. 2009;106:4683. doi: 10.1073/pnas.0811208106. [DOI] [PMC free article] [PubMed] [Google Scholar]
- 41.Cherstvy AG. Journal of Physical Chemistry B. 2009;113:5350. doi: 10.1021/jp810473m. [DOI] [PubMed] [Google Scholar]
- 42.Locker CR, Harvey SC. Multiscale Model Simul. 2006;5:1264. [Google Scholar]
- 43.Ali I, Marenduzzo D, Yeomans JM. Biophys J. 2008;94:4159. doi: 10.1529/biophysj.107.111963. [DOI] [PMC free article] [PubMed] [Google Scholar]
- 44.Stevens MJ. Biophys J. 2001;80:130. doi: 10.1016/S0006-3495(01)76000-6. [DOI] [PMC free article] [PubMed] [Google Scholar]
- 45.Harvey SC, Petrov AS, Devkota B, Boz MB. Meths Enzymol. 2011;487:513. doi: 10.1016/B978-0-12-381270-4.00018-4. [DOI] [PubMed] [Google Scholar]
- 46.Matsuyama A, Yano M. Journal of the Physical Society of Japan. 2012;81:034802. [Google Scholar]
- 47.Marenduzzo D, Orlandini E, Stasiak A, Sumners D, Tubiana L, Micheletti C. Proc Natl Acad Sci U S A. 2009;106:22269. doi: 10.1073/pnas.0907524106. [DOI] [PMC free article] [PubMed] [Google Scholar]
- 48.Tan RK, Petrov AS, Harvey SC. J Chem Theory Comput. 2006;2:529. doi: 10.1021/ct050323r. [DOI] [PMC free article] [PubMed] [Google Scholar]
- 49.Plimpton S. Journal of Computational Physics. 1995;117:1. [Google Scholar]
- 50.Todd BA, Rau DC. Nucleic Acids Res. 2008;36:501. doi: 10.1093/nar/gkm1038. [DOI] [PMC free article] [PubMed] [Google Scholar]
- 51.Petrov AS, Harvey SC. J Struct Biol. 2011;174:137. doi: 10.1016/j.jsb.2010.11.007. [DOI] [PMC free article] [PubMed] [Google Scholar]
- 52.Sarkar T, Petrov AS, Vitko JR, Santai CT, Harvey SC, Mukerji I, Hud NV. Biochemistry. 2009;48:667. doi: 10.1021/bi8019965. [DOI] [PubMed] [Google Scholar]
- 53.Izrailev S, Stepaniants S, Isralewitz B, Kosztin B, Lu S, Molnar F, Wriggers W, Schulten K. In: Computational Molecular Dynamics: Challenges, Methods, Ideas. Deuflhard P, Hermans J, Leimkuhler B, Mark AE, Reich S, Skeel RD, editors. Vol. 4. Springer-Verlag; Berlin: 1998. p. 39. [Google Scholar]
- 54.Evilevitch A, Lavelle L, Knobler CM, Raspaud E, Gelbart WM. Proc Natl Acad Sci U S A. 2003;100:9292. doi: 10.1073/pnas.1233721100. [DOI] [PMC free article] [PubMed] [Google Scholar]
- 55.Ramachandran G, Schlick T. Physical Review E. 1995;51:6188. doi: 10.1103/physreve.51.6188. [DOI] [PubMed] [Google Scholar]
- 56.Li TD, Gao JP, Szoszkiewicz R, Landman U, Riedo E. Physical Review B. 2007;75:115415. [Google Scholar]
- 57.Prinsen P, Fang LT, Yoffe AM, Knobler CM, Gelbart WM. J Phys Chem B. 2009;113:3873. doi: 10.1021/jp808047u. [DOI] [PubMed] [Google Scholar]
- 58.Jeng PR, Chen KH, Hwang GJ, Tien CM, Lien CH, To KW, Chou YC. European Physics Letters. 2011;96:44005. [Google Scholar]
- 59.Evilevitch A. Journal of Physical Chemistry B. 2006;110:22261. doi: 10.1021/jp060573j. [DOI] [PubMed] [Google Scholar]
- 60.Hafner EW, Tabor CW, Tabor H. J Biol Chem. 1979;254:2419. [PubMed] [Google Scholar]
- 61.Gelbart WM, Bruinsma RF, Pincus PA, Parsegian VA. Physics Today. 2000:5338. [Google Scholar]
- 62.Lof D, Schillen K, Jonsson B, Evilevitch A. J Mol Biol. 2007;368:55. doi: 10.1016/j.jmb.2007.01.076. [DOI] [PubMed] [Google Scholar]
- 63.Koster S, Evilevitch A, Jeembaeva M, Weitz DA. Biophys J. 2009;97:1525. doi: 10.1016/j.bpj.2009.07.007. [DOI] [PMC free article] [PubMed] [Google Scholar]
- 64.Garcia LR, Molineux IJ. J Bacteriol. 1995;177:4066. doi: 10.1128/jb.177.14.4066-4076.1995. [DOI] [PMC free article] [PubMed] [Google Scholar]
- 65.Evilevitch A, Gober JW, Phillips M, Knobler CM, Gelbart WM. Biophys J. 2005;88:751. doi: 10.1529/biophysj.104.045088. [DOI] [PMC free article] [PubMed] [Google Scholar]
Associated Data
This section collects any data citations, data availability statements, or supplementary materials included in this article.