The T6P/SnRK1 mechanism of growth regulation responds to sink growth restriction and recovery following low-temperature limitation.
Abstract
Trehalose 6-P (T6P) is a sugar signal in plants that inhibits SNF1-related protein kinase, SnRK1, thereby altering gene expression and promoting growth processes. This provides a model for the regulation of growth by sugar. However, it is not known how this model operates under sink-limited conditions when tissue sugar content is uncoupled from growth. To test the physiological importance of this model, T6P, SnRK1 activities, sugars, gene expression, and growth were measured in Arabidopsis (Arabidopsis thaliana) seedlings after transfer to cold or zero nitrogen compared with sugar feeding under optimal conditions. Maximum in vitro activities of SnRK1 changed little, but T6P accumulated up to 55-fold, correlating with tissue Suc content in all treatments. SnRK1-induced and -repressed marker gene expression strongly related to T6P above and below a threshold of 0.3 to 0.5 nmol T6P g−1 fresh weight close to the dissociation constant (4 µm) of the T6P/ SnRK1 complex. This occurred irrespective of the growth response to Suc. This implies that T6P is not a growth signal per se, but through SnRK1, T6P primes gene expression for growth in response to Suc accumulation under sink-limited conditions. To test this hypothesis, plants with genetically decreased T6P content and SnRK1 overexpression were transferred from cold to warm to analyze the role of T6P/SnRK1 in relief of growth restriction. Compared with the wild type, these plants were impaired in immediate growth recovery. It is concluded that the T6P/SnRK1 signaling pathway responds to Suc induced by sink restriction that enables growth recovery following relief of limitations such as low temperature.
The nonreducing Glc disaccharide, trehalose [α-d-glucopyranosyl-(1→1)-α-d-glucopyranoside] is widespread in nature. In resurrection plants, fungi, bacteria, and nonvertebrate animals, it performs a role as a carbon source and stress protection compound (Elbein et al., 2003; Paul et al., 2008). In the majority of plants, however, amounts of trehalose are too low to perform this function. Instead, the pathway has developed into a specialized system that regulates and integrates metabolism with growth and development (Schluepmann et al., 2003; Lunn et al., 2006; Ramon and Rolland, 2007; Gómez et al., 2010). This system is indispensible throughout seed and vegetative development (Eastmond et al., 2002; van Dijken et al., 2004; Gómez et al., 2010), and evidence suggests that the critical function is performed by the precursor of trehalose, trehalose 6-P (T6P). There is one known trehalose biosynthesis pathway in plants from the intermediates Glc 6-P and UDP-Glc catalyzed by trehalose phosphate synthase (TPS), which synthesizes T6P. T6P is then converted to trehalose by trehalose phosphate phosphatase (TPP). The regulation of T6P content in plants by TPSs and TPPs is not well understood. TPS1 is thought to account for most TPS catalytic activity in plants (Vandesteene et al., 2010). All 10 TPPs are now known to be catalytically active (Vandesteene et al., 2012); however, their specific contribution to T6P homeostasis is not known. Evidence suggests that T6P is a sugar signal in plants. T6P responds strongly to Suc supply when Suc is fed to seedlings grown in culture and in response to an increase in Suc in illuminated leaves (Lunn et al., 2006). Biosynthetic pathways for cell wall (Gómez et al., 2006) and starch synthesis (Kolbe et al., 2005) are regulated by T6P, supporting the observation that T6P promotes carbon utilization and growth of seedlings at high sugar levels when its content is increased through expression of otsA, a TPS-encoding gene from Escherichia coli (Schluepmann et al., 2003; Paul et al., 2010). In contrast, expression of otsB, a corresponding TPP-encoding gene from E. coli, decreases T6P content and inhibits growth in the presence of high sugar (Schluepmann et al., 2003; Paul et al., 2010). Given the importance of T6P in the regulation of growth and end-product synthesis, targets for its interaction have been eagerly sought.
Recently, it was found that T6P inhibits the protein kinase SnRK1 in growing tissues of plants (Zhang et al., 2009; Debast et al., 2011; Delatte et al., 2011; Martínez-Barajas et al., 2011) through an intermediary factor. SnRK1 (AKIN10/AKIN11) is a member of the SNF1-related AMPK group of protein kinases that perform central functions in the regulation of responses of cells to endogenous energy and carbon status (Hardie, 2007). Baena-González et al. (2007) established that over 1000 genes are regulated by SnRK1 involved in biosynthetic, growth, and stress responses. It was observed that, in addition to cell wall and starch synthesis, T6P could regulate amino acid metabolism, protein, and nucleotide synthesis (Zhang et al., 2009) and is most likely connected to hormone signaling (Zhang et al., 2009; Paul et al., 2010). A model is proposed where SnRK1 inhibits growth processes when sugar and energy supplies are scarce, thus enabling survival under starvation stress conditions. When sugar supply is plentiful, T6P accumulates and inhibits SnRK1 blocking expression of genes involved in the stress survival response and inducing genes involved in the feast response, including growth processes. Interestingly, plants with altered SnRK1 activity display similar phenotypes to plants with altered T6P in both growth and developmental processes such that plants with genetically decreased T6P content resemble those with overexpressed SnRK1 and vice versa (Schluepmann et al., 2003; Baena-González et al., 2007; Wingler et al., 2012).
Sugars fluctuate widely in plants in response to changes in photosynthesis and in response to environmental variables. Sugar starvation conditions, such as those induced by deep shade, limit growth through lack of sugar availability; SnRK1 would be active under such conditions. High sugar availability, however, does not necessarily indicate good conditions for growth and high growth rates. For example, under low-temperature and limiting nutrient supply, growth is limited in spite of abundant sugar availability (Paul and Stitt, 1993; Usadel et al., 2008). This is termed sink-limited growth, when growth is limited by capacity of sinks, i.e. growing regions to use assimilate. It departs from the famine model of growth regulation by SnRK1. The interrelationship between T6P, SnRK1, and growth is not known under such conditions. Here, we vary growth conditions by temperature and nutrient supply to induce sink-limited growth and feed Suc and Glc at physiological levels (15 mm). We show a strong specific interrelationship between T6P and Suc and SnRK1-regulated gene expression under all conditions irrespective of growth rate. This implies that T6P is not a growth signal per se, but through SnRK1, T6P primes gene expression for growth. By priming, we mean being in a prepared state with an advanced capacity to activate growth following relief of a growth limitation, such as low temperature. To test that T6P/SnRK1 enable growth recovery following relief from sink limitation, plants with genetically decreased T6P content and SnRK1 overexpression were transferred from cold to warm. Compared with the wild type, these plants were impaired in immediate growth recovery. It is concluded that T6P responds to Suc induced by growth restriction. This enables growth recovery following relief of limitations downstream of T6P/SnRK1, such as low temperature. Our findings are included in a model for the regulation of growth by the T6P/SnRK1 signaling pathway.
RESULTS
Effect of Transfer to Low Temperature, Low N, and Sugar Feeding on Growth, Carbohydrate, and T6P Content
To test the physiological importance of the regulation of growth by the T6P/SnRK1 signaling pathway, T6P, SnRK1 activities, sugar contents, gene expression, and growth rate were measured in Arabidopsis (Arabidopsis thaliana) seedlings after transfer to low temperature or zero nitrogen compared with sugar feeding under optimal conditions. These conditions were used to uncouple sugars from growth, i.e. to test physiological importance of the T6P/SnRK1 pathway under sink-limited conditions.
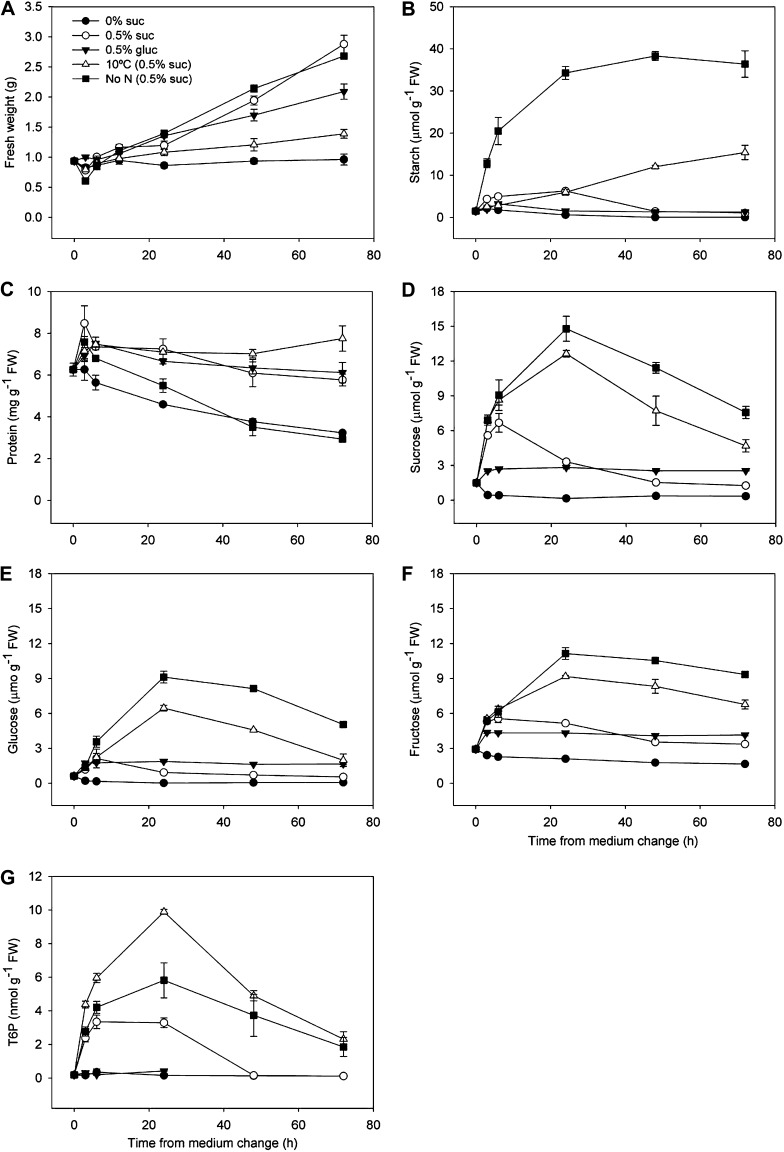
The different treatments gave a wide range of rates of fresh weight (FW) accumulation over 72 h (Fig. 1A), calculated here as structural weight after subtraction of the large starch accumulation at low nitrogen (Fig. 1B). Biomass after 72 h was highest in seedlings grown on full medium with 0.5% (w/v) Suc and lowest on full medium with no supplementary sugar. Low temperature strongly inhibited growth, whereas feeding 0.5% (w/v) Glc gave an intermediate growth phenotype. Withdrawal of N did not reduce total growth over the course of the experiment, but there was a large change in shoot to root partitioning and accumulation of starch in these plants. Protein content was stable in all treatments except for nitrogen-deficient seedlings and seedlings without supplementary sugar where protein content decreased during the experiment, showing the importance of both carbon and nitrogen supply for protein synthesis (Fig. 1C). Suc contents displayed a range of responses (Fig. 1D) from 1.49 µmol g−1 FW at the start of the experiment, rising to a maximum 9.9-fold higher to 14.8 µmol g−1 FW in the low-nitrogen treatment, with a similar pattern at low temperature. Suc feeding on its own resulted in a large initial increase in Suc up to 6 h from feeding, but which then decreased during the rest of the experiment. Glc feeding produced a small increase in Suc content from 1.49 to 2.82 µmol g−1 FW, which remained stable during the rest of the experiment. Amounts of Glc and Fru followed a similar pattern to Suc with the exception that Glc levels were higher in Glc-fed seedlings than Suc-fed seedlings (Fig. 1, E and F). Large differences in T6P were found between the treatments (Fig. 1G). In seedlings grown with no sugar source and with 0.5% (w/v) Glc, amounts of T6P were stable throughout the experiment between 0.18 and 0.4 nmol g−1 FW. Low temperature, low nitrogen, and Suc feeding under optimal conditions led to large increases in T6P during the first 24 h, up to 9.9, 5.8, and 3.3 nmol g−1 FW, respectively. Amounts of T6P then decreased during the rest of the time course. There was a 55-fold difference between the beginning of the experiment (0.18 nmol g−1 FW) and the highest T6P content measured (9.89 nmol g−1 FW, 10°C, 24 h). These data show the possible amplitude of T6P fluctuation that can be observed in seedlings through changes in conditions that restrict growth by sink limitation.
Figure 1.
Impact on growth, starch, protein, sugars, and T6P contents in response to Suc and Glc feeding with full nutrition at 22°C and after transfer to 10°C or zero nitrogen. Seedlings were grown with 0.5% (w/v) Suc for 7 d at 22°C and then transferred to fresh media without external sugar source (0% Suc), with 0.5% Suc (0.5% [w/v] suc), 0.5% Glc (0.5% [w/v] gluc), 0.5% Suc at 10°C [10°C (0.5% suc; w/v)], and 0.5% Suc with zero nitrogen [No N (0.5% [w/v] suc)]. Measurements were performed over 72 h of treatment induction. A, FW. B, starch. C, protein. D, Suc. E, Glc. F, Fru. G, T6P. The data are means with sd of three independent samples.
T6P Levels Correlate with Suc Content under Sink-Limited Conditions
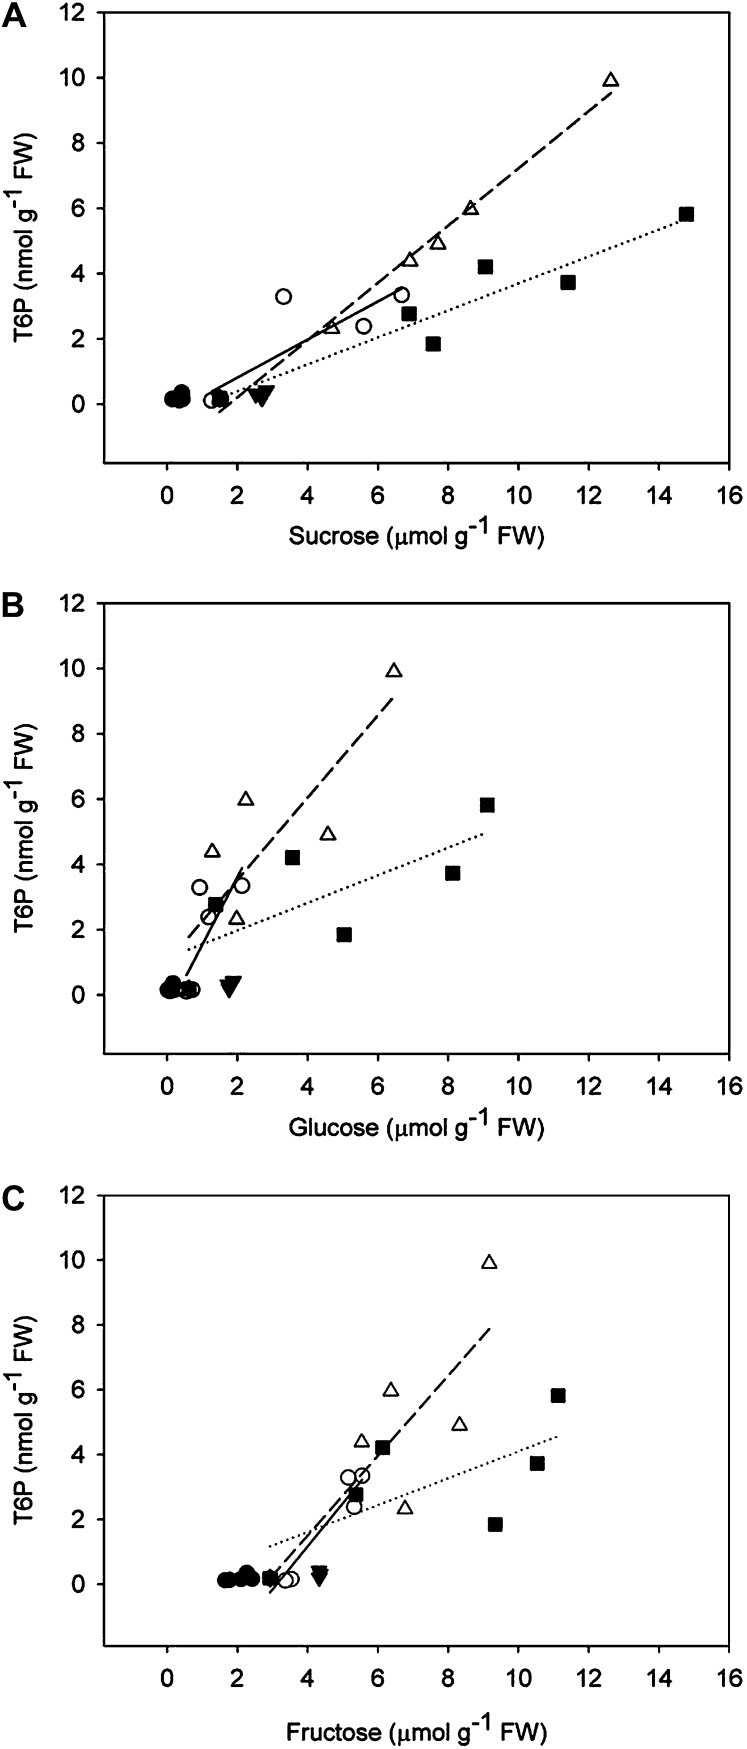
Out of all sugars analyzed, T6P levels correlated most closely with Suc content (Fig. 2A). The correlations of T6P with Glc (Fig. 2B) and Fru (Fig. 2C) were weaker than between Suc and T6P particularly at low temperature and low nitrogen. In support of a specific relationship between Suc and T6P, Glc feeding produced no increase in T6P levels (Fig. 1G).
Figure 2.
Interrelationship between T6P and sugars measured in the different treatments. A, T6P and Suc (0.5% [w/v] Suc, solid line, R2 = 0.84, SEE = 0.56, P < 0.011; 10°C, dashed line, R2 = 0.99, SEE = 0.35, P < 0.0001; No N, dotted line, R2 = 0.90, SEE = 0.70, P < 0.0041). B, T6P and Glc (0.5% [w/v] Suc, solid line, R2 = 0.68, SEE = 0.79, P < 0.045; 10°C, dashed line, R2 = 0.80, SEE = 1.04, P < 0.016; No N, dotted line, R2 = 0.74, SEE = 0.94, P < 0.028). C, T6P and Fru (0.5% [w/v] Suc, solid line, R2 = 0.73, SEE = 0.72, P < 0.029; 10°C, dashed line, R2 = 0.82, SEE = 1.00, P < 0.013; No N, dotted line, R2 = 0.72, SEE = 0.96, P < 0.032). The data are means of three independent samples.
SnRK1 Activities and Expression
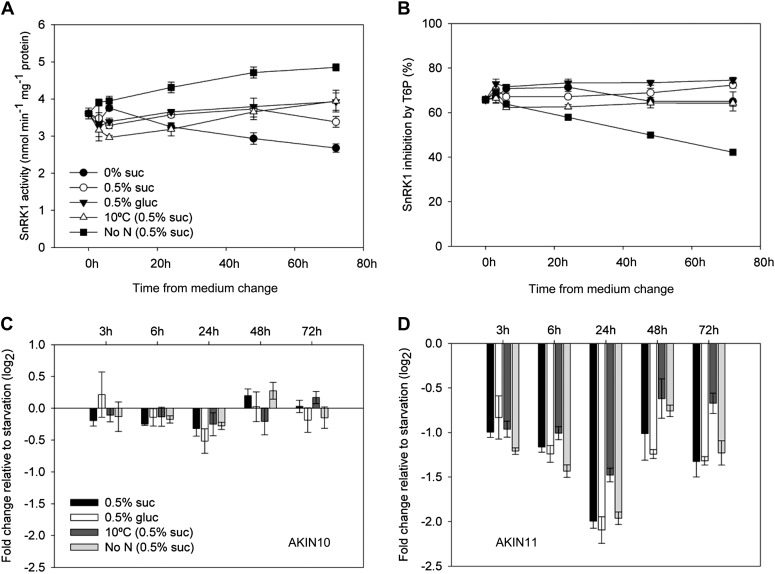
SnRK1 activities measured in vitro were relatively stable during the course of the experiment in the different treatments (Fig. 3A). However, nitrogen deficiency induced a 30% increase in in vitro SnRK1 activity during the experiment from 3.7 nmol min−1 mg−1 protein to 4.8 nmol min−1 mg−1 protein. SnRK1 activity in seedlings grown without sugar decreased from 3.7 nmol min−1 mg−1 protein to 2.9 nmol min−1 mg−1 protein. SnRK1 activities in the other three treatments changed little during the time course. SnRK1 was inhibited strongly by 1 mm T6P added to the in vitro assay by between 65% and 75% in all treatments (Fig. 3B), with the exception of deficient nitrogen where inhibition by T6P steadily decreased over the time course. Compared with the treatments where no supplementary sugar was supplied, transcripts of AKIN10 changed little during the experiment; amounts of AKIN11 transcript were decreased in all treatments compared with seedlings without exogenous sugar (Fig. 3, C and D).
Figure 3.
SnRK1 activity and inhibition by T6P and transcript abundance of the catalytic subunits AKIN10 and AKIN11 determined by qRT-PCR in response to Suc and Glc feeding with full nutrition at 22°C and after transfer to 10°C or zero nitrogen. SnRK1 extracts were used to determine SnRK1 activity (A) and inhibition of SnRK1 activity by 1 mm T6P (B). Transcript fold change of the catalytic subunits AKIN10 (At3g01090; C) and AKIN11 (At3g29160; D) relative to the conditions without external sugar source at 3, 6, 24, 48, and 72 h after start of treatment. The data are means with sd of three independent samples.
SnRK1 Marker Genes Impacted Strongly by T6P Content
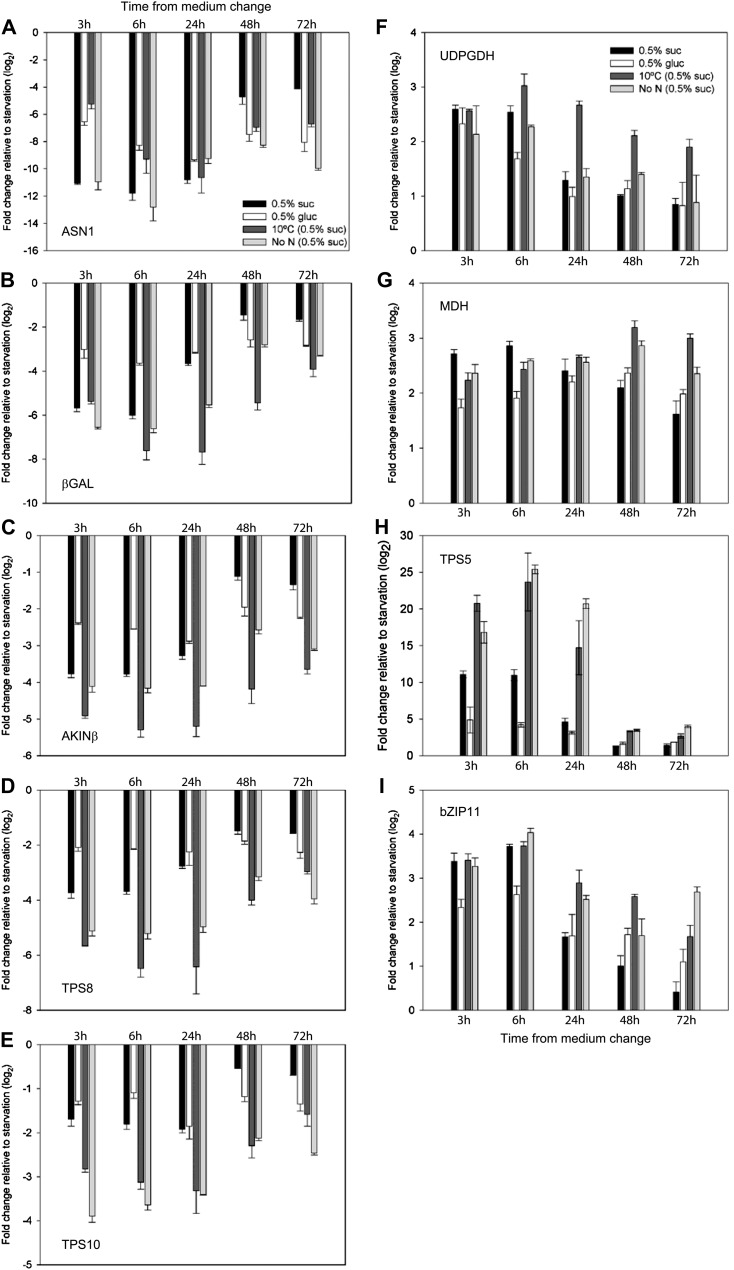
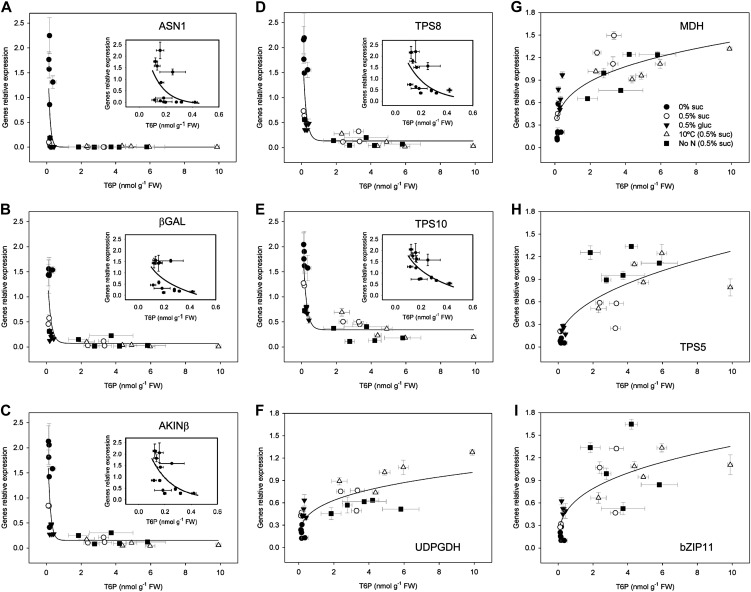
Approximately 1,000 genes were established as SnRK1 marker genes (Baena-González et al., 2007). These genes were shown to be regulated by T6P in vivo in transgenic seedlings with altered T6P content confirming in vitro inhibition of SnRK1 by T6P (Zhang et al., 2009). Quantitative reverse transcription (qRT)-PCR analysis of the marker genes for the treatments determined relative to seedlings with no carbon source showed a relationship between T6P and transcript abundance. SnRK1 marker genes, ASN1, βGAL, AKINβ, TPS8, and TPS10, normally up-regulated by SnRK1 were down-regulated by T6P (Fig. 4, A–E). SnRK1 marker genes normally repressed by SnRK1, UDPGDH, MDH, bZIP11, and TPS5, were up-regulated by T6P (Fig. 4, F–I). There were differences in the magnitude of changes induced by T6P. Of the SnRK1-induced markers, ASN1 was repressed strongly compared with conditions with no supplementary sugar. Of the SnRK1-repressed markers, TPS5 was the most strongly affected compared with treatments associated with low endogenous sugar. Changes in marker gene expression induced by these treatments relative to low sugar were larger than those induced by transgenic modification of T6P (2- to 3-fold; Zhang et al., 2009) in agreement with the larger changes in T6P achieved by the environmental treatments (up to 55-fold). When transcript abundance was plotted against T6P, clear biphasic relationships between T6P and transcript abundance were obtained for both SnRK1-induced (Fig. 5, A–E) and SnRK1-repressed (Fig. 5, F–I) marker genes. Most changes in gene expression occurred above and below a level of T6P of around 0.3 to 0.5 nmol g−1 FW. This would indicate a threshold level of T6P required before changes in transcript abundance occurred, which assuming cytosolic location, equates to about 3 to 5 µm, close to the Ki 4 µm of the SnRK1 complex (Nunes et al., 2013). Glc feeding induced changes in gene expression less than those induced by Suc feeding, low temperature, and low nitrogen (Figs. 4 and 5). The changes in gene expression occurred in spite of no change in T6P content. It is known that Glc 6-P and Glc 1-P also inhibit SnRK1 (Toroser et al., 2000; Nunes et al., 2013). We measured these metabolites to determine if they could contribute to changes in SnRK1-induced gene expression in Glc-fed seedlings. Amounts of both increased between 3- to 4-fold over 48 h of Glc feeding (Supplemental Fig. S1, A and B). Glc regulated marker genes were induced as predicted in this experiment (Supplemental Fig. S2). To examine how the trehalose pathway responded to the treatments, in comparison, transcript abundances of TPS1, TPPA, and TPPB as representative genes of the pathway were determined. TPS1 and TPPB were consistently upregulated by the treatments compared with growth without carbon source (Supplemental Fig. S3, A and C). TPPA followed the same trend, but less strongly than for TPS1 and TPPB and with a decrease in transcript abundance as time progressed over 72 h (Supplemental Fig. S3B).
Figure 4.
Transcript abundance of SnRK1 marker genes determined by qRT-PCR in response to Suc and Glc feeding with full nutrition at 22°C and after transfer to 10°C or zero nitrogen relative to the conditions without external sugar source. Transcript fold change of marker genes normally up-regulated by SnRK1, ASN1 (At3g47340; A), βGAL (At5g56870; B), AKINβ (At5g21170; C), TPS8 (At1g70290; D), and TPS10 (At1g60140; E), and marker genes normally down-regulated by SnRK1, UDPGDH (At3g29360; F), MDH (At3g15020; G), TPS5 (At4g17770; H), and bZIP11 (At4g34590; I). The data are means with sd of three independent samples.
Figure 5.
Interrelationship of SnRK1 marker genes and T6P in response to Suc and Glc feeding with full nutrition at 22°C and after transfer to 10°C or zero nitrogen compared with treatment with no supplementary sugar. Marker genes normally up-regulated by SnRK1, ASN1 (A; At3g47340; R2 = 0.36, SEE = 0.54), βGAL (B; At5g56870; R2 = 0.50, SEE = 0.41), AKINβ (C; At5g21170; R2 = 0.60, SEE = 0.44), TPS8 (D; At1g70290; R2 = 0.59, SEE = 0.45), and TPS10 (E; At1g60140; R2 = 0.72, SEE = 0.32), and marker genes normally down-regulated by SnRK1, UDPGDH (F; At3g29360; R2 = 0.64, SEE = 0.18), MDH (G; At3g15020; R2 = 0.70, SEE = 0.23), TPS5 (H; At4g17770; R2 = 0.68, SEE = 0.25), and bZIP11 (I; At4g34590; R2 = 0.62, SEE = 0.28). The inset graphs show the curves for values of T6P between 0 and 0.5 nmol g−1 FW. Horizontal error bars are the sd of three independent T6P samples, and the vertical error bars are the sd of three independent qRT-PCR samples. The fitted lines are significant for each data group (P < 0.001).
Relationship between T6P, SnRK1 Marker Gene Expression, and Growth
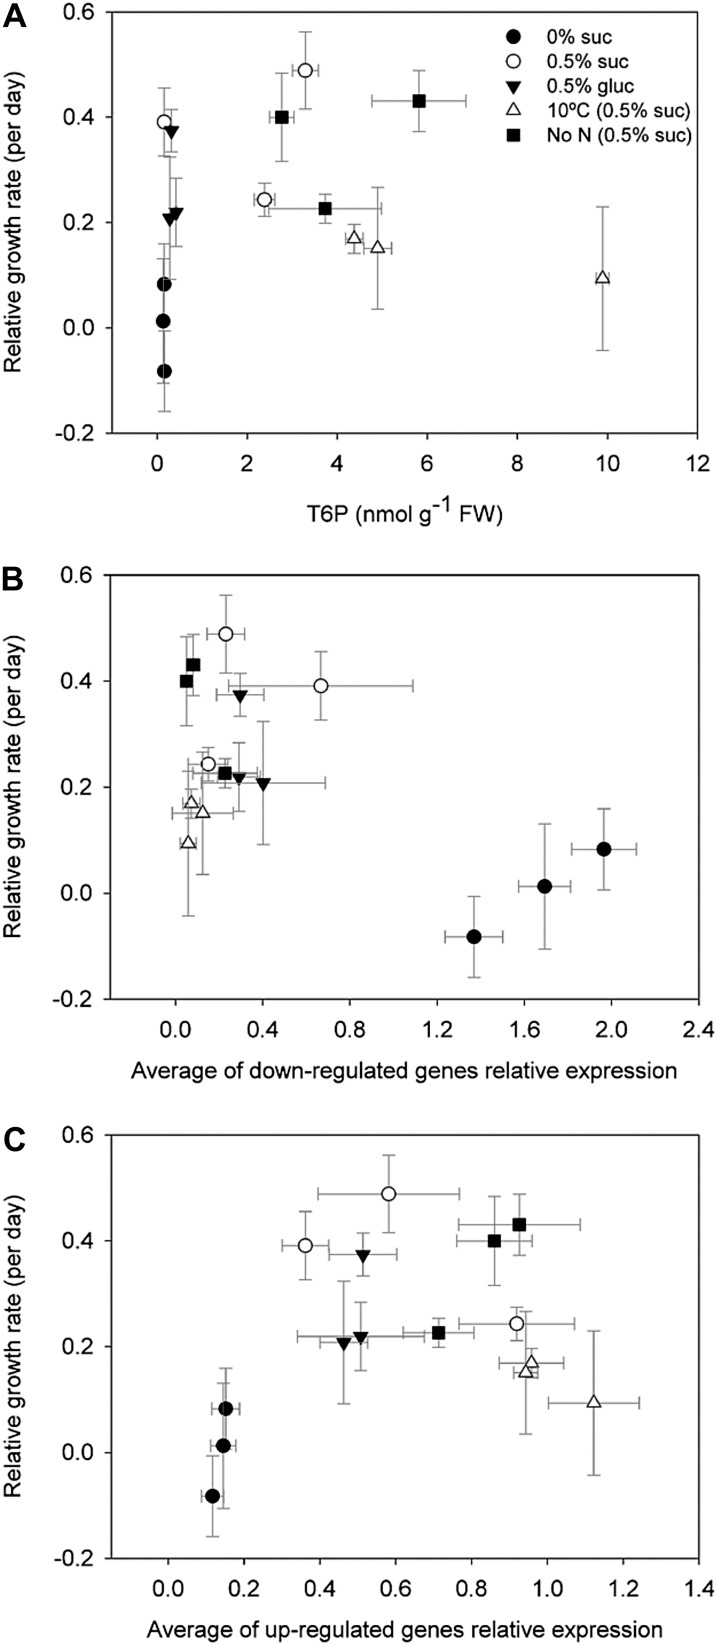
There was no relationship between relative growth rate and T6P content (Fig. 6A) or between growth rate and SnRK1 marker gene expression (Fig. 6, B and C). However, the relationship between T6P and relative growth rate would confirm that a certain level of T6P is required before growth can proceed (Fig. 6A). The close relationship between T6P and Suc and SnRK1 marker gene expression (Figs. 2 and 5), in contrast, shows that T6P is primarily related to Suc and SnRK1 marker gene expression and not to growth rate. However, we hypothesized that large changes in gene expression induced by T6P would prime growth to proceed once sink limitations to growth are removed.
Figure 6.
Interrelationship between growth and T6P levels and growth and SnRK1 marker gene expression. Growth was represented as the daily RGR during the 72 h of treatment. RGR versus T6P levels (A) and RGR versus averages of the relative expression of down-regulated (B) or up-regulated (C) SnRK1 marker genes. The data are means with sd of three independent samples. There was no statistically significant relationship between growth and T6P levels and growth and SnRK1 marker gene expression.
Growth Recovery after 24 h Cold
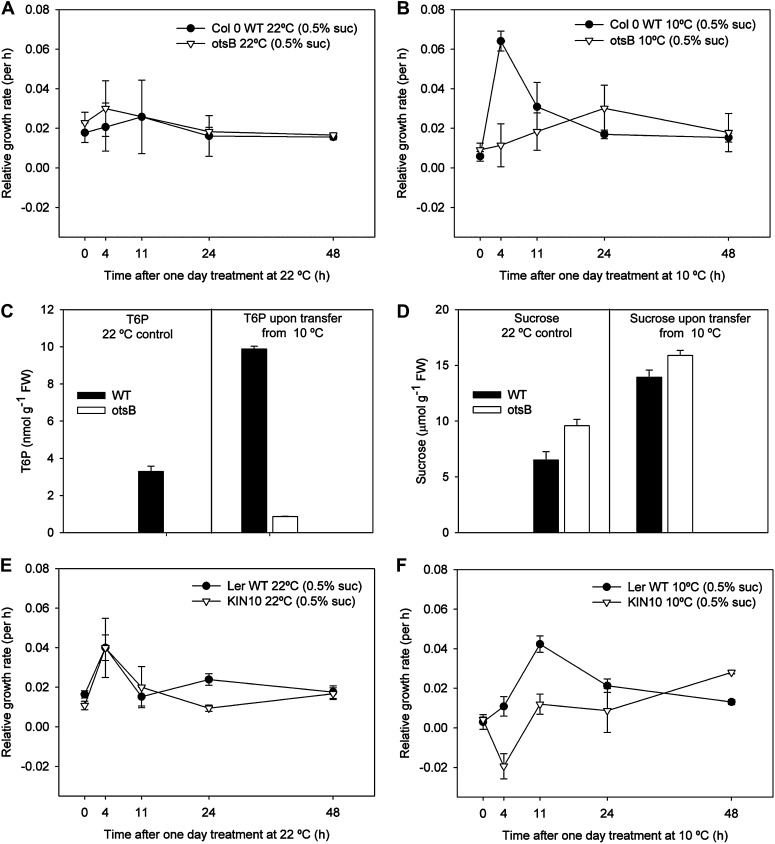
The hypothesis that T6P and SnRK1 are important in the growth recovery from low temperature was tested by transferring seedlings grown in the cold for 24 h and containing high T6P levels (Fig. 1F) to warm conditions. The experiment was also performed with plants expressing otsB to decrease T6P (Schluepmann et al., 2003). In the warm condition at low exogenous sugar levels, otsB grows the same as the wild type (Fig. 7A; Schluepmann et al., 2003). After 24 h in the cold and subsequent transfer to the warm (Fig. 7B), the relative growth rate of the wild type was strongly stimulated. In contrast, otsB was unable to increase growth rate upon warming (P ≤ 0.05 at 4 h; Fig. 7B). T6P levels were very low in otsB seedlings (Fig. 7C) and growth in the cold was low in spite of high sugar levels in otsB seedlings (Fig. 7D). Between 11 and 24 h, growth rate of the wild type returned to former levels (Fig. 7B). In further confirmation of the role of the T6P/SnRK1 signaling pathway in growth recovery in warm conditions, seedlings overexpressing SnRK1 (KIN10; Baena-González et al., 2007) were also subjected to the same temperature treatment (Fig. 7, E and F). Despite some variation in the 4 h data point, growth of KIN10 was not stimulated in the short term upon transfer to the warm conditions after 24 h cold, compared with Landsberg erecta (Ler), which was stimulated after 11 h (P ≤ 0.05; Fig. 7F). Dry weights showed the same trend as FWs with statistical significance at 11 h (P ≤ 0.05; Supplemental Fig. S4). In conclusion, in these warm conditions, otsB and KIN10 grow the same as their respective wild-type controls, Columbia-0 and Ler, but upon transfer from cold to warm, growth recovery is impaired in the short term in otsB and KIN10, consistent with a role for T6P/SnRK1 in growth recovery from low temperature.
Figure 7.
Effect on relative growth rate of altering the T6P/SnRK1 signaling pathway by transferring to 10°C for 24 h and through expression of otsB and KIN10. Seedlings were grown with 0.5% (w/v) Suc for 7 d at 22°C, either transferred to 10°C for 24 h (10°C) and then back to 22°C or held at 22°C throughout (22°C). All growth measurements were performed at 22°C. A, Relative growth rate of Columbia-0 (Col 0) wild type (WT) compared with otsB maintained at 22°C. B, Relative growth rate of Columbia-0 wild type compared with otsB transferred from 10°C. C, T6P contents of the wild type and otsB upon transfer from 10°C and control maintained at 22°C. D, Suc contents of the wild type and otsB upon transfer from 10°C and control maintained at 22°C. E, Relative growth rate of AKIN10 compared with KIN10 maintained at 22°C. F, Relative growth rate of KIN10 compared with AKIN10. The data are means with se of three independent samples. (Note: T6P levels of otsB control were below detection limit.)
DISCUSSION
T6P is an established regulatory molecule that is indispensible for growth and has a strong impact on metabolism and development (Eastmond et al., 2002; Schluepmann et al., 2003; Gómez et al., 2006). Some effects of T6P have been attributed to inhibition of SnRK1 by T6P (Zhang et al., 2009; Debast et al., 2011; Delatte et al., 2011). Inhibition of SnRK1 by T6P results in up-regulation of genes involved in biosynthetic processes and growth (Zhang et al., 2009; Paul et al., 2010; Debast et al., 2011; Martínez-Barajas et al., 2011;), whereas low T6P and active SnRK1 result in up-regulation of plant stress responses and catabolism rather than anabolism (Baena-González et al., 2007; Zhang et al., 2009; Debast et al., 2011). T6P contents are related to those of Suc in plants (Lunn et al., 2006; Martínez-Barajas et al., 2011). Accordingly, a model has been developed where T6P elicits changes in gene expression through regulation of SnRK1 promoting growth in relation to Suc supply. However, it is not known how the model functions under conditions where Suc is abundant but growth is limited by other factors, i.e. when growth is sink limited, such as at low temperature. Is T6P simply a signal of Suc availability or is T6P also directly related to growth rate? This question was addressed through treatments that uncoupled Suc and growth through low temperature and removal of nitrogen from the growing medium.
T6P Responds to Suc Levels under All Conditions
Large increases in T6P were induced in the experimental treatments (Fig. 1G). There was a 55-fold range of T6P levels observed overall from 0.18 nmol g−1 FW at the start of the experiment in seedlings with no sugar, up to 9.9 nmol g−1 FW in cold-treated seedlings. Tissue Suc levels ranged from 1.5 µmol g−1 FW to 14.8 µmol g−1 FW, a 9.9-fold range. The relationship between tissue Suc and T6P was linear when tissue Suc was varied through feeding and through transfer of seedlings to 10°C or to low nitrogen (Fig. 2A). This establishes that T6P responds to changes in Suc produced by environmental treatments that limit growth and not just to Suc fed externally or to Suc produced as a result of increased irradiance or changes in daylength (Lunn et al., 2006), i.e. T6P responds to Suc accumulation induced by sink limitation caused by low temperature and low nitrogen. The relationship between Suc and T6P was linear once a tissue level of 3 µmol Suc g−1 FW had been reached (Fig. 2A), which may represent a threshold necessary to induce T6P synthesis. It could also represent a possible famine threshold level of Suc above which growth is induced. While a strong relationship is seen between Suc and T6P, other studies (Martínez-Barajas et al., 2011) in an analysis of wheat (Triticum aestivum) grain have shown a relationship with catabolites of Suc and T6P, including Glc. To test the specificity of the interrelationship between Suc and T6P, feeding of 0.5% (w/v) Glc was performed. Glc feeding did not increase T6P (Fig. 1G and 2B) in comparison to feeding 0.5% (w/v) Suc. Although the effects of these two sugars are difficult to separate in plants because of their interconversion, this experiment provides evidence that T6P responds specifically to Suc. This was confirmed in analysis of regression between Suc, Glc, Fru, and T6P from all the experiments (Fig. 2), which showed best relationships between Suc and T6P. TPS1, the most likely candidate TPS involved directly in T6P synthesis, was induced in all treatments including Glc (Supplemental Fig. S3A), even though Glc did not stimulate T6P synthesis. This could indicate that a Suc-specific activation component is necessary for T6P synthesis. TPPA and TPPB were also induced. Further work would be required to determine the specific roles of TPS and TPP enzymes in the regulation of T6P levels in response to Suc accumulation.
We then went on to determine the interrelationship between T6P and the transcript abundance of SnRK1 marker genes under the different conditions. T6P is known to promote growth and to promote transcription of genes associated with biosynthetic processes and growth (Baena-González et al., 2007; Zhang et al., 2009; Debast et al., 2011). Given that T6P was related to Suc levels under all treatments with different growth rates, we wished to determine if transcript abundance of SnRK1 markers was related to T6P or to growth rate.
SnRK1 Target Gene Expression Changes in Relation to T6P and Not Directly to Growth Rate
There was a strong correlation between T6P and SnRK1-regulated gene expression (Fig. 5) but not between T6P and relative growth rate (Fig. 6A). This establishes quite clearly that SnRK1 marker gene expression is related closely to T6P content irrespective of the growth outcome. Changes in gene expression were elicited above and below a threshold level of T6P of 0.3 to 0.5 nmol g−1 FW (Fig. 5). Assuming T6P is cytosolic and the cytosol accounts for 10% tissue water, cytosolic concentrations of T6P will be in the region of 10-fold higher than when expressed on a whole tissue basis. Strikingly, this would equate to 3 to 5 µm T6P close to the T6P/SnRK1 dissociation constant calculated as 4 µm (Nunes et al., 2013). From what is known about the inhibition of SnRK1 by T6P, this would enable high SnRK1 activity at 1.8 µm T6P (at the start of the experiment) and strong inhibition possibly by 80% or more at 99 µm T6P (Zhang et al., 2009) in the cold. In contrast, changes in in vitro SnRK1 activities measured without T6P in the assay were less than 2-fold throughout the experiment (Fig. 3, A, C, and D). These measurements in vitro effectively show maximum catalytic potential or enzyme concentration and do not reflect regulation by T6P. In vivo, a large dynamic range of T6P in response to environmentally induced changes in Suc induced by sink limitation would provide a powerful means of regulation of SnRK1 in response to Suc supply demonstrated in the readout of SnRK1 marker gene expression.
As the relationship between T6P and SnRK1 marker gene abundance held even when the growth rate was low, i.e. under sink-limited conditions, we went on to test the physiological significance of the increase in T6P and gene expression under sink-limited conditions. What could be the adaptive advantage of activating gene expression in this way if growth was inhibited? We posed the hypothesis that the T6P/SnRK1 signaling pathway primes growth to proceed once sink limitation is relieved. By priming, we mean being in a prepared state with an advanced capacity to activate growth following relief of a growth limitation, such as upon relief of low temperature.
T6P Primes Gene Expression for Growth When Suc Availability Is High
To test this idea, sink limitation was relieved while Suc and T6P contents were high, by transferring seedlings grown in the cold for 24 h to the warm. Growth rate of these seedlings with elevated T6P was 3-fold higher in the first few hours upon return to the warm conditions compared with controls that had been kept in the warm (Fig. 7, A and B). The experiment was also performed with seedlings where T6P levels were decreased through expression of otsB encoding an E. coli TPP. T6P was strongly decreased in otsB compared with the wild type even though sugar contents of these seedlings were very high. When grown with low sugar content, otsB grows at a similar growth rate to the wild type (Schluepmann et al., 2003). However, growth of these seedlings upon transfer to the warm was severely compromised (Fig. 7B). This would indicate that T6P is necessary for rapid growth after the cold-to-warm transfer. To further confirm the role of T6P/SnRK1, the experiment was also performed on seedlings overexpressing SnRK1 (KIN10; Baena-González et al., 2007). These seedlings too were unable to rapidly increase growth in response to the warm conditions (Fig. 7, E and F). Therefore, we conclude that the T6P/SnRK1 signaling pathway is necessary to potentiate rapid growth following relief from low temperature.
Glc Results in Moderate Regulation of SnRK1-Regulated Genes
In spite of no induction of T6P accumulation by Glc feeding (Fig. 2B), there was a change in SnRK1 marker gene expression in response to Glc feeding, which was more moderate than that induced by Suc (Figs. 5 and 6). This suggests that either there were localized changes in T6P content in response to Glc or that other factors were regulating these genes either through SnRK1 or through other mechanisms. Both G6P and G1P increased during Glc feeding (Supplemental Fig. S1, A and B). G6P and G1P inhibit SnRK1 (Toroser et al., 2000; Nunes et al., 2013), although far less potently than T6P. This milder effect on gene expression and smaller stimulation of growth compared with Suc control could be due to regulation of SnRK1 at least in part by these metabolites. The magnitude of gene expression and growth effects reflects less potent regulation of SnRK1 in response to Glc.
CONCLUSION
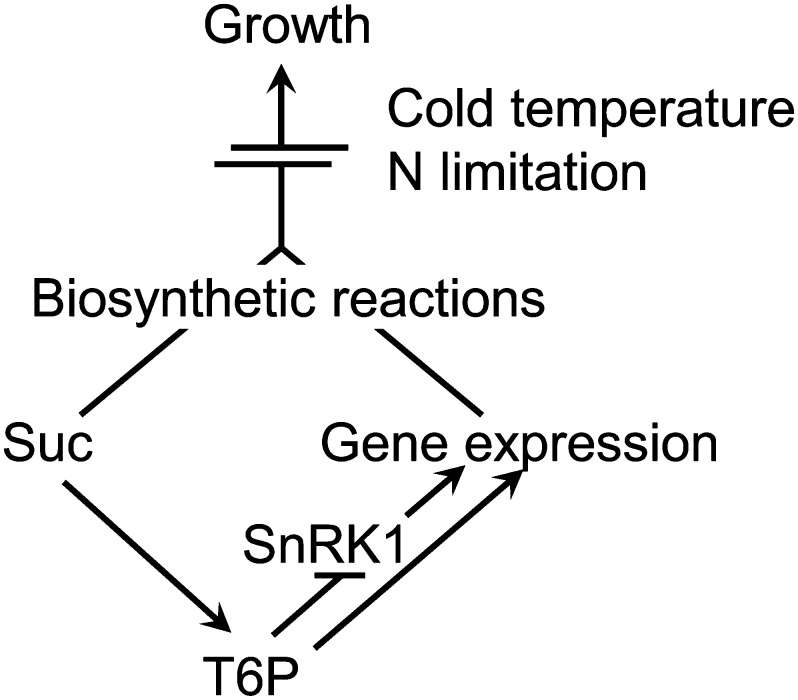
We show that restriction of growth by low temperature or low nitrogen leads to large increases in T6P. While the regulation of SnRK1 in response to endogenous Suc levels likely involves factors in addition to T6P, in vitro catalytic data, and now in vivo gene expression data in a physiological context, support the view that T6P regulation of SnRK1 provides an explanation at least in part for the control of growth in response to tissue Suc availability providing other factors are not limiting. Evidence presented suggests the mechanism operates above a level of Suc of 3 µmol g−1 FW and 0.3 to 0.5 nmol T6P g−1 FW likely to indicate a Suc starvation threshold. This starvation threshold (3–5 µm T6P) is close to the Ki of the T6P/SnRK1 complex (Zhang et al., 2009; Nunes et al., 2013). Increases in Suc above this level through Suc feeding or through treatments that induce sink-limited growth resulted in a proportionate increase both in T6P content and changes in expression of SnRK1 marker genes. SnRK1 is likely inhibited in vivo by up to 80% or more by T6P under the physiological conditions caused by low temperature. Under such sink-limited conditions, T6P is not directly related to growth rate; the regulation of growth here is downstream of the T6P/ SnRK1 mechanism. However, the changes in gene expression induced by T6P under such conditions would prime growth to proceed once the growth limitation is removed. The T6P/SnRK1 signaling pathway is necessary for the acceleration of growth following relief from sink-limited conditions, such as low temperature. A model is presented to summarize these findings (Fig. 8).
Figure 8.
Model for the role of T6P in priming growth. T6P content is closely related to Suc availability. By inhibiting SnRK1 (and possibly also through SnRK-independent regulation), T6P increases the expression of biosynthetic genes, e.g. for protein, nucleotide, and cell wall synthesis. Under favorable conditions, the availability of Suc, together with the changes in gene expression, can result in enhanced growth. However, under some stress conditions, growth is limited despite Suc accumulation. Cold temperature, for example, does not only slow down metabolic rates, but also restricts growth through reduced gibberellin content and accumulation of growth-repressing DELLA proteins (Achard et al., 2008). N limitation reduces growth rates partly because of lower rates of, for example, protein synthesis, but also through interaction with hormones (Krouk et al., 2011), such as reduced synthesis of cytokinin at low nitrate availability. Under these conditions, T6P can prime growth by stimulating the expression of biosynthetic genes, which together with the availability of Suc results in a rapid growth spurt once restrictions, such as cold temperature, are released.
MATERIALS AND METHODS
Plant Material and Growth Conditions
Seeds of Arabidopsis (Arabidopsis thaliana ecotype Columbia-0) were weighed in batches of 2.5 mg and surface sterilized for 10 min in a 10% (w/v) sodium hypochlorite solution with Triton X-100 and rinsed twice in sterile water. Each seed batch was grown in 50 mL one-half-strength Murashige and Skoog medium (ApolloScientific PMM524) plus Gamborg’s vitamins (Sigma-Aldrich G1019) and 0.5% (w/v) Suc (0.25 g/50 mL medium) in culture flasks (300-mL plastic vessels; Greiner). After cold treatment for 2 d in the dark at 4°C, they were transferred to the growth room for 7 d at 23°C (16 h light/8 h dark) with 130 µmol quanta m−2 s−1 irradiance with gentle shaking. At day 8, the medium was removed and the plantlets were washed thoroughly twice with sterile water. The same volume of fresh medium was added to five groups of plants. Group 1 had no added sugar; group 2 had 0.5% (w/v) Suc; group 3 had 0.5% (w/v) Suc and transferred to 10°C; group 4 had one-half-strength Murashige and Skoog medium without nitrogen (ApolloScientific PMM531) with everything else the same and 0.5% (w/v) Suc; group 5 had 0.5% (w/v) Glc. Five plants were harvested before medium change (time 0), and five of each group were harvested 3, 6, 24, 48, and 72 h after medium change. Medium change was performed 4 h after the start of the light period. Hence, harvests at 3 and 6 h were 7 and 10 h into the photoperiod and harvests at 24, 48, and 72 h were 4 h into the photoperiod. Harvests were done within 2 min under the growth light conditions. Seedlings from each pot were rinsed in distilled water, gently blotted dry with tissue paper, weighed, and snap-frozen in liquid nitrogen. Transgenic Arabidopsis expressing the TPP gene otsB in Columbia-0 background and overexpressing KIN10 were as described previously (Schluepmann et al., 2003; Baena-González et al., 2007). For the relative growth rate (RGR) experiment, seedlings were grown with 0.5% (w/v) Suc for 7 d at 22°C, after which medium was changed as previously stated and either transferred to 10°C for 24 h and then back to 22°C or held at 22°C throughout. Harvests were all performed at 22°C as described above at time points −24, 0, 4, 11, 24, and 48 h. The RGR was calculated using the method indicated by Hoffmann and Poorter (2002).
Assay for SnRK1 Activity
Total soluble protein was extracted from 200 mg of tissue ground under liquid nitrogen in a pestle and mortar in 600 µL of ice-cold homogenization buffer of 100 mm Tricine-NaOH, pH 8, 25 mm NaF, 5 mm dithiothreitol, 2 mm tetrasodium pyrophosphate, 0.5 mm EDTA, 0.5 mm EGTA, 1 mm benzamidine, 1 mm PMSF, 1 mm protease inhibitor cocktail (Sigma-Aldrich P9599), phosphatase inhibitors (PhosStop; Roche), and insoluble polyvinylpyrrolidone to 2% (w/v). Homogenate was centrifuged at 13,000g at 4°C. Supernatant (250 µL) was desalted in illustra NAP-5 columns (GE Healthcare) preequilibrated with homogenization buffer. Eluant was supplemented with protease inhibitor cocktail and okadaic acid to 2.5 mm before freezing in liquid nitrogen. SnRK1 activity of three replicates for each time point was determined as described by Zhang et al. (2009) in a final volume of 25 µL in microtiter plate wells at 30°C. Assay medium was 40 mm HEPES-NaOH, pH 7.5, 5 mm MgCl2, and 200 mm ATP containing 12.5 kBq [γ-33P]ATP (Perkin-Elmer), 200 µm AMARA peptide (Enzo Life Sciences), 5 mm dithiothreitol, 1 µm okadaic acid, and 1 mm protease inhibitor cocktail (Sigma-Aldrich P9599). Assays were started with 5 µL extract and stopped after 6 min by transferring 15 µL to 4-cm2 squares of Whatman P81 phosphocellulose paper immersed immediately in 1% (w/v) phosphoric acid. These were then washed with four 800-mL volumes of 1% (w/v) phosphoric acid, immersed in acetone for 15 min, air-dried, and transferred to vials with 3.5 mL of scintillation cocktail (Ultima Gold).
Sugar and Glc 6-P Quantification
Suc, hexoses, starch, Glc 6-P, and Glc 1-P were measured using spectrophotometric assays as described by Pellny et al. (2004).
T6P Determinations
T6P was quantified in Arabidopsis seedling extracts using anion-exchange HPLC coupled with electrospray ionization mass spectrometry (Delatte et al., 2009).
RNA Extraction and qRT-PCR
Total RNA was extracted from 100 mg of snap-frozen ground tissue using the RNeasy plant mini kit (Qiagen). RNA was quantified by a Nanodrop spectrophotometer (ND-1000) and its integrity evaluated by agarose gel electrophoresis. DNA was removed with RQ1 RNase-free DNase (Promega M610A). cDNA was synthesized by reverse transcribing 1 µg of RNA using the SuperScript III first-strand synthesis system for RT-PCRscriptase (Invitrogen). Gene expression was quantified using SYBR Green chemistry on a iQ Real-Time PCR system (Bio-Rad) in 20 µL for each reaction, containing 10 µL of iQ SYBR Green Supermix (Bio-Rad), 3 µL of cDNA, and 0.5 µm primers. PCR used an initial denaturing stage of 95°C for 3 min followed by 45 cycles of 95°C for 10 s, followed by an annealing step at 60°C for 10 s and an extension step at 72°C for 10 s. The specificity of products was confirmed by performing a temperature analysis at temperatures ranging from 55°C to 95°C at intervals of 0.5°C. PCR was performed with two technical replicates repeated on three biological replicates. Data were normalized using a combination of three reference genes: yellow-leaf-specific protein 8 (At5g082290), ubiquitin-transferase family protein (At3g53090), and protein phosphatase 2A subunit (At1g13320; Czechowski et al., 2005). Intron-spanning primers (Supplemental Table S1) were designed using the Primer Express software version 2.0 (Applied Biosystems).
Statistical Analysis
The relationship between T6P and sugars and T6P and SnRK1 marker genes relative expression was tested using regression analysis. The analysis was performed using SigmaPlot 11.0 (Systat Software). Each regression is associated with the r2 value, the se of estimates (SEE), and the P value that characterizes the model.
Supplemental Data
The following materials are available in the online version of this article.
Supplemental Figure S1. G6P and G1P accumulation in response to glucose feeding.
Supplemental Figure S2. Transcript abundance of glucose marker genes determined by qRT-PCR in response to glucose feeding relative to starvation.
Supplemental Figure S3. Transcript abundance of trehalose pathway genes determined by qRT-PCR in response to sucrose and glucose feeding with full nutrition at 22°C and after transfer to 10°C or zero nitrogen relative to starvation conditions without external carbon source.
Supplemental Figure S4. Relative growth rate calculated from dry weight of wild-type Ler compared to KIN10 seedlings.
Supplemental Table S1. Primers used for qRT-PCR.
Supplementary Material
Glossary
- T6P
trehalose 6-P
- TPS
trehalose phosphate synthase
- TPP
trehalose phosphate phosphatase
- FW
fresh weight
- Ler
Landsberg erecta
- RGR
relative growth rate
- qRT
Quantitative reverse transcription
- SEE
se of estimates
References
- Achard P, Gong F, Cheminant S, Alioua M, Hedden P, Genschik P. (2008) The cold-inducible CBF1 factor-dependent signaling pathway modulates the accumulation of the growth-repressing DELLA proteins via its effect on gibberellin metabolism. Plant Cell 20: 2117–2129 [DOI] [PMC free article] [PubMed] [Google Scholar]
- Baena-González E, Rolland F, Thevelein JM, Sheen J. (2007) A central integrator of transcription networks in plant stress and energy signalling. Nature 448: 938–942 [DOI] [PubMed] [Google Scholar]
- Czechowski T, Stitt M, Altmann T, Udvardi MK, Scheible WR. (2005) Genome-wide identification and testing of superior reference genes for transcript normalization in Arabidopsis. Plant Physiol 139: 5–17 [DOI] [PMC free article] [PubMed] [Google Scholar]
- Debast S, Nunes-Nesi A, Hajirezaei MR, Hofmann J, Sonnewald U, Fernie AR, Börnke F. (2011) Altering trehalose-6-phosphate content in transgenic potato tubers affects tuber growth and alters responsiveness to hormones during sprouting. Plant Physiol 156: 1754–1771 [DOI] [PMC free article] [PubMed] [Google Scholar]
- Delatte TL, Sedijani P, Kondou Y, Matsui M, de Jong GJ, Somsen GW, Wiese-Klinkenberg A, Primavesi LF, Paul MJ, Schluepmann H. (2011) Growth arrest by trehalose-6-phosphate: an astonishing case of primary metabolite control over growth by way of the SnRK1 signaling pathway. Plant Physiol 157: 160–174 [DOI] [PMC free article] [PubMed] [Google Scholar]
- Delatte TL, Selman MHJ, Schluepmann H, Somsen GW, Smeekens SC, de Jong GJ. (2009) Determination of trehalose-6-phosphate in Arabidopsis seedlings by successive extractions followed by anion exchange chromatography-mass spectrometry. Anal Biochem 389: 12–17 [DOI] [PubMed] [Google Scholar]
- Eastmond PJ, van Dijken AJ, Spielman M, Kerr A, Tissier AF, Dickinson HG, Jones JD, Smeekens SC, Graham IA. (2002) Trehalose-6-phosphate synthase 1, which catalyses the first step in trehalose synthesis, is essential for Arabidopsis embryo maturation. Plant J 29: 225–235 [DOI] [PubMed] [Google Scholar]
- Elbein AD, Pan YT, Pastuszak I, Carroll D. (2003) New insights on trehalose: a multifunctional molecule. Glycobiology 13: 17R–27R [DOI] [PubMed] [Google Scholar]
- Gómez LD, Gilday A, Feil R, Lunn JE, Graham IA. (2010) AtTPS1-mediated trehalose 6-phosphate synthesis is essential for embryogenic and vegetative growth and responsiveness to ABA in germinating seeds and stomatal guard cells. Plant J 64: 1–13 [DOI] [PubMed] [Google Scholar]
- Gómez LD, Baud S, Gilday A, Li Y, Graham IA. (2006) Delayed embryo development in the ARABIDOPSIS TREHALOSE-6-PHOSPHATE SYNTHASE 1 mutant is associated with altered cell wall structure, decreased cell division and starch accumulation. Plant J 46: 69–84 [DOI] [PubMed] [Google Scholar]
- Hardie DG. (2007) AMP-activated/SNF1 protein kinases: conserved guardians of cellular energy. Nat Rev Mol Cell Biol 8: 774–785 [DOI] [PubMed] [Google Scholar]
- Hoffmann WA, Poorter H. (2002) Avoiding bias in calculations of relative growth rate. Ann Bot (Lond) 90: 37–42 [DOI] [PMC free article] [PubMed] [Google Scholar]
- Kolbe A, Tiessen A, Schluepmann H, Paul M, Ulrich S, Geigenberger P. (2005) Trehalose 6-phosphate regulates starch synthesis via posttranslational redox activation of ADP-glucose pyrophosphorylase. Proc Natl Acad Sci USA 102: 11118–11123 [DOI] [PMC free article] [PubMed] [Google Scholar]
- Krouk G, Ruffel S, Gutiérrez RA, Gojon A, Crawford NM, Coruzzi GM, Lacombe B. (2011) A framework integrating plant growth with hormones and nutrients. Trends Plant Sci 16: 178–182 [DOI] [PubMed] [Google Scholar]
- Lunn JE, Feil R, Hendriks JHM, Gibon Y, Morcuende R, Osuna D, Scheible W-R, Carillo P, Hajirezaei M-R, Stitt M. (2006) Sugar-induced increases in trehalose 6-phosphate are correlated with redox activation of ADPglucose pyrophosphorylase and higher rates of starch synthesis in Arabidopsis thaliana. Biochem J 397: 139–148 [DOI] [PMC free article] [PubMed] [Google Scholar]
- Martínez-Barajas E, Delatte T, Schluepmann H, de Jong GJ, Somsen GW, Nunes C, Primavesi LF, Coello P, Mitchell RAC, Paul MJ. (2011) Wheat grain development is characterized by remarkable trehalose 6-phosphate accumulation pregrain filling: tissue distribution and relationship to SNF1-related protein kinase1 activity. Plant Physiol 156: 373–381 [DOI] [PMC free article] [PubMed] [Google Scholar]
- Nunes C, Primavesi LF, Patel MK, Martinez-Barajas E, Powers SJ, Sagar R, Fevereiro PS, Davis BG, Paul MJ. (2013) Inhibition of SnRK1 by metabolites: tissue-dependent effects and cooperative inhibition by glucose 1-phosphate in combination with trehalose 6-phosphate. Plant Physiol Biochem 63: 89–98 [DOI] [PubMed] [Google Scholar]
- Paul MJ, Jhurreea D, Zhang Y, Primavesi LF, Delatte T, Schluepmann H, Wingler A. (2010) Upregulation of biosynthetic processes associated with growth by trehalose 6-phosphate. Plant Signal Behav 5: 386–392 [DOI] [PMC free article] [PubMed] [Google Scholar]
- Paul MJ, Primavesi LF, Jhurreea D, Zhang Y. (2008) Trehalose metabolism and signaling. Annu Rev Plant Biol 59: 417–441 [DOI] [PubMed] [Google Scholar]
- Paul MJ, Stitt M. (1993) Effects of nitrogen and phosphorus deficiencies on levels of carbohydrates, respiratory enzymes and metabolites in seedlings of tobacco and their response to exogenous sucrose. Plant Cell Environ 16: 1047–1057 [Google Scholar]
- Pellny TK, Ghannoum O, Conroy JP, Schluepmann H, Smeekens S, Andralojc J, Krause K-P, Goddijn O, Paul MJ. (2004) Genetic modification of photosynthesis with E. coli genes for trehalose synthesis. Plant Biotechnol J 2: 71–82 [DOI] [PubMed] [Google Scholar]
- Ramon M, Rolland F. (2007) Plant development: introducing trehalose metabolism. Trends Plant Sci 12: 185–188 [DOI] [PubMed] [Google Scholar]
- Schluepmann H, Pellny T, van Dijken A, Smeekens S, Paul M. (2003) Trehalose 6-phosphate is indispensable for carbohydrate utilization and growth in Arabidopsis thaliana. Proc Natl Acad Sci USA 100: 6849–6854 [DOI] [PMC free article] [PubMed] [Google Scholar]
- Toroser D, Plaut Z, Huber SC. (2000) Regulation of a plant SNF1-related protein kinase by glucose-6-phosphate. Plant Physiol 123: 403–412 [DOI] [PMC free article] [PubMed] [Google Scholar]
- Usadel B, Bläsing OE, Gibon Y, Poree F, Höhne M, Günter M, Trethewey R, Kamlage B, Poorter H, Stitt M. (2008) Multilevel genomic analysis of the response of transcripts, enzyme activities and metabolites in Arabidopsis rosettes to a progressive decrease of temperature in the non-freezing range. Plant Cell Environ 31: 518–547 [DOI] [PubMed] [Google Scholar]
- Vandesteene L, López-Galvis L, Vanneste K, Feil R, Maere S, Lammens W, Rolland F, Lunn JE, Avonce N, Beeckman T, Van Dijck P. (2012) Expansive evolution of the trehalose-6-phosphate phosphatase gene family in Arabidopsis. Plant Physiol 160: 884–896 [DOI] [PMC free article] [PubMed] [Google Scholar]
- Vandesteene L, Ramon M, Le Roy K, Van Dijck P, Rolland F. (2010) A single active trehalose-6-P synthase (TPS) and a family of putative regulatory TPS-like proteins in Arabidopsis. Mol Plant 3: 406–419 [DOI] [PubMed] [Google Scholar]
- van Dijken AJH, Schluepmann H, Smeekens SC. (2004) Arabidopsis trehalose-6-phosphate synthase 1 is essential for normal vegetative growth and transition to flowering. Plant Physiol 135: 969–977 [DOI] [PMC free article] [PubMed] [Google Scholar]
- Wingler A, Delatte TL, O’Hara LE, Primavesi LF, Jhurreea D, Paul MJ, Schluepmann H. (2012) Trehalose 6-phosphate is required for the onset of leaf senescence associated with high carbon availability. Plant Physiol 158: 1241–1251 [DOI] [PMC free article] [PubMed] [Google Scholar]
- Zhang Y, Primavesi LF, Jhurreea D, Andralojc PJ, Mitchell RAC, Powers SJ, Schluepmann H, Delatte T, Wingler A, Paul MJ. (2009) Inhibition of SNF1-related protein kinase1 activity and regulation of metabolic pathways by trehalose-6-phosphate. Plant Physiol 149: 1860–1871 [DOI] [PMC free article] [PubMed] [Google Scholar]
Associated Data
This section collects any data citations, data availability statements, or supplementary materials included in this article.


