

Abstract
It has recently been recognized that solid-state nanopores in single-atomic-layer graphene membranes can be used to electronically detect and characterize single long charged polymer molecules. We have now fabricated nanopores in single-layer graphene that are closely matched to the diameter of a double-stranded DNA molecule. Ionic current signals during electrophoretically driven translocation of DNA through these nanopores were experimentally explored and theoretically modeled. Our experiments show that these nanopores have unusually high sensitivity (0.65 nA/Å) to extremely small changes in the translocating molecule’s outer diameter. Such atomically short graphene nanopores can also resolve nanoscale-spaced molecular structures along the length of a polymer, but do so with greatest sensitivity only when the pore and molecule diameters are closely matched. Modeling confirms that our most closely matched pores have an inherent resolution of ≤0.6 nm along the length of the molecule.
Recent work has shown that single DNA molecules in solution can be detected and characterized with graphene nanopores (1–3). The potential advantages of graphene nanopores include high sensitivity and subnanometer-scale resolution along a translocating polymer. We have previously reported that nanopores in single-layer graphene have a length of 0.6 nm, which is the ion-insulating thickness of a graphene layer (1). Here we report on the sensitivity and resolution of graphene nanopores that closely match the diameter of translocating double-stranded (ds)DNA molecules. We conclude that such nanopores should be able to detect and resolve components along the length of a polymer that are as closely spaced as ∼0.5 nm. This is better resolution than can be obtained from the shortest nanopores previously fabricated in other solid-state substrates such as SiNx (4, 5). [Nanopores shorter than 1 nm have yet to be fabricated in other solid-state substrates (6, 7).]
In a nanopore sensor, a charged polymer in solution is electrophoretically translocated through a nanometer-scale pore in an insulating membrane separating two voltage-biased reservoirs filled with aqueous ionic solution (Fig. 1A) (8). Here we experimentally explore and theoretically model the properties of nanopores in single-layer graphene. We demonstrate that they achieve their best resolution and sensitivity when their diameter is very close to that of the translocating polymer. Our modeling confirms that subnanometer-scale resolution and unusually high sensitivity can be achieved with a tightly dimensioned pore because most of the ionic current in our atomically short pores is localized near their sharp perimeters.
Fig. 1.

(A) The experimental device with dsDNA translocating through a nanopore in graphene mounted on a SiNx frame. (B) Open pore currents through a series of different EM-measured graphene nanopore diameters before addition of DNA. SE bars for Io are encompassed within the area of the data points; estimated errors for DEM are discussed in Materials and Methods. (C) Solution of the Laplace equation graphically displayed for the ionic current density, j (in units of A/m2), mapped through a cross-section of (Left) a short nanopore (L = 0.6 nm, D = 2.5 nm) and (Right) a longer nanopore with the same diameter (L = 5 nm, D = 2.5 nm). Note the current density is strongly localized close to the edge of the short nanopore but quite uniformly distributed throughout the entire diameter within the longer nanopore. Because of its greater electrical resistance and lesser current, nowhere in the longer nanopore will the current density reach that seen (yellow and red colors) near the perimeter of the atomically short nanopore in graphene. Scale bar and bias voltage are identical Left and Right. (D) Typical blockades as dsDNA translocates through a SiNx nanopore and through graphene nanopores of different diameters, DEM. The open pore current (Io) portion of each trace is shown on the same horizontal line even though the open pore currents varied with the pore diameters; the actual value of each pore’s Io is stated below each pore’s EM-measured diameter (DEM). All of the blockade traces are drawn to the same scale (indicated on the right).
Most of the work reported here uses dsDNA as the charged polymer. When the negatively charged molecule is translocated through a voltage-biased nanopore, it blocks the flow of ions through the nanopore, leading to a transient drop of the recorded ionic current. This transient drop is called a “blockade”. Its magnitude, ΔIB, is defined as the difference between the ionic current through the open pore and the current through the pore during polymer translocation (Fig. S1). We show molecule translocation through graphene nanopores for both dsDNA and single-stranded DNA (ssDNA), but the diameters of the nanopores reported here are small enough to provide high sensitivity and resolution only for dsDNA. Recently reported fabrication methods (9) should soon provide tightly fitting nanopores (≤2 nm diameter) for ssDNA.
Experimental Results
We fabricated a single nanopore in a series of single-layer graphene membranes, using an electron microscope (Materials and Methods). Each graphene membrane was suspended over a 200-nm × 200-nm aperture in a thin, free-standing SiNx film supported on a silicon frame. The membrane separated an ionic solution-filled flow cell into two chambers. The two solution-filled chambers, each in contact with a Ag\AgCl electrode, were in fluid contact with each other only through the nanopore in the graphene membrane (Fig. 1A and Materials and Methods).
Ionic conductivity measurements through a series of different diameter graphene nanopores show that the open pore currents (Io) are linearly proportional to the pore diameter even for nanopores with diameters as small as D ∼ 3 nm (Fig. 1B). The linear dependence of Io on the pore’s diameter (3.85 nA/nm), as opposed to the pore’s cross-sectional area, is expected for atomically short nanopores whose current density is sharply peaked near the pore’s perimeter and whose resistance is dominated by its access resistance (10). This linear dependence is also consistent with molecular dynamic calculations (11) and with our numerical solutions of the Laplace equation for the scalar potential of the ionic current density distribution in an atomically short pore (Materials and Methods). These solutions show that when the nanopore length, L, is much less than the pore diameter D (i.e., L < D), the ionic current density is strongly peaked near the nanopore perimeter (Fig. 1C, Left). In contrast, when L ≥ D, the ionic current density is quite uniformly distributed within the nanopore (Fig. 1C, Right). Recognizing these fundamentals of ionic current distribution in atomically short pores makes it all the more important to consider, as we do below (see Fig. 3), how these current distributions are affected when the pore is used to sense a translocating molecule.
Fig. 3.

(A) Average blockade magnitude for dsDNA translocations vs. nanopore diameter. Solid blue circles are the experimentally determined mean ΔIB signals (±SE bars) from nanopores in single-layer graphene; open circles are measured ΔIB signals from a 30-nm-long nanopore in SiNx. Errors for the DEM values are discussed in Materials and Methods. Solid black and colored lines are numerically simulated values for ideal circular nanopores through membranes of the indicated thicknesses. The black dashed curve is the numerically simulated ΔIB, using the dimensions of the boundary conditions DC, L, and dpoly explained in the text. Insets are transmission electron micrographs of four sample pores to which the arrows point. The full width of each Inset image = 10 nm of the graphene sample. (B) Graphical representation of the calculated current density in a 2.5-nm diameter graphene nanopore (L = 0.6 nm) traversed by dsDNA modeled as a 2.1-nm diameter insulating cylinder. (C) Calculated sensitivity gradient (SG) (main text) along the length of a DNA molecule in a graphene nanopore as in B. (D) Graphical representation of the calculated current density in a 2.5-nm diameter SiNx nanopore (L = 5 nm) traversed by dsDNA modeled as a 2.1-nm diameter insulating cylinder. Note that in contrast to the atomically short graphene nanopore in B, the ionic current density in a long pore remains relatively low and quite uniformly distributed throughout the small space between the nanopore’s diameter and the dsDNA’s diameter, even when the nanopore is occupied by dsDNA.
Fig. 1D shows DNA blockades observed as 10-kb dsDNA molecules are electrophoretically translocated by a 160-mV bias through nanopores of various diameters. To maximize the current through the nanopore, and hence the current blockages attributable to the presence of the translocating molecule, we tested our graphene membranes’ abilities to withstand the largest possible biases. Although some graphene membranes maintained their integrity and high ionic current resistance to bias voltages as high as 500 mV, many exhibited a gradual loss of resistance at this bias. Because all tested membranes maintained their resistances when subjected to a 160-mV bias, we used this 160-mV bias in all of the experiments reported here.
Unlike those in the many solid-state nanopores in SiNx we and others have investigated, the blockade magnitudes in atomically short graphene nanopores always exhibit strong inverse nanopore diameter dependence (Fig. 1D and Fig. S1). Especially for the smaller nanopores whose diameters approach the diameter of the translocating polymer, the observed nanoampere blockade magnitudes are significantly larger than those of the picoampere blockades obtained in other nanopores, exceeding even those of the large blockades observed in Mycobacterium smegmatis porin A nanopores (12, 13).
The large blockade magnitudes observed in the closely fitting graphene nanopores (Fig. 1D) are a direct consequence of the molecule blocking the ionic current except in the small region between the molecule’s surface and the pore’s perimeter. Because of the high current density and large current density variations in this region, small variations in the polymer’s geometry or surrounding fluid properties will be significantly reflected in the resulting blockade.
To evaluate the geometrical sensitivity of graphene nanopores to the molecule’s blocking diameter, we investigated and analyzed many DNA translocation events for pores of different diameters. Fig. 2 shows translocation event distributions for two pores of different diameter. We characterize each DNA translocation event by two parameters: the event duration, which indicates the time it takes for the molecule to fully translocate through the nanopore, and the average blockade magnitude, which reflects the extent to which the molecule obstructs or blocks the flow of ionic current through the nanopore.
Fig. 2.

(A and C) Event plots for different diameter nanopores. Each circle corresponds to a DNA translocation event. Each of the 309 blue circles represents the translocation of a single extended, unfolded dsDNA molecule (pH 10); each of the 170 green circles represents partially or fully folded dsDNA translocations (pH 10); and black circles represent ssDNA translocations (pH 12.5). (B and D) Single typical event current traces corresponding to one of the events from the event plots in A and C for unfolded dsDNA (blue), partially folded dsDNA (green), and ssDNA (black) whose folding is unknown. Both of the event plots and current traces in C and D were from an experiment performed with the same nanopore.
In nanopores with diameters greater than ∼4 nm, dsDNA molecules translocate through the pore either as an extended linear molecule (leading to a single-dip event; Fig. 2 A and B, Left) or as a folded molecule (typically more than doubling the blockade magnitude during traversal of the folded part of the molecule; Fig. 2B, Right) (14). In nanopores with diameters < ∼4 nm (Fig. 2C), only unfolded molecules were observed (single-dip events; Fig. 2D, Left), consistent with the fact that these nanopores are too small to easily admit folded dsDNA molecules.
From the translocation time distributions observed we conclude that the dsDNA molecules are minimally retarded by strong stochastic or nonspecific chemical interactions with the graphene membrane or the nanopore edge—i.e., they translocate freely through the graphene nanopore under the high-salt, high-pH conditions of our experiment (Materials and Methods). This is evident because (a) the mean translocation time (Tm ∼ 100 μs) is short, consistent with free polymer translocation theory (11, 15); (b) the translocation-time distribution is narrow, with the full width at half maximum (FWHM) of ∼33% of the mean translocation time (Fig. S2) as expected from the ensemble of initial polymer conformations in solution (15); and (c) the distribution of blockade magnitudes from single-file DNA translocation events is narrow, with the FWHM of 10%, indicating well-defined pore-blocking geometry. Strong stochastic interactions are not conducive to polymer analysis because the blockade magnitude values in such cases can be distorted by trapping (16) and coiling up of the molecule at the pore entrance, leading to much larger blockade signals than theoretically expected for fully extended polymers.
The data in Figs. 1C and 2 and Fig. S2 show a trend toward shorter translocation times for smaller pores. This effect may be due to a decreased electroosmotic drag on the translocating DNA in smaller pores. As noted by van Dorp et al. (17), electroosmotic drag was minimized in their smallest nanopores. But, because van Dorp and colleagues performed their experiments with relatively large SiNx nanopores under different conditions than those used here with graphene nanopores, an explanation for the shorter translocation times with smaller diameter graphene pores will require further investigation. Nevertheless, in contrast to the strong interactions that lead to the long translocation times we and others have observed in small diameter (∼3–4 nm) SiNx nanopores at pH 8.5 or 8.0 with 1.0 or 1.6 M KCl (14, 18–20), our pH 10 with 3 M KCl conditions minimized DNA–graphene interactions (1). These results lead us to conclude that in graphene pores under our conditions, stochastic interactions between the translocating polymer and the nanopore perimeter are not the primary factor that determines the rate of polymer translocation.
Raising the pH of the salt solution from 10 to 12.5 denatures the dsDNA into ssDNA molecules (18). Unfolded ssDNA translocation events (Fig. 2 C and D, Right) show blockade magnitudes less than half those of dsDNA (Fig. 2D, Left), a reflection of the reduced diameter of ssDNA. To our knowledge this is a unique observation of ssDNA translocating through a graphene nanopore. Many ssDNA event durations are widely spread, extending from less than 100 μs to over 400 μs (Fig. 2C). These extended translocation times strongly suggest that many of the ssDNA molecules stick to, or interact with, graphene. Because it is known that nucleobases can form π-π stacking or van der Waals interactions with a graphene surface (21), such interactions are not surprising.
The average blockade magnitude for unfolded dsDNA translocations in graphene nanopores was measured as a function of nanopore diameter for a series of graphene nanopores with different diameters (Fig. 3A, solid blue circles). A steep increase in blockade magnitude with decreasing nanopore diameter is observed. This indicates a continuing increase in sensitivity to the difference between the polymer’s diameter and pore diameter as the fit between the two becomes closer. For comparison, we also measured dsDNA blockades for each of two electron beam drilled nanopores with electron microscope-determined diameters (DEM) of 7 nm and 4 nm in 30-nm-thick SiNx (Fig. 3A, black open circles). Note that because of their more evenly distributed ionic current density even when occupied by dsDNA (Fig. 3D), neither the measured (Fig. 3A, open circles) nor the numerically calculated blockades in longer pores (L = 30 nm, 10 nm, or 5 nm; Fig. 3A, solid black and solid colored lines) show very pronounced increases in sensitivity or resolution as the nanopore diameter is decreased.
Model
To understand the experimental data in Fig. 3A and ascertain whether a simple model can explain the observed results, we numerically solved the Laplace equation to determine current flow through an open graphene pore (I0) vs. the pore diameter (Fig. S1, dashed line) and through pores of the same diameters containing a dsDNA molecule through its center (depicted in Fig. 3B), to obtain the blockade magnitude, ΔIB. As fitting parameters we used DC, the ion-conducting diameter of the pore; L, the length of the nanopore [essentially the ion-insulating thickness of the graphene layer (1)]; and dpoly, the diameter of the insulating DNA molecule at the center of the pore. The best fit to the data is given by the black dashed line in Fig. 3A for which the diameter, DC, is smaller than the DEM by 0.5 ± 0.3 nm, L = 0.6 ± 0.4 nm, and dpoly = 2.1 ± 0.2 nm. The 0.5-nm correction to each nanopore diameter may account for solution ions that do not approach the hydrophobic EM-determined pore perimeter due to the energy cost of an ion shedding its hydration shell within the nanopore (22, 23) or the consequences of chemical groups bound to the graphene nanopore’s edge (22). Although we cannot rule out error in our method of calculating DEM (Materials and Methods), we note that similar considerations concerning ions approaching each of the two surfaces of the membrane may account for the value of L, 0.6 ± 0.4 nm, which agrees with our previously reported value of L = 0.6 [+0.9, −0.6] nm (1) as well as with theoretical predictions for the similar interaction distance of water on the outside of a single-walled carbon nanotube (0.31–0.34 nm) (24). Finally, we note that the best-fit 2.1 ± 0.2-nm diameter value for dpoly is the generally accepted value for the diameter of B-DNA (25).
Using the parameters given above, the modeled dependence of the blockade magnitude vs. pore diameter (Fig. 3A, dashed black curve) is seen to fit the data (Fig. 3A, solid circles) rather well and leads us to conclude that the calculation and simple model of dsDNA as a cylinder with a diameter of 2.1 nm capture the essential physics with the parameters L and DC absorbing all of the molecular interaction effects (26).
We define the nanopore’s sensitivity (S) as the change in blockade magnitude caused by a change in the effective blocking diameter of the translocating polymer,
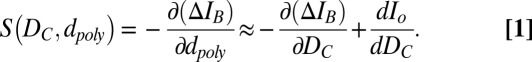 |
Eq. 1 is obtained by equating the Taylor expansions of 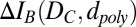 in terms of small changes in
  to those in terms of small changes in
  (SI Text, Derivation of Eq.1). S is therefore the sum of the negative slope of the dashed line in Fig. 3A and the slope of the dotted line in Fig. 1B as a function of nanopore diameter. As DEM falls below ∼3.5 nm (DC
< 2.8 nm), the value of the negative slope of the dashed line in Fig. 3A exceeds 0.3 nA/Å in our 3-M KCl medium with a bias of 160 mV. This shows that for each 0.1-Å change in the graphene nanopore diameter of these tightly fitting nanopores there is a 30-pA change in the ionic current through the DNA-filled nanopore. On the other hand, Eq. 1 shows that the sensitivity to molecule diameter change is augmented by the slope in Fig. 1B (which exceeds 0.38 nA/Å), yielding an S that exceeds 0.65 nA/Å. This shows that for each 0.1-Å change in the polymer’s diameter in a tightly fitting nanopore there would be, remarkably, a >65-pA change in the ionic current through the polymer-filled nanopore. Similar results should be obtained for ssDNA (d ∼ 1.4 nm) when similarly tight-fitting nanopores become available.
(SI Text, Derivation of Eq.1). S is therefore the sum of the negative slope of the dashed line in Fig. 3A and the slope of the dotted line in Fig. 1B as a function of nanopore diameter. As DEM falls below ∼3.5 nm (DC
< 2.8 nm), the value of the negative slope of the dashed line in Fig. 3A exceeds 0.3 nA/Å in our 3-M KCl medium with a bias of 160 mV. This shows that for each 0.1-Å change in the graphene nanopore diameter of these tightly fitting nanopores there is a 30-pA change in the ionic current through the DNA-filled nanopore. On the other hand, Eq. 1 shows that the sensitivity to molecule diameter change is augmented by the slope in Fig. 1B (which exceeds 0.38 nA/Å), yielding an S that exceeds 0.65 nA/Å. This shows that for each 0.1-Å change in the polymer’s diameter in a tightly fitting nanopore there would be, remarkably, a >65-pA change in the ionic current through the polymer-filled nanopore. Similar results should be obtained for ssDNA (d ∼ 1.4 nm) when similarly tight-fitting nanopores become available.
If a graphene nanopore is used to resolve differences in the geometrical and conductive properties of the fluid along the length of a translocating DNA molecule, one must also be concerned with how the pore’s sensitivity falls off as a function of the distance, z, from the symmetry plane of the membrane. This longitudinal sensitivity gradient (SG) (Fig. 3C) is the resolution function of the nanopore molecule system that identifies where the contributions to S come from along the molecule’s length. The nanopore sensitivity must be the integral of this sensitivity gradient. It follows that the resolution function is given by
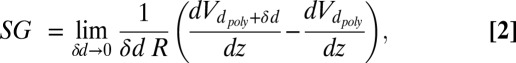 |
where R is the pore resistance when occupied by a translocating molecule, and Vd poly(z) is the electrostatic potential along the surface and length of a molecule of diameter, dpoly, as a function of distance from the pore, z. The sensitivity gradient full width at half maximum of ≤0.6 nm for the DEM = 3.2-nm pore (Fig. 3C) agrees with our prior estimate of a graphene nanopore’s resolution (1). This potential for both excellent resolution and high sensitivity is a consequence of the sharply peaked current density near the tightly fitted molecule’s surface in an atomically thin nanopore (Fig. 3B).
The high sensitivity and resolution suggest that a graphene nanopore may be an ideal sensor for nanopore sequencing because of the large absolute values of the ionic current differences that would discriminate among nucleobases along a strand of DNA. It will therefore be important to test this potential by demonstrating that the results shown here with dsDNA are in fact also found when testing ssDNA with precisely crafted graphene nanopores that closely fit the smaller 1.2- to 1.4-nm diameter of a single DNA strand. We have not yet been able to reliably produce such small pores in graphene using electron beam drilling but are optimistic that the recent proof-of-principle demonstration of an atom-by-atom method to grow graphene nanopores (9) will allow us to do so in the near future.
Reaping the benefits of graphene for achieving improved polymer characterization will also require solutions to several of the same problems that have been addressed by others, using protein nanopores (13, 27): (a) the need for a ratcheting method to control the rate of polymer translocation (28) and suppress Brownian molecular motion (15) and (b) the suppression of large 1/f ionic current noise that can severely degrade the ionic current signal-to-noise ratio. It remains to be seen whether new approaches will be required to control polymer translocation through graphene pores (29) or whether the approaches already used with biological pores (27) can also be applied to graphene pores. Likewise, further research will be required to determine how to optimally suppress the large 1/f ionic current noise frequently observed in graphene nanopores (Fig. S3). This noise can be reduced by applying various coatings (2, 3), but because any coatings will increase the length of the nanopore, they are not compatible with the high-resolution, high-sensitivity detector strategy reported here. We have consistently achieved noise reduction by simply reducing the free standing area of the graphene membrane surrounding the nanopore (Fig. S3).
The possibility of subnanometer resolution in graphene nanopores (1) together with the high resolution and geometrical sensitivity shown here bodes well for extending the molecular sensing capabilities of solid-state nanopores. In particular we envision the eventual use of graphene nanopores as a robust solid-state alternative to protein pores that have been shown capable of nanopore sequencing (13).
Materials and Methods
The graphene was grown via chemical vapor deposition (CVD) on a copper foil (30), subsequently transferred (31) over the aperture on a free-standing SiNx film covering a silicon chip, and carefully processed to remove any residual hydrocarbon impurities from the polymer support film used during the transfer process (1). Individual graphene nanopores were drilled with a well-focused electron beam, using a JEOL 2010F EM operating at 200 kV as previously described (1). Micro-Raman measurements (model WITec CRM 200) and EM imaging with atomic resolution (aberration-corrected Zeiss Libra 200, operating at 80 keV electron energies) demonstrated that the transferred graphene film was single layer and contained large areas free of hydrocarbon contaminants. The graphene on its silicon chip was sealed in a fluidic cell to separate two chambers that were subsequently filled with 3 M potassium-chloride solutions, pH 10 or pH 12.5. The graphene nanopore was the only path through which ions and DNA molecules could pass between the two chambers. Ten kilobase-pair restriction fragments of λ-DNA were used for all experiments. Applying a constant 160-mV bias voltage between the chambers with Ag/AgCl electrodes, we measured the ionic current during DNA translocation through the nanopore, using standard electrophysiological methods. All translocation experiments were investigated under the high-salt, high-pH conditions (3 M KCl, pH 10, conductivity = 27.5 S/m), which we have found suppresses dsDNA adsorption on the graphene surface.
To estimate the EM-determined diameter of a nanopore, many of which are not perfectly circular (Fig. 3A), the outline of each nanopore’s electron microscopic image was manually traced (as shown, for example, by the curvy white line in Fig. S4). The nanopore’s area was then calculated by summing the known sample areas represented by each of the pixels enclosed within the manually traced nanopore’s perimeter. Finally, DEM was equated to twice the radius of a perfect circle with that determined area (orange circle in Fig. S4). We estimate that because contrast in images of our clean, single-layer graphene is very low, the manual tracing step may have introduced as much as ±5% error in our estimate of nanopore diameter whereas equating the radius with that of a perfectly circular area could have introduced no more than an additional 5% systematic error.
Numerical solutions of the Laplace equation using the measured electrolyte conductivity (27.5 S/m) were performed using the COMSOL Multiphysics finite-element solver in 3D geometry, cylindrically symmetric along the axis of the nanopore. The total ionic current was calculated by integrating current density across the diameter of the nanopore. We also solved the full set of Poisson–Nerst–Planck (PNP) equations, with the boundary conditions at the graphene corresponding to idealized, uncharged membrane impermeable to ions. In our experimental regime with 3 M KCl concentration and 160 mV applied bias, the PNP solution was found to differ by <3% from the numerical solutions to the Laplace equation. A DNA molecule was modeled as a long stiff insulating rod threading the nanopore along its axis.
Supplementary Material
Acknowledgments
This work was funded by grants from the National Human Genome Research Institute, the National Institutes of Health (HG003703), and Oxford Nanopore Technologies Ltd. to J.A.G. and D.B. S.L. acknowledges support from the State Scholarship Fund of China.
Footnotes
Conflict of interest statement: D.B. and J.A.G. acknowledge an association with Oxford Nanopore Technologies Ltd., who provided some of the funding for the research.
This article is a PNAS Direct Submission.
This article contains supporting information online at www.pnas.org/lookup/suppl/doi:10.1073/pnas.1220012110/-/DCSupplemental.
References
- 1.Garaj S, et al. Graphene as a subnanometre trans-electrode membrane. Nature. 2010;467(7312):190–193. doi: 10.1038/nature09379. [DOI] [PMC free article] [PubMed] [Google Scholar]
- 2.Merchant CA, et al. DNA translocation through graphene nanopores. Nano Lett. 2010;10(8):2915–2921. doi: 10.1021/nl101046t. [DOI] [PubMed] [Google Scholar]
- 3.Schneider GF, et al. DNA translocation through graphene nanopores. Nano Lett. 2010;10(8):3163–3167. doi: 10.1021/nl102069z. [DOI] [PubMed] [Google Scholar]
- 4.Li J, et al. Ion-beam sculpting at nanometre length scales. Nature. 2001;412(6843):166–169. doi: 10.1038/35084037. [DOI] [PubMed] [Google Scholar]
- 5.Storm AJ, Chen JH, Ling XS, Zandbergen HW, Dekker C. Fabrication of solid-state nanopores with single-nanometre precision. Nat Mater. 2003;2(8):537–540. doi: 10.1038/nmat941. [DOI] [PubMed] [Google Scholar]
- 6.Kuan AT, Golovchenko JA. 2012. Nanometer-thin solid-state nanopores by cold ion beam sculpting. Appl Phys Lett 100:213104.
- 7.Venkatesan BM, Bashir R. Nanopore sensors for nucleic acid analysis. Nat Nanotechnol. 2011;6(10):615–624. doi: 10.1038/nnano.2011.129. [DOI] [PubMed] [Google Scholar]
- 8.Kasianowicz JJ, Brandin E, Branton D, Deamer DW. Characterization of individual polynucleotide molecules using a membrane channel. Proc Natl Acad Sci USA. 1996;93(24):13770–13773. doi: 10.1073/pnas.93.24.13770. [DOI] [PMC free article] [PubMed] [Google Scholar]
- 9.Russo CJ, Golovchenko JA. Atom-by-atom nucleation and growth of graphene nanopores. Proc Natl Acad Sci USA. 2012;109(16):5953–5957. doi: 10.1073/pnas.1119827109. [DOI] [PMC free article] [PubMed] [Google Scholar]
- 10.Hall JE. Access resistance of a small circular pore. J Gen Physiol. 1975;66(4):531–532. doi: 10.1085/jgp.66.4.531. [DOI] [PMC free article] [PubMed] [Google Scholar]
- 11.Sathe C, Zou X, Leburton J-P, Schulten K. Computational investigation of DNA detection using graphene nanopores. ACS Nano. 2011;5(11):8842–8851. doi: 10.1021/nn202989w. [DOI] [PMC free article] [PubMed] [Google Scholar]
- 12.Derrington IM, et al. Nanopore DNA sequencing with MspA. Proc Natl Acad Sci USA. 2010;107(37):16060–16065. doi: 10.1073/pnas.1001831107. [DOI] [PMC free article] [PubMed] [Google Scholar]
- 13.Manrao EA, et al. Reading DNA at single-nucleotide resolution with a mutant MspA nanopore and phi29 DNA polymerase. Nat Biotechnol. 2012;30(4):349–353. doi: 10.1038/nbt.2171. [DOI] [PMC free article] [PubMed] [Google Scholar]
- 14.Li J, Gershow M, Stein D, Brandin E, Golovchenko JA. DNA molecules and configurations in a solid-state nanopore microscope. Nat Mater. 2003;2(9):611–615. doi: 10.1038/nmat965. [DOI] [PubMed] [Google Scholar]
- 15.Lu B, Albertorio F, Hoogerheide DP, Golovchenko JA. Origins and consequences of velocity fluctuations during DNA passage through a nanopore. Biophys J. 2011;101(1):70–79. doi: 10.1016/j.bpj.2011.05.034. [DOI] [PMC free article] [PubMed] [Google Scholar]
- 16.Vlassarev DM, Golovchenko JA. Trapping DNA near a solid-state nanopore. Biophys J. 2012;103(2):352–356. doi: 10.1016/j.bpj.2012.06.008. [DOI] [PMC free article] [PubMed] [Google Scholar]
- 17.van Dorp S, Keyser UF, Dekker NH, Dekker C, Lemay SG. Origin of the electrophoretic force on DNA in solid-state nanopores. Nat Phys. 2009;5:347–351. [Google Scholar]
- 18.Fologea D, et al. Detecting single stranded DNA with a solid state nanopore. Nano Lett. 2005;5(10):1905–1909. doi: 10.1021/nl051199m. [DOI] [PMC free article] [PubMed] [Google Scholar]
- 19.Wanunu M, Sutin J, McNally B, Chow A, Meller A. DNA translocation governed by interactions with solid-state nanopores. Biophys J. 2008;95(10):4716–4725. doi: 10.1529/biophysj.108.140475. [DOI] [PMC free article] [PubMed] [Google Scholar]
- 20.Wanunu M, et al. Rapid electronic detection of probe-specific microRNAs using thin nanopore sensors. Nat Nanotechnol. 2010;5(11):807–814. doi: 10.1038/nnano.2010.202. [DOI] [PubMed] [Google Scholar]
- 21.Gowtham S, Scheicher RH, Ahuja R, Pandey R, Karna SP. Physisorption of nucleobases on graphene: Density-functional calculations. Phys Rev B. 2007;76(3):033401-1–033401-4. [Google Scholar]
- 22.Sint K, Wang B, Král P. Selective ion passage through functionalized graphene nanopores. J Am Chem Soc. 2008;130(49):16448–16449. doi: 10.1021/ja804409f. [DOI] [PubMed] [Google Scholar]
- 23.Zwolak M, Lagerqvist J, Di Ventra M. Quantized ionic conductance in nanopores. Phys Rev Lett. 2009;103(12):128102. doi: 10.1103/PhysRevLett.103.128102. [DOI] [PMC free article] [PubMed] [Google Scholar]
- 24.Alexiadis A, Kassinos S. Molecular simulation of water in carbon nanotubes. Chem Rev. 2008;108(12):5014–5034. doi: 10.1021/cr078140f. [DOI] [PubMed] [Google Scholar]
- 25.Watson JD, Crick FHC. Molecular structure of nucleic acids; a structure for deoxyribose nucleic acid. Nature. 1953;171(4356):737–738. doi: 10.1038/171737a0. [DOI] [PubMed] [Google Scholar]
- 26.Eijkel JCT, Berg AVD. Nanofluidics: What is it and what can we expect from it? Microfluid Nanofluidics. 2005;1:249–267. [Google Scholar]
- 27.Cherf GM, et al. Automated forward and reverse ratcheting of DNA in a nanopore at 5-Å precision. Nat Biotechnol. 2012;30(4):344–348. doi: 10.1038/nbt.2147. [DOI] [PMC free article] [PubMed] [Google Scholar]
- 28.Branton D, et al. The potential and challenges of nanopore sequencing. Nat Biotechnol. 2008;26(10):1146–1153. doi: 10.1038/nbt.1495. [DOI] [PMC free article] [PubMed] [Google Scholar]
- 29.Luan B, et al. Base-by-base ratcheting of single stranded DNA through a solid-state nanopore. Phys Rev Lett. 2010;104(23):238103. doi: 10.1103/PhysRevLett.104.238103. [DOI] [PMC free article] [PubMed] [Google Scholar]
- 30.Li X, et al. Large-area synthesis of high-quality and uniform graphene films on copper foils. Science. 2009;324(5932):1312–1314. doi: 10.1126/science.1171245. [DOI] [PubMed] [Google Scholar]
- 31.Lin Y-C, et al. Clean transfer of graphene for isolation and suspension. ACS Nano. 2011;5(3):2362–2368. doi: 10.1021/nn200105j. [DOI] [PubMed] [Google Scholar]
Associated Data
This section collects any data citations, data availability statements, or supplementary materials included in this article.