

Abstract
Intense femtosecond X-ray pulses produced at the Linac Coherent Light Source (LCLS) were used for simultaneous X-ray diffraction (XRD) and X-ray emission spectroscopy (XES) of microcrystals of Photosystem II (PS II) at room temperature. This method probes the overall protein structure and the electronic structure of the Mn4CaO5 cluster in the oxygen-evolving complex of PS II. XRD data are presented from both the dark state (S1) and the first illuminated state (S2) of PS II. Our simultaneous XRD/XES study shows that the PS II crystals are intact during our measurements at the LCLS, not only with respect to the structure of PS II, but also with regard to the electronic structure of the highly radiation sensitive Mn4CaO5 cluster, opening new directions for future dynamics studies.
One of the metalloenzymes most critical for sustaining aerobic life is Photosystem II (PS II), a membrane-bound protein complex found in green plants, algae, and cyanobacteria, that catayzes the light-driven water-oxidation reaction. The oxidation equivalents generated by the absorption of four photons by the PS II reaction center are stored in the four consecutive redox states of a Mn4CaO5 cluster, known as the Si (i=1 to 4) states. The accumulated energy is used in the concerted oxidation of two molecules of water to form dioxygen (1) returning the catalyst to the most reduced S0 state in the Kok cycle (Scheme 1). Due to its efficient catalysis of the demanding four-electron and four-proton chemistry of water oxidation, the Mn4CaO5 cluster has been a model system for synthesizing inorganic water oxidation catalysts (2, 3).
Scheme 1.
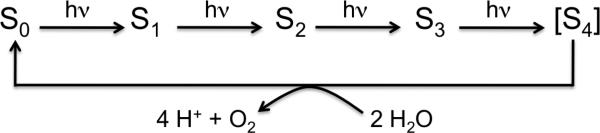
Reaction cycle of water oxidation at the Mn4CaO5 cluster in PS II.
The structure of PS II in its dark stable state (S1) was studied extensively using X-ray diffraction (XRD) measurements on cryo-cooled crystals (4-7) at synchrotron radiation (SR) sources with resolutions ranging from 3.8 to 1.9 Å resolution. One inherent limitation of XRD measurements on this system, however, is the high radiation sensitivity of the Mn4CaO5 cluster. An increase of the average metal-ligand and metal-metal distances is observed in the XRD data as compared to the Extended X-ray Absorption Fine Structure (EXAFS) data that were collected below the threshold of radiation damage (reviewed in (8)), indicating that the structure of the cluster is either altered or disrupted. Such specific damage (photoreduction of the metal center) (9,10) occurred despite the fact that all XRD measurements were carried out at cryogenic temperatures of 100 to 150 K. It is now generally recognized that for some other redox-active metalloproteins it is also difficult to obtain intact structures with SR-based XRD even at cryogenic temperatures (11, 12). Recently, a new approach to protein crystallography was demonstrated at the X-ray Free-Electron Laser (XFEL) of the Linac Coherent Light Source (LCLS) using ultra-short X-ray pulses of high intensity, enabling collection of diffraction data at room temperature (RT) before the onset of radiation damage in various systems (13-18).
Whereas XRD is powerful in determining the overall protein structure, various X-ray spectroscopy techniques can provide critical complementary information about the active site due to their element and chemical sensitivity (8, 19-22). In order to understand the intricate interplay between protein and metal cofactors that allows complex reactions, it is desirable to combine both approaches in time-resolved studies under functional conditions.
Among the various spectroscopic methods non-resonant X-ray Emission Spectroscopy (XES) probes occupied electron levels (see inset in Fig. 1). In particular the Kβ1,3 line is a probe of the number of unpaired 3d electrons, hence providing information about the oxidation and/or spin state (22). Experimentally, XES using an energy-dispersive X-ray spectrometer (23) is particularly well suited for such combined shot-by-shot studies, as excitation energies above the 1s core hole of first row transition metals are also ideal for XRD, and therefore neither incident nor emitted photon energy have to be scanned. Although it has been demonstrated that the shot-by-shot approach can probe the atomic structure of intact proteins at high-resolution (17), the question has remained whether ultra-bright fs pulses can also probe the intact electronic structure of active centers such as the Mn4CaO5 cluster. This is by no means obvious, because in contrast to XRD, where radiation induced damage leads to loss of diffractivity, such a “self-termination” of the signal is not expected in XES and electronic structural changes happen on a much faster time scale than a Coulomb explosion. Recently, we demonstrated the feasibility of room temperature fs Kβ XES using solutions of Mn model systems (24) in a liquid jet (25) at LCLS.
Fig. 1.
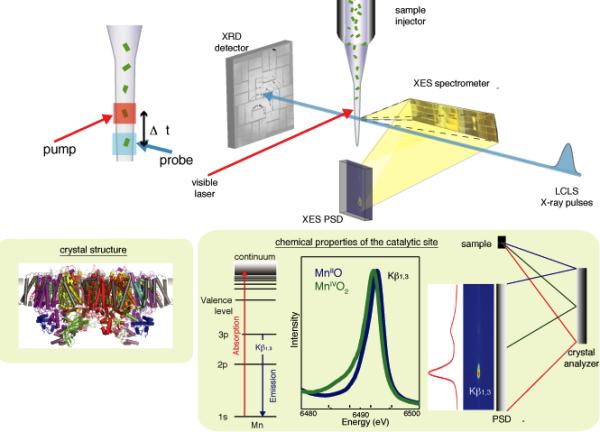
Setup of simultaneous X-ray spectroscopy and crystallography experiment at the CXI instrument of LCLS. The crystal suspension is electric-field focused into a microjet that intersects the X-ray pulses. XRD data from a single crystal are collected downstream with a CSPAD detector and XES data from the same crystal are collected at ~90° to the beam via a multi-crystal XES spectrometer and a compact position sensitive detector (PSD). A Nd-YLF laser (527 nm) is used to illuminate the crystals. The timing protocol (inset, left) consists of a fixed time of flight Δt between optical pump and X-ray probe. The schematic of the energy dispersive spectrometer, MnII and MnIV oxide Kβ1,3 spectra, and energy level diagram for XES are shown (inset, bottom right).
Building upon the feasibility of these separate fs XRD studies of PS II (18) and fs XES results, we have designed an experimental setup for simultaneous XRD and XES data collection at the LCLS. The XES was used to determine the electronic state integrity of the Mn4CaO5 cluster. Simultaneously, room temperature XRD measurements of the S2 state were collected using a visible-laser pump (centered at 527 nm) and X-ray laser probe, and compared with the XRD data from the dark S1 state. The schematic of the setup is shown in Fig. 1 (26). Suspensions of PS II microcrystals (5-15 μm in the longest dimension) were injected into the CXI (Coherent X-ray Imaging) chamber (27) at LCLS using an electrospun liquid microjet (25) to intersect the X-ray pulses (~50 fs pulse length, peak X-ray dose of ~150 Mgray/pulse). The XRD data were collected using a Cornell-SLAC Pixel Array Detector (CSPAD) (28). Mn Kβ1,3 XES data were collected simultaneously from the same sample using an energy dispersive spectrometer at ~90° to the beam direction and a small CSPAD (26).
The dark-adapted PS II microcrystals showed diffraction spots to 4.1 Å in the best cases (Fig. S1). Within 5 h of run time, corresponding to nearly 2,200,000 X-ray shots, 90,000 shots identified as potential hits (16 or more strong Bragg peaks) were collected. Out of these 4,663 were indexed and integrated (Tables S1, S2). The diffraction data were processed out to a resolution of 5.7 Å to generate the electron density map shown in Fig. 2A, B, this cutoff being chosen on the basis of the multiplicity and completeness (Tables S1, S2). However, Bragg spots out to 4.1 Å resolution were indexed, and the signal strength as measured by I/σ(I) (the ratio of the spot's peak intensity to its standard deviation) was still 1.9 out to 5 Å resolution (Table S2).
Fig. 2.

Structure deduced from diffraction of micron-sized crystals of PS II using sub 50 fs X-ray pulses at room temperature at LCLS. (A) 2mFo-DFc electron density map for the PS II complex in the dark S1 state obtained at LCLS; one monomer of the protein is shown in yellow and the electron density is contoured at 1.2 σ (blue mesh) shown for a radius of 5 Å around the protein. (B) Detail of the same map in the area of the Mn4CaO5 cluster in the dark S1 state, with mesh contoured at 1.0 σ grey) and 4.0 σ (blue). Selected residues from subunit D1 are labeled for orientation; Mn is shown as violet spheres, and Ca as an orange sphere (metal positions taken from pdb file 3bz1).
The improved resolution of the electron density compared to that reported earlier at 6.5 Å resolution (18) is manifested in a more detailed map allowing for better tracing of the transmembrane helices, and of the loop regions in the membrane extrinsic areas of the complex facing the inner compartment of the thylakoid (lumen) and the cytoplasm (stroma). There is good agreement between the 5.7 Å resolution electron density from the XFEL data (Fig. 2A) and previously-collected (6) SR data (PDB 3bz1) truncated at 5.7 Å; despite slight non-isomorphism between the XFEL and SR datasets, the maps have an overall correlation coefficient (CC) of 0.36 (a CC of 0 means no correlation, a CC of 1 full correlation.).
The influence of the phasing model on the electron density omit maps was tested by excluding heavy elements (see SM, Fig. S2). The use of random or uniform structure factors instead of the experimental data did not generate any density peaks in the omit maps in the region of the Mn4CaO5 cluster, confirming that the density observed is from the experimental data (Fig. S3). It is similar to the density obtained from the SR data but is slightly more compact (Fig. 2B).
Fig. 3A shows the Kβ1,3 X-ray emission spectra from PS II crystals collected simultaneously with the XRD data. The spectra average ~20,000 shots recorded at 7 keV incident energy that were identified as crystal hits from the XRD data. To illustrate the sensitivity of this measurement we estimated that the volume of sample probed by X-rays for this spectrum is about 0.3 nl, containing a total of 2×10⁻¹² mol Mn. A spectrum using only data from crystals that yield indexable diffraction patterns was computed as well (Fig. S4). Both spectra coincide in peak position and shape and differ only in the S/N ratio due to the different number of samples used for each of them. The spectrum of PS II crystals matches very well with the spectrum from dark-adapted PS II solution (S1 state) (8.9 mM Chl, 1 mM Mn, 375,000 individual shots) collected with the same setup at the CXI instrument (Fig. 3B). This implies that the Mn cluster is in the same high-valent state (Mn2IIIMn2IV) in both micron-sized crystals and solution, and that the crystallization procedure did not alter the native PS II S1 state.
Fig. 3.
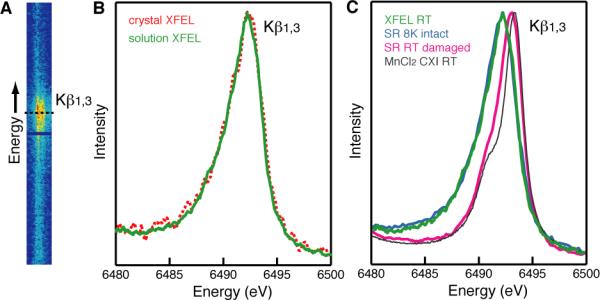
Femtosecond XES of PS II. (A) The 2D Kβ1,3 X-ray emission spectra from microcrystals of PS II collected with a position sensitive detector at the CXI instrument using sub 50 fs pulses of about 2-3×10¹¹ photons/(pulse μm2). (B) X-ray emission spectra of a solution of PS II (green) and single crystals of PS II (red dashed) in the dark state, both collected at the CXI instrument, obtained from the 2D plot in panel (A) by integration along the horizontal axis. (C) X-ray emission spectra of PS II solutions in the dark state collected at the CXI instrument at RT (green) or collected using SR under cryogenic conditions with low dose (“8K intact”, light blue) and using SR at RT under photo-reducing conditions (“RT damaged”, pink). The spectrum from MnIICl2 in aqueous solution collected at RT at the CXI instrument is shown (grey) for comparison.
The shape and the energy position of the spectra were compared with the SR solution data collected at 8 K and at RT. The RT SR spectrum represents a completely photo-reduced (damaged) PS II (Fig. 3C, pink) where all Mn is reduced to MnII and the Kβ1,3 peak is shifted toward the position found for MnIICl2 in aqueous solution (Fig. 3C, grey). The 8 K SR spectrum is from an intact PS II S1 state (Fig. 3C, light blue). It is evident that the XFEL PS II XES data at RT are identical to the intact S1 state spectrum. Note that roughly the same X-ray dose was used for the XFEL and the SR measurements at RT (total number of photons per sample spot for the SR data and the number of photons per shot for the XFEL data). The result clearly demonstrates that the fs X-ray pulses, under the conditions presented here, can be used to obtain the intact X-ray emission spectrum of the highly reduction-sensitive, damage-prone Mn4CaO5 cluster of PS II at RT. The XES data prove that the XRD data and the electron density are from PS II with a fully intact Mn4CaO5 cluster in the S1 state (Mn2IIIMn2IV) under the conditions of the current experiment.
The confirmation of an intact Mn4CaO5 cluster in PS II at RT allowed us to explore the illuminated state (S2 state) with a visible-laser pump followed by an X-ray-laser probe pulse. The crystals were illuminated in situ using the 527 nm output of a Nd:YLF laser with a delay time between optical and X-ray exposure of 0.4 to 0.5 s (26). Advancement of the PS II sample into the S2 state was tested independently with a similar illumination setup coupled to a membrane inlet mass spectrometer (MIMS) using H218O labeled water. Analysis of the labeled O2 produced as a function of the number of laser flashes showed that an S2 state population of ~80% was achieved with one flash (Fig. 4A and SM).
Fig. 4.

Characterization of the illuminated PS II sample. (A) On-line MIMS measurements of light-induced O2 yield detected as mixed labeled 16O18O species after illumination of photosystem II from T. elongatus. The data shows that >73% of the sample occupies the S2 state after one illumination. (B) XFEL XES of PS II in the S2 state. The Kβ1,3 XES data collected from 362 micro crystals of PS II in the first illuminated S2 state are shown in blue (*). The XFEL spectrum of microcrystals of PS II in the dark stable S1 state is shown as a green line. For comparison an X-ray emission spectrum of completely photo-reduced (“damaged”) PS II collected at RT at a synchrotron is shown in pink. (C) Isomorphous difference map between the XFEL-illuminated (S2 state) and the XFEL-dark (S1 state) XRD dataset in the region of the Mn4CaO5 cluster, with Fo-Fo difference contours shown at +3 σ (green) and –3 σ (red); histogram analysis indicates that this map is statistically featureless (Fig. S6). Metal ions of the Mn4CaO5 cluster are shown for orientation as violet (Mn) and orange (Ca) spheres, subunits are indicated in yellow (D1), orange (D2), pink (CP43) and green (PsbO).
Using the same illumination conditions for PS II microcrystals at the CXI instrument, about 4,300 indexed diffraction patterns were obtained within a collection time of 53 min (corresponding to ~380,000 shots). Out of these, 1,850 diffraction images were included in the data set (XFEL-illuminated) with a final resolution of 5.9 Å. The statistics for both XFEL-dark and XFEL-illuminated data sets are given in Tables S1, S2 and S3. In parallel with the XRD, XES data were also collected for these crystals. The resulting spectrum from 362 illuminated micro crystals recorded with an incident energy of 7 keV is shown in Fig. 4B (XFEL S2). Despite the lower S/N ratio of the S2 state spectrum, because of the fewer number of crystals sampled (a factor of ~50), the spectrum matches well with the X-ray emission spectrum obtained for crystals in the S1 state. Detection of the expected shift in the X-ray emission spectrum between the S1 and S2 state of (~60 meV, ref. 20) requires a much better S/N. However, it is evident, that the XFEL S2 state spectrum is different from the damaged spectrum. This clearly demonstrates that the Mn4CaO5 cluster is not photo-reduced by our optical illumination pump protocol or the X-ray pulse.
The RT electron density map of the dark state and the illuminated state are similar within the error of the resolution, with an overall CC of 0.77. An isomorphous difference map computed between the dark and illuminated data set showed no statistically significant peaks (Figs. 4C, S5, S6) and closer inspection of the region of the Mn4CaO5 cluster (Fig. 4C) and the stromal electron acceptor side of the complex (Fig. S5B) did not reveal any interpretable features in these regions. This shows that our illumination conditions do not lead to decay or changes in the crystal quality. More importantly, it suggests that there are no large structural changes taking place between the S1 and S2 states. Although the S1-S2 transition is accompanied by a number of changes in carboxylate and back bone vibration frequencies as detected by infrared spectroscopy (29, 30), the associated structural changes are most likely too small to be detected by the resolution achieved in the present study.
In summary, we have established that simultaneous XRD and XES studies using ultra-short ultra-bright X-ray pulses at LCLS can probe the intact atomic structure of PS II microcrystals, and the intact electronic structure of its Mn4CaO5 cluster at room temperature. This technique can be used for future time-resolved studies of light-driven structural changes within protein and cofactors, and of chemical dynamics at the catalytic metal center under functional conditions. We expect that this method will be applicable to many metalloenzymes, including those that are known to be very sensitive to X-ray photo-reduction and radiation damage, and over a wide range of time scales, starting with femtoseconds.
Supplementary Material
Acknowledgments
This work was supported by the Director, Office of Science, Office of Basic Energy Sciences (OBES), Division of Chemical Sciences, Geosciences, and Biosciences (CSGB) of the Department of Energy (DOE) under Contract DE-AC02-05CH11231 (J.Y. and V.K.Y.) for X-ray methodology and instrumentation, and Laboratory Directed Research and Development award to N.K.S; NIH Grants GM055302 (V.K.Y) for PS II biochemistry, structure and mechanism; GM095887 and GM102520 (N.K.S.) for data processing methods. The DFG-Cluster of Excellence “UniCat” coordinated by the Technische Universität Berlin and Sfb1078, TP A5 (A.Z.); the Alexander von Humboldt Foundation (J.K.); and the Solar Fuels Strong Research Environment (Umeå University), the Artificial Leaf Project (K&A Wallenberg Foundation), VR and Energimyndigheten (J.M.) are acknowledged for supporting this project. The injector work was supported by LCLS (M.J.B., D.W.S.), the AMOS program, CSGB Division, OBES, DOE (M.J.B) and through the SLAC Laboratory Directed Research and Development Program (M.J.B., H.L.). Experiments were carried out at the LCLS at SLAC National Accelerator Laboratory operated by Stanford University on behalf of DOE, OBES. We thank Prof. Ken Sauer for continuing scientific discussions. The atomic coordinates and structure factors have been deposited in the Protein Data Bank, www.pdb.org (PDB ID code 4IXQ (dark state, S1) and 4IXR (first illuminated state, S2)). Author contributions and full acknowledgments can be found in the SM.
Footnotes
Supplementary Materials www.sciencemag.org Materials and Methods Figs. S1-S6 Tables S1, S2, S3 Acknowledgments Author Contributions
References and Notes
- 1.Renger G. In: Photosynthesis: Plastid Biology, Energy conversion and Carbon Assimilation. Eaton-Rye JJ, Tripathy BC, Sharkey TD, editors. Springer; Dordrecht: 2012. pp. 359–414. [Google Scholar]
- 2.Kanady JS, Tsui EY, Day MW, Agapie T. Science. 2011;333:733. doi: 10.1126/science.1206036. [DOI] [PubMed] [Google Scholar]
- 3.Mukherjee S, et al. Proc. Natl. Acad. Sci. U. S. A. 2012;109:2257. doi: 10.1073/pnas.1115290109. [DOI] [PMC free article] [PubMed] [Google Scholar]
- 4.Zouni A, et al. Nature. 2001;409:739. doi: 10.1038/35055589. [DOI] [PubMed] [Google Scholar]
- 5.Ferreira KN, Iverson TM, Maghlaoui K, Barber J, Iwata S. Science. 2004;303:1831. doi: 10.1126/science.1093087. [DOI] [PubMed] [Google Scholar]
- 6.Guskov A, et al. Nature Struct. Mol. Biol. 2009;16:334. doi: 10.1038/nsmb.1559. [DOI] [PubMed] [Google Scholar]
- 7.Umena Y, Kawakami K, Shen JR, Kamiya N. Nature. 2011;473:55. doi: 10.1038/nature09913. [DOI] [PubMed] [Google Scholar]
- 8.Yano J, Yachandra VK. Inorg. Chem. 2008;47:1711. doi: 10.1021/ic7016837. [DOI] [PMC free article] [PubMed] [Google Scholar]
- 9.Yano J, et al. Proc. Natl. Acad. Sci. U.S.A. 2005;102:12047. doi: 10.1073/pnas.0505207102. [DOI] [PMC free article] [PubMed] [Google Scholar]
- 10.Grabolle M, Haumann M, Müller C, Liebisch P, Dau H. J. Biol. Chem. 2006;281:4580. doi: 10.1074/jbc.M509724200. [DOI] [PubMed] [Google Scholar]
- 11.Corbett MC, et al. Acta Cryst. D. 2007;63:951. doi: 10.1107/S0907444907035160. [DOI] [PubMed] [Google Scholar]
- 12.Meharenna YT, Doukov T, Li H, Soltis SM, Poulos TL. Biochemistry. 2010;49:2984. doi: 10.1021/bi100238r. [DOI] [PMC free article] [PubMed] [Google Scholar]
- 13.Chapman HN, et al. Nature. 2011;470:73. doi: 10.1038/nature09750. [DOI] [PMC free article] [PubMed] [Google Scholar]
- 14.Kirian RA, et al. Acta Cryst. A. 2011;67:131. doi: 10.1107/S0108767310050981. [DOI] [PMC free article] [PubMed] [Google Scholar]
- 15.Hunter MS, et al. Biophys. J. 2011;100:198. doi: 10.1016/j.bpj.2010.10.049. [DOI] [PMC free article] [PubMed] [Google Scholar]
- 16.Barty A, et al. Nature Photonics. 2012;6:35. doi: 10.1038/nphoton.2011.297. [DOI] [PMC free article] [PubMed] [Google Scholar]
- 17.Boutet S, et al. Science. 2012;337:362. [Google Scholar]
- 18.Kern J, et al. Proc. Natl. Acad. Sci. U.S.A. 2012;109:9721. [Google Scholar]
- 19.Yano J, et al. Science. 2006;314:821. doi: 10.1126/science.1128186. [DOI] [PMC free article] [PubMed] [Google Scholar]
- 20.Messinger J, et al. J. Am. Chem. Soc. 2001;123:7804. doi: 10.1021/ja004307+. [DOI] [PMC free article] [PubMed] [Google Scholar]
- 21.Pushkar Y, et al. Angew. Chem. Int. Ed. 2010;49:800. doi: 10.1002/anie.200905366. [DOI] [PMC free article] [PubMed] [Google Scholar]
- 22.Glatzel P, Bergmann U. Coord. Chem. Rev. 2005;249:65. [Google Scholar]
- 23.Alonso-Mori R, et al. Rev. Sci. Instrum. 2012;83:073114. doi: 10.1063/1.4737630. [DOI] [PMC free article] [PubMed] [Google Scholar]
- 24.Alonso-Mori R, et al. Proc. Natl. Acad. Sci. U.S.A. 2012;109:19103. [Google Scholar]
- 25.Sierra RG, et al. Acta Cryst. D. 2012;68:1584. doi: 10.1107/S0907444912038152. [DOI] [PMC free article] [PubMed] [Google Scholar]
- 26.Information on materials and methods is available in Supplementary Material on Science Online.
- 27.Boutet S, Williams GJ. New J. Phys. 2010;12:035024. [Google Scholar]
- 28.Hart P, Boutet S, Carini G, Dubrovin M, Duda B, Fritz D, Haller G, Herbst R, Herrmann S, Kenney C, Kurita N, Lemke H, Messerschmidt M, Nordby M, Pines J, Schafer D, Swift M, Weaver M, Williams G, Zhu D, Van Bakel N, Morse J. Proc. SPIE. 2012;8504:85040C–1. doi:10.1117/12.930924. [Google Scholar]
- 29.Debus RJ. Coord. Chem. Rev. 2008;252:244. doi: 10.1016/j.ccr.2007.09.022. [DOI] [PMC free article] [PubMed] [Google Scholar]
- 30.Iizasa M, Suzuki H, Noguchi T. Biochemistry. 2010;49:3074. doi: 10.1021/bi1002647. [DOI] [PubMed] [Google Scholar]
- 31.Kern J, et al. Biochim. Biophys. Acta. 2005;1706:147. doi: 10.1016/j.bbabio.2004.10.007. [DOI] [PubMed] [Google Scholar]
- 32.Porra RJ, Thompson WA, Kriedemann PE. Biochim. Biophys. Acta. 1989;975:384. [Google Scholar]
- 33.Beckmann K, Messinger J, Badger MR, Wydrzynski T, Hillier W. Photosynth. Res. 2009;102:511. doi: 10.1007/s11120-009-9474-7. [DOI] [PMC free article] [PubMed] [Google Scholar]
- 34.Siewert F, et al. Optics Express. 2012;20:4525. doi: 10.1364/OE.20.004525. [DOI] [PubMed] [Google Scholar]
- 35.Koerner LJ, et al. J. Instrum. 2009;4:P03001. [Google Scholar]
- 36.Zhang Z, Sauter NK, van den Bedem H, Snell G, Deacon AM. J. Appl. Cryst. 2006;39:112. [Google Scholar]
- 37.Sauter NK, Grosse-Kunstleve RW, Adams PD. J. Appl. Cryst. 2004;37:399. doi: 10.1107/S0021889804005874. [DOI] [PMC free article] [PubMed] [Google Scholar]
- 38.Leslie AG. Acta Cryst. D. 1999;55:1696. doi: 10.1107/s090744499900846x. [DOI] [PubMed] [Google Scholar]
- 39.Karplus PA, Diederichs K. Science. 2012;336:1030. doi: 10.1126/science.1218231. [DOI] [PMC free article] [PubMed] [Google Scholar]
- 40.Adams PD, et al. Acta Cryst. D. 2010;66:213. doi: 10.1107/S0907444909052925. [DOI] [PMC free article] [PubMed] [Google Scholar]
- 41.Meindl K, Henn J. Acta Cryst. A. 2008;64:404. doi: 10.1107/S0108767308006879. [DOI] [PubMed] [Google Scholar]
Associated Data
This section collects any data citations, data availability statements, or supplementary materials included in this article.