

Abstract
Thellungiella halophila, a close relative of Arabidopsis, is a model halophyte used to study plant salt tolerance. The proteomic/physiological/transcriptomic analyses of Thellungiella plant leaves subjected to different salinity levels, reported herein, indicate an extraordinary ability of Thellungiella to adapt to large concentrations of exogenous saline by compartmentalizing Na+ into cell vacuoles and accumulating proline and soluble sugars as organic osmolytes. Salinity stress stimulated the accumulation of starch in chloroplasts, which resulted in a greatly increased content of starch and total sugars in leaves. Comparative proteomics of Thellungiella leaves identified 209 salt-responsive proteins. Among these, the sequences of 108 proteins were strongly homologous to Arabidopsis protein sequences, and 30 had previously been identified as Thellungiella proteins. Functional classification of these proteins into 16 categories indicated that the majority are involved in carbohydrate metabolism, followed by those involved in energy production and conversion, and then those involved in the transport of inorganic ions. Pathway analysis revealed that most of the proteins are involved in starch and sucrose metabolism, carbon fixation, photosynthesis, and glycolysis. Of these processes, the most affected were starch and sucrose metabolism, which might be pivotal for salt tolerance. The gene expression patterns of the 209 salt-responsive proteins revealed through hierarchical clustering of microarray data and the expression patterns of 29 Thellungiella genes evaluated via quantitative RT-PCR were similar to those deduced via proteomic analysis, which underscored the possibility that starch and sucrose metabolism might play pivotal roles in determining the salt tolerance ability of Thellungiella. Our observations enabled us to propose a schematic representation of the systematic salt-tolerance phenotype in Thellungiella and suggested that the increased accumulation of starch, soluble sugars, and proline, as well as subcellular compartmentalization of sodium, might collectively denote important mechanisms for halophyte salt tolerance.
Increasingly, soil salinity stress poses a major threat to the productivity of major crops worldwide (1–3). Salt levels (mainly of NaCl) in excess of that required by crops often disturb plant growth and development, which are controlled by many biological processes. At the biochemical level, a large sodium concentration in plant cells causes osmotic stress, ion imbalance, oxidative damage, and nutrient deficiency (4, 5), and the plant cells must activate multiple genes to handle this life-threatening condition (6–8). Although much useful information related to salt tolerance has been accumulated from the analysis of salt-stressed glycophytes such as Arabidopsis thaliana (1, 9), the specific regulatory mechanisms that enable halophytes to survive in extremely saline habits have yet to be completely elucidated. Accordingly, many studies have used comparative proteomics and other molecular technologies to study halophytes, with the goal of identifying new salt-responsive genes (9).
Recently, Thellungiella halophila has been developed as a model halophyte for studying plant salt-tolerance mechanisms (10). Similar to Arabidopsis, Thellungiella has many advantages, such as a small genome with a high sequence homology (average 92%) to the Arabidopsis genome, a short life cycle, a large seed yield, and easy transformation by floral dipping (2, 11, 12). Its ability to adapt to high levels of salinity stress may be attributed to global changes in gene regulation at both transcriptional and proteomic levels, rather than to the acquisition of novel gene functions (13, 14). The ability of Thellungiella to withstand more severe environmental constraints than Arabidopsis might also be explained, at least in part, by more robust stress-responsive mechanisms that can alter regulatory networks at the protein level. Recently, a draft sequence of the Thellungiella genome was assembled de novo (10). Simultaneously, large amounts of full-length enriched cDNA were sequenced, and the functions of many distinct genes were determined (12, 15). These annotated sequences are essential for the ongoing analysis of the Thellungiella proteome.
Several groups have performed proteomic studies on Thellungiella under different stress conditions (9, 16–18). For example, in order to identify long-term salinity-responsive proteins in Thellungiella rosette leaves, Gao and colleagues detected ∼900 protein spots by means of two-dimensional electrophoresis (2-DE)1 and used mass spectrometry (MS) to identify 13 salt-responsive proteins (16). The same researchers used proteomic and phosphoproteomic analyses of salt-treated Thellungiella roots to detect cold-responsive proteins that are associated with chloroplast physiology (17, 18). Similarly, a comprehensive proteomic analysis that compared leaves of Thellungiella and Arabidopsis after NaCl treatment indicated that exposure to NaCl changed the expression levels of more proteins in Arabidopsis than in Thellungiella. The 32 identified proteins for which expression levels were altered in salt-stressed Thellungiella might account for the different abilities of these two closely related species to tolerate stress (9).
However, the quality of the 2-DE gels generated during those studies was somewhat poor, and consequently, the number of identified proteins was limited (9, 16–18). This technical limitation probably arose from shortcomings associated with the ability to extract proteins from halophytic plants and the absence of an efficient Coomassie Brilliant Blue staining method to visualize the gel spots. The identification of Thellungiella proteins has, until recently, also been challenged by the lack of a well-annotated genome and the scarcity of cDNA sequences. As is well known, the preparation of protein samples is an important prerequisite for 2-DE and subsequent proteomic analysis. Protein extraction from halophytes has long been problematic, owing to the large sodium content in their tissues (19). An improved borax/polyvinylpolypyrrolidone/phenol (BPP) protocol for isolating total proteins from halophytes was developed by us for the proteomic analysis of the true halophyte Salicornia europaea (19). By removing interfering compounds and salt ions (19), the BPP method enabled a comparative proteomic analysis of S. europaea grown under different levels of salinity (20). Subsequently, we further compared the technical details in Coomassie Brilliant Blue staining and developed the more sensitive protocol GAP, which uses Coomassie Brilliant Blue G-250, ammonium sulfate, and phosphoric acid (21). These technical improvements allowed us to integrate comparative proteomic, transcriptomic, and physiological analyses for Thellungiella rosette leaves exposed to different saline levels. First, we identified morphological changes induced by saline stress. Then, leaf proteins were extracted using the BPP protocol (19) and separated by means of 2-DE, with the gels stained by GAP (21). More than 2,000 well-separated spots were detected, and 209 salt-responsive proteins were identified via MS. Given our findings, we can propose a schematic of the mechanistic basis of salt tolerance in Thellungiella and suggest that the accumulation of large amounts of cellular starch and soluble sugars might be the key mechanism that confers salt tolerance on halophytes.
EXPERIMENTAL PROCEDURES
Plant Growth Conditions and Ion Treatments
Seeds from the T. halophila Shandong ecotype (Thellungiella) were sown on vermiculite moistened with distilled water and contained in plastic pots in a growth chamber with a 16-h photo-temperature period (16 h of light at 22 °C and 8 h of darkness at 18 °C), with a light intensity of 150 μE m−2 s−1 and a relative humidity of 65% ± 5%. After germination, seedlings were irrigated weekly with Hoagland's nutrient solution. Fifty days after sowing, the plants were irrigated every 3 days with half-strength nutrients that were supplemented with 0, 200, 400, or 600 mm NaCl for an additional 15 days. On the morning of the 15th day, the plants were harvested for morphological, physiological, and proteomic analyses.
Plant Fresh Weight, Dry Weight, and Total Water Content Analysis
The fresh weight (FW) of the leaves was determined immediately after sample harvesting. Dry weight (DW) was determined after the leaves had been dried for 72 h at 60 °C. The total water content (TWC) in the shoots was calculated as follows: TWC = [(FW − DW)/FW] × 100.
Quantification of Na+ and K+ Concentrations
Fresh tissues from each set of experimental plants were washed with distilled water immediately after harvest, dried in an oven at 60 °C for 72 h, and ground into fine powder using a mortar and pestle. About 300 mg of powder from each set of plants was added to 10 ml of 500 mm HNO3 and incubated at 80 °C for 1 h. After the extracts had been filtered, the contents of Na+ and K+ were assayed by means of flame emission atomic spectroscopy.
Confocal Microscopy and Scanning Electron Microscopy
In order to characterize the morphological changes in the leaves from plants subjected to saline stress, a 0.5 cm long slice from the middle part of each type of experimental leaf was fixed in 4% (v/v) glutaraldehyde and 0.1 m phosphate (pH 7.4) for 24 h at 4 °C, dehydrated in ethanol, and embedded in paraffin. The microtome sections (12-μm thickness) were stained with mercury-bromphenol blue combined with fast green to detect morphological changes and protein accumulation (22). The samples were examined using laser-scanning confocal microscopy (LSM 510 META, Zeiss, Jena, Germany) (23). To further characterize morphological changes of the leaves, SEM was performed as described elsewhere (24).
X-ray Microanalysis
X-ray microanalysis coupled with SEM was performed to characterize diffusible elements in situ (24). Leaf samples were lyophilized at −58 °C, carbon coated in a high-vacuum sputter coater, and stored in a desiccator. Samples were analyzed using a map-scan model after performing SEM with an X-650 microscope equipped with an energy-dispersive x-ray detector (EDX-9100, Hitachi, Tokyo, Japan). Counts per second (CPS) of the main elements were determined. More than three transverse sections for each treatment were observed, and five locations within the same tissue in each section were analyzed. For each micro-area, five measurements were made and replicated eight times. The final results are the averages ± standard error (S.D.).
2-DE and Gel Image Analysis
Total leaf protein was extracted using the BPP protocol (19). Protein concentration was determined using Bradford assay reagents (UV-160 spectrophotometer, Shimadzu, Kyoto, Japan) and bovine serum albumin as the protein standard. Approximately 1,000 μg of protein was loaded onto an immobilized pH gradient strip holder that contained 24-cm strips with linear gradients that ranged from pH 4 to 7 (GE Healthcare, Uppsala, Sweden). The strips were hydrated for 24 h at room temperature. The strips were then placed into an Ettan IPGphor isoelectric focusing system, and isoelectric focusing was performed following the manufacturer's instructions (GE Healthcare, Uppsala, Sweden). The proteins were separated in the second dimension as described elsewhere (20). Each 2-DE separation was repeated at least three times for each sample to ensure reproducibility of the protein patterns. Three biological replicates were performed for the salt treatment at each concentration. The gels were visualized by GAP staining (21). The analytical gels were scanned at a resolution of 600 dots per inch, and image analysis was performed with ImageMaster 2D Platinum Software (version 5.0, GE Healthcare). The apparent Mr of each visible protein was determined through comparison with protein markers with known Mr values.
Protein Identification via MALDI-TOF-MS
Proteins were identified via MALDI-TOF-MS (19, 20). First, proteins were digested in-gel with bovine trypsin (Trypsin, Roche, Catalog No. 11418025001) (20). Mass spectra were obtained using an Ultraflex II MALDI-TOF-MS instrument (Bruker Daltonics, Breman, Germany) equipped with a pulsed N2 laser (337 nm). Calibrations used standard peptides. All peptide mass fingerprint spectra were internally calibrated with trypsin autolysis peaks, and all known contaminants were excluded during this process. The measured tryptic peptide masses were transferred to MS BioTools (Bruker Daltonics) and used for a MASCOT (version 2.2) search of the taxonomy of Viridiplantae (Green Plants, including 1,033,388 sequences) in the nonredundant NCBI (NCBInr) database (version NCBInr 20120303). The peptide mass fingerprinting searched parameters were as follows: 300 ppm tolerance, MH+ monoisotopic mass values, oxidation of methionine allowed, one missed cleavage allowed, and fixed modification of cysteine by carboxymethyl (carbamidomethylation, C). Good matches were classified as those having a Mascot score > 72. False identifications were avoided by maintaining an uppermost stringent threshold of 80 in this research. A protein was considered to be identified only when its Mascot score was greater than 80, maximum peptide coverage was obtained, and additional experimental confirmation of the protein spots on the 2-DE gels was verified. To minimize false positives, an in-house BLAST search at NCBI was performed to confirm all matches.
Protein Function Classification and Hierarchical Cluster Analysis
The sequences of the identified proteins were searched against the UniProt database in order to identify their functions. These identified proteins were then divided into groups using the Functional Catalogue. Next, the subcellular locations of the proteins were determined using TargetP. Self-organizing tree algorithm hierarchical clustering of the expression profiles was performed using Cluster (version 3.0). The data entered for preprocessing were the induction factors, which were calculated by dividing the percent volume of each spot after salt treatment by the percent volume of the same spot after the control treatment.
Microarray, Gene Ontology, and KEGG Pathway Analysis
Full-length cDNA microarray analysis was carried out as described elsewhere (25, 26). Total RNA prepared via the modified cetyltrimethylammonium bromide method (27) was analyzed using an Arabidopsis (V4, 4 × 44K) Expression Microarray (Catalog No. G2519F-021169) of 43,803 probes for Arabidopsis genes and/or transcripts. The mRNA from leaves of Thellungiella plants treated with 0, 200, 400, or 600 mm NaCl was used to prepare Cy3-labeled and Cy5-labeled cDNA probes, which were mixed in equal amounts and hybridized to the microarray cDNA. Gene-clustering analysis was performed with Cluster software (version 3.0). Then, gene ontology (GO) analysis was performed with Blast2GO (28), using the GO annotation search tool and the data from the NCBI and TAIR databases. Finally, we performed KEGG pathway analysis on the differentially expressed genes (more than 2.0-fold difference in expression) and proteins (more than 1.5-fold difference in expression).
Semi-quantitative Reverse-transcription PCR and Quantitative RT-PCR
Total RNA was used to generate cDNA using Reverse Transcriptase kit reagents (TaKaRa, Tokyo, Japan). The primer pairs used for both semi-quantitative RT-PCR (RT-PCR) and quantitative RT-PCR (qRT-PCR) are provided in supplemental Data S9. Both RT-PCR and qRT-PCR were repeated at least three times. For qRT-PCR, 1 μg of RNA was used for reverse transcription. The cDNA samples were diluted to 5 to 8 ng/μl. Triplicate quantitative assays were performed by adding 5 μl of each cDNA dilution with the SYBR Green PCR Master mix (TaKaRa) and an Mx3005P sequence detection system according to the manufacturer's instructions. A gene fragment encoding T. halophila actin was used as the internal control to normalize the amount of template cDNA (supplemental Data S9).
Determination of the Chlorophyll, Proline, Starch, and Soluble Sugar Levels; Cellular Osmolarity; and Subcellular Location of Sodium
The chlorophyll content was measured spectrophotometrically as described elsewhere (29, 30). The absorbance of extracted chlorophyll a was detected at 645 nm, and that of extracted chlorophyll b at 663 nm. Total chlorophyll levels were calculated as described elsewhere (29). The proline content was measured as described elsewhere (2, 31) and calculated using commercially available standard dilutions of l-proline (Sigma-Aldrich). Starch was extracted and quantified as described elsewhere (32). Total soluble sugar from the leaves (∼200 mg) was extracted in boiling water for 30 min, and the sugar levels were determined using the anthrone reagent with glucose as a standard. The absorbance was read at 630 nm, and the sugar concentration was determined using a glucose standard curve (33). The osmolarity of the cell sap from the NaCl-treated leaves was measured using an osmometer (29). The subcellular location of sodium was determined via x-ray microanalysis transmission electron microscopy (TEM) in conjunction with an EDAX-910 energy-dispersive x-ray analyzer (34). The counting time for all analyses was 60 s. The data were expressed as CPS for each element peak after background subtraction. Analyses were performed for the cell wall, cytoplasm, and vacuoles from leaf mesophyll cells of plants treated with 0 or 400 mm NaCl for 15 days. For each micro-area, five measurements were made and replicated ten times. The results are presented as averages ± S.D.
Statistical Analysis
For all generated data, at least three biological replicates were performed for each saline treatment. Then, statistical analyses, one-way analysis of variance, and Duncan's multiple range tests were performed at a 5% significance level using SPSS software (version 13.0). The statistical results are reported as means ± S.D.
RESULTS
Morphological Adaptations of Thellungiella Leaf to NaCl
Thellungiella can withstand exposure to NaCl at concentrations greater than 500 mm (2, 11). Our results demonstrate that although salt treatment greatly reduced its growth, the plant was able to survive at 600 mm NaCl (Fig. 1A). Salt treatment substantially changed the morphological patterns of Thellungiella leaves (Fig. 1) and suppressed leaf development in a concentration-dependent manner (Fig. 1A). After NaCl treatment, the number of rosette leaves (Fig. 1A) and the diameters of leaf crowns (Figs. 1B and 1G) were significantly decreased. Confocal microscopy indicated that NaCl treatment caused the leaves to become much thinner and accumulate proteins, especially in leaf mesophyll cells (Figs. 1C–1E, 1H–1J). Similar changes were found using SEM (Figs. 1F and 1K), which confirms that high salinity disturbed the formation and development of Thellungiella leaves.
Fig. 1.
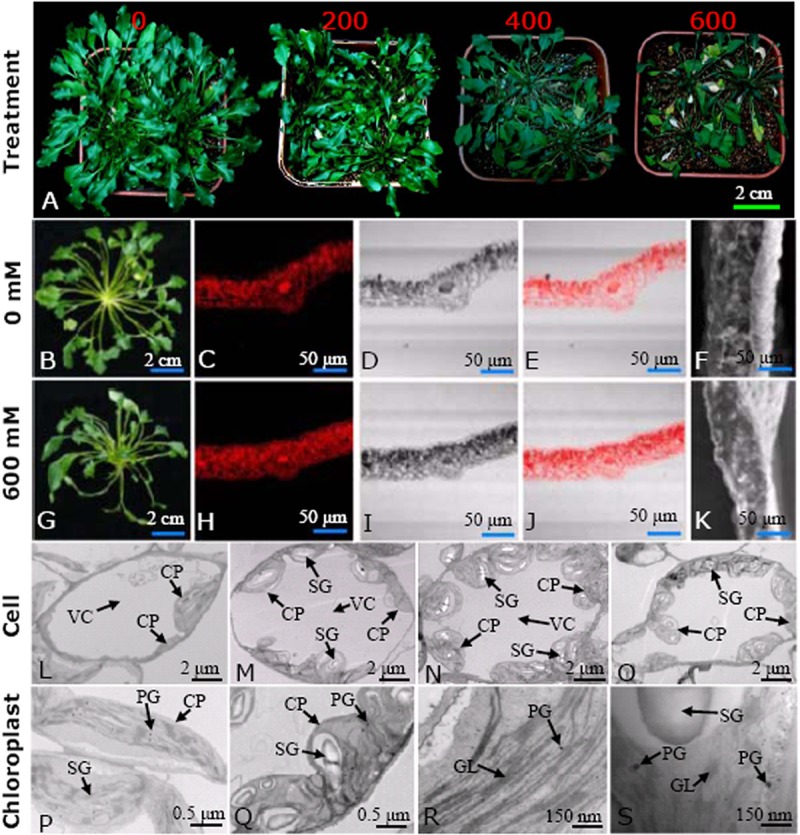
Morphological change of Thellungiella leaves under different salinity levels. The plants were irrigated with half-strength Hoagland nutrient solutions containing 0, 200, 400, and 600 mm NaCl for 15 days (A). Typical whole plants (B and G); the middle parts of mature leaves stained with mercury-bromphenol blue and viewed with a laser scanning confocal microscope (C–E and H–J), or their cross-sections observed via SEM (F and K), from the 0 and 600 mm NaCl treated plants. Typical cells from the 0 (L), 200 (M), 400 (N), and 600 (O) mm NaCl treated leaves are presented. The typical ultrastructural patterns of both chloroplasts (P and Q) and their grana lamella (R and S) from 0 and 600 mm NaCl treated plants are highlighted. CP, chloroplast; GL, grana lamella; PG, plastoglobuli; SG, starch granule; VC, vacuole.
Ultrastructural changes were also evident in TEM images, indicating that NaCl treatment substantially affected the shapes of many organelles and promoted both chloroplast generation and the accumulation of starch granules in leaf mesophyll cells (Figs. 1L–1S). Cells from control plants were typically elliptical and contained a few chloroplasts (Fig. 1L). Treatment with either 200 (Fig. 1M) or 400 mm (Fig. 1N) NaCl caused the cells to expand and become more rounded, and many of the chloroplasts accumulated more starch granules. When the exogenous NaCl concentration was 600 mm, the cells became much smaller (Fig. 1O). Distended thylakoids and some deviant vesicles in the chloroplast stroma were observed (Figs. 1P–1S). In many cases, the disorganization of thylakoid membranes was accompanied by the disruption of grana stacking. The chloroplast envelope was also disrupted in some places (Figs. 1P–1S). Moreover, the plasma membrane had begun to detach from the cell wall and electron-dense materials accumulated in cells treated with 600 mm NaCl. The cytoplasm appeared electron-opaque, whereas the control showed the normal ultrastructure (Figs. 1L–1S). We counted the number of chloroplasts in typical mesophyll chlorenchyma cells and found 7 ± 2, 12 ± 3, 14 ± 2, and 12 ± 3 chloroplasts in cells of plants treated with 0, 200, 400, and 600 mm NaCl, respectively. Correspondingly, the number of starch grains in a chloroplast of a typical leaf mesophyll cell was 15 ± 4, 23 ± 4, 32 ± 5, and 27 ± 4 (Figs. 1L–1S). These results indicated that the ability of Thellungiella to accumulate more chloroplasts and starch grains than most glycophytes might provide Thellungiella with a greater supply of energy, allowing it to resist the damaging effects of high salinity.
Physiological Responses of Thellungiella Leaf to NaCl
Treatment with NaCl increases the accumulation of Na+ in the cytoplasm, which results in Na+ toxicity (35, 36). High salinity can significantly disturb the development of Thellungiella, partly because photosynthesis is retarded (2, 32). Our morphological observations revealed that high saline levels changed the shapes of mesophyll chloroplasts and their grana (Figs. 1L–1S). Correspondingly, the element compositions (Fig. 2) and many physiological patterns (Fig. 3) were changed in Thellungiella leaves exposed to NaCl.
Fig. 2.

Changed patterns for different elements (A and B), ions content (C), fresh weight (D), and water content (E) under different salinity levels. A, typical freeze-substituted cross-sections and the typical element spectra of SEM-x-ray microanalysis from leaves of Thellungiella challenged with 0 (left) and 600 (right) mm NaCl; the positions of Na, Cl, and K in energy spectra are highlighted by arrows of different colors. The statistical results also are presented (supplemental Data S1). The relative contents of O, Na, Cl, K, and Ca in different leaves are shown (B). The Na+ and K+ contents were determined by means of flame emission, and the results are provided (C). After NaCl treatments, the shoot fresh weight and water content were decreased significantly (D).
Fig. 3.

Comparison of the changed patterns of chlorophyll (A), proline (B), starch (C), soluble sugar (D), cell sap osmolarity (E), and relative sodium content (F) in different subcellular sites in leaves of different NaCl-treated Thellungiella. At first, the contents of total chlorophylls (Chl total), chlorophyll a (Chl a), and chlorophyll b (Chl b) were determined, and the changed patterns were demonstrated (A). Then the contents of free proline (B), starch (C), and soluble sugars (D) in the leaves were determined. The osmolarity of cell sap was detected, and its value was found to have increased dramatically with increased NaCl concentration (E). The subcellular location of sodium ions was determined via TEM combined with x-ray, and the results demonstrated that sodium was compartmentalized predominantly in the cell vacuole (F).
Firstly, we determined the chlorophyll content in mature leaves of Thellungiella plants subjected to different levels of salinity stress. Our results revealed that although moderate salinity (200 mm NaCl) somewhat increased the chlorophyll content (mostly likely that of chlorophyll a), NaCl treatment in general led to an obvious decrease in chlorophyll abundance (Fig. 3A). The effects of 600 mm NaCl on chlorophyll levels were more variable than those caused by 400 mm NaCl (Fig. 3A). Leaves contained less chlorophyll b than chlorophyll a. The observation that the levels of chlorophyll b were not significantly changed even under extreme salinity (Fig. 3A) suggests that salt stress affects chlorophyll accumulation predominantly by reducing the level of chlorophyll a.
Morphological analyses also demonstrated that the increased starch accumulation in chloroplasts is important for the salt tolerance of Thellungiella (Figs. 1L–1S). Therefore, we determined the contents of starch (Fig. 3C) and total soluble sugars (Fig. 3D) and found that exposure to salinity increased the levels of both. The starch content in the untreated plants was very small (∼1.2%), but it increased after exposure to NaCl. The largest starch content (1.84%) was found in plants exposed to 400 mm NaCl (Fig. 3C). Accordingly, the level of total soluble sugars increased continuously with a similar trend during increased salinity and finally reached an amount as large as 9.23 ± 0.98 mg/g in leaves of plants treated with 600 mm NaCl (Fig. 3D). These results are consistent with reports that salinity stress increases starch hydrolysis, thus increasing the accumulation of sucrose and total sugars in cells (2, 26, 35).
Salt stress often leads to osmotic imbalance in the cytoplasm (2), and the accumulation of compatible osmolytes, including soluble sugars, proline, and polyols, can improve osmotic stress tolerance in both glycophytes and halophytes (2, 10, 31). As a prominent osmolyte, proline can accumulate to substantial levels in plant cells to protect proteins against denaturation and to scavenge reactive oxygen species (ROS) that accumulate after exposure to high levels of saline (2, 31, 32). Our results revealed that the proline content increased dramatically when the NaCl concentration increased from 200 to 600 mm. The largest proline content (138.9 ± 11.3 μmol/g FW) was observed in plants treated with 600 mm NaCl (Fig. 3B). We also measured the osmolarity of the cell sap from mature leaves of Thellungiella plants treated with the different NaCl concentrations and found that osmolarity was altered similarly to the proline content. Osmolarities in untreated plants were as small as 110 mOsmol/kg. Challenge with 200, 400, or 600 mm NaCl dramatically increased the osmolarity to 286, 397, and 406 mOsmol/kg, respectively (Fig. 3E).
Comparison of Changed Patterns for Different Ions and the Subcellular Location of Sodium under Saline Conditions
A combination of x-ray microanalysis and SEM was used to study the in situ distributions of elements (mainly O, Na, Mg, P, S, Cl, K, and Ca) at the cellular level of Thellungiella leaves. Transverse sections of leaves from plants treated with 0 and 600 mm NaCl are shown enclosed in rectangles in the insets of Fig. 2A (left and right panels, respectively). The relative weight values of the main elements are presented in Figs. 2A and 2B and in supplemental Data S1.
For control plants, the relative weight values for Na and Cl were very small, but they were large for K. However, upon exposure to saline, the levels of Na and Cl increased substantially, whereas that of K decreased substantially (Fig. 2B; supplemental Data S1). Among all the samples examined, the greatest relative weight values for Na and Cl were observed in the plants treated with 600 mm NaCl, followed by those treated with 400 mm NaCl. The highest level of K was observed in the untreated plants (Fig. 2B). Changes in the levels of Na+ and K+ determined using flame emission atomic spectroscopy were similar to those determined via x-ray microanalysis (Figs. 2B and 2C). In the leaves of control plants, the Na+ content was 9 ± 1.8 mg/g DW, and the K+ content was 35 ± 3.2 mg/g DW. After treatment with 400 mm NaCl, the Na+ content in the leaves increased substantially to 33 ± 5.6 mg/g DW. With the 600 mm NaCl treatment, the Na+ content decreased to some extent but was still relatively large (Fig. 2C). Unlike the Na+ content, the K+ content decreased significantly after exposure to saline (Fig. 2C). With increasing accumulation of Na+, the shoot FW and water content significantly decreased (Fig. 2D). These results revealed that with increased salinity, the accumulation of Na+ increased and finally delayed leaf development in Thellungiella.
For many halophytes, the controlled uptake of NaCl and the use of external Na+ and Cl− for osmotic adjustment without the consequences of ion toxicity have been considered critical salt-tolerance mechanisms. This kind of cellular osmotic adjustment also provides a smaller cellular osmotic potential under the hypertonic conditions of salt stress (35, 36). Therefore, subcellular location and sodium compartmentalization have been considered as pivotal mechanisms needed for plant salt tolerance. In Arabidopsis, Na+ is mainly compartmentalized in the vacuole by transport proteins (36). Our aforementioned results revealed that NaCl treatment dramatically increased Na+ levels in the mature Thellungiella leaf tissues (Fig. 2C). We further determined the subcellular location of sodium by combining energy-dispersive x-ray microanalysis with TEM. The detected Na content was about 8 CPS in all the examined subcellular tissues of the control. However, after treatment with 400 mm NaCl, these values increased to 18 ± 2, 33 ± 4, and 52 ± 3 CPS in the cell wall, cytoplasm, and vacuole, respectively (Fig. 3F), indicating that the sodium ions had been compartmentalized predominantly within the vacuoles of Thellungiella leaf cells. These results are inconsistent with many reports on sodium ion subcellular compartmentalization in both halophytes (37, 38) and glycophytes (39). Ion accumulation in the vacuole excludes sodium from the cytosol and facilitates water uptake, allowing the plants to use sodium as an osmoticum (39, 40). Intracellular compartmentalization of Na+ and Cl− within vacuoles is also considered to have a decisive effect on plant salt tolerance, as the process reduces cytosolic ion levels and facilitates the osmotic adjustment required for cell expansion and the maintenance of cell turgor (8, 38, 41).
Determination of Salt-responsive Protein Spots via 2-DE
To analyze the salt-response mechanism of Thellungiella at protein level, we performed comparative proteomics in the mature leaves of Thellungiella treated with 0, 200, 400, or 600 mm NaCl. Proteins were extracted using the BPP protocol (19), separated via 2-DE, and visualized in the gels by means of GAP staining (21).
More than 2,000 protein spots were detected with good reproducibility in the 2-DE gels, with representative gels presented in Fig. 4. The numbers of highly reproducible protein spots were determined to be 2,098 ± 65, 2,032 ± 80, 2,099 ± 66, and 2,113 ± 91 in the leaves of plants treated with 0, 200, 400, and 600 mm NaCl, respectively (Fig. 4; supplemental Data S2). Only protein spots with good reproducibility and for which the fold-change in intensity was >1.5 for at least one treatment relative to its control value were further characterized. Relative to the control intensities, 265 protein spots (about 12.6% of all of the protein spots) were found to have an intensity change of >1.5-fold (Fig. 4; Table I; supplemental Data S3). The changes in intensities for the proteins from plants treated with different concentrations of NaCl demonstrated that most of these proteins were significantly up-regulated until the plants were exposed to 600 mm NaCl, whereupon the expression of most of them decreased dramatically (Fig. 4; Table I; supplemental Data S3). Most of the salt-responsive proteins changed in abundance, rather than in terms of their in-gel position or their absence/presence in the 2-DE gels (Fig. 4; Table I; supplemental Data S2).
Fig. 4.

Typical 2-DE profiles of proteins extracted from Thellungiella leaves treated with different concentrations of NaCl. Total proteins were separated via 2-DE and stained with GAP. The 2-DE protein profiles of samples from leaves treated with 0, 200, 400, and 600 mm NaCl for 15 days are presented (supplemental Data S2), and the identified differentially expressed proteins are marked with numbers on the 2-DE gels of the 0 (A) and 600 (B) mm NaCl treated plants. The molecular weight (Mr) in kilodaltons and pI of proteins are indicated on the right and top of gel A, respectively. About 1000 μg proteins were loaded per pH 4–7 gel. Arrows indicate the 209 positively identified different proteins.
Table I. Proteins identified via MS from leaves of different NaCl-treated T. halophila.
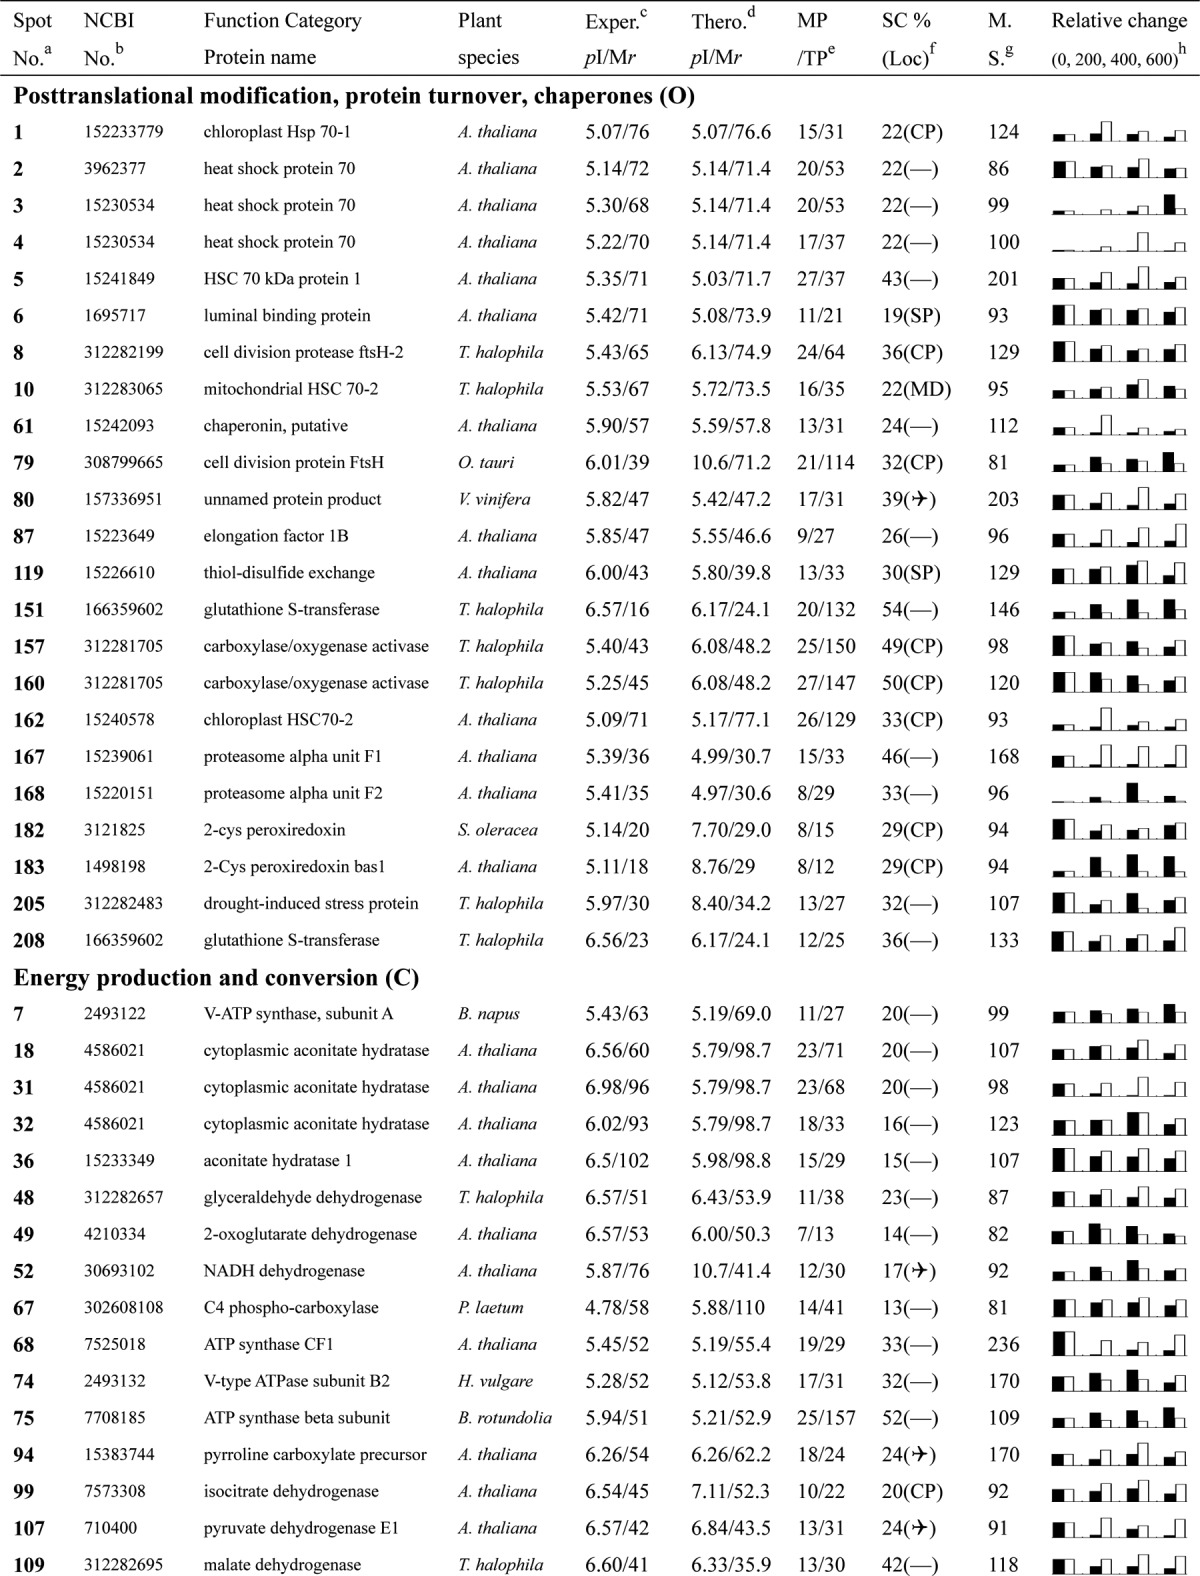
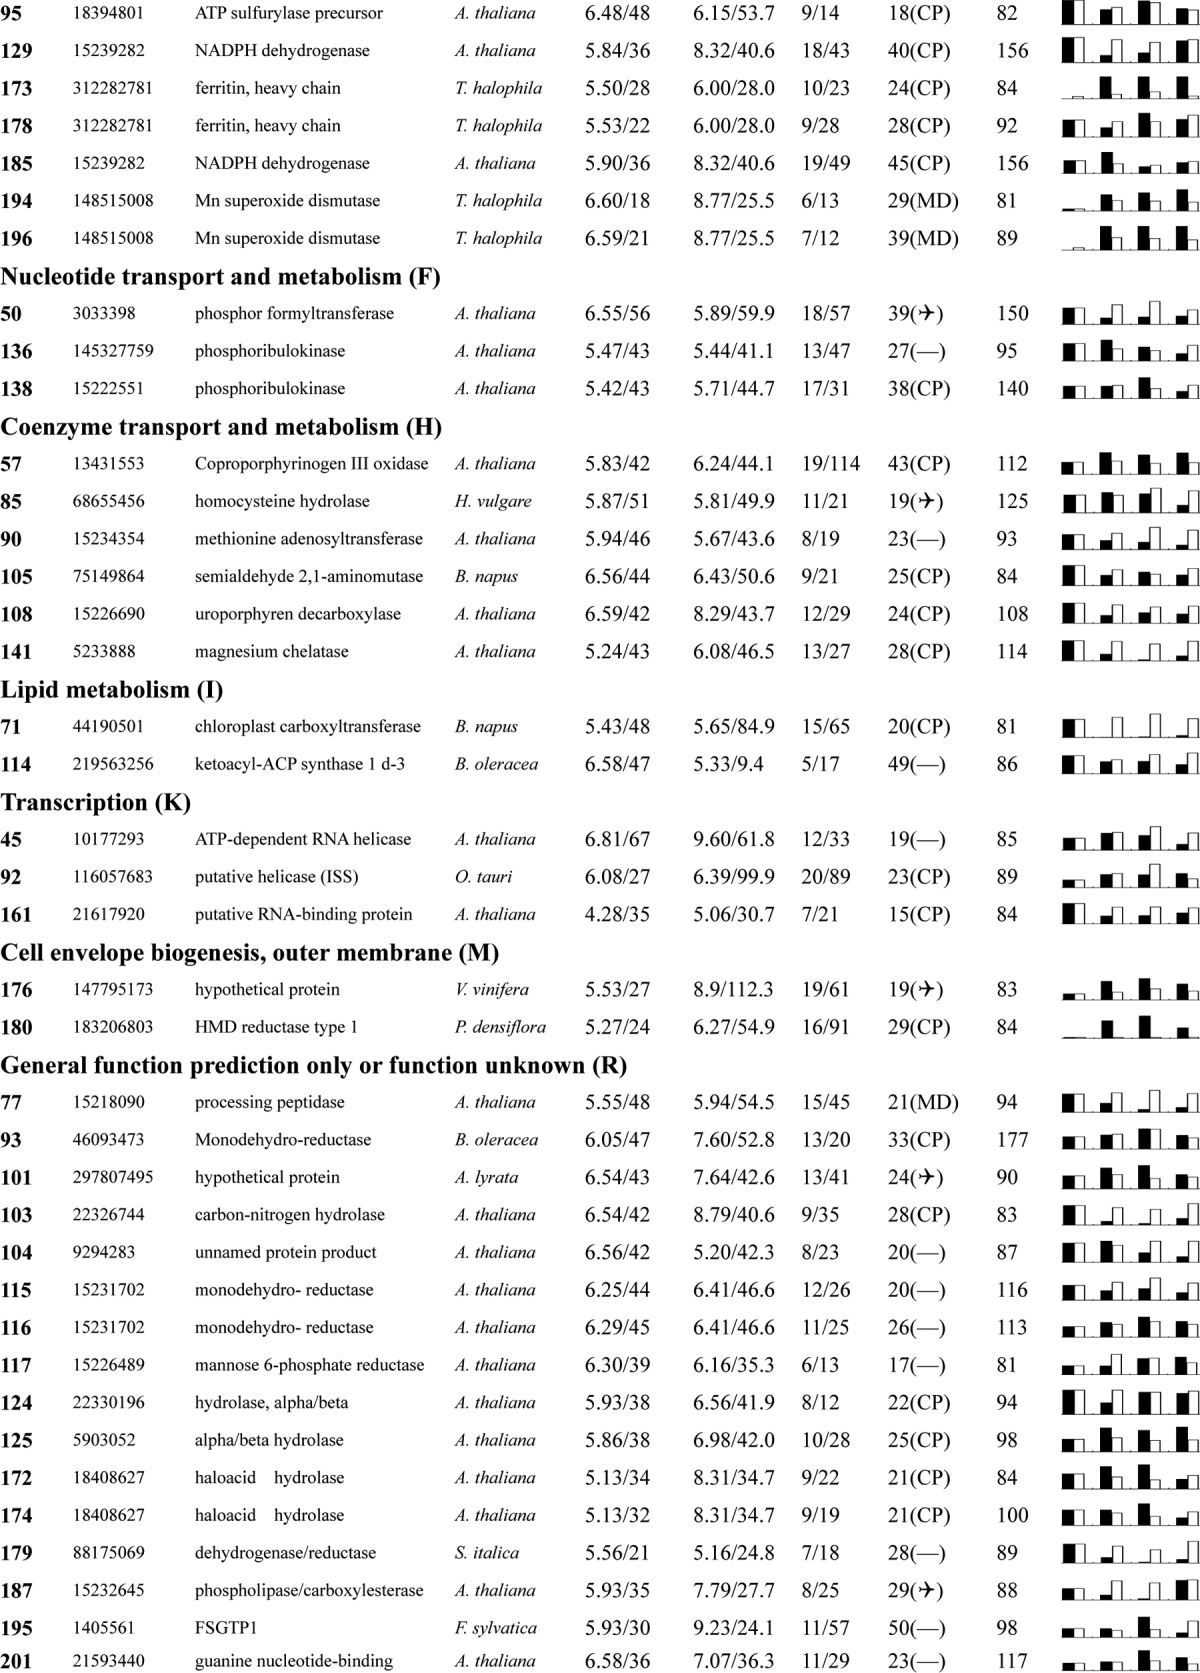
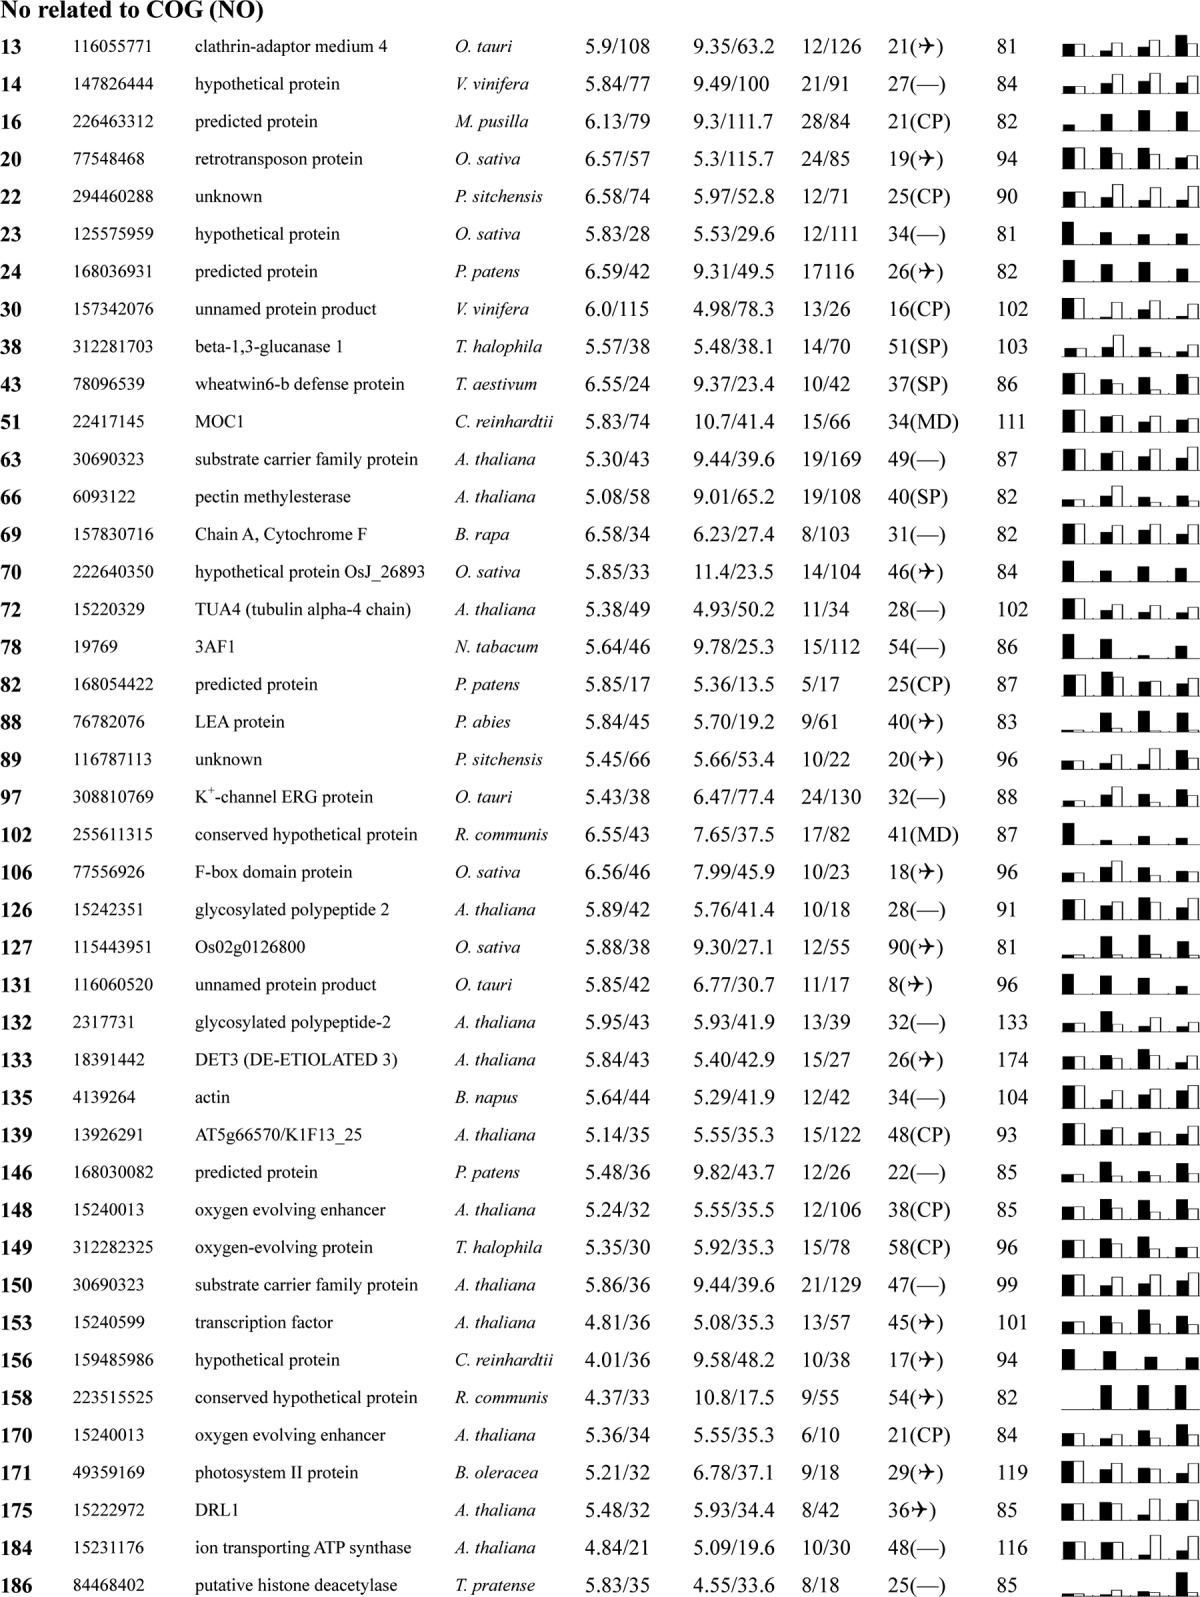
a Assigned spot number as indicated in Fig. 4.
b Database accession numbers according to NCBInr.
c Experimental mass (kDa) and pI of identified proteins were retrieved from the protein database. Experimental values were produced by ImageMaster.
d Theoretical mass (kDa) and pI of identified proteins were retrieved from the protein database.
e Number of the matched peptides (MP) with peptide mass fingerprinting and the total searched peptides (TP).
f The amino acid sequence coverage (SC) for the identified proteins and the protein location (Loc) predicted by TargetP.
g The Mascot searched score (M.S.) against NCBInr.
h Mean values of relative protein amounts on 2-DE gels (black bars) and mRNA changed patterns (white bars) in microarrays from the 0, 200, 400, and 600 mm NaCl treatments.
Identification and Bioinformatic Analysis of Salt-responsive Proteins in Thellungiella Leaves Subjected to Different Levels of Saline
Of the 265 differentially expressed proteins found in the gels, 209 were positively identified via MALDI-TOF-MS. Among these 209, for 153 we were able to assign functions (Table I; supplemental Data S3 and S4), and the other 56 were identified as hypothetical proteins or proteins with an unknown function. Among these identified proteins, 30 were from Thellungiella, and 25 were unnamed proteins in Thellungiella (Table I; supplemental Data S3). However, after a search using the in-house BLAST alignments with proteins listed in the UniProt database, functions were found for the 25 proteins (supplemental Data S3 and S8). The inability to originally identify the functions of the 25 proteins in Thellungiella might be attributed to a failure to adequately annotate most of the DNA sequences in the recently completed draft of the Thellungiella genome sequence (10). Therefore, we annotated these 25 proteins, and their identities are presented in detail (Table I; supplemental Data S3 and S8).
The ratios for the theoretical and experimental relative molecular masses (Mr) and the theoretical and experimental isoelectric point (pI) values for the differentially expressed proteins were determined so that we could evaluate the quality of the MS-mediated identities. These ratios are presented as radar axis parameters (the Mr ratio for the radial value and the pI ratio for the annular value) in the radial chart of Fig. 5A. When the radial and annular values for the ratios of the Mr values and the pI values are exactly 1.0 (i.e. the calculated/theoretical and experimental values for each parameter are the same), the radial value and the annular value for the protein are located on cyclical line 1.0 in the radial chart. The closer a spot is to line 1.0, the greater the certainty that the identification made by means of MS/database searching will be the MS identification obtained. More than 95% of the Mr and pI ratios for the identified proteins intersect close to cyclical line 1.0, indicating the high quality of the MS data (Fig. 5A).
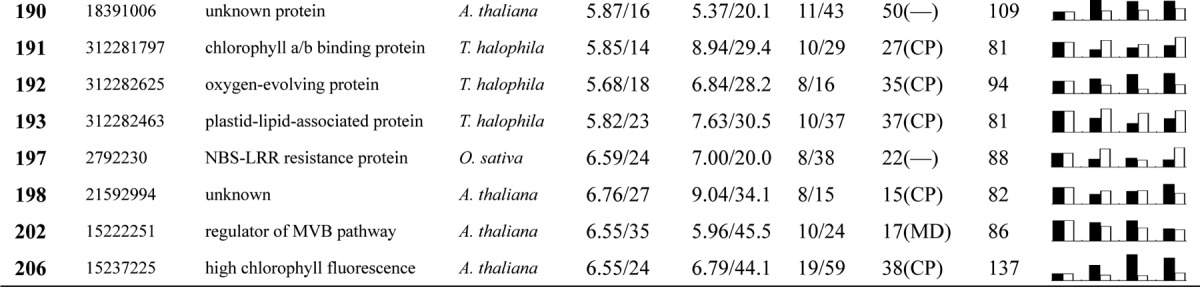
Fig. 5.
Classification and functional analysis of the 209 identified differentially expressed proteins. To evaluate the quality of identified proteins, the theoretical and experimental ratios of Mr and pI were presented in radial charts as radial and annular radar axis labels, respectively (A). Then, each of the identified proteins was functionally classified following COG (B). The proportion of each functional category was the sum of the proportion of all identities. The subcellular locations of the 209 identified proteins were obtained via TargetP (C). Of them, 30.6% were predicted to localize in chloroplast (CP), 4.9% in the secretory pathway, and 4.3% in mitochondria (MP); 17.7% were unknown proteins (Q). The largest part, including 89 proteins, was designated as “any other location.” The distributions of the identified proteins in different plant species also are presented (D).
The relative expression levels for the 209 identified proteins are listed in Table I. These proteins were classified into 16 groups based on their main cellular functions (Table I; supplemental Data S3; Fig. 5) as defined by the COG (cluster of orthologous groups of proteins) Functional Catalogue. Among the 153 proteins for which a function was assigned, the largest group (15.3% of the all identified proteins) was involved in carbohydrate transport and metabolism, followed by proteins involved in energy production and conversion (11.5%) and chaperones related to post-translational modification (11.0%); a substantial portion of the proteins participated in amino acid metabolism (8.6%) or the transport of inorganic ions (4.8%). Notably, 50 proteins among all these identified proteins could not be classified, and 16 proteins in the 153 function-assigned proteins were classified as predicted proteins by COG (Table I; Fig. 5B; supplemental Data S3). This indicates that the detailed functions of many salt-responsive proteins from Thellungiella have yet to be elucidated.
The subcellular locations of the identified 209 proteins were determined using TargetP. Among them, 89 proteins (42.6%) were predicated as “any other location” proteins. A large portion (37 proteins) were termed un-located proteins. The predominant proportion of proteins were designated as “don't know location” or “any other location” proteins. The COG analysis revealed 64 chloroplast-located proteins (30.6%) with amino acid sequences that contained chloroplast transit peptides, 10 secretory pathway proteins with signal peptides, and 9 mitochondrial proteins (Table I; Fig. 5C; supplemental Data S3). These results revealed that a large number of chloroplast proteins are likely to contribute to the salt tolerance of Thellungiella.
The sequence homologies of these identified proteins to those of proteins from other plant species were also determined. The majority of the identified proteins (108; ∼50%) showed strong sequence homology to Arabidopsis proteins, followed by 30 Thellungiella proteins, and then 14 Brassica proteins. Altogether, 152 proteins (72.7%) had homologues in members of the Cruciferae (Table I; Fig. 5D; supplemental Data S3). These results provide strong evidences that Thellungiella has a very close relationship with Arabidopsis, which is reflected in the strong sequence homologies of proteins from both species.
Pathway Analysis of Salt-responsive Proteins Using GO and KEGG
GO analysis was conducted in order to obtain deeper insights into the biological processes in which the differentially expressed proteins (more than 1.5-fold changes in expression after exposure to NaCl; p < 0.05) were involved. The results were visualized using Blast2GO for functional analysis in plant genomics (28). These proteins were then analyzed by performing KEGG pathway analysis, and their molecular interaction and reaction networks were determined.
Substantially overrepresented GO categories were carbon fixation and photosynthesis, starch and sucrose metabolism, nitrogen metabolism, glycolysis, and carbohydrate metabolism. It is noteworthy that most of enzymes involved in these pathways were considerably up-regulated by saline treatment (Table I; supplemental Data S5 and S6). Among them, the most important pathway is starch and sucrose metabolism, which contains 10 identified enzymes including pectinesterase (EC 3.1.1.11, Spot 66), uridylyltransferase (EC 2.7.7.9), glucan endo-1,3-β-d-glucosidase (EC 3.2.1.39/58), cellulose synthase (EC 2.4.1.12, S132 and S126), glucose-1-phosphate adenylyltransferase (EC 2.7.7.27), cellulase (EC 3.2.1.4), phosphorylase (EC 2.4.1.1), 4-α-glucanotransferase (EC 2.4.1.25), and phosphoglucomutase (EC 5.4.2.2) (Table I; supplemental Data S5 and S6). These enzymes mediate the entry of carbon from starch and sucrose into cellular metabolism.
Other important pathways are those that involve carbon fixation and photosynthesis, for which 10 enzymes were identified from 25 differentially sized protein spots. These enzymes are fructose-bisphosphate aldolase (EC 4.1.2.13), sedoheptulose bisphosphatase (EC 3.1.3.37), fructose bisphosphatase (EC 3.1.3.11), glyceraldehyde-3-phosphate dehydrogenase (EC 1.2.1.13), ribulose-phosphate 3-epimerase (EC 5.1.3.1), phosphoenolpyruvate carboxylase (EC 4.1.1.31), phosphoribulokinase (EC 2.7.1.19), ribulose-bisphosphate carboxylase (EC 4.1.1.39), alanine transaminase (EC 2.6.1.2), and malate dehydrogenase (EC 1.1.1.37) (Table I; supplemental Data S5 and S6). Five enzymes belonging to the porphyrin and chlorophyll metabolism pathway, which are key enzymes for photosynthesis in green plants, were identified. They are uroporphyrinogen decarboxylase (EC 4.1.1.37), ferroxidase (EC 1.16.3.1), coproporphyrinogen oxidase (EC 1.3.3.3), glutamate-1-semialdehyde 2,1-aminomutase (EC 5.4.3.8), and magnesium chelatase (EC 6.6.1.1).
Another important set of identified GO pathways are those involved in glycolysis and the tricarboxylic acid (TCA) cycle. This set includes eight enzymes: phosphoglucomutase (Spots 58 and 59), fructose-bisphosphate aldolase (Spots 39 and 113), fructose-bisphosphatase (Spots 64 and 143), glyceraldehyde-3-phosphate dehydrogenase (Spots 11, 48, and 111), phosphopyruvate hydratase/enolase (Spot 83), aldehyde dehydrogenase (Spot 94), pyruvate dehydrogenase (Spot 107), and dihydrolipoyl dehydrogenase (Spot 49). These are considered to play important roles in glycolysis and gluconeogenesis. The five identified enzymes that participate in the TCA cycle, which were found as 10 spots, are pyruvate dehydrogenase (EC 1.2.4.1), isocitrate dehydrogenase (EC 1.1.1.42), dihydrolipoyl dehydrogenase (EC 1.8.1.4), malate dehydrogenase (EC 1.1.1.37), and aconitate hydratase (EC 4.2.1.3).
Salt treatment also affected nitrogen assimilation and fixation. Seven enzymes were identified in this research that are related to nitrogen metabolism and play important roles in nitrogen fixation in chloroplasts. These enzymes include ferredoxin-nitrate reductase (EC 1.7.7.1/2), glutamate dehydrogenase (EC 1.4.1.2/3), glutamate-ammonia ligase (EC 6.3.1.2), and nitrilase (EC 3.5.5.1). Additionally, 10 enzymes involved in arginine and proline metabolism were identified. They include glutamine synthetase, argininosuccinate synthase, aminoacylase, glutamate dehydrogenase, glutamate 5-kinase, glutamate-5-semialdehyde dehydrogenase, Δ1-pyrroline-5-carboxylate dehydrogenase (P5CD), aldehyde dehydrogenase, and glutamate dehydrogenase. Exposure to NaCl increased the levels of aminoacylase (Spot 91), glutamate dehydrogenase (Spot 112), and P5CD (Spot 94) (Table I; supplemental Data S5 and S6). Proline accumulation might, therefore, play an important role in the extreme salt tolerance of Thellungiella.
Comparison of Salt-induced Expression Patterns for Proteins and Genes Using cDNA Microarray, RT-PCR, and qRT-PCR
Global expression profiles of genes from the leaves of Thellungiella plants treated with 0, 200, 400, or 600 mm NaCl were determined using a commercially available Arabidopsis (V4, 4 × 44K) Expression Microarray (Catalog No. G2519F-021169) GeneChip with 43,803 probes. The Arabidopsis full-length cDNA microarray was used, because the probes can hybridize the mRNA from Thellungiella more efficiently than the probes in an Arabidopsis oligonucleotide microarray. Typical global gene expression profiles and the main results are presented in Figs. 6A–6C. Altogether, ∼43% of the transcripts on the GeneChip hybridized to cDNA generated from the Thellungiella mRNA. In general, the abundances of 5,619 transcripts changed more than 2-fold in response to at least one NaCl treatment relative to those of the untreated plants. Venn diagram analysis revealed significant changes in the abundances of 2,814, 3,340, and 1,401 proteins after treatment with 200, 400, or 600 mm NaCl for 15 days when their levels were compared with those in the leaves of untreated plants. Of these genes, 488 showed altered expression following all salt treatments. There were 1,553, 1,994, and 576 salt-responsive genes that showed altered expression in response to the 200, 400, and 600 mm NaCl treatments, respectively (Fig. 6B; supplemental Data S7). The gene expression patterns following exposure to different saline treatments were divided into 12 self-organizing map clusters (Fig. 6C). In clusters I, IV, and VII, most of the genes were down-regulated following NaCl treatment, whereas most of the genes in clusters II, III, V, VIII, and XI were up-regulated by NaCl. Some genes in clusters VI, X, XI, and XII were significantly induced following exposure to 200 or 400 mm NaCl, whereas their expressions were obviously repressed when 600 mm NaCl was supplied (Fig. 6C).
Fig. 6.

Comparison of the expression patterns of the 209 identified salt-responsive proteins and their genes. A, a typical area on the GeneChip hybridized to the Thellungiella mRNA using a full-length cDNA microarray of Arabidopsis (V4, 4 × 44K). B, Venn diagram illustrating the overlap of the salt-responsive genes in the 200, 400, and 600 mm NaCl treated Thellungiella leaves relative to the control. The total number of transcripts for each treatment is indicated in parentheses. C, the representative gene expression patterns of the 12 SOM clusters. D, hierarchical clustering of different expression profiles for the 209 identified proteins (right) and their corresponding genes (left) under 0, 200, 400, and 600 mm NaCl treatments. The four columns represent different salt treatments, and the rows represent the individual proteins or genes. The up- or down-regulation is indicated in red or green, respectively. The intensity of the colors increases with the increasing expression difference, as shown by the bar at the bottom. Of these proteins, the expression patterns of 12 representative proteins (in red) corresponding to the 12 SOM clusters and their gene expressions (green) on the cDNA microarray are highlighted (E).
Our interest in conducting this research focused on revealing the correlation between protein and mRNA expression upon exposure to NaCl. Therefore, we further analyzed the gene expression patterns of the identified 209 salt-responsive proteins and classified their corresponding genes into clusters (Fig. 6D). A general trend for the entire group of proteins was that increased protein levels were usually associated with increased levels of the encoding mRNA. After NaCl treatment, about half of these proteins were up-regulated, and expressions of their genes were also induced to some extent by saline. Similarly, reduced abundances of other proteins triggered by NaCl were to some extent accompanied by reduced abundances of their cognate transcripts (Fig. 6D). The abundances of 12 proteins that represent the 12 clusters (I through XII) and the abundances of the cognate transcripts are highlighted in Fig. 6E. A close correlation between the abundances of most salt-responsive proteins and the abundances of their transcripts suggests that most gene regulation in NaCl-treated Thellungiella leaves occurs at the level of transcription. Salt-induced changes in the abundances of certain proteins were very different from the changes in levels of their cognate transcripts (Fig. 6D; supplemental Data S8), indicating the importance of post-transcriptional modifications in controlling the final functions of these genes.
To further evaluate the correlation between the abundances of proteins and their cognate transcripts, 26 salt-responsive Thellungiella proteins were selected for RT-PCR and qRT-PCR in order to assess the expression of the genes that encode these proteins. The results demonstrated that patterns of changes in the abundances of proteins and genes were similar in general (Fig. 7). Analysis via RT-PCR indicated that NaCl obviously increased the abundances of 17 of the 26 Thellungiella transcripts, whereas NaCl reduced the abundances of 4 of the transcripts. Levels of the five other transcripts did not change significantly after salt stress, or the changes did not mirror changes in the levels of their proteins (Fig. 7A). Changes in the abundances of both proteins (Table I; Fig. 7B, black rectangles) and mRNAs (Fig. 7B, white rectangles) are highlighted. The results demonstrate that most of the gene products analyzed showed similar change patterns at both the protein and the mRNA level (Fig. 7B). In contrast to RT-PCR, qRT-PCR is an exact quantitative method, in particular for certain genes with low levels of expression. Analysis of the levels of expression of the 26 salt-responsive genes via qRT-PCR showed that NaCl significantly increased the levels of 19 transcripts, although the levels of other transcripts were reduced to some extent after exposure to levels as high as 600 mm NaCl. Only three genes were always down-regulated by saline (Fig. 7C).
Fig. 7.

Determination of gene and protein expression at different levels of salinity using RT-PCR, qRT-PCR, 2-DE, and microarray for the 26 salt-responsive proteins identified from Thellungiella. In order to evaluate the correlation expression of proteins and their genes after exposure to NaCl, the 26 identified Thellungiella proteins were examined via microarry, RT-PCR, and qRT-PCR. The typical RT-PCR results are presented; actin was used as a reference (A). The changed patterns for 25 out of the 26 samples (excluding Spot 29) at both the protein level (black bars) and the mRNA level (white bars) obtained from cDNA microarry analysis are highlighted (B). The relative expressions of these genes were further estimated by means of semiquantitative RT-PCR using actin RNA as an internal control (C). For each treatment, the expression of each gene is presented as the ratio of the value for the gene to the value of the corresponding actin RNA. Error bars represent the S.D. of three independent PCR reactions.
These results indicate that most of the genes that encode salt-responsive proteins were also induced by salinity. Overall, the changes in gene expressions observed using RT-PCR and qRT-PCR were similar. The trends seen in the changes in protein abundances using 2-DE and the changes in transcript abundances observed using cDNA microarray were also similar. However, the microarray results differed somewhat from those of RT-PCR and qRT-PCR for several genes (e.g. S8, S192, and S205) (Fig. 7). Therefore, we selected qRT-PCR as the preferred technique for gene expression, followed by RT-PCR, and then cDNA microarray.
Given our results and those found in the literature, we propose a hypothetical schematic for the systematic salt-tolerance mechanisms involved in different Thellungiella cellular compartments at both cellular and subcellular levels after exposure of the plant to high levels of saline (Fig. 8).
Fig. 8.

Schematic representation of salt tolerance mechanism in halophyte Thellungiella. By combining the present knowledge of plant salt tolerance mechanisms and the observations from this research, a possible schematic representation of the mechanism associated with the extreme salt tolerance of Thellungiella was created. This schematic diagram was developed from a recently published model for S. europaea (20). At the whole-plant level, NaCl resulted in the retardation of plant development and some changed shapes of cells and organelles such as chloroplasts. After salt accumulation, increased sodium and decreased potassium concentrations were observed. More starch grains and soluble sugars, as well as proline, accumulated abundantly in the cells, resulting in improved cell sap osmolarity in the salt-treated plants. Sodium was mainly compartmentalized in the vacuole. These salt responses led to the up-regulation of many salt-responsive proteins and genes in the leaf cells of salt-treated plants. The up- and down-regulated enzymes (marked with EC numbers) and genes are indicated in red and blue, respectively. The numbers presented in pink are enzymes with expression levels that were significant at only the protein level or the gene level. Of paramount importance were those mechanisms that function to regulate ion homeostasis through the SOS pathway, which controls sodium ion accumulation and the intracellular compartmentalization of sodium, based on our comparative proteomic and transcriptomic analysis. Consequently, many enzymes in the pathways involved in starch and sucrose metabolism, photosynthesis, carbon fixation, glycolysis, the TCA cycle, and proline metabolism were up-regulated obviously by high salinity at both gene and protein levels, which resulted in substantial improvement of the energy production system in both the chloroplast and the cytosol after salt accumulation. This systematic salt tolerance mechanism at both cellular and subcellular levels in Thellungiella also might be important for other plants exposed to high salinity.
DISCUSSION
Increased Accumulation of Chloroplast and Starch in Leaf Mesophyll Cells Might Constitute a New Mechanism Whereby Thellungiella Adapts to Salinity Stress
Large salt concentrations often inhibit plant growth and development, particularly in crops (2). Many plants use changes in ion homeostasis, osmotic adjustment, injury avoidance, and growth adjustment to cope with salinity stress (2, 6). The halophyte Thellungiella displays an extraordinary capability to activate all four response mechanisms (2). Unlike some true halophytes, Thellungiella develops neither salt glands nor other complex morphological alterations to adapt to high salt concentrations (11, 29). It appears that the remarkable salt tolerance of Thellungiella can be attributed largely to basic biochemical and physiological mechanisms. Although Thellungiella can withstand dramatic salinity shock upon exposure to 500 mm NaCl (2, 3, 11), such high levels of salinity significantly retard growth and decrease photosynthesis (2, 3, 31). Our results also demonstrate that the growth of Thellungiella was substantially inhibited by an additional supply of NaCl (Fig. 1A), which decreased both plant FW and shoot water content in a concentration-dependent manner (Fig. 2D). Accordingly, levels of chlorophylls (particularly those of chlorophyll a) increased to some extent under conditions of moderate salinity and then decreased with increased levels of salinity (Fig. 3A), consistent with observations that in cotton the chlorophyll content initially increased and then decreased remarkably with prolonged treatment of saline, and that the rate of photosynthesis increased shortly after the imposition of salt stress (42). This might be a salt-adaptation mechanism to salt stress incorporating enhanced photosynthetic electron transport in salinity-acclimated plants. It was suggested that the loss of chlorophyll could be a marker of the cellular component of high-salt stress (30), indicating that leaf cells of Thellungiella were stressed when the plants were grown upon salinity. Our results (Fig. 3A) confirmed a previous report that, unlike in Arabidopsis, levels of chlorophylls in Thellungiella leaves are marginally affected by salinity (3). The same study found a large increase in electron flow involving photosystem II (3), which indicated that Thellungiella, but not Arabidopsis, could induce an alternative pathway that uses electron transport through photosystem II to protect leaves during salt stress. Our proteomic results indicate that 30.6% of the proteins induced by salt stress were localized in chloroplasts (Fig. 5C). This suggests that chloroplast proteins play a pivotal role in the salt response in Thellungiella.
Salt treatment significantly increased the number of chloroplasts and improved the accumulation of starch grains in the chloroplasts of Thellungiella leaf mesophyll cells (Figs. 1L–1Q). As the most important organelle for photosynthesis, the chloroplast is the most prone to harm by abiotic stresses, such as salt and cold (17). Large concentrations of NaCl can directly inhibit photosynthesis by destroying the chloroplast organization of plastidic components. When such inhibition occurs, plants are liable to suffer from oxidative stress, which eventually activates ROS-scavenging systems (3). Because ROS have the ability to cause widespread damage to cell membranes and protein structures, chloroplasts activate numerous enzymatic processes to scavenge ROS in order to prevent such damage. The production of antioxidants by these processes is energetically demanding. Our data also demonstrated that exposure to NaCl could improve chloroplast abundance (Figs. 1L–1O) and increase chlorophyll content under moderate salinity (Fig. 3A), which might be an important alternative mechanism that confers salt tolerance on Thellungiella. It is tempting to speculate that at least some of the proteins (Table I) and genes (supplemental Data S7) involved in carbohydrate metabolism or energy production that were up-regulated supported the stress-induced increase in chloroplast abundance.
High salinity also triggered the substantial accumulation of starch grains in chloroplasts (Figs. 1L–1S). Nitrogen assimilation requires large amounts of organic acids obtained from photosynthesis to incorporate inorganic nitrogen into amino acids. It was reported that increased starch accumulation and decreased levels of nitrogenous metabolites were found after supplying Thellungiella with lower levels of nitrogen (32). In many model plants, overall carbon metabolism and the levels of sucrose and starch are severely affected by salt stress (43), which probably results from a metabolic shift toward sucrose production that occurs because starch synthesis and degradation are more affected than sucrose synthesis. Many proteins related to starch metabolism, such as starch synthase (9, 15, 25), starch branching enzyme, and β-amylase (15), as well as their cognate genes, are considered to play important positive roles in the response of Thellungiella leaves to salt stress. Our aforementioned results demonstrate that the increased accumulation of chloroplasts and starch might be a hitherto unreported mechanism that Thellungiella uses to adapt to salinity stress.
Increased Accumulation of Osmolytes and Compartmentalization of Sodium into Vacuoles Play Important Roles in Thellungiella Salt Tolerance
The earliest effect of high salt concentrations on plants, which is increased difficulty of maintaining a gradient of water flow from the soil into root cells, can directly result in osmotic stress (31). Increased osmotic stress causes many compatible metabolites (e.g. polyols, glycine betaine, amino acids, and sugars) to accumulate to substantial levels in plant cells to control the major fluxes of carbon and nitrogen during saline exposure (2, 10, 35). Proline is an important osmolyte that might also play other, non-exclusive roles to possibly limit or repair damage caused by water stress (2, 14). In some glycophytes (e.g. Arabidopsis), the level of free proline is too low to adjust osmolarity (13). Conversely, we observed that the osmolarity of the Thellungiella cell sap increased dramatically with increases in NaCl concentration (Fig. 3E). Accordingly, levels of free proline plateaued at a somewhat low level and then increased dramatically with increasing salt concentration, eventually reaching a concentration of 138.9 μmol/g FW after exposure to 600 mm NaCl (Fig. 3B). These results are consistent with reports that Thellungiella can accumulate high levels of proline to prevent water loss from the cytosol under high-salinity conditions (2, 13, 14, 31). Recently, it was reported that a lipid-signaling pathway plays a pivotal role in regulating proline metabolism in Arabidopsis and that this pathway is also very important for the high salt tolerance of Thellungiella (13, 14). It was reported that proline accumulation in Thellungiella under salt or hyperosmotic stress is modulated differently by phospholipase C and phospholipase D (PLD), with phospholipase C negatively controlling proline accumulation and phospholipase D exerting a positive pattern under severe stress (14).
Soluble sugar is another important osmolyte that accumulates in plants under salt stress. It has been proposed that soluble sugar plays important roles in integrating environmental signals (5). Sugar accumulation can be enhanced by nitrogen deficiency and exposure to high-intensity light, which induces ozone uptake (44). These roles are performed by soluble sugars as osmolytes to protect specific macromolecules or to contribute to the stabilization of membrane structures. Sugars may protect cells during desiccation and can interact with the polar head groups of phospholipids in membranes to prevent membrane fusion (35, 44). In Setaria sphacelata, a naturally adapted C4 grass, greater amounts of soluble sugars and smaller amounts of starch were found under long-term water deficit stress than under normal conditions (43). It has been reported that transgenic cotton plants that express a Thellungiella gene that encodes vacuolar H+-PPase are much more resistant to NaCl than wild-type plants, and that this difference can probably be attributed to the increased accumulation of soluble sugars in leaf tissues following exposure to salinity stress (42). It was reported that total sugars, in particular glucose, fructose, mannitol, and several amino acids, accumulated to very high levels in Thellungiella plants exposed to salt (43). Our results also demonstrate that salt-treated Thellungiella plants contained high levels of soluble sugars, with 9.23 mg/g of total soluble sugars present in fresh leaf tissues of Thellungiella treated with 600 mm NaCl (Fig. 3D). This observation is consistent with those of others that high levels of soluble sugars are found in the leaves of Thellungiella after salt exposure (2, 8, 11, 43). Several genes related to sugar conversion have been analyzed, and the levels of expression of genes that encode sucrose synthase and sucrose phosphate synthase were observed to be up-regulated after salt treatment (35, 44). Recent analyses of expressed sequence tags from two salt-stressed Thellungiella ecotypes identified genes related to sugar synthesis, sugar transport, and glycine betaine synthesis (31, 45). Our proteomic and transcriptomic analysis of leaves from salt-stressed Thellungiella plants showed that many proteins (Table I; supplemental Data S3–S5) and genes (supplemental Data S7) were up-regulated. These proteins or genes are involved in several sugar metabolism pathways (supplemental Data S6). Most of these salt-responsive proteins displayed similar changes in patterns of gene expression (25, 26).
Similarly, saline disrupted the ionic homeostasis associated with the increasing accumulation of cellular Na+ (31). This toxic ion adversely affects cell membrane integrity, enzyme activities, and photosynthetic apparatus (6, 46). Plants have evolved several mechanisms to prevent cytoplasmic Na+ accumulation by minimizing Na+ influx, ensuring intracellular compartmentalization of Na+ into vacuoles, and maximizing Na+ efflux and recirculating Na+ from the shoot via the phloem (39). Vacuolar compartmentalization of Na+ decreases the cell water potential, thereby sustaining water absorption from the soil (39, 40). In Thellungiella, we observed that Na+ was compartmentalized predominantly in the vacuoles of leaf cells (Fig. 3F), which is in line with observations reported for another halophyte, Suaeda salsa, from a study using x-ray analysis (34). This sodium-compartmentalization mechanism might play an important role in regulating ion homeostasis in Thellungiella under high salinity.
Many Proteins and Genes Involved in Several Pathways Play Pivotal Roles in Systematic Networks Involved in Halophyte Salt Tolerance
Plant responses to salinity stress are considered to be a complex set of traits involved in morphological, physiological, developmental, and cellular processes (7, 40). These processes are well controlled by many salt-responsive genes and enzymes that can link to the different cross-talk pathways (6, 8, 47). Many enzymes are effectors of salt stress tolerance. Recently, progress has been made in understanding how plants signal salt stress through the identification of several cation transporters that maintain ion homeostasis in salt-treated plants. Transmission of the stress signal involves transient increases in cytosolic Ca2+ that trigger down-stream pathways by interacting with different sensors (37). The plasma-membrane-bound sodium-proton antiporter salt overly sensitive 1 (SOS1) and a vacuolar-membrane-bound Na+/H+ antiporter 1 (Nhx1), which is needed to activate H+-ATPase to provide energy, were identified in Arabidopsis over a decade ago (6, 8, 39). In the SOS pathway, binding of Ca2+ to the calcineurin-like protein SOS3 promotes its association with the protein kinase SOS2, which regulates the imbalance of ion homeostasis in the cells and produces abundant amounts of cytosolic ROS (6, 20, 37). Our comparative proteomic data also revealed that the levels of expression of different subunits of the vacuolar-type proton ATPase (Spot 7, gi 2493122; Spot 74, gi 2493132; Spot 201, gi 20340245) were significantly up-regulated by saline treatment (Table I; supplemental Data S3). Vacuolar ATPase transports H+ from the cytoplasm into the vacuole through the vacuolar membrane by hydrolyzing ATP to ADP. The proton and electronic gradient generated across the tonoplast provides sufficient energy to promote the accumulation of H+, which provides amounts of exchangers for Na+, thereby activating the Na+/H+ antiporter (Fig. 8). At the same time, the beta subunit of ATP synthase (Spot 75, gi 7708185; Spot 165, gi 7525040) was up-regulated to generate more ATP for use by vacuolar ATPase, also enhancing the Na+/H+ antiporter activity (Fig. 8). It is noteworthy that our proteomic analysis revealed that the increased accumulation of Na+ significantly altered the patterns of expression of some ion-transport enzymes, such as ferredoxin-nitrate reductase (EC 1.16.3.1, Spots 35, 54, and 55), ferritin (Spots 173 and 178), ATP sulfurylase adenylyltransferase (EC 2.7.7.4, Spot 95), NADPH dehydrogenase (EC 1.6.99.1, Spots 129 and 185), and Mn superoxide dismutase (Spots 194 and 195), which stimulates calcium-mediated signal transduction to activate the SOS and ROS pathways to maintain ion homeostasis upon high salinity (Fig. 8). In the SOS pathway, the enhanced expression of SOS2 improves Nhx1 activity (6, 8, 37, 39), which helps to pump more Na+ ions from the cytoplasm into cell vacuoles through the tonoplast and results in the compartmentalization of Na+ ions into the vacuoles (Fig. 8).
Unlike halophilic bacteria and fungi (7) or animal cells (41), which have developed to contain highly modified proteins, with many enzymes showing an absolute requirement for relatively high extracellular salt concentrations, the plant cytosolic enzymes are generally considered to be sodium sensitive (7, 41, 47). Prompted by the enigma that enzymes from halophytes are inhibited substantially by ionic concentrations well below those commonly considered to be found within the tissue, these enzymes were considered to be neither remarkably salt resistant nor salt dependent (7). But this does not exclude the possibility that individual enzymes or certain metabolic pathways in halophytes have evolved to function in the presence of high sodium concentrations (2). Unfortunately, very little attention has been devoted to the elucidation of such a mechanism. In fact, many enzymes in halophytes have reduced salt sensitivity (48). In particular, halophytes are more effective at regulating Na+ transport than glycophytes, and certain true halophytes demonstrate optimal growth upon exposure to NaCl (41, 46). Furthermore, it has been reported that the structure of some enzymes is altered to provide unequivocal tolerance to large Na+ concentrations, and that some enzymes might have evolved to depend on large Na+ concentrations for activity (46, 48).
For Thellungiella, intrinsically cellular-based mechanisms, as well as whole-plant coordination, are a requisite for the systematic tolerance of large salt concentrations. This schematic diagram was developed to account for our recently published results obtained using the halophyte S. europaea (20) and has been modified to accommodate the data obtained for this report (Fig. 8). First, a high-saline environment causes a water deficit (Fig. 2D) and increases the Na+ concentration in the plants (Figs. 2B and 2C), which subsequently results in an ion imbalance throughout the plant and requires that both the water deficit and the accumulation of Na+ be alleviated in order to ensure the survival and development of the plant (38, 49). An initial need is to evacuate Na+ ions from the cytosol via efflux to the vacuole and the apoplast (38, 49). In Thellungiella, the H+ pumps in the plasma membrane and tonoplast are activated to transport Na+ ions across the membranes and compartmentalize them into the vacuoles (Fig. 8). Many ion transporters, such as the Na+/H+ antiporter SOS1, and a Ca2+-mediated sensor are also activated (Fig. 8). At the whole-plant level, shoot development and plant growth are obviously retarded under high salinity (Figs. 1A and 2D). Sodium influx across the plasma membrane, which results in a larger concentration of cytosolic sodium ions (Fig. 8), thus leads to many anti-salt responses in the cell (38, 46). Of paramount importance are those mechanisms that function to regulate ion homeostasis through ion accumulation and intracellular compartmentalization, which can be activated by genes involved in the SOS pathway (6). Our research verifies the role of a sodium subcellular compartmentalization mechanism in Thellungiella leaves (Fig. 8) by demonstrating, using a combination of TEM and x-ray microanalysis, that Na+ ions are effectively compartmentalized in the cell vacuole in mesophyll leaf tissues (Fig. 3F).
Notably, a large concentration of saline caused the cells to become much more rounded than the cells of control plants and led to an obvious accumulation of chloroplasts in the cells (Figs. 1L–1S). Levels of both chlorophyll a and chlorophyll b increased moderately when plants were exposed to 200 mm NaCl and then decreased marginally with increasing NaCl concentrations (Fig. 3A), indicating that the somewhat enhanced photosynthesis might be a new salt-adaptation mechanism in salinity-acclimated plants. It is also noteworthy that many more starch grains accumulated in the chloroplasts of salt-treated cells than in the cells of plants grown under normal conditions (Figs. 1L–1S; Fig. 8). Accordingly, the starch content increased with increasing concentrations of NaCl (Fig. 3C). After salt stress, the accumulated starch can be transformed into sucrose, which is probably a consequence of a significantly up-regulated expression of the gene encoding amylase (supplemental Data S7), an enzyme involved in the degradation of starch to sucrose under stress conditions. In addition to amylase, many other enzymes involved in starch and sucrose metabolism were up-regulated by the saline environments at the gene (supplemental Data S7 and S8) and protein levels (Table I; supplemental Data S3). The up-regulated enzymes include UTP-glucose-1-phosphate uridylyltransferase (EC 2.7.7.9; S89, gi 116787113), UDP-forming cellulose synthase (EC 2.4.1.12), phosphorylase (EC 2.4.1.1), glucanotransferase (EC 2.4.1.25; S28, gi 2623298), glucan 1,3-beta-glucosidase (EC 3.2.1.58), and many enzymes involved in the glycolytic pathway. In particular, the abundance of an isoform of fructose-bisphosphate aldolase (gi 15228194) was enhanced in response to salinity. This enzyme (EC 4.1.2.13) catalyzes a key regulatory step in glycolysis. Notably, many sugar-metabolism-related genes and enzymes involved in glycolysis were also up-regulated in the leaves of salt-treated Thellungiella plants (Fig. 8). We observed a dramatic accumulation of total soluble sugars in cells subjected to salinity stress (Figs. 3D and 8). Conversely, many photosynthesis-related genes and enzymes were dramatically induced under more moderate salinity conditions (Table I; supplemental Data S7). Our comparative proteomics identified 64 proteins (30.62% of the total) as chloroplast proteins (Table I; Fig. 5C). Among them, 10 enzymes representing 25 spots (Table I; Fig. 3) participate in carbon fixation. Given the identified proteins, the TCA cycle should also be activated to produce much more energy for saline tolerance. Future work will involve the identification of these starch- and sugar-metabolism-related enzymes and determination of their biological functions.
Supplementary Material
Acknowledgments
We thank Prof. Jidong Feng for protein identification and Dr. Dong Zheng for x-ray microanalysis. We particularly thank Prof. Weimin Tian, Prof. Yuxian Zhu, and Prof. Yongmei Qin for their critical reading and helpful suggestions on this article. We also thank in particular Prof. Yun-Judy Zhu of the Hawaii Agriculture Research Center, University of Hawaii, for polishing the language in this article. We also thank very much Dr. Timothy C. Taylor from BiomEditor International Bioscience Consultants in the United States for extensive revision of this article.
Footnotes
* This research was supported by the National Basic Research Program (973) of China (Grant No. 2010CB12660–2,-5), the National Natural Science Foundation (Grant No. 31000291), and the Program for the Top Young Talents in Chinese Academy of Tropical Agricultural Sciences (Grant No. ITBB130102).
 This article contains supplemental material.
1 The abbreviations used are:
- 2-DE
- two-dimensional electrophoresis
- COG
- cluster of orthologous groups
- CPS
- counts per second
- DW
- dry weight
- FW
- fresh weight
- GO
- gene ontology
- Mr
- molecular weight
- MS
- mass spectrometry
- P5CD
- 1-pyrroline-5-carboxylate dehydrogenase
- pI
- isoelectric point
- qRT-PCR
- quantitative real-time transcription polymerase chain reaction
- ROS
- reactive oxygen species
- S.D.
- standard deviation
- SEM
- scanning electron microscopy
- SOS
- salt overly sensitive
- TCA
- tricarboxylic acid
- TEM
- transmission electron microscopy
- TWC
- total water content.
REFERENCES
- 1. Borsani O., Valpuesta V., Botella M. A. (2001) Evidence for a role of salicylic acid in the oxidative damage generated by NaCl and osmotic stress in Arabidopsis seedlings. Plant Physiol. 126, 1024–1030 [DOI] [PMC free article] [PubMed] [Google Scholar]
- 2. Inan G., Zhang Q., Li P., Wang Z., Cao Z., Zhang H., Zhang C., Quist T. M., Goodwin S. M., Zhu J., Shi H., Damsz B., Charbaji T., Gong Q., Ma S., Fredricksen M., Galbraith D. W., Jenks M. A., Rhodes D., Hasegawa P. M., Bohnert H. J., Joly R. J., Bressan R. A., Zhu J. K. (2004) Salt cress, a halophyte and cryophyte Arabidopsis relative model system and its applicability to molecular genetic analyses of growth and development of extremophiles. Plant Physiol. 135, 1718–1737 [DOI] [PMC free article] [PubMed] [Google Scholar]
- 3. Stepien P., Johnson G. N. (2009) Contrasting responses of photosynthesis to salt stress in the glycophyte Arabidopsis and the halophyte Thellungiella: role of the plastid terminal oxidase as an alternative electron sink. Plant Physiol. 149, 1154–1165 [DOI] [PMC free article] [PubMed] [Google Scholar]
- 4. Zhang H. X., Blumwald E. (2001) Transgenic salt-tolerant tomato plants accumulate salt in foliage but not in fruit. Nat. Biotechnol. 19, 765–768 [DOI] [PubMed] [Google Scholar]
- 5. Volkov V., Amtmann A. (2006) Thellungiella halophila, a salt-tolerant relative of Arabidopsis thaliana, has specific root ion-channel features supporting K+/Na+ homeostasis under salinity stress. Plant J. 48, 342–353 [DOI] [PubMed] [Google Scholar]
- 6. Zhu J. K. (2001) Plant salt tolerance. Trends Plant Sci. 6, 66–71 [DOI] [PubMed] [Google Scholar]
- 7. Flowers T. J. (2004) Improving crop salt tolerance. J. Exp. Bot. 55, 307–319 [DOI] [PubMed] [Google Scholar]
- 8. Sahi. C., Singh A., Blumwald E., Grover A. (2006) Beyond osmolytes and transporters: novel plant salt-stress tolerance-related genes from transcriptional profiling data. Physiol. Plant. 127, 1–9 [Google Scholar]
- 9. Pang Q. Y., Chen S. X., Dai S. J., Chen Y. Z., Wang Y., Yan X. F. (2010) Comparative proteomics of salt tolerance in Arabidopsis thaliana and Thellungiella halophila. J. Proteome Res. 9, 2584–2599 [DOI] [PubMed] [Google Scholar]
- 10. Dassanayake M., Oh D. H., Haas J. S., Hernandez A., Hong H., Ali S., Yun D. J., Bressan R. A., Zhu J. K., Bohnert H. J., Cheeseman J. M. (2011) The genome of the extremophile crucifer Thellungiella parvula. Nat. Genet. 43, 913–920 [DOI] [PMC free article] [PubMed] [Google Scholar]
- 11. Bressan R. A., Zhang X. Q., Zhang H., Hasegawa P. M., Bohnert H. J., Zhu J. K. (2001) Learning from the Arabidopsis experience. The next gene search paradigm. Plant Physiol. 127, 1354–1360 [PMC free article] [PubMed] [Google Scholar]
- 12. Taji T., Komatsu K., Katori T., Kawasaki Y., Sakata Y., Tanaka S., Kobayashi M., Toyoda A., Seki M., Shinozaki K. (2010) Comparative genomic analysis of 1047 completely sequenced cDNAs from an Arabidopsis-related model halophyte, Thellungiella halophila. BMC Plant Biol. 10, 261. [DOI] [PMC free article] [PubMed] [Google Scholar]
- 13. Ghars M. A., Parre E., Debez A., Bordenave M., Richard L., Leport L., Bouchereau A., Savoure A., Abdelly C. (2008) Comparative salt tolerance analysis between Arabidopsis thaliana and Thellungiella halophila, with special emphasis on K+/Na+ selectivity and proline accumulation. J. Plant Physiol. 165, 588–599 [DOI] [PubMed] [Google Scholar]
- 14. Ghars M. A., Richard L., Vos D. L., Leprince A. S., Parre E., Bordenave M., Abdelly C., Savoure A. (2012) Phospholipases C and D modulate proline accumulation in Thellungiella halophila/salsuginea differently according to the severity of salt or hyperosmotic stress. Plant Cell Physiol. 53, 183–192 [DOI] [PubMed] [Google Scholar]
- 15. Oh D. H., Dassanayake M., Haas J. S., Kropornika A., Wright C., d'Urzo M. P., Hong H., Ali S., Hernandez A., Lambert G. M., Inan G., Galbraith D. W., Bressan R. A., Yun D. J., Zhu J. K., Cheeseman J. M., Bohnert H. J. (2010) Genome structures and halophyte-specific gene expression of the extremophile Thellungiella parvula in comparison with Thellungiella salsuginea (Thellungiella halophila) and Arabidopsis. Plant Physiol. 154, 1040–1052 [DOI] [PMC free article] [PubMed] [Google Scholar]
- 16. Gao F., Zhou Y. J., Huang L. Y., He D. C., Zhang G. F. (2008) Proteomic analysis of long-term salinity stress responsive proteins in Thellungiella halophila leaves. Chin. Sci. Bull. 53, 3530–3537 [Google Scholar]
- 17. Gao F., Zhou Y. J., Zhu W. P., Li X. F., Fan L. M., Zhang G. F. (2009) Proteomic analysis of cold stress-responsive proteins in Thellungiella rosette leaves. Planta 230, 1033–1046 [DOI] [PubMed] [Google Scholar]
- 18. Zhou Y. J., Gao F., Li X. F., Zhang J., Zhang G. F. (2010) Alterations in phosphoproteome under salt stress in Thellungiella roots. Chin. Sci. Bull. 55, 3673–3679 [Google Scholar]
- 19. Wang X. C., Li X. F., Deng X., Han H. P., Shi W. L., Li Y. X. (2007) A protein extraction method compatible with proteomic analysis for the euhalophyte. Salicornia europaea. Electrophoresis 28, 3976–3987 [DOI] [PubMed] [Google Scholar]
- 20. Wang X. C., Fan P. X., Song H. M., Chen X. Y., Li X. F., Li Y. X. (2009) Comparative proteomic analysis of differentially expressed proteins in shoots of Salicornia europaea under different salinity. J. Proteome Res. 8, 3331–3345 [DOI] [PubMed] [Google Scholar]
- 21. Wang X. C., Wang D. Y., Wang D., Wang H. Y., Chang L. L., Yi X. P., Peng M., Guo A. P. (2012) Systematic comparison of technical details in CBB methods and development of a sensitive GAP stain for comparative proteomic analysis. Electrophoresis 33, 296–306 [DOI] [PubMed] [Google Scholar]
- 22. Tian W. M., Peng S. Q., Wang X. C., Shi M. J., Chen Y. Y., Hu Z. H. (2007) Vegetative storage protein in litchi chinensis, a subtropical evergreen fruit tree, possesses trypsin inhibitor activity. Ann. Bot. 100, 1119–1208 [DOI] [PMC free article] [PubMed] [Google Scholar]
- 23. Zhang X., Zhang L., Dong F., Gao J. F., Galbraith D. W., Song C. P. (2001) Hydrogen peroxide is involved in abscisic acid-induced stomatal closure in. Vicia faba. Plant Physiol. 126, 1438–1448 [DOI] [PMC free article] [PubMed] [Google Scholar]
- 24. Peng Y. H., Zhu Y. F., Mao Y. Q., Wang S. M., Su W. A., Tang Z. C. (2004) Alkali grass resists salt stress through high K+ and an endodermis barrier to Na+. J. Exp. Bot. 55, 939–949 [DOI] [PubMed] [Google Scholar]
- 25. Taji T., Seki M., Satou M., Sakurai T., Kobayashi M., Ishiyama K., Narusaka Y., Narusaka M., Zhu J. K., Shinozaki K. (2004) Comparative genomics in salt tolerance between Arabidopsis and Arabidopsis-related halophyte salt cress using Arabidopsis microarray. Plant Physiol. 135, 1697–1709 [DOI] [PMC free article] [PubMed] [Google Scholar]
- 26. Gong Q. Q., Li P. H., Ma S. S., Rupassara S. I., Bohnert H. J. (2005) Salinity stress adaptation competence in the extremophile Thellungiella halophila in comparison with its relative Arabidopsis thaliana. Plant J. 44, 826–839 [DOI] [PubMed] [Google Scholar]
- 27. Wang X. C., Tian W. M., Li Y. X. (2008) Development of an efficient protocol of RNA isolation from recalcitrant tree tissues. Mol. Biotechnol. 38, 57–64 [DOI] [PubMed] [Google Scholar]
- 28. Conesa A., Gotz S. (2008) Blast2GO: a comprehensive suite for functional analysis in plant genomics. Int. J. Plant Genomics 2008, 619832. [DOI] [PMC free article] [PubMed] [Google Scholar]
- 29. Vera-Estrella R., Barkla B. J., Ramirez L. G., Pantoja O. (2005) Salt stress in Thellungiella halophila activates Na+ transport mechanisms required for salinity tolerance. Plant Physiol. 139, 1507–1517 [DOI] [PMC free article] [PubMed] [Google Scholar]
- 30. Mrah S., Ouerghi Z., Berthomieu C., Havaux M., Jungas C., Hajji M., Grignon C., Lachaal M. (2006) Effects of NaCl on the growth, ion accumulation and photosynthetic parameters of Thellungiella halophila. J. Plant Physiol. 163, 1022–1031 [DOI] [PubMed] [Google Scholar]
- 31. Kant S., Kant R., Raveh E., Barak S. (2006) Evidence that differential gene expression between the halophyte, Thellungiella halophila, and Arabidopsis thaliana is responsible for higher levels of the compatible osmolyte proline and tight control of Na+ uptake in T. halophila. Plant Cell Environ. 29, 1220–1234 [DOI] [PubMed] [Google Scholar]
- 32. Kant S., Bi Y. M., Weretilnyk E., Barak S., Rothstein S. J. (2008) The Arabidopsis halophytic relative Thellungiella halophila tolerates nitrogen-limiting conditions by maintaining growth, nitrogen uptake, and assimilation. Plant Physiol. 147, 1168–1180 [DOI] [PMC free article] [PubMed] [Google Scholar]
- 33. Zhang S. J., Li N., Gao F., Yang A. F., Zhang J. R. (2010) Over-expression of TsCBF1 gene confers improved drought tolerance in transgenic maize. Mol. Breed. 26, 455–465 [Google Scholar]
- 34. Zhao K. F., Fan H., Zhou S., Song J. (2003) Study on the salt and drought tolerance of Suaeda salsa and Kalanchoe claigremontiana under iso-osmotic salt and water stress. Plant Sci. 165, 837–844 [Google Scholar]
- 35. Bartels D., Sunkar R. (2005) Drought and salt tolerance in plants. Crit. Rev. Plant Sci. 24, 23–58 [Google Scholar]
- 36. Moller I. S., Tester M. (2007) Salinity tolerance of Arabidopsis, a good model for cereals? Trends Plant Sci. 12, 534–540 [DOI] [PubMed] [Google Scholar]
- 37. Ottow E. A., Brinker M., Teichmann T., Fritz E., Kaiser W., Brosche M., Kangasjarvi J., Jiang X. N., Polle A. (2005) Populus euphratica displays apoplastic sodium accumulation, osmotic adjustment by decreases in calcium and soluble carbohydrates, and develops leaf succulence under salt stress. Plant Physiol. 139, 1762–1772 [DOI] [PMC free article] [PubMed] [Google Scholar]
- 38. Niu X. M., Bressan R. A., Hasegawa P. M., Pardo J. M. (1995) Ion homeostasis in NaCl stress environments. Plant Physiol. 109, 735–742 [DOI] [PMC free article] [PubMed] [Google Scholar]
- 39. Apse M. P., Aharon G. S., Snedden W. A., Blumwald E. (1999) Salt tolerance conferred by overexpression of a vacuolar Na+/H+ antiport in Arabidopsis. Science 285, 1256–1258 [DOI] [PubMed] [Google Scholar]
- 40. Hasegawa P. M., Bressan R. A. (2000) Plant cellular and molecular responses to high salinity. Ann. Rev. Plant Physiol. 51, 463–499 [DOI] [PubMed] [Google Scholar]
- 41. Blumwald E. (2000) Sodium transport and salt tolerance in plants. Curr. Opin. Cell Biol. 12, 431–434 [DOI] [PubMed] [Google Scholar]
- 42. Lv S. L., Zhang K. W., Gao Q., Lian L. J., Song Y. J., Zhang J. R. (2008) Overexpression of an H+-PPase gene from Thellungiella halophila in cotton enhances salt tolerance and improves growth and photosynthetic performance. Plant Cell Physiol. 49, 1150–1164 [DOI] [PubMed] [Google Scholar]
- 43. Vinocur B., Altman A. (2005) Recent advances in engineering plant tolerance to abiotic stress: achievements and limitations. Curr. Opin. Biotechnol. 16, 123–132 [DOI] [PubMed] [Google Scholar]
- 44. Wingler A., Purdy S., MacLean J. A., Pourtau N. (2006) The role of sugars in integrating environmental signals during the regulation of leaf senescence. J. Exp. Bot. 57, 391–399 [DOI] [PubMed] [Google Scholar]
- 45. Wong C. E., Li Y., Whitty B. R., Diaz-Camino C., Akhter S. R., Brandle J. E., Golding G. B., Weretilnyk E. A., Moffatt B. A., Griffith M. (2005) Expressed sequence tags from the Yukon ecotype of Thellungiella reveal that gene expression in response to cold, drought and salinity shows little overlap. Plant Mol. Biol. 58, 561–574 [DOI] [PubMed] [Google Scholar]
- 46. Tester M., Davenport R. (2003) Na+ tolerance and Na+ transport in higher plants. Ann. Bot. 91, 503–527 [DOI] [PMC free article] [PubMed] [Google Scholar]
- 47. Askari H., Edqvist J., Hajheidari M., Kafi M., Salekdeh G. H. (2006) Effects of salinity levels on proteome of Suaeda aegyptiaca leaves. Proteomics 6, 2542–2554 [DOI] [PubMed] [Google Scholar]
- 48. Agarie S., Shimoda T., Shimizu Y., Baumann K., Sunagawa H., Kondo A., Ueno O., Nakahara T., Nose A., Cushman J. C. (2001) Salt tolerance, salt accumulation, and ionic homeostasis in an epidermal bladder-cell-less mutant of the common ice plant Mesembryanthemum crystallinum. J. Exp. Bot. 58, 1957–1967 [DOI] [PubMed] [Google Scholar]
- 49. Maathuis F. M., Amtmann A. (1999) K+ nutrition and Na+ toxicity, the basis of cellular K+/Na+ ratios. Ann. Bot. 84, 123–133 [Google Scholar]
Associated Data
This section collects any data citations, data availability statements, or supplementary materials included in this article.